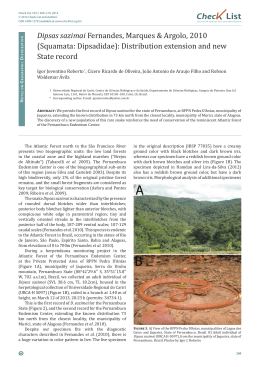
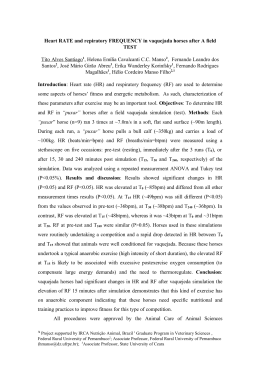
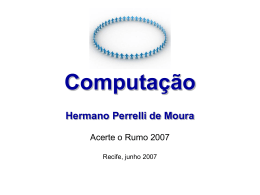
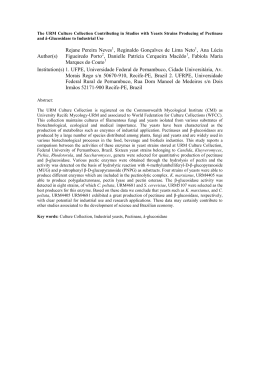
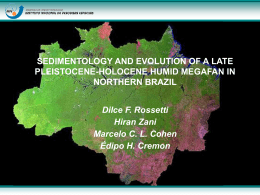
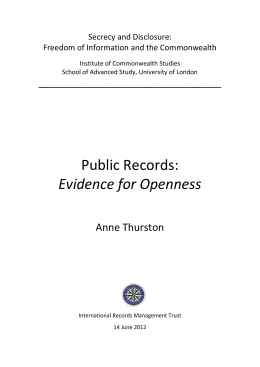
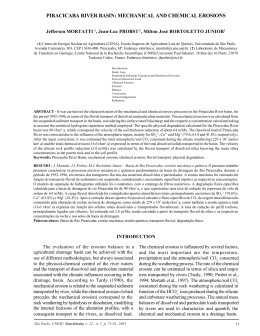
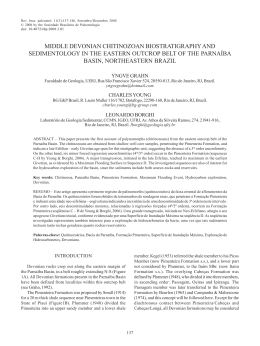
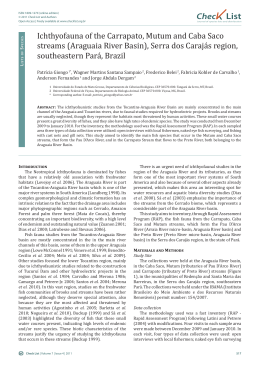
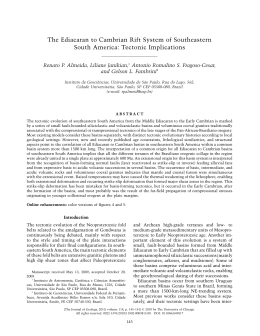
APPLICATION OF THE HACK INDEX
– OR STREAM LENGTH-GRADIENT INDEX (SL INDEX) –
TO THE TRACUNHAÉM RIVER WATERSHED,
PERNAMBUCO, BRAZIL
Kleython de Araújo MONTEIRO 1, Ronaldo MISSURA 1,
Antonio Carlos de Barros CORREA 2
(1) Programa de Pós-graduação em Geografia da Universidade Federal de Pernambuco. Avenida Acadêmico
Hélio Ramos, S/N 6º andar – Cidade Universitária. CEP 50670-901. Recife, PE.
E-mails: [email protected]; [email protected]
(2) Departamento de Ciências Geográficas da Universidade Federal de Pernambuco. Avenida Acadêmico Hélio Ramos,
S/N 6º andar – Cidade Universitária. CEP 50670-901. Recife, PE. E-mail: [email protected]
Introduction
Characterization of the Area
Methods and Discussion
Final Considerations
Bibliographic References
ABSTRACT – For a long time geomorphology has made use of morphological analysis for the study of evolution and interpretation of
landforms. In this context, Empirical methods were the major source for the understanding of morphogenetic processes. Notwithstanding,
several physical and mathematical methods were envisaged and applied by many authors, mainly after the 1950’s decade. Among such
methods one was put forward by Hack (1957, 1973) known as Stream Length-Gradient Index (SL Index). In Brazil this method is also
referred to as the relation between slope angle and channel extension index (RDE). In this research, this index was applied to the watershed
of the Tracunhaem River, one of the coastal drainages of the State of Pernambuco, Northeastern Brazil. The index was applied along the
channel of the two most important rivers within the watershed: the Tracunhaem and the Orobó. The data used on the construction of
the DTM (Digital Terrain Model) of the basin were obtained from the SB-25-Y-C chart, and the SRTM project, compatible to a
1:250.000 scale. Following, an interpolating method was applied in order to generate the contour lines with 50 m intervals. A drainage
raster file was created, compatible with larger numerical scales (1:100.000 e 1:25.000). After, the morphometric index was applied to
the channel within reaches limited by the 20 m contour intervals, which generated a spreadsheet with numerical data that later were
used to build graphs and charts demonstrating the existence of anomalous zones along the stream channel. Based on the application of
this method it was possible to identify the regional knick-point of the basin. Finally the index was correlated to other spatial
information, such as geology. This has enabled the interpretation that no major lithological control was particularly connected to the
existence of the stream knick-point, which by itself suggests that the retreating escarpment shall be a morphological response to other
processes such as faulting or continental margin flexure.
Keywords: morphometric indexes, drainage basin, Borborema highlands piedmont, Pernambuco, Brazil.
RESUMO – K. de A. Monteiro, R. Missura, A.C. de B. Corrêa - Aplicação do Índice de Hack – ou Relação Declividade-Extensão
(RDE) – na Bacia do Rio Tracunhaém, Pernambuco, Brasil. Por muito tempo a Geomorfologia tem feito uso da análise morfológica para
o estudo da evolução e interpretação do relevo. Neste contexto, os métodos empíricos foram a principal fonte para a compreensão dos
processos morfogenéticos. Não obstante, vários métodos físicos e matemáticos foram desenvolvidos e aplicados por inúmeros autores,
principalmente após a década de 1950. Entre esses métodos, um foi apresentado por Hack (1957, 1973), conhecido como Stream-Length
Gradient Index (SL Index). No Brasil, este método também é conhecido como Relação Declividade-Extensão (RDE). Na presente
pesquisa, este índice foi aplicado na bacia do Rio Tracunhaém, uma das bacias costeiras do Estado de Pernambuco, Nordeste do Brasil.
O índice foi aplicado ao longo dos canais dos rios mais importantes dentro da bacia hidrográfica: o Tracunhaém e o Orobó. Os dados
utilizados na construção do MDT (Modelo Digital de Terreno) da bacia foram obtidos a partir do recorte SB-25-Y-C do projeto SRTM,
compatível com a escala de 1:250.000. Em seguida, foi aplicado um método de interpolação a fim de gerar curvas de nível com intervalos
de 50 m. Um arquivo raster de drenagem foi criado, compatível com escalas maiores (1:100.000 e 1:25.000). Posteriormente, o índice
morfométrico foi aplicado ao canal dentro de intervalos altimétricos limitados por curvas de nível de 20 m, gerando uma planilha com
dados numéricos que foram usados na construção de gráficos e tabelas que demonstram a existência de zonas anômalas ao longo do canal.
Com base na aplicação deste método foi possível identificar o knickpoint regional da bacia. Por fim, o índice foi correlacionado com outras
informações espaciais, tais como a geologia da bacia. Esta ação permitiu a interpretação de que não há um controle litológico que leve à
geração de um knickpoint nesta porção da drenagem, o que sugere que a regressão da escarpa deve estar de acordo com a resposta
morfológica a outros processos, tais como zonas de falha ou a flexura da borda continental.
Palavras-chave: índices morfométricos, bacia de drenagem, Planalto da Borborema, Pernambuco, Brasil.
São Paulo, UNESP, Geociências, v. 29, n. 4, p. 533-539, 2010
533
INTRODUCTION
The geomorphological sciences, which search the
understanding of the landforms, their genesis and
evolution, have incorporated the application of several
morphometric indexes, in automatized bases, to the
analysis of spatial patterns that would allow the
inference of structural, lithological and climatic controls
on the morphogenesis. Many of these methods are well
established in geomorphology, but they have become
much more useful and applicable after the introduction
of digital processing techniques. Among such methods
one should mention the Hack Index, or SL index, which
was initially proposed in 1957 (Hack, 1957, 1973).
The morphological analysis was for a long time
the most used method for the analysis and interpretation
of the landforms. Although it first appeared as a
byproduct of the Theory of Geographical Cycle of Davis
(1899), it was not fully developed until the mid 20th
century, when diverse interpretations in similar deductive
bases were proposed. Moreover, the regional set of
landforms offered an approximation of how long the
relief had been exposed to the atmosphere and how
landforms had developed.
However, even before Davis, Gilbert (1877)
supported the idea that the landscape analysis should
also consider the understanding of three essential
factors: materials (rocks and sediments), processes
(endogenous or exogenous) and landforms. The
interaction of these factors would ultimately generate
the physical landscape of the Earth surface.
Starting in the 1960’s decade, with a growing
application of the systems approach within
Geomorphology, the concept of cyclic evolution of the
landscape was replaced by more process oriented
analysis that focused on the surface dynamics as a
key to the understanding of landform development. This
new approach coupled with the growing usage of a
mathematical framework led to a large number of
efforts towards understanding the landforms by means
of the natural processes acting on them, which could
be visualized and measured through the use of
mathematic language and physical laws.
One of such attempts can be exemplified by Hack
(1973) proposal to determine whether a river would be
in geomorphological equilibrium based upon the
relationship between the river slope and the areal extent
of the watershed. This relationship was named by Hack
(1973) as the Stream Lenght-Gradient Index (SL
Index). In Brazil, it is also known as the Slope-Extension
relationship (Etchebehere et al., 2006).
According to the original proposition, the
application of this index would allow the identification
of stream sections considered to be “anomalous”. The
index would be larger or smaller as the stream cut
through diverse lithology and structure, displaying
different resistances to erosion. In the occurrence of a
homogeneous lithological substrate, the anomaly would
then be interpreted as related to tectonic movements
which would necessarily be younger than the
implantation of the drainage network.
This method has been used to validate assumptions
of differential erosion, as well as the occurrence of
lithological and structural controls. It also became an
important tool in the identification of neotectonic
deformation along the stream channel network
(Etchebehere et al., 2006; Missura, 2005; Monteiro,
2010). According to the above, the present paper tried
to identify anomalous zones within the Tracunhaem
River Basin, which is the main tributary of the Goiana
River, situated in the Northern coastal zone of the state
of Pernambuco.
CHARACTERIZATION OF THE AREA
The watershed of the Tracunhaén River, is a subbasin of the Goiana River basin. This basin is located
in the northeastern portion of the State of Pernambuco,
Brazil. The basin has an area of approximately 1300
km2 and more than 80 km in length from the heads of
the Tracunhaém River until its merging with the
Capibaribe-Mirim River, when both join forming the
Goiana River (Figure 1).
The regional geological-geomorphological
framework of this area can be characterized as the
passive margin of a flexured platform, structured in
Precambrian rocks, more commonly gneisses, migmatites
and granites. Many fault structures dated to the
Precambrian command the trend of escarpments and
534
spatial distribution of residual landforms in the area, these
fault lines were reactivated in the Cenozoic following
the Gondwana breakup (Brito Neves et al., 2001).
Morphologically, this sector of the Northeastern
bulge of Brazil, where the study area is located,
presents a step-like topography from the coastal plains
up to the rocky summits of the Borborema Highlands.
These step-like surfaces were previously interpreted
as planation surfaces as a consequence of the
application of the cyclic landscape forming rationale,
specially Lester King’s postulates (King,1952). In the
studied basin, two main landscape compartments are
found, being neatly differentiated in althimetric sectors
separated by a marked knick-point (Figure 2).
São Paulo, UNESP, Geociências, v. 29, n. 4, p. 533-539, 2010
FIGURE 1. The Tracunhaém River Basin.
FIGURE 2. The 200 m contour line is neatly separating both compartments.
São Paulo, UNESP, Geociências, v. 29, n. 4, p. 533-539, 2010
535
The first compartment is found in the upper
portion of the river, its summit surfaces occur at
elevations above 400 m. This sector is also drained
by the Orobó River which becomes a tributary of the
Tracunhaem at a lower topographic level. However,
the Orobó river runs on a lower topographic
compartment, mostly below the 200 m contour line
(Figure 2).
METHODS AND DISCUSSION
The SL Index was applied to this work, as
proposed by Hack (1973) and used by other authors
(Troiani and Della Seta, 2007, Etchebehere et al., 2004,
2006; Missura, 2005, Monteiro, 2010), aiming at the
identification of morphometric anomalies along the
longitudinal profile of the stream and its correlation with
controlling factors as lithology and tectonics of the area.
The identified anomalies may lead to the understanding
of the main morphological discontinuities within the
basin, allowing their correlation with lithological as well
as structural controls.
The method consists in the application of the
following formula:
SL = (∆h/∆l).L
being SL, the Stream-Lenght index, ∆h the difference
between the highest and the lowest points of a given
section of the channel, ∆l the horizontal projection of the
studied section and L, the length of the farthest point of
the studied section to the headwaters of the basin, in a
straight line. In order to calculate the SLtotal, one shall
divide ∆h total of the drainage by the logarithm of L.
This model may be better visualized in the scheme
below (Figure 3).
FIGURE 3. A scheme showing the calculation
of the SL index (from Etchebehere et al., 2006 ).
536
In relation to the anomalous indexes of drainage,
Seeber and Gornitz (1983) regard as anomalous, the
SLsection divided by the SLtotal. When the result
obtained is less than 2 (two) there are no anomalies.
When the result is between 2 (two) and 10 (ten) a 2nd
order anomaly is defined. When the result is equal to
or exceeds 10 (ten) a 1st order anomaly is defined.
This classification implies that where first order
anomalies are found, stream channels are very steep,
second-order anomalies occur in sectors where stream
channels are simply “steep” and when the index is less
than two (2) stream channel sectors are “not steep”
and the longitudinal profile is said to be graded.
In this paper, the index was applied to the length
of the first section of the main channel of the
Tracunhaém river and in the Orobó river, its main
tributary. Being the longitudinal length of the basin lower
than 100 km, it was impossible to apply the index to a
larger number of tributaries, since very few of them
reached a minimum of 10 km in length which was the
lower limit for the application of the technique given
the cartographic scale used (1:250.000)
The data used for the construction of the DEM
derived from a section of the SB-25-Y-C chart
combined with the SRTM Project in a scale of
1:250,000. Later on, an interpolating method was used
to generate contour lines at 20 m intervals, considering
that this contour interval would be more appropriate
for the scale used. A raster file of the drainage network
was also generated, compatible with larger scales
(1:100,000 e 1:25,000).
Afterwards, the index was applied to the channel
in sections were limited by each 20 m contour line,
generating a spreadsheet with values, which generated
graphs showing the profile of the channel, the values
of the SL index, and the identification of the anomalous
zones. The graphs and the identified sections with
anomalous values are shown in Graphs 1, 2 and 3,
respectively.
Starting from the application of the proposed
methodology, the SL indexes were obtained for the
main channel of the Tracunhaém river and for its major
tributary, the Orobó river. With the generation of the
table of values and the graphs shown below, it was
possible to identify anomalous sections along the entire
channel. These data showed that there is an area along
São Paulo, UNESP, Geociências, v. 29, n. 4, p. 533-539, 2010
Graph 1. SL Index of the main channel. Note the anomalous value found
in the fourth section of the channel, between 200 and 250 m contour lines.
Graph 2. Longitudinal profile of the main channel and the trend line. See that the knickpoint
becomes noticeable starting in the fourth section, from where depositional processes become dominant.
Graph 3. SL Index of the Rio Orobó. Note the anomalous values occuring
at the same contour line intervals (250 – 200 m a.s.l.).
São Paulo, UNESP, Geociências, v. 29, n. 4, p. 533-539, 2010
537
the channel that can be identified as the regional
knickpoint, downstream from where depositional
processes become dominant (Figure 4).
Another relevant information highlighted by the
use of the SL Index was the indication that the
occurrence area of anomalies is located along the
escarpment line. Overlaying the spatial distribution of
the index to the lithological map of the area (Figure 4)
no lithological variations were found which could justify
the existence of rock controls on the escarpment (zone
of anomaly concentration), that finding suggests that
the escarpment could have been generated by faulting
or even by continental margin flexure, a process that is
supported by many authors, such as Brito Neves et al.
(2001) for the sub-littoral zone of the Northeastern
bulge of Brazil.
FIGURE 4. MY1a –Metaplutonic rocks (Mesoproterozoic): Biotite-Amphibol Augengneisses and Ortogneisses;
Mve - Vertentes Complex (Mesoproterozoic): Biotite Schists, Paragneisses; NY3sh – Magmatic suites (Neoproterozoic):
Amphibol-Quartz Syenites, Syenites and Quartz Monzonites; Nsu - Surubim Complex (Neoproterozoic): Biotite Gneisses,
Granate Biotite Gneisses; PY9 – Intrussive Metagranitoids - Ortogneisses (Paleoproterozoic); Pgm1 – Indiscriminated
Gneissic-Migmatitic Complexes (Paleoproterozoic), the more homogenous unit; Pgm2 – Indiscriminated GneissicMigmatitic Complexes (Paleoproterozoic), the most migmatized unit; Qha -(Cenozoic - Quaternary): alluvial sediments;
Qi - (Cenozoic - Quaternary): sands, silts, clays, of fluvio-lacustrine origin, sands of littoral ridges, Recent and Present,
of manglars and sandy eluvial cover; Tb – Barreiras Group (Cenozoic - Tertiary). Note that there is not a variation
in rock hardness in the contour line closest to the anomalous zone, which may justify the calculated values,
considering that this sector is dominated by metamorphic rocks of similar hardness.
FINAL CONSIDERATIONS
Morphometric methods, mathematical indexes
and statistical analyses became widely used since the
rising of geomorphology as an academic science that
was interested in finding the existence of geographical
538
controlling factors by means of application of logical
concepts and mathematical modeling. This conceptual
concern prompted the emergence of indexes such as
those proposed by Hack (1957; 1973), e.g. relief
São Paulo, UNESP, Geociências, v. 29, n. 4, p. 533-539, 2010
undercutting, rugosity, and drainage density, among
many others. These methods, however, were frequently
used with poor criteria and in, certain circumstances,
they were presented without any further interpretation,
as if they could speak by themselves.
These procedures, however, allow to an enhanced
geomorphological analysis when correlations are made,
not only with other areas but also with other data in the
same area. The greatest difficulties for the application
and comparison of the morphometric indexes applied in
this work are found when one tries to build correlations
with other works, specially because most of the literature
deals with mobile belt settings or areas of steep
continental escarpments (Troiani and Della Seta, 2007).
In mobile belts, the anomalies are related to deformational
compressive stress or lithological variations within folded
zones, as it occurs with the Appalachians. However, in
platform areas, the very few available investigations point
to correlations with the geological substratum or with
post-orogenic, neotectonic stress.
In the case of the studied area, the identified
discontinuities among topographical levels were
traditionally interpreted as derived from erosional cycles
and not due to the action of tectonics. The differentiation
between erosion processes at the escarpment
indentations and erosion in the fault scarp becomes
difficult with empirical, field observation methods solely,
being therefore necessary to use models as the one
applied in this paper and the correlation with other data
sources, such as geological and/or geophysical, in
addition to the recent utilization of Geochronology as
an associated parameter in the understanding of the
regional morphogenesis. In this regard, works like those
of Lima (2008) bring, among other conclusions, that
there is no robust relationship between topographic
elevation and age of weathering profiles in the
Borborema Geological Province. Such findings point
to the difficulties in directly associating the step-like
landforms with classical models of cyclic retreat of
the escarpments.
BIBLIOGRAPHIC REFERENCES
1.
BRITO NEVES, B.B.; SCHMUS, W.R.V.; FETTER, A.
Noroeste África-Nordeste do Brasil (Província Borborema).
Ensaio comparativo e Problemas de Correlação. Revista do
Instituto de Geociências USP, v. 1, n. 1, p. 59-78, 2001.
2. DAVIS, W.M. The geographical cycle. Geographical Journal,
v. 15, n. 5, p. 481-504, 1899.
3. ETCHEBEHERE, M.L.C.; SAAD, A.R.; PERINOTTO,
J.A.J.; FULFARO, V.J. Aplicação do Índice “Relação
Declividade-Extensão - RDE” na Bacia do Rio do Peixe (SP)
para detecção de deformações neotectônicas. Revista do
Instituto de Geociências USP, Série Científica, São Paulo,
v. 4, n. 2, p. 43-56, 2004.
4. ETCHEBEHERE, M. L.C.; SAAD, A.R.; SANTONI, G.C.;
CASADO, F.C.; FULFARO, V.J. Detecção de prováveis
deformações neotectônicas no vale do Rio do Peixe, região
ocidental paulista mediante aplicação de índices RDE (Relação
Declividade-Extensão) em segmentos de drenagem.
Geociências, v. 25, p. 271-289, 2006.
5. GILBERT, G.K. Report on the geology of the Henry
Mountains (Utah, U.S.A.). U.S. Geographical and Geological
Survey of the Rocky Mountain Region (Powell), 160 p., 1877.
6. HACK, J.T. Studies of longitudinal stream profiles in Virginia
and Maryland. U.S. Geol. Survey, Profissional Paper 294,
p. 45-97, 1957.
7. HACK, J.T. Stream-profile analysis and stream-gradient
index: U.S. Geological Survey. Journal Research, v. 1, n. 4,
p. 421-429, 1973.
8. KING, L.C. Morphology of the Earth. Edinburgh: Oliver,
699 p., 1967.
9. LIMA, M.G. A História do Intemperismo na Província
Borborema Oriental, Nordeste do Brasil: Implicações
Paleoclimáticas e Tectônicas. Natal, 2008, 461 p. Tese
(Doutorado) – Universidade Federal do Rio Grande do Norte.
Unpublished.
10. MISSURA, R. Análise morfoestratigráfica da Bacia do
Ribeirão dos Poncianos/MG. Rio Claro, 2005. 136 p. Tese
(Mestrado) – Universidade Estadual Paulista. Unpublished.
São Paulo, UNESP, Geociências, v. 29, n. 4, p. 533-539, 2010
11. MONTEIRO, K.A. Superfícies de aplainamento e
morfogênese da bacia do rio Tracunhaem, Pernambuco.
Recife, 2010. 124 p. Tese (Mestrado) – Universidade Federal
de Pernambuco.
12. SEEBER, L. & GORNITZ, V. River profiles along the
Himalayan arc as indicators of active tectonics.
Tectonophysics, v. 92, p. 335-367, 1983.
13. TROIANI, F. & DELLA SETA, M. The Use of the Stream
Length-Gradient Index in morphotectonic analysis of small
catchments: A case study from Central Italy. Geomorphology
(2008), DOI: 10.1016/j.geomorph.2007.06.020, 2007.
Manuscrito Recebido em: 1 de setembro de 2010
Revisado e Aceito em: 8 de outubro de 2010
539
Download