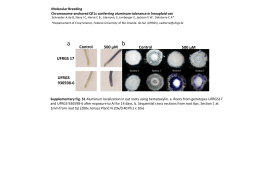
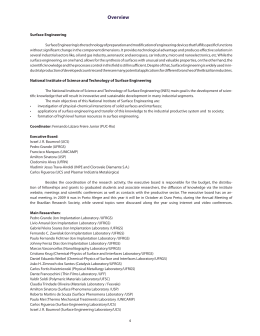
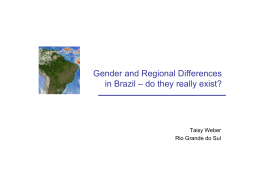
Gtech.Edu Research Group
Federal University of Rio Grande do Sul (UFRGS)
Educational Text Mining
Mining with a single click
SOBEK Version 1.1
Brief historical background
2007
2009
2010
onwards
Sobek was created as a text
mining tool to help distance
learning teachers review
students' work done
collaboratively
Sobek started being used to
help students in reading
comprehension and text
summarization tasks
Sobek got embedded in other
systems, such as: evaluation
of students' posts in discussion
forums, digital game to
promote narrative writing,
project-based learning tool
with content recommendation
What is text mining?
Text mining is a Computer Science technique that enables the
analysis and identification of relevant information in texts.
Different methods can be used to do it, from statistics to natural
language processing. Sobek has been built using a particular
algorithm initially defined by Schenker (2003) and subsequently
modified by the GTech.Edu Research group in order to make it
more suitable to educational applications (Reategui et al. 2011).
Sobek is extremely easy to use. To see a visual representation of
a text you simply have to copy/paste it into Sobek's editor and
press a button. With a single click you can visualize a concise
diagram containing the main terms and relationships of your
text.
Schenker, A. Graph-Theoretic Techniques for Web Content Mining. PhD thesis, University of
South Florida, 2003.
Reategui, E., Epstein, D., Lorenzatti, A., Klemann, M. Sobek: a Text Mining Tool for
Educational Applications. In: International Conference on Data Mining, 2011, Las Vegas, USA,
2011, 59-64.
4
1
2
3
GTech.Edu Research Group
Federal University of Rio Grande do Sul (UFRGS)
How Does it work?
SOBEK looks for frequent terms and their relationships in a text
By looking for recurring words
in a text, Sobek is able to
identify relevant terms and
represent them in a graphical
way, as depicted in the example
on the right. The text analyzed
is about the global warming
effect, obtained from Wikipedia.
In the graph, larger nodes
represent more frequent terms
and connections represent
relationships between them.
Text analyzed: http://en.wikipedia.org/wiki/Effects_of_global_warming
Other features
A, THE, THAT, WITH, ...
THESAURUS
Frequent words such as articles,
prepositions and adverbs are simply
discarded.
A thesaurus is used to identify concepts
that are referred to by using different
words, so that they can be
represented in one single node.
2
GTech.Edu Research Group
Federal University of Rio Grande do Sul (UFRGS)
Step by Step
1. Start by downloading
Sobek from: sobek.ufrgs.br
You can open the .jar application by
just clicking on the downloaded file.
You can also run the application
online by just accessing the Sobek
website and choosing this option.
When opening the application, the
system will open a window just like
the one on the left. It operates like a
text editor on which you can type or
paste the text you want to analyze.
2. Copy/paste a text into Sobek's editor
Simply click on the white space on Sobek's main
screen and paste the text you want to analyze.
You may also type your text or, alternatively,
import it by using the File menu on the top of the
screen
3. Press the Extract Concepts button
When clicking the Extract Concepts button, on
the bottom right side of the window, a small
window will appear with the message "Please
processing text. Please wait...". Usually, for texts
of up to 10 pages, just a couple of seconds are
necessary for Sobek to return the results of the
concept extraction process.
TIP: If you are not satisfied with the results, you can
change the size of the returning graphs by
manipulating the Settings in the top menu
3
1
2
GTech.Edu Research Group
Federal University of Rio Grande do Sul (UFRGS)
4. View and manipulate graph
In the new window opened to display
the results, you may click and drag the
nodes to adjust the graph to look the
way you prefer. Notice that larger
nodes represent more frequent terms.
You can also add, edit and remove
nodes by selecting the corresponding
buttons on the right side of the window.
5. Exploring the graph
Also notice that when you hover the
mouse on a node only its connected
terms are highlighted. The other ones
are dimmed. And when clicking on the
node, some information is presented on
the lower part of the window, such as
the number of times the corresponding
term appears in the text and the
sentences in which it appears.
6. Saving the results
In a final step, you may want to save the graph or its image (JPG) for future reference. If you intend to use the
graph within Sobek in the future, you should use the option Save graph. To open it later, you can use the
menu option File, and then Open graph from Sobek's main window.
And what about the crocodile?
Sobek was an ancient Egyptian
deity represented as a human with a
crocodile head.
He was the god who created the
river Nile, a symbol of power and
strength.
4
GTech.Edu Research Group
Federal University of Rio Grande do Sul (UFRGS)
Pedagogical Strategies to use Sobek
Students'
testimonies
Reading Comprehension
Reading
• Ask students to read a given text
Reflecting
•
•
To identify the relevant terms
and analyze the relationships
highlighted in the graph I had
to re-read the text several
times. That was how I was
able to contrast the graph with
the text.
Let students use Sobek to extract a visual representation of the
relevant terms and relationships from the text
Ask students to reflect about the pertinence of the terms and
relationships identified by the tool
Discussing
• Propose a discussion with students using a projector and
showing them the graph extracted by Sobek
Making summaries
Pre-writing
• Ask students to read a given text
• Let students use Sobek to extract a visual representation of the
relevant terms and relationships from the text
• Ask students to review the terms and relationships identified by
the tool and edit the graph according to what they believe to be
appropriate
• Invite them to save their graphs as an image
The possibility to extract the
main information from a text
is very useful, even having to
manually ‘clean’ the terms
[…]. After observing if the
graph makes sense, the writing
of the summary was easy. I
only had to look at the graph
and follow the relationships,
transforming the graphical part
into text
Writing
•
Using the edited graph as an organizer, ask students to start the
actual writing of the summary. During this step they may go
back and forth to the original text as they wish
Post-writing
•
•
Ask students to use Sobek to analyze their own summary
Ask them to compare their graph with the one obtained from
the analysis of the original text. This comparison should make
them reflect and perhaps make suitable adjustments to their
summaries.
5
GTech.Edu Research Group
The Universidade Federal do Rio Grande do Sul, UFRGS
(Federal University of Rio Grande do Sul) is a century-old
educational institution. It is located in Porto Alegre – the capital
city of the State of Rio Grande do Sul – and it offers academic
programs from all different fields of knowledge, for all stages of
education, ranging from elementary to graduate school.
More than 30 thousand people circulate its facilities in search of
receiving one of the top 10 most qualified educations in Brazil.
ufrgs.br/english/
Sobek has been developed by the GTech.Edu Research Group at the Federal University of Rio Grande do Sul (UFRGS).
Please send us any inquiries or comments to: [email protected]
sobek.ufrgs.br
GTech.Edu
PPGIE - UFRGS
Av. Paulo Gama, 110 - prédio 12105 - 3º andar sala 332
90040-060 - Porto Alegre (RS) - Brazil
gtech.ufrgs.br
Sponsors
Download