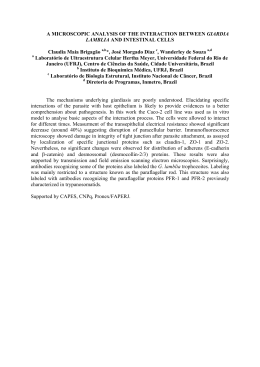
Too Tight and Too Loose:
Monetary Policy in Brazil in the last decade
Carlos Eduardo Goncalves
September 22, 2015
Abstract
In this paper, I analyze monetary policy in Brazil following the country’s adoption
of In‡ation Target in 1999. Some important facts emerge. First, teasing out the neutral
interest rate from a small-scale model, I show that in some periods the CB rate deviated from the estimated neutral rate in the wrong direction: (i) monetary policy was
tightened when in‡ation was below target (2006), and (ii) the CB rate was set below
its neutral value in 2010, 2012 and 2013, even if in‡ation was above target all these
years. Second, I show that deviations from the neutral interest rate do have a bearing
on future in‡ation (monetary transmission channels working). Finally, I present formal
evidence on regime-change – using markov-switching techniques – and argue that this
di¤erent methodology indenti…es gyrations in the monetary regime that closely match
those suggested by deviations from the neutral interest rate. In sum, resorting to IT is
no guarantee of a unique monetary regime.
A¢ liation: IMF and University of Sao Paulo. Email: [email protected]. I thank Irineu Carvalho,
Marcos Chamon, Bernardo Guimaraes and Joao Salles for their comments. All usual disclaimers apply.
1
1
Introduction
This paper is about the ups and downs in monetary policy in one of the biggest In‡ation
Targeters in the world: Brazil. Arguably, adopting a fully-‡edged IT framework should
prevent monetary policy from deviating course. However, the evidence I present below
suggests otherwise: even within IT, one can identify monetary policy regime-changes through
time My estimations of small-scale New Keynesian models and Regime-Switching Bayesian
VARs indicate this to be the case for Brazil. So even if it IT on average delivers good
economic results1 , it still may not guarantee uniqueness of the monetary regime at each
point in time –and regime changes do have consequences in terms of in‡ation outcome.
After abandoning the nominal peg to the US Dollar in 1999, Brazil opted for a formal
In‡ation Targeting regime2 . And the regime’s big real test came soon after: a sharp exchange
rate depreciation in the second semester of 2002 (as uncertainty mounted in the run up to
presidential elections) sent in‡ation through the roof, the CPI index peaking at 14.7% in
2003. But the new framework stood the test: In the following two years in‡ation halved,
and when the Great Recession hit, it had reached 4.8%. The countercyclical economic policy
then prevented in‡ation from falling in 2009, but expansionary policies were maintained
throughout 2010 – an election year – even amidst signs of overheating (GDP grew at a
whopping 7.5%). And in 2012, one year after the new president was elected, the coup de
grace descended on the existing three-pillar macro framework (…scal consolidation, targeting
in‡ation, and ‡exible exchange rates):.a new paradigm was implemented, government o¢ cials
explicitly admitting that the traditional macro framework was to undergo changes. Under the
label of "New Macroeconomic Matrix" (henceforth, NMM) public credit increased rapidly,
interventions aimed at depreciating the currency increased, a laxer …scal policy was pursued,
1
2
See De Carvalho (2010) and Goncalves and Salles (2008).
See Bogdanski et al (1999)
2
and …nally –the object under scrutiny here –an unduly lax monetary policy was pursued3
Using a simple linearized version of the New Keynesian Model, I here present formal
evidence that monetary policy was too tight around 2006 and became too lax in 2010, 2012
and 2013. By tight and loose I mean accumulated deviations from the neutral rate of interest
–calculated here through the Kalman …lter. Further, this is corroborated by a three-equation
Markov Switching VAR, which identi…es regime changes that match very closely the periods
when interest rates are consistently below/above their neutral value4 .
When in‡ation began to accelerate in 2012, o¢ cials and some economists put forth the
argument that the international scenario was to blame. But as the chart below indicates,
in‡ation worldwide was on a declining path since 2011. Interestingly, after the crisis but
before the NMM was announced, in‡ation rates in Brazil followed roughly the same pattern
as in the rest of the world. But that conspicuously changed after 2012.
3
For a summarized yet accurate description of what the NMM was all about I recommend this FT
piece:http://www.ft.com/intl/cms/s/0/d93e8cac-bbdb-11e3-84f1-00144feabdc0.html#axzz3mNgnjG1B
4
For an earlier period, Muinhos and Nakane (2006) use a host of di¤erent methods to estimate Brazil’s
neutral interest rates.
More recently, Perelli and Roach (2013) also resort to a variety of methods to come up with estimations
for this variable. Their State-Space formulation di¤ers from the one I employ here, but the natural rate of
interest in their paper follows a very similar pattern to the one estimated here.
3
Fig1: CPI in‡ation
Further discrediting the thesis of adverse external shocks, the usual supply-side villain,
agricultural commodities prices, were already falling by the end of 2011. And during the
NMM period, from 2012 to 2013, international food prices were actually an ally (Fig.2).
4
Fig.2: Agricultural commodities (accumul 4 quarters)
So, whatever happened to Brazil? What un-anchored in‡ation in the last few years?
The chart below, displaying in‡ation and the in‡ation target after 2005 presents a time-line
narrative that I put to test in the sections below5 .
Fig.3: The elusive target
5
The term Bevilacqua’s Fury was coined by a University of Sao Paulo colleague, Fabio
Kanczuk. Afonso Bevilacqua – personi…cation of toughness – was central bank’s Director of
Economic Policy at the time.
5
2
The model
The model to be estimated via bayesian techniques is comprised of three main "fundamentals" equations and …ve stochastic processes describing the behavior of the neutral rate of
interest and the dynamics of exogenous shocks. In short, it is a reduced version of the now
famous Smets-Wouters (2007) workhorse6 .
The IS curve
Similarly to the standard New-Keynesian model, the output gap at t , ht ; is assumed
to be a function of: (i) the expected future output gap;(ii) deviations of the ex-ante real
interest rates from its neutral value (jointly estimated within the system of equations), and
(iii) a demand shock, ht (e.g., a transitory increase in government spending). Additionally,
I also add lagged deviations of the real exchange rate from trend to the IS (which turn out
not to be signi…cant).
ht = :het+1 +
:(it
e
t+1 )
(nrt
e
t+1 )
+ :reert
1
+ ht
(1)
The Phillips Curve
The Phillips curve, as in Smets-Wouters (2003, 2007) model, has both a forward-looking
and a backward-looking component. The former comes directly from the New-Keynesian
structure with rational agents, while the latter is aimed at capturing the presence of indexation mechanisms in the economy. Second, in‡ation depends on the output gap, ht which is
treated as an observable variable and given by: log(y)
HP f ilter_trend(log(y)): Finally,
in‡ation is also assumed to depend on real exchange rate deviations7 –a stronger currency
makes imported inputs cheaper thus reducing real marginal costs – and exogenous shocks,
6
7
See also Del Negro and Schorfheide (2012).
Using quarterly variations or deviations from an HP …lter do not change the results much.
6
pt ;such as variations in oil and food prices.
t
T
t
= :(
t 1
T
t )
+ (1
e
t+1
)(
T
t )
+ :ht + :reert
1
+ pt
(2)
The Taylor Rule
The CB’s reaction function has lagged interest rates (for smoothness sake), deviations
from the target, the output gap and the variation of the output gap (increases the …tness) as
right-hand side variables. In the baseline estimation, I employ deviations from the neutral
interest rate as the left-hand side variable. Note that when
t
=
T
t
and ht = 0;interest
rate equals its neutral value, it = nrt : As a robustness check, I also estimate the model
demeaning interest rates by its sample mean, instead of by its neutral value. In this case,
the non-observable nrt is "disciplined" only by the IS curve – which arguably prevents the
estimated neutral rate "arti…cially" tracking the central bank’s rate too closely.
it
nrt = :(it
1
nrt
1)
+ (1
):(
:(
T
t )
t
+
h :ht )
+
h :(ht
ht
1)
+ rt
(3)
For the neutral rate of interest, I assume the following autoregressive process:
nrt = :nrt
3
1
+ ent
(4)
Data and Priors
The quarterly data sample goes from 2000 until 2014. In‡ation and interest-rate come from
the Brazilian Central Bank (BCB) website, whereas output and real exchange rate data come
from IFS.
In a Bayesian estimation, model+priors+likelihood maximization using observables=posterior
7
modes. Then after the posterior mode is found, a MCMC procedure is employed to generate
the posterior distribution8 . So choosing the priors is a crucial step, and to some extent, a
very discretionary one.
Here, the priors for the elasticity parameters
and
are assumed to follow a Normal
distribution with average 1 and standard deviation of 0.5. The relatively fat tails distributions
are important so that the estimation procedure does not penalize parameter values far away
from the prior mean.
Since higher values for the reer variable mean a more appreciated currency, both
and
initial values are set to –0.1. (and standard-deviations at 0.5): real appreciations cool o¤
the pace of both economic activity and in‡ation. For the rest of parameters in all equations,
I follow closely the assumptions made in Smets-Wouters (2007). The autoregressive terms
–including the lagged interest rate in the Taylor Rule –are picked from Beta distributions
with mean 0.75 and standard-deviation of 0.1. Also, in the Taylor Rule the weight attributed
to in‡ation deviations is 1.59 and for the output gap, 0.25. Regarding these two parameters
I again assume larger initial standard-deviations. Instead of Smets-Wouters’0.25 and 0.125,
I initiate the estimation with a standard deviation of 0.5 for both of them.
Finally, the shocks to each of the three equations are assumed to follow an autoregressive
process themselves. So, it =
4
i:
it
1
+
i,
where i = p; h; r; n and
i
N (O; #i ):
Results
Before going to the results, a clarifying point. What I call neutral interest rates here is the
time-varying variable that in theory delivers zero output gap and in‡ation on the target,
for the speci…c sample being analyzed. Therefore, the paper has nothing to say about the
8
9
For a thorough discussion see Dave and DeJong (2011).
I also experimented with priors closer to 1 for this parameter, but the results were nearly unchanged.
8
equilibrium level of long-term real interest rates in Brazil.
4.1
Baseline estimations
Below the estimation outputs for three di¤erent measures of in‡ation: full CPI, core CPI
and free CPI (excluding administrative prices from the basket).
Parameters Priors
α
θ
ψ
ρ
μ
β
λ
ζ
σ_{π}
σ_{h}
σ_{Δh}
ψ_{fx}
ψ_{p}
ψ_{nr}
ψ_{r}
Table 1: baseline results
posterior - CPI posterior - CORE posterior - Free Prices
Blocks
0.75
0.87
0.88
0.88
IS
1.00
1.32
1.50
1.32
Block
-0.10
-0.01
-0.01
0.00
0.75
0.32
0.36
0.31
Phillips
-0.10
-0.08
-0.09
-0.10
Block
1.00
1.20
1.24
1.19
0.75
0.53
0.43
0.55
0.75
0.84
0.85
0.83
1.50
3.30
3.58
3.59
0.25
0.53
0.50
0.49
0.50
0.51
0.52
0.52
0.75
0.67
0.66
0.66
Monetary Policy
Block
0.75
0.57
0.61
0.57
Shocks
0.75
0.83
0.85
0.86
Block
0.75
0.41
0.47
0.39
The IS block suggests that monetary policy does a¤ect the output gap –and the elasticity
looks pretty high. Second: real exchange rates don’t appear to count much, possibly due
to low trade to GDP ratios. In the Phillips Curve, perhaps surprisingly, the backwardlooking component is 1/3 of the forward-looking one. Additionally, output gap is positively
correlated with in‡ation. Real exchange rate do a¤ect in‡ation as expected, although the
elasticity looks small.
In terms of monetary policy, on average the Brazilian Central Bank has followed the
Taylor Principle, that is, it has increased nominal interest rates more than proportionally to
in‡ation. The weight attributed to the output gap and its variation are also positive –and
9
a bit greater than those found in Smets-Wouters estimations for the US and Euro Area. Fig
4 below displays the estimated neutral interest rate and the prime rate through time.
Fig.4: Neutral rates and base rate
Overall, nothing stands out as abnormall in Table1. But as the saying goes, the devil is
in the details. And the details have to do with deviations from the neutral interest rate.
Ideally, one would expect the prime rate to jump above the estimated neutral when
in‡ation is greater than its target, and to go below the neutral in times of low in‡ation. As
Fig.4 below reveals, this is generally the case, but not always. Most of data points fall in the
"correct" …rst and third quadrants (67%), a few in the too tight quadrant, 9%, and 24% in
the too loose quadrant. Further, all the points inside the latter come from 2010 (elections)
and 2012/2013 (NMM).
10
Fig 5: Four quadrants
In Fig 6, I propose a narrative of the last ten years of monetary policy based on deviations
of the BCB’s prime rate (Selic) from its time-varying neutral counterpart.
Fig.6: Deviations from neutral interest rates
But does it matter?
Apparently, it does. In …g.6, the "x" axis is interest rates deviations accumulated in four
quarters (rolling window), and the "y" axis is variation in in‡ation, also accumulated in four
11
quarters but with a one-period ahead lead. Most of the points fall close to the negatively
sloped red line: correlation of – 0.48. That is, when interest rates remain above neutral
for some time, after a lag in‡ation either falls or increase very little. On the other hand,
when interest rates remain below its neutral value, in‡ation almost surely increases. And
those points lying far to the north-east somewhat challenging the results have a good reason
to be outliers: in 2002 and at the beginning of 2003 in‡ation was skyrocketing due to an
exchange rate depreciation of nearly 100% in a few quarters. This was generated not by
monetary policy, since rates were above neutral and international rates were not rising, but
by enormous political uncertainty driving Brazil’s risk premia to dizzying levels. Taking
those exceptional points out, the correlation increases by almost 50%, jumping to –0.62.
12
Fig.6: Deviations from neutral and in‡ation
I repeated the same exercise using core in‡ation and free-price in‡ation. The results (not
reported) are very close to those using the full CPI index.
4.2
Neutral rates: IS only
Now, all these …ndings are intimately related to the neutral rate of interest coming out
from the model. This neutral rate is disciplined by two concomitant relationships: the IS
curve and the Taylor Rule. What would happen if the neutral rate is estimated only using
information from the IS curve? Not much. The correlation between deviations from neutral
and the future variation of in‡ation rates gets a bit tighter. The estimated parameters barely
change.
13
Table 2: neutral-in-IS-only results
Parameters Priors posterior - CPI posterior - CORE posterior Free Prices
α
θ
ψ
ρ
μ
β
λ
σ_{π}
σ_{h}
σ_{Δh}
ψ_{fx}
ψ_{nr}
ψ_{p}
ψ_{r}
Blocks
0.75
0.87
0.86
0.89
IS
1
1.29
1.40
1.25
Block
-0.1
-0.01
-0.01
0.00
0.75
0.34
0.37
0.32
Phillips
-0.1
-0.09
-0.08
-0.08
Block
1
1.22
1.19
1.19
0.75
0.53
0.43
0.57
1.5
3.49
3.68
3.48
0.25
0.54
0.57
0.49
0.5
0.53
0.52
0.49
0.75
0.68
0.66
0.66
0.75
0.83
0.85
0.85
Shocks
0.75
0.58
0.60
0.58
Block
0.75
0.53
0.51
0.57
Monetary Policy
Block
Fig.7: deviations from neutral II and variation in in‡ation
5
Robustness: markov-switching evidence
From the evidence presented above, it appears that BCB has gone through di¤erent modes
during the IT period, oscillating between lax and tough. And this is precisely what a
14
Bayesian-VAR10 allowing for the possibility of regime changes tells us.
Using data from 2005 onwards – after interest rates declined from the abnormally high
levels of 2003 and part of 2004 –I estimate the following three-variables system:
:
gap :GAPt
rate: (s
= 1; 2):it = :
=
t
=
1
:
t 1
1gap :GAPt 1
1rate: (s
= 1; 2)it
+
+
2
:
t 2
+
y :GAPt
2gap :GAPt 2
1 +(1
):(
: (s
+
+"
rate :(it
= 1; 2)
(5)
t
t)
t + gap (s
+ "gapt
(6)
= 1; 2):GAPt )+"it
(7)
In the estimation, the only parameters allowed to switch regimes are those pertaining
to the Taylor Rule, as speci…ed above. I allow for two possible regimes with initial average
duration of 4 quarters. The results are displayed in the Fig 8 below.
10
See for instance Kim and Nelson (1999) and Zeng, Waggoner and Zha (2011).
15
Fig 8: Markov-Switching Bayesian VAR
As the chart makes clear, this di¤erent methodology formally identi…es regime changes
that very closely resemble those suggested in Fig 5. This lends further credence to a narrative
emphasizing BCB’s up and downs during the last decade. By itself, IT did not su¢ ce to pin
down the monetary policy regime through time.
6
Final comments
Estimations of neutral interest rates for Brazil using a small-scale model reveal: (i) monetary
policy was exceedingly tight around 2006, (ii) monetary policy was exceedingly lax in 2010
and mainly during the Matrix years, 2012/2013. Moreover, these oscillations in monetary
policy were not inconsequential: too tight policies delivered in‡ation below target, whereas
too lax monetary policy yielded above target in‡ation rates.
16
References
[1] Bogdanski, Joel; Werlang, Sergio and Tombini, Alexandre. "Implementing In‡ation
Targeting in Brazil", Brazilian Central Bank Working Paper 1, 2000.
[2] Dave, Chetan and De Jong, David. "Structural Macroeconometrics", Princeton University Press, 2nd edition, 2011.
[3] De Carvalho, Irineu."28 Months Later: How In‡ation Targeters Outperformed Their
Peers in the Great Recession," The B.E. Journal of Macroeconomics, vol. 11(1), pages
1-46, 2011.
[4] Del Negro, Marco and Schorfheide, Frank. "DSGE model-based Forecast". Federal Reserve Bank of New York Sta¤ Report 554, 2012.
[5] Goncalves, Carlos and Salles, Joao. "In‡ation targeting in emerging economies: What
do the data say?," Journal of Development Economics,vol. 85, pages 312-318, 2008..
[6] Kim, Chang-Li and Nelson, Charles. "State-Space Models with Regime Switching", MIT
Press, 1999.
[7] Muinhos, and Nakane, Marcio. “Comparing Equilibrium Real Interest Rates: Di¤erent
Approaches to Understand Brazilian Rates,” Brazilian Central Bank Working Paper
101, 2006.
[8] Perelli, Roberto and Roach, Shawn. "Time-Varying Neutral Interest Rates –The Case
of Brazil", IMF Working Paper 84, 2014.
[9] Smets, Frank and Wouters, Rafael. "Shocks and Frictions in US Business Cycles: A
Bayesian DSGE Approach", The American Economic Review, Vol. 97, No. 3, pp. 586606, 2007.
17
[10] Smets, Frank and Wouters, Rafael. "An Estimated Dynamic Stochastic General Equilibrium Model of the Euro Area." Journal of the European Economic Association, 1(5):
1123-75, 2003.
[11] Zeng, Liu, Waggoner, Daniel and Zha, Tao. "Sources of Macroeconomic Fluctuations:
a Regime-Switching DSGE Approach". Quantitative Economics 2, 251-301, 2011.
18
Download