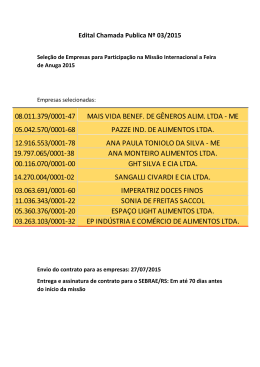
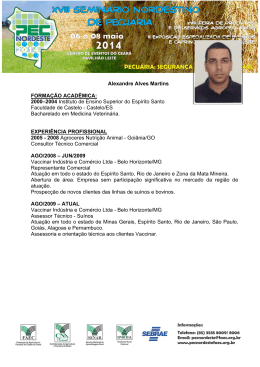
BRASIL MÓVEIS 2006 Relatório Setorial da Indústria de Móveis no Brasil Sectorial Report on the Furniture Industry in Brazil Brasil MÓVEIS 2006 Relatório Setorial da Indústria de Móveis no Brasil Este relatório anual – BRASIL MÓVEIS 2006 – é elaborado, produzido e editado pelo IEMI, com o apoio institucional da MOVERGS. Os textos, os dados estatísticos e os correspondentes quadros e gráficos apresentados, são de inteira responsabilidade dos autores Roberto Viegas B. Prado e Marcelo Villin Prado. Todos os direitos autorais sobre esta obra são reservados. Nenhum conteúdo, parcial ou total, poderá ser reproduzido por qualquer forma ou meio, inclusive o eletrônico, sem prévia autorização por escrito do IEMI. Instituto de Estudos e Marketing Industrial Av. Nove de Julho, 4865 - cj. 42 01407-200 - São Paulo - SP - Brasil Fone: 55 11 3167-3202 Fax: 55 11 3167-4208 www.iemi.com.br [email protected] Produção Gráfica Free Press Editorial – (11) 3021-4131 [email protected] Editora de Arte Dina Alves Projeto Gráfico Jamil L. Junior Tradução Arabera Traduções Impressão RR Donnelley Moore www.rrdmoore.com.br CNPJ: 54.662.523/0001-22 Relatório Setorial da Indústria de Móveis no Brasil São Paulo - BR v. 1 n 1 o Out. 2006 P.1-112 Capa: papel couchè 230 g/m2 – Miolo: papel couchè 80 g/m2 BRASIL MÓVEIS – 2006 / FURNITURE BRAZIL - 2006 BraZil Furniture 2006 Sectorial Report on the Furniture Industry in Brazil This annual report – Brazil Furniture 2006 – is elaborated, produced and edited with the support of IEMI and the Institutional Sponsorship of MOVERGS. The texts, statistical data and corresponding charts and graphs herein, are the entire responsibility of the authors Roberto Viegas B. Prado and Marcelo Villin Prado. Copyright - All the author’s rights in this work are reserved. None of its contents, whether partial or total can be reproduced in any form or way, including electronic, without the previous written authorization from IEMI. Instituto de Estudos e Marketing Industrial Av. Nove de Julho, 4865 - cj. 42 01407-200 - São Paulo - SP - Brasil Fone: 55 11 3167-3202 Fax: 55 11 3167-4208 www.iemi.com.br [email protected] Graphic Production Free Press Editorial – (11) 3021-4131 [email protected] Art Director Dina Alves Graphic Project Jamil L. Junior Translation Arabera Traduções Printing RR Donnelley Moore www.rrdmoore.com.br CNPJ: 54.662.523/0001-22 Sectorial Report of the Brazilian Textile Industry Cover: couchè paper 230 g/m2 – Inside: couchè paper 80 g/m2 São Paulo - BR v. 1 no 1 Out. 2006 P.1-112 Entidades apoiadoras do Brasil MÓVEIS 2006 Entities who supported FURNITURE Brazil 2006 Apoio (Support): BRASIL MÓVEIS – 2006 / FURNITURE BRAZIL - 2006 Índice/Table of contents PANORAMA MUNDIAL GLOBAL PANORAMA 1. Produção e consumo mundial / Production and world consumption .....................................................................13 2. Principais países exportadores e importadores / Main exporting and importing countries........................................16 3. O mercado dos Estados Unidos / The United States market................................................................................22 4. O mercado da União Européia / The European Union market...............................................................................26 5. O mercado da América do Sul / The South American market..............................................................................30 PANORAMA BRASIL BRAZILIAN PANORAMA 1. Estrutura da cadeia produtiva de móveis / Structure of the furniture productive chain............................................32 2. Os grandes números do setor / The sector’s big numbers...................................................................................34 3. Importância do setor na economia brasileira / Importance of the sector in the Brazilian economy............................34 4. Perfil dos produtores de móveis / Profile of furniture producers...........................................................................36 5. Evolução da produção / Evolution of production................................................................................................40 6. Evolução do faturamento / Evolution of earnings...............................................................................................44 7. Mão-de-Obra ocupada / Occupied labor...........................................................................................................46 8. Parque de máquinas e idade média / Machine park and average age....................................................................48 9. Linhas de móveis produzidas / Furniture lines produced.....................................................................................50 10. Consumo de matérias-primas / Consumption of raw materials...........................................................................51 11. Investimentos realizados e previstos / Investments made and projected............................................................52 12. Canais de distribuição / Channels of distribution..............................................................................................56 COMÉRCIO EXTERNO BRASILEIRO BRAZILIAN FOREIGN TRADE 1. Sumário / Table of Contents........................................................................................................................... 62 2. Importações brasileiras de móveis / Brazilian furniture imports...........................................................................62 3. Exportações brasileiras de móveis / Brazilian furniture exports............................................................................64 4. Resultados da balança comercial do setor de móveis / Balance of payment results from the furniture sector.............66 5. Origem das importações e destino das exportações de móveis / Origin of furniture imports and destination of furniture exports.......................................................................................................................67 6. Comércio exterior de móveis por blocos econômicos / Foreign trade of furniture by economic bloc...........................69 7. Participação dos estados / Participation by state...............................................................................................70 8. Pólos exportadores / Export centers................................................................................................................72 PERSPECTIVAS PARA 2006 PERSPECTIVES FOR 2006 1. Estimativas para o número de empresas e empregos / Estimates for the number of companies and jobs..................75 2. Estimativas para o mercado de móveis / Estimates for the furniture market . ......................................................75 ESTATÍSTICAS MACRO-ECONÔMICAS DO BRASIL MACROECONOMIC STATISTICS FOR BRAZIL Estatísticas Macro-Econômicas do Brasil / Macroeconomic Statistics for Brazil...........................................................78 596 EMPRESAS DO SETOR DE MÓVEIS NO BRASIL 596 COMPANIES IN THE BRAZILIAN FURNITURE SECTOR 1. Região Sul / South Region..............................................................................................................................80 2. Região Sudeste / Southeast Region.................................................................................................................92 3. Região Centro-Oeste / Midwest Region.......................................................................................................... 106 4. Região Nordeste / Northeast Region.............................................................................................................. 106 5. Região Norte / North Region......................................................................................................................... 108 Apresentação E ste estudo tem por objetivo oferecer aos seus leitores informações amplas e detalhadas sobre a Indústria de Móveis no Brasil, analisando o desempenho recente de seus diversos segmentos produtivos, sua importância econômica, posicionamento no mercado mundial, estrutura e dimensões, juntamente com uma avaliação de suas oportunidades e ameaças frente às contínuas transformações a que este mercado, cada vez mais globalizado, se encontra exposto. Realizado com base em dados estatísticos atualizados, projetados a partir de informações coletadas através de pesquisas primárias exclusivas e consultas a uma extensa lista de fontes secundárias, nacionais e internacionais, os resultados apresentados PRESENTATION neste trabalho permitem avaliar questões relevantes sobre a evolução recente da inThe objective of this study is to offer its readers broad and detailed dústria moveleira nacional, destacando a sua information about the Furniture Industry in Brazil, analyzing the moderna e competitiva estrutura produtiva, recent performance of its diverse productive segments, its economic equiparável a de seus grandes competidores importance, positioning in the world market, structure and dimensions internacionais, em que pese a alta fragmentogether with an evaluation of opportunities and threats due to the tação de suas empresas. continuous transformations to which this ever more globalized market is exposed. A intenção deste trabalho é oferecer a todos os que labutam neste setor, ou que a ele estejam direta ou indiretamente relacionados, um instrumento de apoio à tomada de decisões empresariais e estratégicas, fornecendo de forma acessível e objetiva, informações estatísticas históricas, análises mercadológicas e setoriais, bem como previsões futuras sobre as tendências do segmento no país. As análises e comentários apresentados neste relatório foram feitos pelos consultores do IEMI, todos com larga experiência e especializados no estudo de cadeias produtivas. Ainda assim, cabe ressaltar que eventuais comentários e opiniões manifestados ao longo deste trabalho, por mais imparciais que possam ser, correspondem à visão deste grupo de profissionais, que de maneira nenhuma tem a pretensão de esgotar toda a verdade sobre os temas aqui abordados. O IEMI espera com este trabalho, contribuir para a melhoria da gestão das empresas, na formação de profissionais especializados, para o embasamento de políticas setoriais, para a promoção do setor moveleiro a nível nacional e internacional, ajudando a garantir a este importante segmento da indústria brasileira, o papel de destaque que lhe é merecido. A todos uma boa leitura. The results presented in this study were carried out based on up-to-date statistical data, projected from information gathered from exclusive primary research and consultations of an extensive list of secondary sources, both national and international. They permit the evaluation of relevant questions about the recent evolution of the domestic furniture industry, highlighting its modern and competitive productive structure, comparable to its great international competitors, notwithstanding the high fragmentation of its companies. This study intends to offer all those who work in this sector, or who are directly or indirectly involved in it, an instrument to support corporate and strategic decision making, supplying historical statistical information, marketing and sectorial analyses, as well as future projections about the segment’s tendencies in the country in an accessible and objective manner. The analyses and comments presented herein were made by IEMI consultants, all with broad experience and specialized in the study of productive chains. Nevertheless, it is worth underscoring that eventual comments and opinions manifested herein, regardless of how impartial they may be, correspond to the point of view of this group of professionals, who in no way have the intention of claiming to have all the truth about the issues addressed herein. With this study, the IEMI hopes to contribute to the improvement of company management, the formation of specialized professionals, the foundation of sectorial policies, the promotion of the furniture sector at the national and international levels, helping to guarantee this important segment of Brazilian industry the prominent role it deserves. For all, a nice reading Marcelo Villin Prado Diretor do IEMI BRASIL MÓVEIS – 2006 / FURNITURE BRAZIL - 2006 O Luiz Attilio Troes Presidente da MOVERGS setor moveleiro possui características particulares. Formado por 14.000 indústrias. Deste número, 90% são micro, pequenas e médias empresas que se ressentem de forma mais rápida de todas as mudanças da economia, sejam negativas ou positivas. Além disso, na busca de mercados mais exigentes, há muito vem investindo em maquinários e especialização de sua mão-de-obra. Não é um setor estagnado, e a prova disto é a elaboração de um produto com muita qualidade. Mas estamos passando por um momento de adaptação. Além das dificuldades encontradas no mercado interno, por conta da falta de renda da população, temos um quadro negativo nas exportações de móveis. O Brasil fechou o primeiro semestre de 2006 em 11,3% negativos, sendo que em 2004 atingimos um crescimento de 42,5% em relação a 2003, e, no ano seguinte, 5%. Sem dúvida alguma, bastante preocupante. Há também outro componente preocupante: a entrada de móveis estrangeiros em nosso país. As importações ainda são muito tímidas, mas não podemos imaginar que assim será sempre. Da mesma forma que trabalhamos para conquistar outros mercados, o Brasil também é uma grande alternativa pelo tamanho de nossa população. A globalização é uma via de duas mãos. Voltada para os gaúchos, a Associação das Indústrias de Móveis do Estado do Rio Grande do Sul/ MOVERGS, cuja principal missão é desenvolver ferramentas para o crescimento do setor gaúcho, muito está fazendo, baseada num planejamento estratégico que visa orientar as empresas a médio e longo prazos. Trabalhamos em várias frentes, seja através da busca de recursos para divulgar o nosso produto no exterior, na importação de máquinas sem similar no país, cursos profissionalizantes em nível superior, representação política em nível estadual e federal, campanhas publicitárias nacionais, apoio às medidas de reflorestamento, entre outros destaques. Além disto, por meio de sua história, está conseguindo desenvolver a idéia do associativismo, pois não há como superar dificuldades sem a união do setor para a busca de resultados concretos. Por isto, estamos sempre abertos para procurar as soluções coletivamente. O próprio CGI Móveis, instalado pelo Governo Estadual e que tem recebido financiamentos de pesquisa e de construção do sistema de informações competitivas da Finep, responsável por esta publicação, também tem o nosso total comprometimento. O crescimento da economia passa hoje, necessariamente, pela informação competitiva. Temos que olhar tanto para dentro de nossas empresas como também para nossos concorrentes, diminuindo gargalos, e desenvolver nossas qualidades e características positivas. Se hoje o setor de móveis passa por momentos difíceis, esta é a hora para uma reflexão mais profunda sobre a gestão das empresas, sobre o mercado e adequação de produto e modernização do parque fabril. Não há mais espaço para quem não estiver “ligado” com tudo que está ocorrendo na nossa volta, e isto independe do tamanho das empresas. O relatório Brasil Móveis é mais uma colaboração para o setor de móveis. Um estudo profundo da capacidade fabril e comercial de um setor que, com muita competência, tem sabido representar a força e qualidade da indústria brasileira tanto no país como fora de suas fronteiras. O setor moveleiro traz divisas ao país. Somos otimistas ao afirmar que sairemos deste momento muito mais fortalecidos e unidos. T he furniture sector has very particular characteristics. It is comprised of 14,000 industries. Of that number, 90% are micro, small and mid-sized companies that feel the effects of all changes in the economy, whether positive or negative, much quicker. Besides that, in the search for more demanding markets, they have been investing in machinery and labor specialization for some time. It is not a stagnant sector, and proof of that is the elaboration of a product with much quality. But, we are going through a period of adaptation. Besides the difficulties found in the domestic market, due to the population’s lack of income, we have a negative picture in furniture exports. Brazil finished the first semester of 2006 at -11.5%, considering that in 2004 we saw a growth of 42.5% compared to 2003, and the following year, only 5%. No doubt, this is very worrisome. There is also another component of concern: the entrance of foreign furniture in our country. Imports are still timid, but we cannot believe they will always be like that. Just as we work to conquer new markets, Brazil is also a great alternative due to the size of our population. Globalization is a two-way street. Geared towards Rio Grande do Sul, the Rio Grande do Sul Furniture Industry Association / MOVERGS whose main mission is to develop tools for sector growth, is doing a lot based on strategic planning that aims at guiding companies over the mid and long terms. We work on several fronts, whether in the search for resources to promote our product abroad, importing machines we do not have in our country, higher level vocational courses, political representation at the state and federal levels, national advertising campaigns, support for reforestation measures, and much more. Besides that, with its history, it is developing the idea of associations, because there is no way to overcome the difficulties without the sector pulling together to seek concrete results. Therefore, we are always open to seek solutions collectively. CGI Móveis itself, founded by the State Government and having received loans for research and for building Finep’s competitive information system, which is responsible for this publication, also has our complete commitment. Nowadays, economic growth necessarily passes through competitive information. We need to look within our own companies as well as to our competitors, reducing bottlenecks, and developing our qualities and positive characteristics. If the furniture sector is undergoing difficult times today, now is the time to reflect in greater detail on company management, the market and adapting the product and modernizing the factory complex. There is no more room for those who are not “in tune” with everything that is happening around us, regardless of company size. The Brasil Móveis report is yet another collaboration for the furniture sector. It is a detailed study of a sector’s factory and commercial capacity. And this sector has had great competence in knowing how to represent the strength and quality of Brazilian industry within the country as well as beyond its borders. The furniture sector brings foreign exchange credits into the country. We are optimistic in affirming we will overcome this moment and be strengthened and united by it. Luiz Attilio Troes President of MOVERGS BRASIL MÓVEIS – 2006 / FURNITURE BRAZIL - 2006 O Centro Gestor de Inovação - CGI Móveis nasceu com a grande missão de servir como uma ferramenta provedora de informação competitiva do Arranjo Moveleiro Gaúcho [CGI-SIC] para o Arranjo Produtivo Local. Todas as informações são focadas no apoio à geração de novos negócios e difusão do conhecimento para a capacitação tecnológica e competitiva das empresas, pesquisando a cadeia estadual, a tecnologia e o mercado nacional e internacional. A FINEP é que abastece esta entidade com aporte financeiro, e graças a isto estamos podendo concretizar a publicação deste relatório setorial Brasil Móveis. Renato Hansen Coordenador do CGI Móveis A criação do CGI Móveis aconteceu pela falta de um órgão capaz de buscar dados para informar sobre novas tendências de consumo e preferências de nichos de consumidores, a tradução destes movimentos em projetos e novas linhas, assim como do ambiente que rege as empresas da cadeia madeira e móveis. Por meio da análise do ambiente externo e interno, como reage o mercado internacional de móveis e como estão situadas as empresas brasileiras? Estas análises, que chamamos de Vigília Tecnológica, dão condições para que empresários possam realizar, quando necessária, uma mudança na forma de pensar as empresas e sua gestão. O que é evidente neste momento é que, além do design, máquinas, acessórios e insumos, todas as informações que os administradores de empresas puderem adquirir sobre os mais diferentes cenários são fundamentais para se manter e vencer num ambiente regido pelo mercado. Desta forma, o CGI Móveis estabelece aos seus públicos prioritários, o madeireiromoveleiro, a difusão de conhecimento que vise à inovação dentro das empresas para a capacitação tecnológica e competitiva, pesquisando a cadeia produtiva e atuando como um centro de inteligência competitiva. Identificar as deficiências e qualidades de forma objetiva e fundamentada incentiva que as empresas façam seus planejamentos de forma mais eficiente, sempre como uma visão de longo prazo, para administrar melhor as incertezas do mercado e suas complexidades. O relatório Brasil Móveis, produzido pelo IEMI - Instituto de Estudos e Marketing Industrial, traz um estudo aprofundado sobre o mercado externo - produção e consumo mundial, países exportadores e importadores e o ambiente do setor de móveis, estrutura da cadeia produtiva, números do setor, sua importância para a economia nacional, perfil das indústrias, linhas de móveis, áreas de investimento, canais de distribuição, comércio exterior de móveis, pólos exportadores, investimentos realizados e previstos, entre outros assuntos. Este estudo foi patrocinado pela APEX. Com este relatório, estão sendo fomentados cenários mais positivos e faz-se uma antecipação às ameaças com a interpretação da informação, para que ela seja direta à ação. Esta é mais uma ferramenta que o CGI Móveis coloca à disposição dos setores madeira-móveis, cuja idéia é que seu conteúdo seja revisado anualmente. Aproveite a leitura. 10 T he Center for Innovation in Management - CGI Móveis was born with the great mission of serving as a tool to provide competitive information from the Rio Grande do Sul Furniture Arrangement [CGI-SIC] to the Local Productive Arrangement. All of the information is focused on supporting the generation of new business and disseminating knowledge for the technological and competitive capacity building of companies, researching the state chain, technology and domestic and international markets. FINEP supplies this entity with financial support and thanks to that we are able to publish this sectorial report for Brasil Móveis. The founding of CGI Móveis occurred due to the lack of an entity capable of gathering data to inform about new consumption trends and preferences of consumer niches, and to translate these movements into projects and new lines, as well as the environment that governs wood and furniture chain companies. After an analysis of the external and internal environment, how does the international furniture market react and how are Brazilian companies positioned? These analyses, which we call Technological Surveillance, provide the conditions for businessmen to carry out a change in the way companies think and in their management, whenever necessary. What is evident at the moment is that besides the design, machines, accessories and inputs, all information company administrators can get about the diverse scenarios is fundamental for them to sustain themselves and to win in an environment governed by the market. Thus, CGI Móveis establishes the dissemination of knowledge for its priority publics, the wood and furniture segments, in order to innovate within the companies and build technological and competitive capacity, researching the productive chain and operating as a competitive intelligence center. By identifying deficiencies and qualities in an objective and solidly based manner companies are encouraged to plan as efficiently as possible, always using a long-term perspective, to better manage market uncertainties and complexities. The Brasil Móveis report, produced by the IEMI - Industrial Marketing and Studies Institute [IEMI, SP], is a detailed study about the foreign market - world production and consumption, exporters and importers and the environment for the furniture sector the structure of the productive chain, sector numbers, its importance for the domestic economy, industry profiles, furniture lines, investment areas, channels of distribution, foreign trade of furniture, export centers, investments made and projected, and more. This study was sponsored by APEX. With this report, more positive scenarios are being promoted and threats are anticipated through the interpretation of information that leads directly to action. This is yet another tool CGI Móveis places at the disposal of the wood-furniture sectors, and the idea is to revise its information annually. Renato Hansen Coordinator of the CGI Móveis Enjoy reading. 11 BRASIL MÓVEIS – 2006 / FURNITURE BRAZIL - 2006 PANORAMA MUNDIAL GLOBAL PANORAMA 12 Panorama Mundial 1. Produção e consumo mundial A indústria do mobiliário, a nível mundial, passou nos últimos 10 anos por grandes transformações, à medida que apresentava uma forte expansão. No período, o setor exibiu crescimento anual médio de 9%. Esse crescimento foi sustentado pela globalização dos mercados, que geraram, juntamente com o aumento das trocas internacionais, a migração da produção para regiões que oferecessem baixos custos de produção. Foi assim que os Estados Unidos trocaram sua posição de maior exportador mundial, para a de maior importador, mantendo-se, porém, na posição de maior consumidor individual. Esse deslocamento da produção mundial para áreas de baixo custo de produção, abriu espaço para que países da Europa Oriental, asiáticos, sul americanos e mais recentemente, africanos, vislumbrassem a possibilidade de ampliarem substantivamente suas produções. Quem melhor soube explorar essa nova situação, foi a China que em 10 anos deixou sua posição de exportador marginal (seus fornecimentos na época limitavam-se a “reexportações” via Hong-Kong), para se tornar o maior fornecedor do mercado americano, onde suplantou o Canadá, e do europeu, onde suplantou a Itália e a Alemanha (grandes exportadores intra e extra-região). Global Panorama O mapa a seguir, ilustra a concentração da produção nas diferentes regiões do planeta: The map below illustrates the concentration of production in União Européia(1) 38,8% 1. Production and world consumption The furniture industry underwent great transformations over the past 10 years on a global level as it was also undergoing strong expansion. The sector saw an average annual growth of 9% during the period. This growth was sustained by market globalization, which together with an increase in international trade, generated the migration of production to regions that offer very low production costs. That is how the United States went from being the world’s largest exporter to the world’s largest importer and still kept its position as the single largest consumer. This shifting of world production to low production cost areas made room for countries in Eastern Europe, Asia, South America, and more recently, Africa, to catch sight of the possibility to substantially expand their productions. China was the country that best knew how to take advantage of this new situation. In 10 years, it went from its position as a marginal exporter (at the time, its supply was limited to re-exportations via Hong Kong) to becoming the largest supplier of the American market, where it surpassed Canada, and the European market, where it surpassed Italy and Germany (large intra and extra-region exporters). the different regions of the planet: Europa Oriental e Rússia 2,3% Am. Norte 26,7% Ásia e Pacífico 28,1% África e Oriente Médio 1,3% Acima de 30% De 20 a 30% Até 3% Am. do Sul 2,9% (1) UE (25) + Noruega e Suíça. (1) EU (25) + Norway and Switzerland. 13 BRASIL MÓVEIS – 2006 / FURNITURE BRAZIL - 2006 A tabela abaixo mostra o panorama mundial, em termos de produção e consumo, nos grandes pólos geográficos do comércio mundial: The table below shows the global panorama in terms of production and consumption in the large geographical centers of world trade: Produção e consumo mundial de móveis em 2005 (US$ milhões) Global production and consumption of furniture in 2005 (US$ million) Produção Regiões/principais países produtores Main producing regions/countries (US$ milhões) Production (US$ Million) Europa / Europe União Européia / European Union Noruega e Suíça / Norway and Switzerland Part. % Part. % Consumo (US$ milhões) Consumption (US$ Million) Part. % Part. % 104.639 38,8% 103.912 38,0% 102.628 38,0% 99.579 36,4% 2.011 0,7% 4.333 1,6% 6.150 2,3% 6.390 2,3% 75.764 28,1% 60.445 22,1% China / China 37.965 14,1% 24.993 9,1% Japão / Japan 12.356 4,6% 15.511 5,7% Outros / Others 25.443 9,4% 19.941 7,3% Leste Europeu e Rússia / Eastern Europe and Russia Ásia e Pacífico / Asia and Pacific Oriente Médio e África / Middle East and Africa 3.448 1,3% 4.336 1,6% 72.191 26,7% 91.383 33,4% Estados Unidos / United States 57.371 21,3% 78.243 28,6% Canadá / Canada 11.723 4,3% 10.784 3,9% 3.097 1,2% 2.356 0,9% América do Norte / North America México / Mexico América do Sul / South America 7.800 2,9% 6.918 2,5% Brasil / Brazil 6.314 2,3% 5.474 2,0% Outros / Others 1.486 0,6% 1.444 0,5% 269.992 100,0% 273.384 100,0% Total / Total Fonte: CSIL/Eurostat/Secex/Dataintal/IEMI – Source: CSIL/Eurostat/Secex/Dataintal/IEMI O exame desse quadro evidencia que países do leste europeu (mais particularmente Hungria e Polônia), China e outros asiáticos (principalmente, Malásia e Tailândia), além do Canadá e México, na zona do Nafta, apresentam produções claramente superiores The examination of this table shows that Eastern European countries a seu consumo interno. São todos eles (most especially Hungary and Poland), China and other Asian concorrentes mais ou menos agressivos, às countries (mainly Malaysia and Thailand) as well as Canada and pretensões brasileiras de firmar posição no Mexico, in the Nafta zone, have productions that are clearly greater cenário moveleiro mundial. than their internal consumption. They are all more or less aggressive competitors to Brazilian intentions to firmly position itself in the global furniture scenario. 14 15 BRASIL MÓVEIS – 2006 / FURNITURE BRAZIL - 2006 2. Principais países exportadores e importadores Examinemos agora as importações e exportações, registradas no ano passado: 2. Main exporting and importing countries Now we will examine the imports and exports recorded last year: Importação e exportação mundial de mobiliário em 2005 (US$ milhões) Global imports and exports of furniture in 2005 (US$ million) Importação Regiões/principais países produtores Main producing regions/countries (US$ milhões) Imports (US$ Million) Europa / Europe União Européia / European Union Noruega e Suíça / Norway and Switzerland Part. % Part. % Exportação (US$ milhões) Exports (US$ Million) Part. % Part. % 42.649 50,8% 43.376 54,2% 39.335 46,9% 42.384 52,9% 3.313 4,0% 992 1,2% Leste Europeu e Rússia / Eastern Europe and Russia 2.623 3,1% 2.383 3,0% Ásia e Pacífico / Asia and Pacific 8.927 10,6% 23.793 29,7% China / China 479 0,6% 13.451 16,8% Japão / Japan 3.660 4,4% 506 0,6% Outros / Others 4.788 5,7% 9.836 12,3% Oriente Médio e África / Middle East and Africa América do Norte / North America Estados Unidos / United States Canadá / Canada México / Mexico América do Sul / South America 1.673 2,0% 785 1,0% 27.771 33,1% 8.579 10,7% 23.765 28,3% 2.893 3,6% 3.478 4,1% 4.417 5,5% 528 0,6% 1.269 1,6% 270 0,3% 1.152 1,4% Brasil / Brazil 154 0,2% 994 1,2% Outros / Others 116 0,1% 158 0,2% 83.912 100,0% 80.068 100,0% Total / Total(1) Fonte: CSIL/Eurostat/Secex/Dataintal/IEMI Nota: (1) Não inclui colchões. Source: CSIL/Eurostat/Secex/Dataintal/IEMI Note: (1) Does not include mattresses. Essa tabela nos mostra que a União Européia detém a liderança do comércio mundial, com uma participação de 47% nas importações globais e de 53% nas exportações. Bem abaixo, aparece o pólo asiático com uma participação de 11% nas importações e de This table shows us that the European Union detains the leadership 30% nas exportações. O grupo do Nafta é o 2° in world trade with a 47% share in global imports and a 53% share maior importador mundial (33%) e o 3° maior in exports. Far below, we see Asia with an 11% share in imports exportador (11%). A América do Sul tem uma and a 30% share in exports. The Nafta group is the 2nd largest participação insignificante nas importações world importer (33%) and the 3rd largest exporter (11%). South (0,3%) e diminuta (1,4%) nas exportações. America has an insignificant share in imports (0.3%) and very A nível de país, os maiores exportadores small share (1.4%) in exports. At a country level, the largest world mundiais são: exporters are: 16 Participação dos maiores exportadores no comércio mundial em 2004/2005(3) Share of largest exporters in world trade in 2004/2005(3) Países / Countries US$ milhões / US$ million 1. China / China(1) 13.451 Participação (%) Participation(%) 16,8% 2. Itália / Italy 5.699 7,1% 3. Canadá / Canada(1) 4.417 5,5% 3.537 4,4% 5. Estados Unidos / United States 2.893 3,6% 6. Polônia / Poland(2) 2.552 3,2% (2) 4. Alemanha / Germany(2) (1) 7. Dinamarca / Denmark 1.445 1,8% 8. França / France(2) 1.355 1,7% 9. México / Mexico 1.269 1,6% 10. Áustria / Austria(2) 1.084 1,4% 11. Bélgica / Belgiun 1.040 1,3% (1) 12. Brasil / Brazil 994 1,2% 13. Espanha / Spain(2) 904 1,1% 14. Suécia / Sweden 871 (2) (1) (2) (2) Fonte: CSIL/Eurostat/Secex/Dataintal/IEMI Nota: (1) Dados de 2005. (2) Dados de 2004 . Os dados de 2005 não estavam disponíveis na data da publicação. (3) Não inclui colchões. 1,1% Source: CSIL/Eurostat/Secex/Dataintal/IEMI Note: (1) Data from 2005. (2) Data from 2004. The data from 2005 were not available at the time of publication. (3) Does not include mattresses. O gráfico a seguir ilustra o ranking dos principais exportadores mundiais de móveis: The graph below illustrates the ranking of the main world exporters of furniture: . China / China ,5 5,7 . Itália / Italy 4,4 . Canadá / Canada ,5 4. Alemanha / Germany ,9 5. Estados unidos / United States 6. Polônia / poland ,6 7. dinamarca / denmark ,4 8. França / France ,4 9. México / Mexico , 0. Áustria / Austria , . Bélgica / Belgium ,0 . Brasil / Brazil ,0 . Espanha / Spain 0,9 4. Suécia / Sweden 0,9 17 BRASIL MÓVEIS – 2006 / FURNITURE BRAZIL - 2006 Observe-se que nesse ranking, figura um único país asiático, os três componentes do Nafta, um da América do Sul (Brasil) e nove europeus, todos eles membros da União Européia (UE-25). Outra forma de se estudar a tabela, é verificando que países ostentam uma balança comercial francamente exportadora. Esse índice (estabelecido pela relação exportações/importações) aponta para os novos membros da União Européia (sobretudo Polônia e Observe that in this ranking only one Asian country is included, Hungria), a China e outros asiáticos (Tailândia e the three components of Nafta, one from South America (Brazil) Malásia), México e Brasil. Porém o peso relativo and nine Europeans, all members of the European Union (EU-25). atual, de cada um desses “players” é bastante Another way to examine this table is by checking which countries desigual. A China, por exemplo, já exporta US$ have a frankly export-based balance of payments. This index (created 13,5 bilhões, não encontrando dificuldades from the exports/imports ratio) points to the new members of the para ampliar essa penetração, apesar das European Union (especially Poland and Hungary), China and other reações que vem provocando. As apostas de Asian nations (Thailand and Malaysia), Mexico and Brazil. However, ganhos expressivos, nos próximos 5 anos, se the current relative weight of each of these “players” is very unequal. concentram em Polônia, Marrocos, Vietnã e China, for example, already exports US$ 13.5 billion, and does not Brasil. Observe-se que essas novas forças no encounter any difficulty in expanding this penetration despite the mercado mundial, têm como denominador reactions it has been causing. The bets on expressive gains over comum, um baixo consumo em seu mercado the next 5 years are concentrated in Poland, Morocco, Vietnam and interno, o que torna sua atuação internacional, Brazil. Observe that these new powers on the world market have a uma exigência para seu crescimento, se não common denominator. Low consumption in their domestic markets para sua sobrevivência. Essa assertiva pode makes their international operations a requirement for growth, if ser facilmente vislumbrada, na tabela abaixo, not their very survival. This assertion can be easily seen in the table que retrata o consumo per-capita por região: below that portrays per capita consumption by region: Consumo aparente total e percapita de mobiliário em 2005 Apparent total and per capita consumption of furniture in 2005 Total Regiões/principais países produtores Main producing regions/countries (US$ milhões) Total (US$ Million) Europa / Europe União Européia / European Union Noruega e Suíça / Norway and Switzerland Leste Europeu e Rússia / Eastern Europe and Russia Ásia e Pacífico / Asia and Pacific Participation % Per capita (US$) Per capita (US$) 103.912 38,0% 223 99.579 36,4% 219 4.333 1,6% 362 6.390 2,3% 21 60.445 22,1% 20 China / China 24.993 9,1% 19 Japão / Japan 15.511 5,7% 121 Outros / Others 19.941 7,3% 12 Oriente Médio e África / Middle East and Africa 4.336 1,6% 28 91.383 33,4% 213 Estados Unidos / United States 78.243 28,6% 267 Canadá / Canada 10.784 3,9% 338 América do Norte / North America México / Mexico 2.356 0,9% 23 6.918 2,5% 30 Brasil / Brazil 5.474 2,0% 30 Outros / Others 1.444 0,5 29 273.384 100,0 58 América do Sul / South America Total / Total Fonte: CSIL/Eurostat/Secex/Dataintal/IEMI – Source: CSIL/Eurostat/Secex/Dataintal/IEMI 18 Participação % 19 BRASIL MÓVEIS – 2006 / FURNITURE BRAZIL - 2006 Outra abordagem para a informação é a de se analisar o peso das exportações, na produção local e o das importações, no montante do consumo nacional. Another way to address the information is to analyze the weight of exports on local production, and of imports on the rest of domestic consumption. Participação das exportações na produção local em 2005 Participation of exports in local production in 2005 Regiões/principais países produtores Main producing regions/countries Europa / Europe União Européia / European Union Noruega e Suíça / Norway and Switzerland Leste Europeu e Rússia / Eastern Europe and Russia Ásia e Pacífico / Asia and Pacific Produção Exportação (US$ milhões) (US$ milhões) (%) Production Exports Export./Prod. (US$ Million) (US$ Million) (%) 104.639 43.376 41,5% 102.628 42.384 41,3% 2.011 992 49,3% 6.150 2.383 38,8% 75.764 23.793 31,4% China / China 37.965 13.451 35,4% Japão / Japan 12.356 506 4,1% Outros / Others 25.443 9.836 38,7% 3.448 785 22,8% 72.191 8.579 11,9% Oriente Médio e África / Middle East and Africa América do Norte / North America Estados Unidos / United States 57.371 2.893 5,0% Canadá / Canada 11.723 4.417 37,7% México / Mexico América do Sul / South America 3.097 1.269 41,0% 7.800 1.152 14,8% Brasil / Brazil 6.314 994 15,7% Outros / Others 1.486 158 10,6% 269.992 80.068 29,7% Total / Total Fonte: CSIL/Eurostat/Secex/Dataintal/IEMI – Source: CSIL/Eurostat/Secex/Dataintal/IEMI 20 Export./Prod. Esse quadro nos mostra que, enquanto o mundo exporta cerca de 30% de sua produção de móveis, países como China, Canadá e México, todos com expressiva produção, exportam cerca de 40% daquilo que This table shows us that while the world exports about 30% of its produzem. No Brasil, um dos mais recentes furniture production, countries like China, Canada and Mexico, all “players” desse mercado, o peso das exportações with expressive production, export nearly 40% of what they produce. não vai além de 15,7% da produção local, o In Brazil, one of the most recent players in this market, the weight of que sinaliza que ainda há um bom caminho a exports does not exceed 15.7% of local production, which indicates percorrer, antes de nos tornarmos uma força no there is still a long way to go before we become a power in the export mercado exportador. market. O outro lado da moeda é exibido na tabela abaixo. Ela nos mostra, por regiões e principais países, o peso das importações no consumo local de móveis. On the other hand, we have what is shown in the table below. It shows us the weight of imports on local furniture consumption by region and main countries. Participação das importações no consumo local em 2005 Participation of imports in local consumption in 2005 Regiões/principais países produtores Main producing regions/countries Europa / Europe União Européia / European Union Noruega e Suíça / Norway and Switzerland Leste Europeu e Rússia / Eastern Europe and Russia Ásia e Pacífico / Asia and Pacific Consumo Importação Import./Cons. (US$ milhões) (US$ milhões) (%) Consumption Imports Impts./Cons. (US$ Million) (US$ Million) (%) 103.912 42.649 41,0% 99.579 39.335 39,5% 4.333 3.313 76,5% 6.390 2.623 41,1% 60.445 8.927 14,8% China / China 24.993 479 1,9% Japão / Japan 15.511 3.660 23,6% Outros / Others 19.941 4.788 24,0% Oriente Médio e África / Middle East and Africa 4.336 1.673 38,6% 91.383 27.771 30,4% Estados Unidos / United States 78.243 23.765 30,4% Canadá / Canada 10.784 3.478 32,3% América do Norte / North America México / Mexico 2.356 528 22,4% 6.918 270 3,9% Brasil / Brazil 5.474 154 2,8% Outros / Others 1.444 116 8,0% 273.384 83.912 30,7% América do Sul / South America Total / Total Fonte: CSIL/Eurostat/Secex/Dataintal/IEMI – Source: CSIL/Eurostat/Secex/Dataintal/IEMI 21 BRASIL MÓVEIS – 2006 / FURNITURE BRAZIL - 2006 A União Européia, a despeito de deter a maior produção mundial, importa 40% de suas necessidades. A região é também uma grande exportadora, tanto intra como extra-área. Suas exportações a países extra-área são fundamentalmente de artigos de excelente qualidade, ainda que a preços bastante elevados. No Leste europeu e na Rússia, que por sinal está se convertendo em importante fornecedora de madeira para a China, o peso das importações sobre o consumo é bastante elevado e chega próximo dos 41%. Na região do Nafta, há que se distinguir a posição dos Estados Unidos, da vivida pelo Canadá e México. Os Estados Unidos, país que detêm a maior produção mundial, é também o maior importador, respondendo por nada menos que 28% do total das importações mundiais. Seu mais tradicional supridor é o Canadá, mas sua posição foi suplantada pela China, que vendeu para o mercado americano em 2005, US$ 10,8 bilhões, contra uma exportação total do Canadá de US$ 4 bilhões. Chama a atenção as taxas da importação sobre o consumo, da China e do Brasil. Ambas são as menores dentre as Despite having the world’s largest production, the European Union observadas (1,9% na China e 2,8% no Brasil). imports 40% of its needs. The region is also a big exporter, both intra O que os distingue, entretanto, é o tamanho das and extra-area. Its exports to extra-area countries are fundamentally cifras envolvidas. A produção chinesa é 6 vezes excellent quality articles at very high prices. In Eastern Europe and maior que a brasileira, o seu consumo interno Russia, which by the way is becoming an important supplier of wood é 4,6 vezes maior e sua exportação 13,5 vezes for China, the weight of imports over consumption is quite high at maior. nearly 41%. In the Nafta region, it is necessary to distinguish the position of the United States from the one experienced by Canada Examinemos agora, em maior profundidade, os pólos importadores mais importantes, começando pelo americano. 3. O mercado dos Estados Unidos and Mexico. The United States, which is the world’s largest producer, is also the largest importer, responsible for no less than 28% of all world imports. Its most traditional supplier is Canada, however that position has been overtaken by China, which sold US$ 10.8 billion to the American market in 2005, compared to total exports from Canada of US$ 4 billion. The imports over consumption rate for China and Os americanos que detinham no mercado moveleiro a “tríplice coroa”, a de maiores produtores, maiores importadores e maiores exportadores mundiais, perderam esta última. Hoje exportam pouco, já que produzem internamente pouco para os padrões de consumo local (apesar de ainda serem o país de maior produção, em todo o mundo). Com a globalização, grandes empresas americanas, decidiram transferir suas fábricas para países que oferecessem custos menores de produção. No caso particular da indústria do mobiliário, áreas que reunissem o fácil acesso às matériasprimas (principalmente a madeira), e baixos custos de mão-de-obra. Brazil call attention. They are both among the lowest observed (1.9% in China and 2.8% in Brazil). However, the distinguishing factor is the size of the figures involved. Chinese production is 6 times greater than Brazilian production, its internal consumption is 4.6 times greater and its exports 13.5 times greater. Let’s now examine the most important import centers in greater depth, starting with the United States. 3. The United States market The Americans, who held the “Triple Crown” in the furniture market, largest producers, importers and exporters in the world, have lost the last one. They export little today because they produce little internally for local consumption standards (despite still being the largest producer in the world).. With globalization, the large Esse mercado, que consumiu em 2005, nada menos que US$ 78,2 bilhões em móveis, mostrou um crescimento de demanda da ordem de 6%, nos últimos cinco anos. Para atender a esse consumo crescente, as importações aumentaram nos últimos anos aceleradamente. É assim que, no período 2000/2005, as importações saltaram de US$ 15,0 bilhões para US$ 23,7 bilhões, o que significa nada menos que 28% do total das importações mundiais. Dessas importações, 22 American companies decided to transfer their factories to countries that offer lower production costs. In the specific case of the furniture industry, this would be areas that unite easy access to raw materials (mainly wood) and low labor costs. This market, which in 2005 consumed no less than US$ 78.2 billion in furniture, revealed a growth in demand of around 6% over the past five years. In order to serve this growing consumption, imports increased at a rapid pace over the past years. That is how imports over the period from 2000 to 2005 leaped from US$ 15.9 to US$ 75% se originam de apenas 4 países fornecedores: a China com 46%, o Canadá com 17%, o México com 8% e a Itália com 4%. Dentre os pequenos fornecedores, chama a atenção a performance 23.7 billion, which means no less than 28% of total world imports. dos produtores brasileiros, que no período, Of these imports, 75% are from only 4 supplier countries: China lograram ampliar suas exportações, em nada with 46%, Canada with 17%, Mexico with 8% and Italy with 4%. menos que 268%, ao elevarem suas vendas Among the small suppliers, the performance by Brazilian producers de US$ 114, para US$ 420 milhões, segundo calls attention because during that period they were able to expand os dados divulgados pelo Departamento de their exports 268% by increasing their sales from US$ 114 to US$ Comércio dos Estados Unidos, os quais são 420 million, according to data announced by the United States diferentes daqueles duvulgados pela SECEX. Department of Commerce, which differ from those announced by O que significa, também, com base nesses SECEX. Based on these numbers, that also means that in 2005 the números, que o mercado americano absorveu American market absorbed 42% of Brazilian exports. em 2005, 42% das exportações brasileiras. Evolução das importações dos Estados Unidos por país fornecedor Evolution of United States imports by supplying country (em US$ milhões) / (in US$ Million) Particip. (%) Países / Countries 2000 2001 2002 2003 2004 2005 Variação 00/05 (%) Participation Variation (%) 00/05 (%) 1. China / China 4.055 4.597 6.379 7.612 8.893 10.779 45,6% 165,8% 2. Canadá / Canada 4.198 3.846 3.773 3.808 3.972 4.017 17,0% -4,3% 3. México / Mexico 1.013 918 1.259 1.592 1.901 1.992 8,4% 96,6% 4. Itália / Italy 1.289 1.246 1.289 1.332 1.182 1.042 4,4% -19,2% 487 429 492 524 626 735 3,1% 50,9% 5. Malásia / Malaysia 6. Vietnã / Vietnam 9 13 79 182 375 680 2,9% 7.455,6% 7. Taiwan / Taiwan 1.022 760 782 691 650 621 2,6% -39,2% 8. Indonésia / Indonesia 491 495 538 520 537 602 2,6% 22,6% 9. Tailândia / Thailand 291 295 375 390 471 440 1,9% 51,2% 10. Brasil / Brazil Outros / Others Total / Total 114 157 243 276 379 420 1,8% 268,4% 2.072 1.933 1.909 2.058 2.269 2.326 9,8% 12,3% 15.041 14.689 17.118 18.985 21.255 23.654 100,0% 57,3% Fonte: U.S. Dept. of Commerce – Source: U.S. Dept. of Commerce As últimas análises divulgadas sobre a evolução desse ranking, indicam que a China deverá ampliar suas exportações aos EUA, apesar de medidas restritivas que estão sendo tomadas pelo governo The latest analyses announced about the evolution of this ranking americano (executivo e legislativo), face às indicate that China should expand its exports to the USA despite pressões, tanto dos produtores internos, the restrictive measures being taken by the American government como de alguns concorrentes internacionais (executive and legislative) that have resulted from pressure from (Canadá, México, Taiwan e Itália). domestic producers as well as some international competitors O gráfico a seguir apresenta o ranking dos principais exportadores de móveis para o mercado norte-americano: (Canada, Mexico, Taiwan and Italy). The graph below shows the ranking of the main furniture exporters to the American market: 23 BRASIL MÓVEIS – 2006 / FURNITURE BRAZIL - 2006 Origem das Importações Norte-Americanas de Móveis (2005 em US$ bilhões) Origin of American Furniture Imports (2005 in US$ billion) 0,8 . China / China 4,0 . Canadá / Canada ,0 . México / Mexico ,0 4. Itália / Italy 5. Malásia / Malaysia 0,7 6.Vietnã / Vietnam 0,7 7. taiwan / Taiwan 0,6 8. Indonésia / Indonesia 0,6 9. tailândia / Thailand 0,4 0. Brasil / Brazil 0,4 ,4 . Outros / others Destino das exportações dos Estados Unidos As exportações norte-americanas são pequenas e têm como principais destinos o Canadá e o México que absorvem 63% do total exportado em 2005. Para o Canadá são destinados mais de 50% das exportações dos Estados Unidos. Destination of United States exports The United States exports little and its main destinations are Canada and Mexico, which absorbed 63% of the total in 2005. More than 50% of American exports go to Canada. Destino das exportações dos Estados Unidos Destination of United States exports (em US$ milhões) / (in US$ Million) Países / Countries Variação (%) 00/05 (%) Particip. Variation (%) 00/05 (%) 2000 2001 2002 2003 2004 2005 1.155 1.076 974 1.006 1.158 1.348 50,9% 16,7% 411 273 212 388 414 309 11,7% -24,8% 3. Reino Unido / United Kingdom 178 104 98 101 112 111 4,2% -37,6% 4. Japão / Japan 133 97 98 96 98 93 3,5% -30,1% 5. Austrália / Australia 30 22 20 21 32 40 1,5% 33,3% 6. Arábia Saudita / Saudi Arabia 71 81 69 47 47 40 1,1% -43,7% 1. Canadá / Canada 2. México / Mexico 7. China / China 21 18 19 22 27 36 1,4% 71,4% 8. Coréia / Korea 30 19 28 34 34 29 1,1% -3,3% 9. Emir. Árabes / Arab Emirates 18 18 17 12 18 29 1,1% 61,1% 10. Brasil / Brazil 27 21 8 5 13 20 0,8% -25,9% Outros / Others 664 573 492 464 519 595 22,5% -10,4% 2.738 2.302 2.035 2.196 2.472 2.650 100,0% -3,2% Total / Total Fonte: U.S. Dept. of Commerce – Source: U.S. Dept. of Commerce 24 Particip. 25 BRASIL MÓVEIS – 2006 / FURNITURE BRAZIL - 2006 4. O mercado da União Européia Quando somados os 25 países que a compõe, a União Européia supera os EUA e se qualifica como maior mercado produtor, consumidor, importador e exportador do mundo. Sua participação vai de 37% do consumo mundial, a 38% da produção, 47% das importações e 53% das exportações. É hoje, portanto, o maior palco do mercado moveleiro mundial. Esse mercado conta com cerca de 140.000 produtores, 90% dos quais com menos de 10 empregados. No todo, essa indústria dá emprego a cerca de 1,3 milhões de pessoas, o que faz dela uma atividade de grande importância estratégica para os países membros do bloco. Se em termos de mercado, a UE deva ser considerada como um todo, não importando a localização física das unidades produtoras, em termos de análise das importações e exportações, é importante distinguir aquelas que são realizadas no interior da área, das realizadas com o resto do mundo. Isso porque, quase 80% das importações e exportações do bloco, são realizadas no seu interior, como mostra o quadro: 4. The European Union market When the 25 countries that comprise the European Union are added together, they surpass the USA and qualify as the world furniture market’s largest producer, consumer, importer and exporter. Its share goes from 37% of world consumption to 38% of production, 47% of imports and 53% of exports. Therefore, today, it is the biggest stage for the global furniture market. This market has approximately 140,000 producers, 90% of which with less than 10 employees. Altogether, this industry employees about 1.3 million people, which makes it an activity of great strategic importance for member countries. If in market terms the EU should be considered as a whole, regardless of the physical location of producing units, in terms of import and export analysis, it is important to distinguish between those done within the area and those done with the rest of the world. That’s because nearly 80% of the bloc’s imports and exports are carried out inside the bloc, as shown in the table: Importações e exportações intra e extra-área na UE-25 em 2004(1) (US$ milhões) Intra and extra-area imports and exports in the EU-25 in 2004(1) (US$ million) Importação Partic. (%) Exportação Partic. (%) Destination Destino Imports Part. % (%) Exports Part. % (%) Intra-área / Intra-area 28.403 76,5 31.843 76,9 Extra-área / Extra-area 8.731 23,5 9.568 23,1 37.134 100,0 41.411 100,0 Total / Total Fonte: CSIL/Eurostat/IEMI Nota: (1) Os dados de 2005, não estavam disponíveis à época da publicação. 26 Source: CSIL/Eurostat/IEMI Note: (1) The data from 2005 were not available at the time of publication. Essa tabela nos mostra que mesmo considerando apenas as operações extra-área, a UE é o 2º maior importador mundial (abaixo apenas dos Estados Unidos) e também o 2º exportador mundial (US$ 9,6 bi), atrás apenas da China (US$ 13,5 bi). As importações (extra-área) realizadas pela UE, cresceram nos últimos anos, 22%, com fortes alterações na presença dos países exportadores, já que os Estados Unidos, a Suíça e a Noruega, perderam espaço para os países asiáticos e para a Europa Oriental (romenos e turcos). This table shows us that even when only considering extra-area operations, the EU is the 2nd largest importer in the world (only trailing the United States) and also the 2nd exporter in the world (US$ 9.6 bi), trailing only China (US$ 13.5 bi). EU imports (extra-area) grew 22% over the past years with big changes in the presence of exporting countries since the United States, Switzerland and Norway lost ground to the Asian countries and to Eastern Europe (Romanians and Turks). Importações (US$ milhões) Imports (US$ million) (em US$ milhões) / (in US$ Million)(1) Países / Countries 1. China / China 2000 2001 2002 2003 2004 Particip. Variação (%) 00/04 (%) Particip. Variation (%) 00/04 (%) 1.270 1.388 1.742 2.274 2.410 27,6% 89,8% 2. Indonésia / Indonesia 841 792 765 785 829 9,5% -1,4% 3. Romênia / Romania 438 495 561 605 646 7,4% 47,5% 4. Suíça / Switzerland 526 512 445 438 463 5,3% -12,0% 5. EUA / USA 718 623 499 415 437 5,0% -39,1% 6. África do Sul / South Africa 390 396 407 407 428 4,9% 9,7% 7. Turquia / Turkey 193 243 309 369 393 4,5% 103,6% 8. Vietnã / Vietnam 219 226 255 341 358 4,1% 63,5% 9. Brasil / Brazil 210 171 188 252 338 3,9% 61,0% 10. Malásia / Malaysia 343 317 317 305 323 3,7% -5,8% 11. Noruega / Norway 298 287 284 269 288 3,3% -3,4% 1.777 1.818 20,8% 6,8 8.237 8.731 100,0% 22,2% Outros / Others 1.702 1.743 1.720 Extra-UE / Extra-EU 7.148 7.193 7.492 Fonte: Eurostat/IEMI Nota: (1) Os dados de 2005, não estavam disponíveis para todos os exportadores à época da publicação. Source: CSIL/Eurostat/IEMI Note: (1) The data from 2005 were not available at the time of publication. 27 BRASIL MÓVEIS – 2006 / FURNITURE BRAZIL - 2006 Origem das Importações Extra-Área da União-Européia - 25 (2004 em US$ bilhões) Origin of Extra-Area Imports for the European Union-25 (2004 in US$ billion) ,4 . China / China 0,8 . Indonésia / Indonesia . Romênia / Romania 0,65 4. Suíça /Switzerland 0,46 0,44 5. Estados unidos / United States 6. África do Sul / South Africa 0,4 7. turquia / Turkey 0,9 0,6 8.Vietnã / Vietnam 9. Brasil / Brazil 0,4 0. Malásia /Malaysia 0, . Noruega /Norway 0,9 ,8 . Outros / others Por outro lado, as exportações extra-área da UE caíram no mesmo período, quase 4%, continuando direcionadas, principalmente, para os mercados norte americano e suíço, ainda que com taxas de On the other hand, EU extra-area exports fell nearly 4% during the expansão reduzidas. O maior crescimento same period, still mainly directed towards the American and Swiss das exportações, foi para o mercado chinês, markets, albeit with reduced growth rates. The Chinese market saw seguida pelas remessas para a Croácia e the greatest growth in exports, followed by shipments to Croatia Canadá: and Canada. Exportações (US$ milhões) Exports (US$ million) (em US$ milhões) / (in US$ Million)(1) Países / Countries Variação (%) 00/04 (%) Particip. Variation (%) 00/04 (%) 2.583 27,0% -17,2% 1.502 15,7% -2,3% 2000 2001 2002 2003 2004 1. USA / USA 3.120 3.058 3.020 2.595 2. Suíça / Switzerland 1.538 1.578 1.553 1.505 3. Noruega / Norway 659 669 728 757 756 7,9% 14,7% 4. Rússia / Russia 595 670 646 658 651 6,8% 9,4% 5. Japão / Japan 516 506 488 520 517 5,4% 0,2% 6. China / China 116 158 177 284 287 3,0% 147,4% 7. Canadá / Canada 208 233 259 240 239 2,5% 14,9% 8. Croácia / Croatia 126 162 207 219 220 2,3% 74,6% 9. Emirados Árabes / Arab Emirates 184 181 179 179 182 1,9% -1,1% 10. Ucrânia / Ukraine 144 174 178 167 163 1,7% 13,2% Brasil / Brazil 73 75 62 59 75 0,8% 2,0% Outros / Others 2.680 2.802 2.745 2.425 2.393 25,0% -10,7% Extra-UE / Extra-EU 9.959 10.266 10.241 9.608 9.568 100,0% -3,9% Fonte: Eurostat/IEMI Nota: (1) Os dados de 2005, não estavam disponíveis para todos os exportadores à época da publicação. 28 Particip. Source: Eurostat/IEMI Note: (1) The data from 2005 were not available for all exporters at the time of publication. 29 BRASIL MÓVEIS – 2006 / FURNITURE BRAZIL - 2006 5. O mercado da América do Sul Falar do mercado sul americano, é quase que falar do mercado brasileiro, já que a indústria moveleira do Brasil, representa cerca de 81% da produção sul americana, 57% das importações, 86% das exportações e 79% do consumo. 5. The South American market To speak of the South American market is almost like speaking about the Brazilian market, since the Brazilian furniture industry represents about 81% of South American production, 57% of imports, 86% of exports and 79% of consumption. Participação do Brasil nos indicadores da América do Sul em 2005 (US$ milhões) Brazil’s participation in South American indicators in 2005 (US$ million) Indicadores 2005 América do Sul Brasil(1) Particip. do Brasil (%) South America Brazil(1) Brazil’s Part. (%) Produção / Production 7.800 6.314 81,0% Importação / Imports 270 154 57,0% Exportação / Exports 1.152 994 86,3% 6.918 5.474 79,1% 2005 Indicators Consumo Aparente / Apparent consumption Fonte: CSIL/Secex/Dataintal/IEMI Nota: (1) Não inclui colchões. Source: CSIL/Secex/Dataintal/IEMI Note: Does not include mattresses. Assim, abstraindo-se a nossa participação, o mercado sul americano se reduz substancialmente, oferecendo suporte pequeno às nossas necessidades exportadoras, mesmo porque já detemos nesse mercado participações Thus, if we subtract our participation, the South American market is relevantes, como mostra a tabela: substantially reduced, offering little support to our export needs, mainly since we already have relevant shares in this market, as shown in the table below: Exportações brasileiras para a América do Sul Brazilian exports to South America 2004 (em US$ milhões)(1) / 2004 (in US$ Million)(1) Países / Countries Argentina / Argentina Importação Total Importação do Brasil Particip. do Brasil (%) Total Imports Brazil’s Imports Brazil’s Part. (%) 76 36 47,4% Chile / Chile 97 26 26,8% Uruguai / Uruguay 14 10 71,4% Equador / Ecuador 35 6 17,1% Venezuela / Venezuela 63 6 9,5% Paraguai / Paraguay 14 4 31,4% Peru / Peru 21 3 16,2% Bolívia / Bolivia 8 2 27,5% 32 2 5,6% Guiana Francesa / French Guiana 5 2 32,0% Suriname / Suriname 4 1 25,0% Guiana / Guiana 2 1 30,0% 99 25,9% Colômbia / Colombia Total 371 Fonte: Daintal/Secex/IEMI Nota: (1) Os dados de 2005, não estavam disponíveis à época da publicação. 30 Source: Daintal/Secex/IEMI Note: (1) The data from 2005 were not available at the time of publication. PANORAMA BRASIL BRAZILIAN PANORAMA 31 BRASIL MÓVEIS – 2006 / FURNITURE BRAZIL - 2006 Panorama Brasil 1.Estrutura da cadeia produtiva de móveis BRAZILIAN PANORAMA 1. Structure of the furniture productive chain A indústria de móveis no Brasil, exerce um papel de destacada relevância seja na cadeia produtiva da madeira, onde é sem dúvida nenhuma o seu principal ator, seja no suprimento de uma enorme rede de pequenos e grandes varejistas especializados e departamentados, que têm nos produtos ofertados pelo segmento, uma de suas principais fontes de receita. Não dá para desprezar, também, a enorme contribuição deste segmento na composição do tão almejado superávit comercial do país, onde contribui com quase 2% das receitas líquidas obtidas pelo Brasil, em seu comércio internacional. The Brazilian furniture industry plays a prominent role in the wood productive chain, where it is beyond any doubt its main player, and in the supply of an enormous network of large and small specialized and departmentalized retailers, which have one of their main sources of income in the products offered by the segment. Nor can we disdain the segment’s enormous contribution in the make-up of the country’s desired commercial surplus, where it contributes with almost 2% of net revenues obtained by Brazil in its foreign trade. The figure below summarizes the productive chain structure for the furniture industry in Brazil: A figura a seguir, resume a estrutura da cadeia produtiva da indústria de móveis no Brasil: 32 QUEM SOMOS “30 ANOS A ABIMÓVEL é a Associação Brasileira das Indústrias do Mobiliário, e também a voz do setor moveleiro junto ao governo. Atua de maneira efetiva no sentido de negociar as reivindicações do setor e busca soluções para o seu desenvolvimento. Defende os interesses das empresas com relação à política tributária, matéria-prima, exportação, garantindo a competitividade da indústria. DEDICADOS AOS MOVELEIROS” BENEFÍCIOS OFERECIDOS PELA ABIMÓVEL A SEUS ASSOCIADOS: REVISTA ABIMÓVEL Sendo sócio, sua empresa recebe os exemplares da revista ABIMÓVEL, contendo reportagens e informações do setor moveleiro além de ter a oportunidade de divulgar sua empresa, seus produtos e suas realizações por meio de anúncios na revista. BRAZILIAN FORNITURE Projeto de fomento às exportações, fruto do convênio da ABIMÓVEL com a APEX (Agência de Promoção das Exportações do Governo Federal), projeto esse que habilita as empresas associadas a participar de feiras internacionais e ter acesso a importadores estrangeiros para divulgar e vender seus produtos. EX TARIFÁRIOS A ABIMÓVEL solicita a negocia junto ao governo, a redução da taxa de importação de máquinas que não possuem similares no mercado interno, de acordo com a necessidade do setor moveleiro. PANORAMA ABIMÓVEL Histórico, referências, tabelas, dados, índices, a visão de mercado interno e externo, informações sobre as exportações do setor que sua empresa necessita para poder se adequar e fazer frente às dificuldades e enfrentadas e administrar melhor seu negócio. SEDE DA SECRETARIA TÉCNICA DO ABNT / CB-15 A ABIMÓVEL é a sede da secretaria técnica do Comitê Brasileiro do Mobiliário, e trabalhando em parceria com a Associação Brasileira de Normas Técnicas, os fabricantes, consumidores e os laboratórios, promove a elaboração de normas técnicas que padronizam e elevam a qualidade da produção do móvel brasileiro. SEMINÁRIOS, PALESTRAS E WORKSHOPS A ABIMÓVEL, promove palestras, seminários e workshops, abordando assuntos de interesse do setor, com o objetivo de atualizar e aperfeiçoar as empresas, além de dar oportunidade para troca de informações e experiências entre as mesmas. FENAVEM A feira que teve sua primeira edição há quase trinta anos, abriu caminho para outros eventos e entidades do setor. A Fenavem concentra fabricantes responsáveis por 80% das exportações e é um palco excelente para discussão de estratégias que ampliem nossa capacidade de produzir, exportar e fortalecer o mercado interno. OFFICE SOLUTION Feira de Produtos e Soluções Prediais e Interiores para escritórios, hotéis, escolas e hospitais. Mobiliário, cadeiras, arquivos deslizantes, divisórias, carpetes, luminárias, pisos, percianas, forros, telefonia, acabamentos, componentes, automação, cabling, equipamentos, entre outros. E ainda mais: • Informações sobre participação em feiras e exposições nacionais e internacionais; • TEC – Tarifas de exportação; • Acesso ao banco de dados da FGV; • Acesso ao mailing da ABIMÓVEL; • Acesso aos estudos da CSIL italiana sobre o Brasil. Estamos certos de que no mundo atual, a informação é uma arma poderosa, e associando-se à ABIMÓVEL, você obterá sempre as melhores e mais completas informações sobre o setor, que habilitará a sua empresa para estar cada vez mais competitiva e integrada ao mercado. Av. Brigadeiro Faria Lima, 1.234 – 15º andar – Cj. 151 – CEP 01451-913 – São Paulo - SP Tel.: 55 11 3817-8711 – Fax: 55 11 3817-8717 www.abimovel.com – [email protected] 33 BRASIL MÓVEIS – 2006 / FURNITURE BRAZIL - 2006 2. Os grandes números do setor De forma reduzida, o relatório Brasil Móveis apresenta os grandes números da indústria moveleira no Brasil, para o ano de 2005: 2. The sector’s big numbers The Brasil Móveis report presents an abridged form of the Brazilian furniture industry’s big numbers for 2005: Indústrias / Industries 14,4 mil / 14.4 thousand (1) Empregos / Jobs 227,6 mil funcionários / 227.6 thousand employees Produção / Production 309,0 milhões de peças (29 milhões de colchões) 309.0 million pieces (29 million mattresses) Vendas / Sales R$ 17,0 bilhões (R$ 1,6 bi em colchões) R$ 17.0 billion (R$ 1.6 bi in mattresses) Exportações / Exports US$ 1,0 bilhão / US$ 1.0 billion Investimentos / Investments R$ 330,0 milhões / R$ 330.0 million Nota: (1) Não inclui empresas sem empregados. – Note: (1) Does not include companies without employees. 3. Importância do setor na economia brasileira A indústria brasileira de móveis está entre os mais importantes segmentos da Indústria de Transformação no país, não só pela importância do valor da sua produção, 3. Importance of the sector in the Brazilian economy mas ainda mais pela geração de empregos dentro da indústria nacional. The Brazilian furniture industry is among the most important in the country’s Transformation Industry segment not only because Em valores monetários, o setor produziu em 2005, R$ 17,0 bilhões, o que é equivalente a 1,4% das receitas brutas da indústria brasileira de transformação no país. of the importance of its production value, but also because of the generation of jobs in domestic industry. In monetary values, in 2005 the sector produced R$ 17.0 billion, which is equivalent to 1.4% of the Brazilian transformation industry’s gross Os empregos gerados pelo setor produtor de móveis somaram 227,6 mil, em 2005, ou o equivalente a 3,6% do total de trabalhadores alocados na produção industrial do país, nesse ano, o que bem demonstra que, além da sua grande relevância econômica, este é um segmento de forte impacto social. revenues in the country. The jobs generated by the furniture producing sector totaled 227.6 thousand in 2005, or the equivalent to 3.6% of the total number of workers allocated to industrial production in the country this year. This demonstrates that besides its great economic relevance, this segment has a strong social impact. Receita Bruta 2005 / Gross Revenues 2005 Faturamento Ind. Móveis R$ 17,0 bilhões Emprego na Indústria de Móveis Furniture Industry Earnings R$ 17.0 billion Jobs in Furniture Industry Fat. Ind. Transformação R$ 1.222,2 bilhões Emprego Ind. Transformação R$ 1,222.2 billion Transformation Industry Jobs (1) Transformation Industry Earnings (1) ð Rel. Faturamento Móveis / Fatur. Ind. Transformação ð Ratio of Furniture Earnings / Transformation Industry Earnings Fonte: IEMI/IBGE/BACEN; Nota: (1) Não inclui indústria extrativa mineral e construção civil. 34 Empregos 2005 / Jobs 2005 227,6 mil func. 227.6 thousand employees (1) (1) 6.251,4 mil func. 6,251.4 thousand employees ð Participação % 1,4% 3,6% ð % Participation Source: IEMI/IBGE/BACEN; Note: (1) Does not include mineral extraction and civil construction industry. 35 BRASIL MÓVEIS – 2006 / FURNITURE BRAZIL - 2006 4. Perfil dos produtores de móveis A indústria moveleira brasileira, em 2005, era formada por um conjunto de 14.401 empresas, disseminadas por todo o território nacional, ainda que fortemente concentrada nas regiôes Sul e Sudeste (83%): 4. Profile of furniture producers In 2005, the Brazilian furniture industry was comprised of a group of 14,401 companies, disseminated throughout national territory, although strongly concentrated in the south and southeast (83%): Empresas segundo sua localização Companies according to location Fabricantes / Manufacturers Móveis de Madeira Wood Furniture Móveis de Metal Metal Furniture Móveis Estofados Upholstered Furniture Outros Móveis Other Furniture Móveis total Total Furniture Colchões Mattresses Total Geral Brasil / Norte / Nordeste Sudeste Sul C. Oeste Brazil North / Northeast Southeast South Midwest 11.990 1.217 5.104 5.020 649 1.097 194 500 354 49 928 151 397 333 47 91 21 22 36 12 14.106 1.583 6.023 5.743 757 295 77 143 60 15 14.401 1.660 6.166 5.803 772 (1) Overall Total Fonte: IEMI Nota: (1) Não inclui empresas sem empregados. 36 Source: IEMI Note: (1) Does not include companies without employees. Dos 14.401 produtores de móveis, 1.529 produzem partes componentes, para serem montadas por terceiros, mas são muito poucos os que se dedicam exclusivamente a esse mister (no máximo 12% dependendo do setor). A grande maioria desses produtores, se utiliza desse artifício, para aproveitar a capacidade de Of the 14,401 furniture producers, 1,529 produce component parts produção de máquinas muito modernas, to be assembled by third parties, but very few are exclusively que produzem acima de sua capacidade de dedicated to this segment (maximum of 12% depending on the acabamento, montagem e sobretudo, de sector). The vast majority of these producers make use of this idea vendas. to take advantage of very modern machine production capacity that produces beyond their finishing, assembling, and above all, Concentrando nossa atenção nas 14.401 empresas que são o objeto deste estudo, o perfil das empresas, segundo os produtos fabricados, é o seguinte: sales capacity. Focusing our attention on these 14,401 companies that are the object of this study, their profile, according to the products manufactured, is as follows: Empresas segundo a natureza dos móveis produzidos Companies according to type of furniture produced Freqüência Natureza do Móvel Frequency Produzido Idade Média Nº Unidades Área Construída (anos) Fabris (média) (média em m2) Nº Empregados (média) Type of Furniture Empresas % Average Age # of Factory Constructed Area # of Employees Produced Companies % (years) Units (average) (average in m2) (average) 11.990 83,3% 20 1 675 12,8 1.097 7,6% 16 1 1.192 17,36 928 6,4% 15 1 889 15,6 91 0,6% 26 1 387 8,9 295 2,0% 25 1 7.819 46,0 14.401 - - - - - - - 19,9 1,1 832,0 13,9 Prod. de Moveis de Madeira Producers of Wood Furniture Prod. de Moveis de Metal Producers of Metal Furniture Prod. de Móveis Estofados Prod. of Upholstered Furniture Produtores de Outros Móveis Producers of Other Furniture Produtores de Colchões Producers of Mattresses Total / Total (1)(2) Média / Average Fonte: IEMI Nota: (1) Respostas múltiplas. (2) Não inclui empresas sem empregados. Source: IEMI Note: (1) Multiple answers. (2) does not include companies without employees. 37 BRASIL MÓVEIS – 2006 / FURNITURE BRAZIL - 2006 Empresas segundo sua localização e produtos fabricados Companies according to location and products manufactured Regiões e Pólos Regions and Centers Norte /Nordeste North / Northeast Sudeste Southeast Sul South Centro-Oeste Midwest Total / Total Jantar Estar Estofados Dining Living Uphols Room Room tered 42,9% 21,4% 21,4% 25,9% 58,7% 23,4% 29,9% 52,4% 28,6% Escritório Dormitório Office Bedroom Modulados Outros Colchões Modular Others Mattresses 21,4% 14,3% 21,4% 28,6% 15,6% 19,9% 14,4% 26,4% 28,4% 25,9% 36,6% 28,7% 26,8% 20,7% 23,2% 23,3% 71,4% 28,6% 14,3% 14,3% 28,6% 28,6% 0,0% 27,5% 55,7% 29,0% 23,6% 19,7% 23,8% 26,2% 100,0% 3.874 7.857 4.093 3.326 2.777 3.362 3.691 295 Número de empresas(1)(2) Number of companies (1)(2) Fonte: IEMI Nota: (1) Respostas múltiplas. (2) Não inclui empresas sem empregados. Source: IEMI Note: (1) Multiple answers. (2) Does not include companies without employees. Empresas segundo sua política de produção Companies according to production policy Regiões e Pólos Regions and Centers Prod. Em Série Prod. Sob Prod. de Partes Montagem de Base Production in Desenho Production of Partes Base Series Production as per Parts Assembly of Design Norte/Nordeste North / Northeast 45,5% 77,3% 0,0% 0,0% 1.583 Sudeste / Southeast 51,5% 58,7% 6,4% 2,1% 6.023 Sul / South 63,5% 51,1% 9,6% 5,6% 5.743 Centro-Oeste / Midwest 57,1% 57,1% 0,0% 0,0% 757 Total / Total(1)(2) 7.942 7.998 1.016 480 14.106 56,3% 56,7% 7,2% 3,4% 100,0% Participação % % Participation Fonte: IEMI Nota: (1) Respostas múltiplas. (2) Não inclui empresas sem empregados. 38 Parts Source: IEMI Note: (1) Multiple answers. (2) Does not include companies without employees. 39 BRASIL MÓVEIS – 2006 / FURNITURE BRAZIL - 2006 5. Evolução da produção Tomando-se 2003 como referencial (e portanto = 100), observa-se que a produção em 2004 cresceu 2,8%, caiu em 2005 (5,1%), mas com previsão de voltar a crescer cerca de 2,6% em 2006. É interessante observar que a queda na produção em 2005 atingiu quase todos os segmentos do setor, o que nos leva a acreditar, que ela reflete antes de mais nada, uma redução na capacidade de compra do mercado interno. A previsão para 2006, mais otimista, se fundamenta na expectativa de uma melhoria na renda média das famílias, como conseqüência de um abrandamento na política macroeconômica do governo, tida como bastante provável em 5. Evolution of production função dos bons resultados no controle da inflação e por ser um ano eleitoral. Using 2003 as a reference (and therefore = 100), observe that Posto numa perspectiva mais ampla, de 5 anos, 57% das empresas acreditam que a tendência evolutiva de suas produções, é de franco crescimento, 30% acham que suas vendas tendem a se manter estagnadas e 14% acham que sofrerão perdas. Esses que imaginam que perderão mercado, atribuem o fato, ao aumento da pressão concorrencial, gerada pelas grandes empresas nacionais. É bem verdade que existem alguns – mas são poucos – que atribuem o possível encolhimento de seu mercado, à pressão das importações orientais, a preços bastante competitivos na visão dos empresários locais. production in 2004 grew 2.8%, fell in 2005 (5.1%), but the projection is for it to grow again in 2006, about 2.6%. It is interesting to observe that the drop in production in 2005 affected almost every segment of the sector, which leads us to believe that it reflects, above all, a reduction in domestic market purchasing capacity. The more optimistic forecast for 2006 is based on the expectation for an improvement in average family income as a consequence of the softening of the government’s macroeconomic policy, which is seen as very probable due to the good results in controlling inflation and for being an election year. Using a broader, 5 year perspective, 57% of the companies believe that the trend is for solid growth in production, 30% believe their sales will remain stagnant and 14% believe they will suffer losses. Those that feel they will lose market share attribute the fact to increased competition generated by the large national companies. It is true that there are some, albeit few, who attribute this possible shrinking of the market to pressure from Asian imports at very competitive prices in the opinion of local businessmen. 40 Evolução segundo o tipo de móvel produzido (variação nos volumes em peças) Evolution according to the type of furniture produced (variation in piece volume) Linha de móvel produzido Evolução da Produção (2003=100) Tendência para 5 anos Production Evolution (2003 = 100) 5 year tendency Crescer Estagnar Cair Furniture line produced 2003 2004 2005 2006 Grow Stagnate Fall Escritório / Office 100,0 103,2 100,1 101,6 56,9% 27,5% 15,7% 100,0 101,8 95,4 97,3 50,7% 31,0% 18,3% 100,0 100,9 92,8 95,5 55,4% 26,8% 17,9% 100,0 98,8 91,4 93,6 58,2% 25,3% 16,5% 100,0 100,7 95,9 99,8 57,1% 20,8% 22,1% 100,0 97,7 90,2 91,0 51,0% 26,6% 22,4% 100,0 113,6 115,2 103,5 61,4% 16,2% 22,3% 100,0 102,8 97,6 100,2 56,8% 29,7% 13,6% 100,0 100,2 97,3 96,1 58,2% 32,7% 9,1% Dormitório Bedroom Sala de jantar Dining Room Sala de estar Living Room Estofados Upholstered Furniture Móveis modulados Modular furniture Outros móveis Other Furniture Todo o setor Entire Sector Colchões Mattresses Fonte: IEMI – Source: IEMI Posto em termos de localização geográfica, observa-se que a evolução recente e as perspectivas futuras das empresas, pouco divergem do quadro nacional. When seen in terms of geographic location, we observe that the recent evolution and the future perspectives of the companies differ very little from the national picture. Evolução segundo a localização das empresas Evolution according to company location Linha de móvel produzido Furniture line Evolução da Produção (2003=100) Tendência para 5 anos Production Evolution (2003 = 100) 5 year tendency Crescer Estagnar Cair Grow Stagnate Fall 2003 2004 2005 2006 100,0 96,3 88,7 85,0 50,0% 20,8% 29,2% 100,0 91,7 94,4 99,4 50,4% 34,5% 15,1% Sul / South 100,0 101,9 97,3 97,9 56,2% 24,2% 19,7% Centro-Oeste Midwest 100,0 90,9 101,5 101,0 42,9% 29,5% 28,6% 100,0 102,8 97,6 100,2 56,8% 29,7% 13,5% produced Norte/Nordeste North / Northeast Sudeste Southeast Todo o setor Entire Sector Fonte: IEMI – Source: IEMI 41 BRASIL MÓVEIS – 2006 / FURNITURE BRAZIL - 2006 O mapa a seguir, detalha a concentração das empresas por região e estado do país: The following map shows details of company concentration by region and state in the country: 42 Em termos de mercado e não de suas empresas, 34% acham que o mercado, nos próximos 5 anos, permanecerá estável, 53% acham que tende a crescer e só 13% acham que se achatará. E as expectativas são as mesmas, tanto para os móveis residenciais, In terms of market and not of companies, 34% believe the market over como para os de escritório. Já no segmento de the next 5 years will remain stable, 53% believe there is a growth trend colchões, para 41% das empresas o mercado and only 13% feel there will be a retraction. And the expectations are deve permanecer estável, para 43% deve the same for home and office furniture. In the mattress segment, 41% crescer e 16% acreditam em redução. of the companies feel the market will remain stable, 43% believe it will grow and 16% think it will shrink. Tendência evolutiva do mercado para os próximos 5 anos Market evolution trend for the next 5 years Tendência Distribuição / Distribution Mov. Res. Mov. de Escrit. Colchões Home Furniture Office Furniture Mattresses Total Estável / Stable 34,3% 32,4% 41,3% 34,3% Crescimento / Growth 53,9% 53,9% 42,9% 52,7% Tendency Redução / Retraction Total / Total Total 11,8% 13,7% 15,9% 13,0% 100,0% 100,0% 100,0% 100,0% Fonte: IEMI – Source: IEMI Diante destes resultados, pode-se concluir que, tanto para móveis, quanto para colchões, o risco de queda nas vendas é relativamente pequeno (13%) e o de crescimento 4 vezes maior, ao menos nas With these results it is possible to conclude that for furniture as expectativas dos produtores nacionais. well as mattresses, the risk of a reduction in sales is relatively small (13%) and the belief in growth is four times greater, at least in the expectations of national producers. 43 BRASIL MÓVEIS – 2006 / FURNITURE BRAZIL - 2006 6. Evolução do faturamento O faturamento do setor, evoluiu de forma extremamente discreta no período 2003/2005 e sempre abaixo da inflação registrada no período, o que deve ter exigido das empresas, uma administração de grande austeridade, sob pena de incorrerem 6. Evolution of earnings em prejuízos. A tabela abaixo nos mostra que a maior variação no período, ocorreu Sector earnings grew very discretely in 2003/2005 and always below no segmento de Colchões, que ampliou seu recorded inflation rates for the period. This must have forced the faturamento em escassos 7,6%, contra companies to manage with great austerity or incur losses. The table uma inflação de quase o dobro. Os móveis below shows us that the biggest variation in the period occurred residenciais e de escritório proporcionaram in the Mattress segment, which expanded earnings a scarce 7.6% uma evolução de faturamento da ordem de compared to an inflation rate of almost double. Home and office 3,7% e 2,0%, respectivamente: furniture saw earnings growth of 3.7% and 2.0%, respectively. Faturamento médio mensal das empresas Average monthly earnings for companies Segmento Segment Móveis Residenciais Home furniture Móveis de Escritório Office furniture Colchões Mattresses Total do faturamento Total Earnings Faturamento anual (em R$1.000) / Annual earnings (in R$ 1,000) 2003 2004 2005 10.446.108 10.633.770 10.836.903 4.443.972 4.480.011 4.531.848 1.527.957 1.630.828 1.644.467 16.418.037 16.744.609 17.013.218 Fonte: IEMI – Source: IEMI Segmento Segment Móveis Residenciais Home furniture Móveis de Escritório Office furniture Colchões Mattresses Total do faturamento Total Earnings Fonte: IEMI – Source: IEMI 44 Faturamento anual (evolução) / Annual earnings (evolution) 2003 2004 2005 100,0 101,8 103,7 100,0 100,8 102,0 100,0 106,7 107,6 100,0 102,0 103,6 45 BRASIL MÓVEIS – 2006 / FURNITURE BRAZIL - 2006 Distribuindo-se as empresas por faixa de faturamento, é possível verificar que o setor é formado por empresas de muito pequeno porte (como aliás em todo o mundo). É assim que 87% delas faturam até R$ 1,2 milhões/mês, como nos mostra o When distributing companies by earnings bracket it is possible to quadro abaixo: see that the sector is comprised of very small companies (as it is throughout the world). That is how 87% of them earn up to R$ 1.2 million/month, as is shown in the table below: Distribuição das empresas segundo seu faturamento mensal Distribution of companies according to monthly earnings Distribuição / Distribution Faixas de faturamento (em R$) Earnings Brackets (in R$) Mov. Res. Mov. de Esc. Colchões Total Home Furniture Office Furniture Mattresses Total 62,7% 51,3% 72,1% 60,9% 16,6% 26,8% 11,5% 18,7% 6,6% 8,1% 6,6% 7,0% 8,5% 11,4% 8,2% 9,2% 2,2% 1,6% 1,6% 2,0% 3,4% 0,8% 0,0% 2,2% 100,0% 100,0% 100,0% 100,0% Até 120 mil/mês Up to 120 thousand/month De 121 a 600 mil/mês From 121 to 600 thousand/month De 601 a 1,2 milhão/mês From 601 to 1.2 million/month De 1,21 a 6,0 milhões/mês From 1.21 to 6.0 million/month De 6,1 a 10,0 milhões/mês From 6.1 to 10.0 million/month Acima de 10,0 milhões/mês Over 10.0 million/month Total / Total Fonte: IEMI – Source: IEMI 7. Mão-de-obra ocupada Regime e força de trabalho nas empresas moveleiras As empresas moveleiras trabalham basicamente em um único turno e raramente rodam mais de 8 horas por turno. No todo, o parque opera à razão de 8hs e 15min. por dia: 7. Occupied labor Labor force and regime in furniture companies Furniture companies basically work a single shift and rarely operate more than 8 hours per shift. Altogether, the industry works 8 hours and 15 minutes per day: Regime de trabalho Work regime Turnos / Shifts Empresas / Companies Horas Trabalhadas / 1 93,0% 8,3 2 6,1% 17,0 3 0,9% 24,0 Média / Average - 8,3 Fonte: IEMI – Source: IEMI 46 O número de funcionários utilizados, cresceu cerca de 4% em 2004, e apenas 0,4% em 2005, acumulando no período um crescimento de 4,5%. Cerca de 86% da força de trabalho é ocupada nas áreas produtivas das empresas, 12% na administração, ao mesmo tempo em que pouco menos de 2% dos funcionários, encontram-se The number of employees grew about 4% in 2004, and only 0.4% alocados na área comercial. É verdade que, in 2005, accumulating a growth of 4.5% in the period. About 86% em apoio à equipe de vendedores próprios, of the work force is occupied in company productive areas, 12% in as empresas mantêm cerca de 13.000 administration, and at the same time less than 2% of the employees representantes comerciais, número que vem are allocated to the commercial areas. It is true that the companies crescendo consistentemente desde 2003 (o have about 13,000 sales representatives to support their own sales aumento no período foi de 15%): force, and this number has been growing consistently since 2003 (growing 15% in the period): Número de funcionários Number of employees Área de trabalho Work area Produção / Production Administração Administration Vendedores próprios Own sales force Representantes comerciais Sales representatives Total do setor 2003 2004 2005 187.751 195.548 196.331 25.827 26.672 27.108 4.200 4.506 4.209 11.270 12.123 12.998 217.778 226.725 227.648 203.748 211.194 212.794 14.030 15.531 14.853 (1) Total for sector (1) Total de móveis Total furniture Total de colchões Total mattresses Fonte: IEMI Nota: (1) Os representantes comerciais não estão incluídos. Source: IEMI Note: (1) Does not include sales representatives. Evolução da oferta de postos de trabalho Evolution of job offers Evolução / Evolution Área de trabalho Work area 2003 2004 2005 Produção / Production 100,0 104,2 104,6 100,0 103,3 105,0 100,0 107,3 100,2 100,0 107,6 115,3 100,0 104,1 104,5 100,0 103,6 104,4 100,0 110,7 105,9 Administração Administration Vendedores próprios Own sales force Representantes comerciais Sales representatives Total do setor (1) Total for sector (1) Total de móveis Total furniture Total de colchões Total mattresses Fonte: IEMI Nota: (1) Os representantes comerciais não estão incluídos. Source: IEMI Note: (1) Does not include sales representatives. 47 BRASIL MÓVEIS – 2006 / FURNITURE BRAZIL - 2006 8. Parque de máquinas e idade média O parque de máquinas utilizado pela indústria do mobiliário pode ser considerado como bastante novo pelos padrões internacionais, já que a idade média dos equipamentos é de 8,4 anos, inferior aos da Itália (com média de 12 anos) e Estados Unidos (9,6 anos), mas inferior ao da indústria chinesa de Guangdong, onde a idade média é 7,5 anos. 8. Machine park and average age The machine park used by the furniture industry can be considered quite new by international standards since the average age of the equipment is 8.4 years, less than Italy (average of 12 years) and the United States (9.6 years), but more than the Chinese industry in Guangdong, where the average age is 7.5 years. Parque de máquinas instalado - 2005 Installed machine park – 2005 Máquinas instaladas Machines installed Distribuição das máquinas por faixa de idade Distribution of machines by age bracket Total (2005) Total (2005) Até 2 anos Up to 2 years 3 a 5 anos 3 to 5 years 6 a 10 anos 6 to 10 years 10 a 15 anos 10 to 15 years + de 15 anos + than 15 years Serrar / Saw Destopadeira / Buzz saw 3.674 7,2% 35,1% 32,7% 14,4% 10,6% 12.632 3,7% 25,5% 39,0% 15,6% 16,3% Seccionador / Panel saw 1.379 13,0% 35,5% 34,8% 8,7% 8,0% Esquadrejadeira / Sliding table saw 8.972 4,9% 25,3% 37,7% 19,8% 12,3% Perfiladeira esquadrejadeira Sliding table shaper saw 1.073 15,3% 21,6% 36,0% 18,0% 9,0% Serra de fita / Band saw 9.458 1,7% 20,4% 34,3% 21,5% 22,1% Outras de serrar / Other saws 1.946 13,1% 35,2% 24,6% 20,5% 6,6% Lixadeira de cinta/banda larga Wide belt sander 9.259 5,9% 33,9% 37,6% 11,7% 11,0% Lixadeira de bordas / Edge sander 3.143 7,1% 43,2% 32,8% 12,0% 4,9% 625 5,9% 44,1% 32,4% 11,8% 5,9% 6.461 24,3% 38,0% 21,1% 13,4% 3,3% Serra circular / Circular saw Lixar / Sand Lixadeira calibradora / Calibrating sander Outras lixadeiras / Other sanders Fazer espigas/ranhuras/fresas/etc – Makes spikes/grooves/angles/etc Respigadeira / Router 2.419 3,3% 27,3% 41,3% 19,0% 9,1% 10.699 4,5% 26,5% 36,4% 17,9% 14,7% CNC / CNC 710 13,7% 34,3% 31,4% 17,6% 2,9% Perfiladeira / Sliding table shaper 610 0,0% 43,1% 21,6% 23,5% 11,8% Tupia / Shaper Desengrossadeira / Planer 7.206 2,8% 22,1% 37,6% 17,4% 20,2% Desempenadeira / Trowel 8.323 2,0% 19,3% 38,1% 18,0% 22,5% Plaina 4 faces / 4 side planer 1.909 11,2% 32,0% 34,9% 17,2% 4,7% 995 22,2% 18,5% 38,9% 5,6% 14,8% 2.114 13,7% 36,6% 34,6% 7,2% 7,8% 502 18,2% 41,8% 29,1% 7,3% 3,6% Outras máquinas / Other machines Colar / Glue Coladeira de bordas / Edge gluer Outras de colar / Other gluers Furar / Drill Furadeira múltipla / Multiple drill 4.422 13,2% 34,5% 39,0% 6,6% 6,6% 13.368 7,9% 29,6% 29,2% 18,5% 14,8% Mesa/prensa de montagem Assembly table/press 7.759 8,8% 24,9% 38,3% 14,7% 13,1% Outros tipos / Other types 2.694 15,5% 23,3% 40,1% 12,9% 8,2% 9.898 8,4% 29,2% 37,7% 12,3% 12,4% 132.253 8,4% 29,2% 35,5% 14,6% 12,2% Outras furadeira / Other drills Montar / Assemble Outras / Others Diversas / Diverse Total de máquinas / Total machines Fonte: IEMI – Source: IEMI 48 49 BRASIL MÓVEIS – 2006 / FURNITURE BRAZIL - 2006 9. Linhas de móveis produzidas 9. Furniture lines produced A indústria moveleira nacional produziu em 2005, 281 milhões de peças acabadas, 28 milhões de colchões e cerca de 5 milhões de partes, para montagem por terceiros, das quais quase a metade, em peças para dormitórios. In 2005, the national furniture industry produced 281 million finished pieces, 28 million mattresses and about 5 million parts for assembly by third parties of which half were for bedroom furniture. Distribuição da produção - 2005 Distribution of production - 2005 Linha de móvel / Furniture line Móveis para Dormitórios Bedroom Furniture Móveis para Escritórios Office Furniture Móveis para Salas de jantar Dining Room Furniture Peças / Pieces Partes / Parts 41,4% 39,2% 14,1% 10,9% 10,5% 6,8% 9,9% 14,5% 7,0% 1,8% 4,1% - 13,0% 26,8% 100,0% 100,0% Móveis Estofados Upholstered urniture Móveis Modulados Modular Furniture Móveis para Salas de Estar Living Room Furniture Outros Móveis / Other Furniture Total do Setor / Total for sector Fonte: IEMI – Source: IEMI Produção por linha de móvel (em peças) Production by furniture line (in pieces) Linha de móvel / Furniture line Móveis para Escritórios Office Furniture Móveis para Dormitórios Bedroom Furniture Móveis para Salas de jantar Dining Room Furniture Móveis para Salas de estar Living Room Furniture Móveis Estofados Upholstered Furniture Móveis Modulados Modular Furniture Outros Móveis / Other Furniture Total do setor / Total for sector Colchões / Mattresses Fonte: IEMI – Source: IEMI 50 2003 2004 2005 40.372.262 41.663.841 40.413.926 120.098.907 122.300.313 114.595.393 30.661.282 30.939.740 28.464.561 12.317.023 12.170.971 11.258.148 28.978.135 29.182.412 27.781.656 21.204.170 20.707.197 19.133.450 34.128.106 38.780.526 39.310.616 287.759.885 295.745.000 280.957.750 29.086.710 29.145.000 28.299.795 10. Consumo de matérias-primas Móveis de Madeira – cerca de 59% da madeira consumida na produção moveleira, é de madeira serrada, sendo 26% de pinus e o restante (33%) de “madeiras de lei”, obtidas quase sempre de florestas naturais. As madeiras industrializadas, responsáveis por 41% da demanda de matérias primas, são utilizadas na forma de chapas de MDF (20%) e 10. Consumption of raw materials aglomerados (17%). As chapas de fibras duras participam do consumo total de madeiras, em Wood Furniture – about 59% of the wood consumed in furniture não mais que 5%. production is sawn wood, 26% pinus and the rest (33%) hardwood, Móveis de Metal – neste grupo, os tubos participam com 62%, ficando as chapas com o restante (38%). almost always obtained from natural forests. Industrialized woods are responsible for 41% of the raw material demand and they are used as MDF sheets (20%) and particleboard (17%). Sheets of hard fiber participate with less than 5% of total wood consumption. Vime, Ratan e Semelhantes – neste segmento do mercado de móveis, cerca de 80% do consumo é de vime, quase todo de origem nacional e o restante de ratan e semelhantes, quase sempre importados. Metal Furniture – in this group, tube furniture has a 62% share, and sheets have the rest (38%). Wicker, Rattan and Similar – in this furniture market segment about 80% of consumption belongs to wicker, almost all of domestic origin, Além desses produtos, o mercado consome cerca de 7,95 milhões de metros cúbicos de espumas, na produção de colchões e estofados, e de outros artigos em quantidades pequenas e variáveis, como inox, vidros, cerâmicas, cortiças, etc., cuja demanda varia bastante, em função do estilo em voga. and the rest, of rattan and Similar, is almost all imported. Besides these products, the market consumes about 7.95 million cubic meters of foam in the production of mattresses and upholstery, and other articles in small and variable quantities such as stainless steel, glass, ceramics, cork, etc., the demand for which varies considerably as a function of the style in vogue. Consumo de matérias-primas Consumption of raw materials Tipo de Móvel produzido Type of Furniture Produced Unid. Units Consumidores Consumers Freq. Freq. Cons. Médio Average Consum. Consumo Total Total Consumption Part. % Part. % Madeira / Wood m3 11.990 100,0% 598,8 7.179.612 100,0% Chapas de aglomerado Sheets of particleboard m3 1.646 13,7% 725,7 1.194.502 16,6% Chapas de fibra dura Sheets of hard fiber m3 3.423 28,5% 99,9 341.958 4,8% Chapas de MDF Sheets of MDF m3 6.652 55,5% 213,4 1.419.537 19,8% Madeira maciça Hardwood m3 3.713 31,0% 639,0 2.372.607 33,0% Pinus / Pinus m3 1.809 15,1% 1023,6 1.851.692 25,8% Metal / Metal ton 1.097 100,0% 108,0 118.476 100,0% Chapas de metal Sheets of metal ton 125 11,4% 363,1 45.388 38,3% Tubos de metal Tubes of metal ton 972 88,6% 75,2 73.094 61,7% Vime/ratan/semelhantes Wicker/rattan/similar ton 387 100,0% 25,4 9.830 100,0% Espuma / Foam m3 2.228 100,0% 3.569,9 7.953.737 100,0% Fonte: IEMI – Source: IEMI 51 BRASIL MÓVEIS – 2006 / FURNITURE BRAZIL - 2006 Quanto a sua origem, o mercado absorve quase que apenas matérias-primas produzidas ou originárias do país. Apenas no grupo das espumas observamos uma maior penetração de produtos importados, With regard to origin, almost all raw materials are produced or originate assim mesmo, bastante discreta (15%): in the country. Only in the foam group do we see a greater penetration of imported products, although still discrete (15%): Origem das matérias-primas consumidas Origin of consumed raw materials Origem Matéria-prima / Raw Material Nacional Importada Domestic Imported Madeira maciça / Hardwood 99,0% 1,0% Pinus / Pinus 97,1% 2,9% Aglomerado / Particleboard 97,3% 2,7% Chapas de fibra dura / Sheets of hard fiber 99,7% 0,3% MDF / MDF 97,1% 2,9% Chapa metálica / Sheets of metal 98,9% 1,1% Tubo metálico / Tubes of metal 98,3% 1,7% Plástico / Plastic 99,5% 0,5% Vime/ratan/semelhantes – Wicker/Rattan/Similar Espuma / Foam 100,0% – 85,2% 14,8% Fonte: IEMI – Source: IEMI 11. Investimentos realizados e previstos A despeito da relativa estagnação no faturamento das empresas, a taxa de investidores cresceu moderadamente em 2005 no segmento de móveis, mas com grande intensidade no segmento colchões. Em ambos os casos, os dados referentes a 2006 devem ser vistos, em 11. Investments made and projected sua maior parte, como o prosseguimento de projetos iniciados em 2005. Assim, no decorrer Despite the relative stagnation in company earnings, the number do ano, se as condições econômico-financeiras of investors grew moderately in 2005 in the furniture segment, but das empresas o permitirem, essas taxas ainda saw great intensity in the mattress segment. In both cases, 2006 data poderão crescer de forma relevante. should be viewed mostly as the continuation of projects that began in 2005. Thus, as the year goes by, if the company’s economic-financial conditions permit, these rates could still see significant growth. 52 Número de investidores segundo o tamanho das empresas Number of investors according to company size Investidores segundo o tamanho das empresas (em nº de empregados) Investors according to company size (in # of employees) Taxa de Investidores Rate of Investment Nº de Empresas(1) # of Companies(1) 2004 2005 2006 14.106 22,5% 25,0% 18,3% 1 a 4 / 1 to 4 7.291 14,8% 14,8% 7,4% 5 a 9 / 5 to 9 2.971 19,5% 22,1% 20,4% 10 a 19 / 10 to 19 2.032 34,5% 42,5% 34,5% 20 a 49 / 20 to 49 1.212 42,4% 48,5% 43,9% 50 a 99 / 50 to 99 358 45,2% 51,6% 35,5% 100 a 249 / 100 to 249 180 54,5% 63,6% 36,4% Móveis / Furniture 62 66,7% 63,6% 27,3% Colchões / Mattresses 250 e mais / More than 250 295 16,7% 27,1% 52,2% 1 a 4 / 1 to 4 101 10,0% 10,0% 60,0% 5 a 9 / 5 to 9 56 23,5% 17,6% 23,5% 10 a 19 / 10 to 19 44 20,0% 30,0% 50,0% 20 a 49 / 20 to 49 31 18,2% 18,2% 54,5% 50 a 99 / 50 to 99 25 14,3% 42,9% 42,9% 100 a 249 / 100 to 249 30 0,0% 75,0% 75,0% 100,0% 100,0% 100,0% 250 e mais / More than 250 8 Fonte: IEMI Nota: (1) Não inclui empresas sem empregados. Source: IEMI Note: (1) Does not include companies without employees. No segmento de móveis, os valores investidos em 2005 caíram 12% em relação a 2004, pressionados pelas condições macroeconômicas e a difícil evolução do faturamento. In the furniture segment, the values invested in 2005 fell 12% in Já no setor de colchões, os investimentos comparison to 2004, pressured by macroeconomic conditions and the cresceram bastante em 2005, +76%, difficult evolution in earnings. In the mattress segment, investments significando, porém, apenas um retorno aos grew a lot in 2005, +76% however, this only meant a return to the níveis normais do segmento. segment’s normal levels. Valor dos investimentos realizados e previstos Amount of investments made and projected Área de investimento Investment Area Móveis / Furniture Investimentos (em R$) / Investments (in R$) 2004 2005 2006 355.073.763 311.359.993 360.334.110 Equipamentos / Equipment 209.444.612 204.916.136 156.368.028 Instalações / Installations 133.273.105 90.990.421 193.746.248 9.111.514 9.973.766 5.971.628 Treinamento de pessoal Personnel training Processos / Processes 3.244.531 5.479.670 4.248.206 10.046.773 17.728.624 22.243.516 Equipamentos / Equipment 4.081.413 7.003.181 11.113.139 Instalações / Installations 3.723.244 8.281.529 7.305.476 924.629 1.301.814 2.079.064 1.317.487 1.142.100 1.745.837 365.120.536 329.088.617 382.577.626 Colchões / Mattresses Treinamento de pessoal Personnel training Processos / Processes Total / Total Fonte: IEMI – Source: IEMI 53 BRASIL MÓVEIS – 2006 / FURNITURE BRAZIL - 2006 Evolução dos investimentos Evolution of investments Área de investimento Evolução dos investimentos Investment Area Evolution of Investments 2004 2005 2006 Móveis / Furniture 100,0 87,7 101,5 Equipamentos / Equipment 100,0 97,8 74,7 Instalações / Installations 100,0 68,3 145,4 100,0 109,5 65,5 Processos / Processes 100,0 168,9 130,9 Colchões / Mattresses 100,0 176,5 221,4 Equipamentos / Equipment 100,0 171,6 272,3 Instalações / Installations 100,0 222,4 196,2 100,0 140,8 224,9 Processos / Processes 100,0 86,7 132,5 Total / Total 100,0 90,1 104,8 Treinamento de pessoal Personnel training Treinamento de pessoal Personnel training Fonte: IEMI – Source: IEMI Os investimentos na aquisição de novos equipamentos representaram 65,8% do total investido em 2005 no setor de móveis e 39,5% no segmento de colchões. Novas instalações absorveram em 2005, 47% dos investimentos na área de colchões e 29% na Investments in the acquisition of new equipment represented 65.8% of área de móveis. Investimentos em treinamento the total invested in 2005 in the furniture sector, and 39.5% in the mattress de pessoal e processos, são baixos na área de segment. In 2005, new installations absorbed 47% of the investments móveis (5%) e um pouco mais expressivos na in the mattress area and 29% in the furniture area. Investments in de colchões (14%). personnel training and processes are low in the furniture area (5%) and a little more expressive in the mattress segment (14%). 54 55 BRASIL MÓVEIS – 2006 / FURNITURE BRAZIL - 2006 12. Canais de distribuição No segmento de colchões, 38% dos produtos são vendidos através de lojas especializadas, independentes, franqueadas ou dos próprios fabricantes. Já nos móveis, a participação essa participação é levemente superior, 48%, mas com forte tendência a se ampliar nos próximos anos, a despeito do peso da venda 12. Channels of distribution direta, feita não só a consumidores, pessoas físicas, mas a “designers” e instituições tais In the mattress segment, 38% of the products are sold through como construtoras, consumidores pessoas specialized, independent, franchised or factory stores. With furniture, jurídicas, etc. this participation is slightly higher, 48%, but there is a strong trend for expansion over the following years despite the weight of direct sales made not only to consumers, individual taxpayers, but also to designers and institutions such as builders, corporate consumers, etc. Canais de distribuição por tipo de móvel Channels of distribution by furniture type Canais de distribuição Channels of distribution Lojas especializadas Specialized stores Lojas de departamento Department stores Na fábrica (sob desenho) In-Factory (by design) Lojas próprias/franquias Own/franchised stores Atacado / Wholesale Mercado Corporativo/Governamental Corporate/Government Market Hipermercados Hypermarkets Outros mercados internos Other domestic markets Educação / Education Exportação / Exports Total / Total Fonte: IEMI – Source: IEMI 56 Por tipo de móvel / By type of furniture Residenciais Escritórios Total Móveis Colchões Home Office Total Furniture Mattresses 31,4% 37,6% 33,0% 33,4% 31,8% 30,9% 30,1% 40,4% 11,3% 6,4% 10,6% 2,4% 4,8% 8,1% 4,7% 1,9% 1,9% 3,9% 2,9% 4,2% 1,9% 0,6% 1,9% 0,1% 1,1% 0,3% 1,0% - 0,3% 1,4% 0,6% - 0,3% 0,3% 0,4% 0,2% 15,2% 10,5% 14,8 17,4% 100,0% 100,0% 100,0% 100,0% Quatro canais básicos, respondem por pouco menos de 80% da revenda de móveis a varejo, no país. São as lojas especializadas, as lojas de departamento, as vendas diretas na fábrica sob desenho e as lojas próprias e franquias. As lojas especializadas são o canal mais importante e consistente na venda a varejo de móveis, com 33% das vendas totais. Do montante comercializado por este canal, 14% é obtido a partir de lojas mono-marcas, o que significa que estão ligadas de uma forma ou de outra a algum fabricante. Metade destes estabelecimentos, organiza-se em redes, seja atuando pesadamente em áreas geográficas circunscritas, seja espalhando-as por grandes áreas geográficas (estados, regiões ou mesmo todo o país). Elas tendem a operar grandes lojas (850 m²) que através da venda de móveis, realizam cerca de 90% de seu faturamento. O segundo canal em importância, é o das lojas de departamentos, com 30% das vendas totais. São estabelecimentos de grande porte, que vendem desde utensílios domésticos, até objetos de uso Four basic channels are responsible for just under 80% of retail pessoal. Nas departamentais, com foco em resales for furniture in the country. These are specialized stores, utensílios domésticos, os móveis, via de department stores, in-factory, customized direct sales and own and regra, disputam com os eletrodomésticos, franchised stores. Specialized stores are the most important and o posto de foco principal. Para subsistirem, consistent channel in retail sales of furniture with 33% of total sales. esses estabelecimentos, estão estruturados na Of the total amount sold by this channel, 14% is obtained from monoforma de redes e atuam em grandes regiões brand stores, which means they are somehow connected to some geográficas, com lojas de grande porte e manufacturer. Half of these establishments organize themselves as vendas apoiadas por intensas campanhas chains whether operating strongly in circumscribed geographical publicitárias, enfatizando sempre “os preços areas or spreading them about large geographical areas (states, baixos que praticam e os prazos dilatados de regions or even the whole country). They tend to operate large stores pagamento que oferecem”. Esse tipo de loja (850 m2) that obtain 90% of their earnings from furniture sales. oferece, para os produtores, pedidos bastante volumosos, mas exigem preços muito baixos The second channel in importance is department stores, with que, em tese, só poderiam ser atendidos por 30% of total sales. These are large establishments that sell from empresas de alta eficiência produtiva, o que na household appliances to personal care objects. As a rule of thumb, prática nem sempre ocorre. in department stores, furniture competes with household appliances O terceiro canal em importância é o que chamamos de vendas diretas nas fábricas sob desenho, ou sob encomenda, nas configurações e medidas desejadas pelos consumidores. Este é o canal em que operam a grande massa de marcenarias, que embora possuam, muitas vezes, instalações de padrão industrial, na verdade não produzem artigos em série, atuando comercialmente como se fossem oficinas ou artesãos. for the main focal point. In order to subsist, these establishments are structured as chains and operate in large geographic regions with large stores and sales supported by intense advertising campaigns, always emphasizing “the low prices they practice and the spread out payment plans they offer”. These stores offer producers rather large orders, but they demand very low prices, which in theory could only be attended to by companies with high productive efficiency, which is not always the case. The third channel in importance is what we call in-factory direct sales by design, or customized, in the configurations and measurements O quarto canal é o das lojas próprias e/ou franquias, que pouco a pouco vem alargando sua participação na distribuição, como alternativa para os fabricantes levarem suas marcas diretamente aos consumidores e, ainda, conseguirem uma receita maior pelo seu produto, em que pese as dificuldades e os significativos custos de operação do canal próprio. desired by the consumers. This is the channel in which the large carpentry shops operate. Although these shops often have industrial standard installations, in reality they do not produce articles in series, and commercially, they operate as if they were workshops or artisans. The fourth channel involves own stores and/or franchises that are broadening their participation in distribution little by little as an alternative for manufacturers to get their brands directly to consumers and still obtain greater revenues for their product, notwithstanding the difficulties and significant operation costs of this channel. 57 BRASIL MÓVEIS – 2006 / FURNITURE BRAZIL - 2006 Caracterização dos estabelecimentos revendedores no varejo de móveis Characterization of retail resale establishments for furniture Tipo de loja Varejo indep (em %) Rede lojas (em %) Tam. Médio (em m²) Type of store Small stores (in %) Store chain (in %) Average Size (in m2) 46,4% 53,6% 857 - 100,0% 1.065 - 100,0% 5.000 38,9% 61,1% 391 Lojas especializadas Specialized stores Lojas de departamentos Department stores Hipermercados Hypermarkets Outras lojas Other stores Fonte: IEMI – Source: IEMI Representatividade da venda de móveis no faturamento do canal Representativeness of furniture sales in channel earnings Tipo de loja / Type of store Lojas especializadas / Specialized stores 89,3% Lojas de departamentos / Department stores 51,2% Hipermercados / Hypermarkets Outras lojas / Other stores Fonte: IEMI – Source: IEMI 58 Faturamento / Earnings 3,0% 58,6% 59 BRASIL MÓVEIS – 2006 / FURNITURE BRAZIL - 2006 Vendas por tipo de produto O quadro abaixo, mostra o perfil das vendas por tipo de móvel, nos diferentes canais de distribuição. Observe-se que móveis de escritório e de sala de estar (mesas de canto, estantes para televisão, som, racks, etc.), representam o esteio das vendas em Sales by type of product hipermercados, onde pelo menos nos grandes centros, são importantes distribuidores desses The table below shows the profile of sales by type of furniture in the produtos: different channels of distribution. Observe that office and living room furniture (end tables, stands for television, sound systems, racks, etc.) represent the strong point for hypermarket sales, where at least in large centers, they operate as important distributors for these products: Distribuição das vendas por tipo de móvel comercializado Sales distribution by type of furniture sold Lojas Lojas de especializadas Departamentos Specialized stores Department stores 6,0% Dormitórios / Bedroom Tipo de móvel Hiper-Mercados Outras Lojas Hypermarkets Other Stores 10,3% 28,6% 6,2% 36,6% 35,3% - 37,8% Salas de jantar / Dining Room 22,6% 15,5% 14,3% 19,3% Salas de estar / Living Room 11,7% 12,2% 28,6% 12,4% 14,3% 14,9% - 17,1% Type of furniture Escritórios / Office Estofados Upholstered Furniture Banheiros / Bathroom 0,6% - - 0,4% Cozinhas / Kitchen 1,1% 1,8% - 1,1% 0,3% 0,3% - - 3,7% 5,5% 7,1% 3,3% 3,1% 4,3% 21,4% 2,5% 100,0% 100,0% 100,0% 100,0% Terraços/jardins Terrace/garden Outros móveis Other Furniture Colchões / Mattresses Total / Total Fonte: IEMI – Source: IEMI 60 COMÉRCIO EXTERNO BRASILEIRO BRAZILIAN FOREIGN TRADE 61 BRASIL MÓVEIS – 2006 / FURNITURE BRAZIL - 2006 Comércio Externo Brasileiro 1. Sumário Neste capítulo são analisados os resultados do comércio externo do Setor de Móveis no Brasil que, ano a ano, vem se tornando um importante canal para o escoamento da produção nacional. BRAZILIAN FOREIGN TRADE As importações de 2005 chegaram a US$ 159 milhões, enquanto que as exportações suplantaram US$ 1,0 bilhão, o que representa mais de 14% do valor da produção nacional desse mesmo ano. 1. Summary In this chapter, we analyze foreign trade results from the Furniture Sector in Brazil, which every year is becoming a more important channel for domestic production flow. Com esses resultados, o saldo da balança comercial do setor é também muito representativo, pois superou a soma de US$ 843 milhões em 2005. Estes dados se encontram detalhados nos itens que se seguem. In 2005, imports reached US$ 159 million, while exports exceeded US$ 1 billion, which represents more than 14% of national production for that same year. With these results, the sector’s balance of payments is also very 2.Importações brasileiras de móveis representative, having exceeded US$ 843 million in 2005. These data are Ao longo do período estudado (2000 a 2005), as importações de móveis se reduziram em cerca de 11%, em volumes (toneladas), e cresceram 9% em valores (US$). 2. Brazilian furniture imports shown in details in the following items. During the period studied (2000 to 2005), furniture imports fell about 11% in volume (tons) and grew 9% in value (US$). Importação de móveis em volumes (em toneladas) Furniture imports in volume (in tons) Importações brasileiras de móveis (em toneladas) Brazilian furniture imports (in tons) Tipo de móveis 2000 2001 2002 2003 2004 2005 Assentos / Seats 23.905 24.131 18.699 17.055 21.423 23.619 Móveis de metal 2.379 1.906 984 1.061 1.391 1.959 1.508 1.918 1.068 558 744 891 2.456 1.809 1.004 693 726 1.089 1.701 1.727 1.132 645 1.326 996 1.650 1.200 1.538 963 1.198 1.477 33.599 32.691 24.424 20.977 26.808 30.029 Type of furniture Metal Furniture Móveis de madeira Wood Furniture Móveis de outras matérias Furniture of other materials Partes de móveis Furniture parts Colchões / Mattresses Total / Total Fonte: SECEX/IEMI – Source: SECEX/IEMI 62 Importação de móveis em valores (em US$ 1.000) Furniture imports in values (in US$ 1,000) Importações brasileiras de móveis (em US$ 1.000) Brazilian furniture imports (in tons) Tipo de móveis Type of furniture Assentos / Seats Móveis de metal Metal Furniture Móveis de madeira Wood Furniture Móveis de outras matérias Furniture of other materials Partes de móveis Furniture parts Colchões / Mattresses Total / Total 2000 2001 2002 2003 2004 2005 115.169 117.935 94.515 88.499 127.630 138.453 8.140 5.636 3.716 3.327 3.808 6.422 5.276 4.606 2.990 2.514 1.555 3.378 5.337 3.554 1.694 1.212 1.354 2.103 6.398 4.622 3.036 2.237 3.285 3.594 5.743 4.317 3.685 2.305 3.189 5.242 146.063 140.670 109.637 100.094 140.821 159.191 Fonte: SECEX/IEMI – Source: SECEX/IEMI Preços médios na importação (em US$/Kg) Average price of Brazilian furniture imports (in US$/Kg) Preço médio das importações brasileiras de móveis (em US$/Kg) Average import prices (in US$/Kg) Tipo de móveis Type of furniture Assentos / Seats Móveis de metal Metal Furniture Móveis de madeira Wood Furniture Móveis de outras matérias Furniture of other materials Partes de móveis Furniture parts 2000 2001 2002 2003 2004 2005 4,82 4,89 5,05 5,19 5,96 5,86 3,42 2,96 3,78 3,13 2,74 3,28 3,50 2,40 2,80 4,50 2,09 3,79 2,17 1,96 1,69 1,75 1,86 1,93 3,76 2,68 22,95 34,67 2,48 3,61 Colchões / Mattresses 3,48 3,60 2,40 2,39 2,66 3,55 Total / Total 4,35 4,30 4,68 5,73 5,25 5,30 Fonte: SECEX/IEMI – Source: SECEX/IEMI 63 BRASIL MÓVEIS – 2006 / FURNITURE BRAZIL - 2006 3. Exportações brasileiras de móveis O segmento de móveis de madeira exporta quantidades significativas, sendo o maior responsável pela boa performance exportadora brasileira, observada nos últimos anos, e também na obtenção de saldos positivos na balança comercial do setor 3. Brazilian furniture exports moveleiro. The wood furniture segment exports significant quantities and is most Em valores, o segmento de móveis, aumentou suas vendas externas em 103% no período de 2000 a 2005, ao mesmo tempo em que em volumes (toneladas) este aumento foi um pouco menor, em torno de 71%. responsible for the good Brazilian export performance seen over recent years, and also for obtaining balance of payment surpluses for the furniture sector. In values, the furniture segment increased sales abroad by 103% from 2000 to 2005, whereas in volume (tons) there was a slightly smaller increase of around 71%. Exportação de móveis em volumes (em toneladas) Furniture exports in volume (in tons) Exportações brasileiras de móveis (em toneladas) Brazilian furniture exports (in tons) Tipo de móveis Type of furniture Assentos / Seats Móveis de metal Metal Furniture Móveis de madeira Wood Furniture Móveis de outras matérias Furniture of other materials Partes de móveis / Furniture parts Colchões / Mattresses Total / Total 2000 2001 2002 2003 2004 2005 24.107 25.555 21.373 29.399 46.591 48.017 8.056 7.674 5.365 8.643 8.989 8.105 243.338 245.584 266.803 352.359 458.957 417.623 779 906 673 1.373 1.761 1.508 20.282 25.199 28.524 32.700 35.361 32.532 1.384 1.463 907 984 1.615 1.744 297.948 306.380 323.645 425.458 553.273 509.529 Fonte: SECEX/IEMI – Source: SECEX/IEMI Exportação de móveis em valores (em US$ 1.000) Furniture exports in values (in US$ 1,000) Exportações brasileiras de móveis (em US$ 1.000) Brazilian furniture exports (in US$ 1,000) Tipo de móveis Type of furniture Assentos / Seats Móveis de metal Metal Furniture Móveis de madeira Wood Furniture Móveis de outras matérias Furniture of other materials Partes de móveis / Furniture parts Colchões / Mattresses Total / Total Fonte: SECEX/IEMI – Source: SECEX/IEMI 64 2000 2001 2002 2003 2004 2005 74.138 78.512 77.598 109.263 187.963 211.477 15.050 14.842 7.948 12.526 15.005 17.698 372.084 354.165 410.586 502.045 683.777 700.240 2.355 2.482 1.676 2.859 4.550 4.562 23.916 33.339 37.024 39.830 53.031 59.837 6.812 6.436 3.227 3.481 6.384 8.628 494.355 489.776 538.058 670.005 950.710 1.002.443 Pesquisas de Mercado Pesquisas Quantitativas Destinadas a medir e descrever perfis, opiniões, reações, preferências, comportamentos, hábitos e percepções de um universo (público-alvo), a partir de uma amostra estatisticamente representativa. Pesquisas Qualitativas Pesquisas de profundidade individuais ou em grupos (focus group), destinadas a fornecer subsídios à uma pesquisa quantitativa e/ou auxiliar no encaminhamento de hipóteses ou motivações. Estudos Setoriais Destinados a dimensionar, segmentar e acompanhar a evolução de cadeias produtivas e setores empresariais, a partir de indicadores econõmicos e mercadológicos Para sua empresa posicionar seus produtos e marcas, estimar o potencial de consumo, planejar investimentos, testar novos produtos e serviços, avaliar sua imagem corporativa e decidir pela melhor estratégia de mercado siga o exemplo de alguns de nossos clientes: Instituto de Estudos e Marketing Industrial Fone: 55-11-3167-3202 – [email protected] www.iemi.com.br desde 1985 65 BRASIL MÓVEIS – 2006 / FURNITURE BRAZIL - 2006 Preços médios nas exportações (US$/Kg) Average export prices (in US$/Kg) Preço médio das exportações brasileiras de móveis (em US$/Kg) Average price of Brazilian furniture exports (in US$/Kg) Tipo de móveis Type of furniture Assentos / Seats Móveis de metal Metal Furniture Móveis de madeira Wood Furniture Móveis de outras matérias Furniture of other materials Partes de móveis Furniture parts 2000 2001 2002 2003 2004 2005 3,08 3,07 3,63 3,72 4,03 4,40 1,87 1,93 1,48 1,45 1,67 2,18 1,53 1,44 1,54 1,42 1,49 1,68 3,02 2,74 2,49 2,08 2,58 3,03 1,18 1,32 1,30 1,22 1,50 1,84 Colchões / Mattresses 4,92 4,40 3,56 3,54 3,95 4,95 Total / Total 1,66 1,60 1,66 1,57 1,72 1,97 Fonte: SECEX/IEMI – Source: SECEX/IEMI 4. Resultados da balança comercial do setor de móveis 4. Balance of payment results from the furniture sector Resultados da Balança Comercial do Setor de Móveis Balance of payment results from the furniture sector Balança Comercial (em US$ 1.000) Balance of Payments (in US$ 1,000) Tipo de móveis 2000 2001 2002 2003 2004 2005 -41.031 -39.423 -16.918 20.764 60.333 73.024 6.910 9.205 4.232 9.200 11.197 11.276 366.808 349.559 407.596 499.531 682.222 696.862 -2.982 -1.072 -19 1.647 3.196 2.459 17.518 28.717 33.988 37.593 49.746 56.243 Type of furniture Assentos / Seats Móveis de metal Metal Furniture Móveis de madeira Wood Furniture Móveis de outras matérias Furniture of other materials Partes de móveis Furniture parts Colchões / Mattresses Total / Total 1.069 2.120 -459 1.176 3.195 3.387 348.292 349.106 428.422 569.911 809.889 843.251 Fonte: SECEX/IEMI – Source: SECEX/IEMI 66 O gráfico a seguir apresenta a evolução da Balança Comercial do segmento, incluindo móveis e colchões: The graph below shows the segment’s Balance of Payments evolution, including furniture and mattresses: Comércio Externo de Móveis (em milhôes de US$) Foreign Trade in Furniture (in US$ million) .00 95 84 80 670 494 490 46 000 49 49 48 4 570 58 09 00 Importações / Imports 00 00 00 Exportações / Exports 4 59 004 005 Saldos / Balances 5. Origem das importações e destino das exportações de móveis Entre os principais países de origem das importações brasileiras de móveis e colchões em 2005, destacam-se os Estados Unidos, com cerca de 30% do total, seguido da Alemanha, com 22%, e França com 12%. Com relação às exportações, os Estados Unidos absorvem quase 40% das vendas externas brasileiras, seguido da França com 10%, Reino Unido com 7% e Argentina com 5%. A União Européia, com cerca de 30% é o segundo maior destino das exportações brasileiras de móveis. 5. Origin of furniture imports and destination of furniture exports Among the main countries of origin for Brazilian furniture and mattress imports in 2005, the most prominent are the United States with about 30% of the total, followed by Germany with 22%, and France with 12%. With regard to exports, the United States absorbs almost 40% of Brazilian sales abroad followed by France with 10%, the United Kingdom with 7% and Argentina with 5%. The European Union, with almost 30%, is the second largest destination for Brazilian furniture exports. 67 BRASIL MÓVEIS – 2006 / FURNITURE BRAZIL - 2006 Principais países de origem das importações brasileiras Main countries of origin for Brazilian imports Origem das importações brasileiras de móveis (em US$ 1.000) Origin of Brazilian furniture imports (in US$ 1,000) Países / Countries 2003 Partic (%) Share (%) 2004 Partic (%) 2005 Share (%) Partic (%) Share (%) 1. Estados Unidos / United States 26.647 26,6 44.207 31,4 46.973 29,5 2. Alemanha / Germany 27.682 27,7 31.488 22,4 34.595 21,7 3. França / France 12.029 12,0 22.552 16,0 19.575 12,3 4. Espanha / Spain 8.288 8,3 9.502 6,7 12.326 7,7 5. Itália / Italy 7.151 7,1 5.207 3,7 8.739 5,5 6. China / China 1.941 1,9 4.026 2,9 8.568 5,4 417 0,4 3.290 2,3 3.966 2,5 8. Japão / Japan 2.163 2,2 3.373 2,4 3.790 2,4 9. Argentina / Argentina 3.446 3,4 2.515 1,8 3.107 2,0 10. Uruguai / Uruguay 1.574 1,6 1.739 1,2 2.902 1,8 7. Polônia / Poland 11. Suíça / Switzerland 438 0,4 1.767 1,3 2.519 1,6 12. Suécia / Sweden 278 0,3 903 0,6 1.532 1,0 92.055 91,9 130.570 92,7 148.592 93,4 8.040 8,1 10.251 7,3 10.599 6,6 100.094 100,0 140.821 100,0 159.191 100,0 Sub-total / Sub-total Outros / Others Total / Total Fonte: SECEX/IEMI – Source: SECEX/IEMI Principais países de destino das exportações brasileiras Main countries of origin for Brazilian imports Destino das exportações brasileiras de móveis (em US$ 1.000) Origin of Brazilian furniture imports (in US$ 1,000) Países / Countries 1. Estados Unidos / United States Partic (%) Share (%) 2004 Partic (%) Share (%) 2005 Partic (%) Share (%) 265.121 39,6% 372.138 39,1% 391.151 39,0% 2. França / France 80.637 12,0% 94.854 10,0% 96.136 9,6% 3. Reino Unido / United Kingdom 61.313 9,2% 92.759 9,8% 74.959 7,5% 4. Argentina / Argentina 14.606 2,2% 36.157 3,8% 50.561 5,0% 5. Espanha / Spain 15.411 2,3% 31.612 3,3% 38.564 3,8% 6. Alemanha / Germany 31.453 4,7% 41.747 4,4% 38.243 3,8% 7. Países Baixos / Netherlands 33.292 5,0% 37.798 4,0% 35.686 3,6% 8. Chile / Chile 14.463 2,2% 25.848 2,7% 31.106 3,1% 9. Porto Rico / Puerto Rico 12.628 1,9% 16.412 1,7% 19.135 1,9% 9.841 1,5% 15.395 1,6% 19.037 1,9% 10. Canadá / Canada 11. México / Mexico 12.048 1,8% 16.349 1,7% 17.178 1,7% 12. Angola / Angola 2.978 0,4% 9.684 1,0% 13.814 1,4% 13. Irlanda / Ireland 12.702 1,9% 11.052 1,2% 13.109 1,3% 14. Uruguai / Uruguay 6.522 1,0% 9.991 1,1% 12.140 1,2% 15. Venezuela / Venezuela 2.767 0,4% 6.251 0,7% 9.897 1,0% 575.780 86,0% 818.043 86,1% 860.715 85,9% 94.225 14,0% 132.667 13,9% 141.727 14,1% 670.005 100,0% 950.710 100,0% 1.002.443 100,0% Sub-total / Sub-total Outros / Others Total / Total Fonte: SECEX/IEMI – Source: SECEX/IEMI 68 2003 6. Comércio exterior de móveis por blocos econômicos Quando se examina o comércio externo do setor moveleiro, por blocos econômicos, verifica-se que a Europa Ocidental, principalmente a União Européia, é o maior fornecedor ao Brasil, vindo a seguir a América do Norte (Estados Unidos e Canadá). Já, as vendas externas do setor se destinam principalmente para a América do Norte e Europa Ocidental. 6. Foreign trade of furniture by economic bloc When the furniture sector’s foreign trade is analyzed by economic bloc, we see that Western Europe, especially the European Union, is the main supplier for Brazil, followed by North America (United States and Canada). The sector’s foreign sales are mainly destined to North America and Western Europe. Importações brasileiras por blocos econômicos Brazilian imports by economic bloc Blocos Econômicos Economic Bloc 1. Europa Ocidental Western Europe União Européia European Union 2. América do Norte North America 3. Ásia / Asia 4. América Latina Latin America Mercosul Mercosur 5. Oceania Oceania 6. Oriente Médio Middle East 7. África / Africa 8. Europa Oriental Eastern Europe Total / Total 2003 2004 2005 US$ 1.000 Partic. % US$ 1.000 Partic. % US$ 1.000 Partic. % US$ 1,000 Part. % US$ 1,000 Part. % US$ 1,000 Part. % 60.623 60,6% 79.103 56,2% 88.350 55,5% 59.457 59,4% 75.744 53,8% 84.108 52,8% 26.788 26,8% 44.521 31,6% 47.985 30,1% 6.790 6,8% 10.865 7,7% 15.775 9,9% 5.601 5,6% 6.124 4,3% 6.817 4,3% 5.137 5,1% 4.639 3,3% 6.354 4,0% 220 0,2% 101 0,1% 93 0,1% 20 0,0% 18 0,0% 88 0,1% 38 0,0% 89 0,1% 63 0,0% 14 0,0% 0 0,0% 21 0,0% 100.094 100,0% 140.821 100,0% 159.191 100,0% Fonte: SECEX/IEMI – Source: SECEX/IEMI 69 BRASIL MÓVEIS – 2006 / FURNITURE BRAZIL - 2006 Exportações brasileiras por blocos econômicos Brazilian exports by economic bloc Blocos Econômicos Economic Bloc 1. Europa Ocidental Western Europe União Européia European Union 2. América do Norte North America 3. Ásia / Asia 4. América Latina Latin America Mercosul Mercosur 5. Oceania Oceania 6. Oriente Médio Middle East 7. África / Africa 8. Europa Oriental Eastern Europe Total / Total 2003 2004 2005 US$ 1.000 Partic. % US$ 1.000 Partic. % US$ 1.000 Partic. % US$ 1,000 Part. % US$ 1,000 Part. % US$ 1,000 Part. % 287.590 42,9% 403.944 42,5% 429.322 42,8% 265.403 39,6% 352.919 37,1% 338.329 33,8% 262.417 39,2% 350.378 36,9% 334.494 33,4% 92.870 13,9% 152.277 16,0% 186.023 18,6% 23.791 3,6% 51.443 5,4% 69.311 6,9% 16.920 2,5% 28.227 3,0% 33.594 3,4% 4.799 0,7% 8.144 0,9% 10.397 1,0% 1.532 0,2% 3.592 0,4% 3.133 0,3% 565 0,1% 1.501 0,2% 1.235 0,1% 325 0,0% 106 0,0% 411 0,0% 670.005 100,0% 950.710 100,0% 1.002.443 100,0% Fonte: SECEX/IEMI – Source: SECEX/IEMI 7. Participação dos estados Os estados de São Paulo e Paraná são os maiores importadores de móveis. Esses dois estados têm uma participação de quase 85% do valor total da importação de 2005. As exportações brasileiras de móveis estão concentradas nos estados de Santa Catarina e Rio Grande do Sul, que somaram mais de 70% do valor exportado pelo país em 2005. 7. Participation by state The states of São Paulo and Paraná are the largest furniture importers. These two states participated in almost 85% of total import values in 2005. Brazilian furniture exports are concentrated in Santa Catarina and Rio Grande do Sul, which together account for more than 70% of the value exported by the country. 70 Principais estados importadores Main importing states Blocos Econômicos 2003 2004 2005 US$ 1.000 Partic. % US$ 1.000 Partic. % US$ 1.000 Partic. % US$ 1,000 Part. % US$ 1,000 Part. % US$ 1,000 Part. % 1. São Paulo 61.027 61,0% 90.043 63,9% 107.611 67,6% 2. Paraná Economic Bloc 23.489 23,5% 28.980 20,6% 27.041 17,0% 3. Rio de Janeiro 1.748 1,7% 8.123 5,8% 8.101 5,1% 4. Minas Gerais 5.203 5,2% 3.978 2,8% 4.716 3,0% 5. Espírito Santo 2.681 2,7% 3.145 2,2% 4.094 2,6% 6. Rio Grande Sul 2.413 2,4% 2.258 1,6% 1.980 1,2% 7. Bahia 1.654 1,7% 1.683 1,2% 1.935 1,2% 8. Goiás 278 0,3% 690 0,5% 995 0,6% 9. Santa Catarina 352 0,4% 756 0,5% 925 0,6% 10.Pernambuco 159 0,2% 179 0,1% 719 0,5% 99.003 98,9% 139.836 99,3% 158.116 99,3% 1.091 1,1% 985 0,7% 1.075 0,7% 100.094 100,0% 140.821 100,0% 159.191 100,0% US$ 1.000 Partic. % US$ 1.000 Partic. % US$ 1.000 Partic. % US$ 1,000 Part. % US$ 1,000 Part. % US$ 1,000 Part. % 1. Santa Catarina 332.586 49,6% 430.262 45,3% 437.743 43,7% 2. Rio Grande Sul 183.564 27,4% 278.826 29,3% 272.865 27,2% 3. Paraná 60.577 9,0% 92.151 9,7% 92.007 9,2% 4. São Paulo 42.695 6,4% 70.335 7,4% 90.816 9,1% 5. Bahia 28.930 4,3% 45.329 4,8% 68.263 6,8% 6. Minas Gerais 5.644 0,8% 9.217 1,0% 12.351 1,2% 7. Espírito Santo 3.394 0,5% 5.886 0,6% 6.431 0,6% 8. Ceará 2.291 0,3% 3.064 0,3% 4.546 0,5% 9. Maranhão 2.984 0,4% 4.320 0,5% 3.988 0,4% Sub-total Sub-total Outros / Others Total / Total Fonte: SECEX/IEMI – Source: SECEX/IEMI Principais estados exportadores Main exporting states Blocos Econômicos Economic Bloc 10. Pará Subtotal / Subtotal Outros Total / Total 2003 2004 2005 1.918 0,3% 3.911 0,4% 3.310 0,3% 664.582 99,2% 943.301 99,2% 992.319 99,0% 5.423 0,8% 7.409 0,8% 10.123 1,0% 670.005 100,0% 950.710 100,0% 1.002.443 100,0% Fonte: SECEX/IEMI – Source: SECEX/IEMI 71 BRASIL MÓVEIS – 2006 / FURNITURE BRAZIL - 2006 8. Pólos exportadores Atualmente, o setor conta com cerca de 14% de suas fábricas exportando parte do que produzem, como mostrado no quadro abaixo. 8. Export centers At present, 14% of the sector’s factories export part of what they produce, as shown in the table below. Número de exportadores Number of exporters Empresas Exportadoras / Exporting Companies Distribuição / Distribution Exportam / Export 14,1% Não Exportam / Do not export 85,9% Total / Total 100,0% Fonte: IEMI – Source: IEMI Esses exportadores assim se distribuem por pólos e regiões do país: These exporters are distributed as follows by centers and regions of the country: Segundo as regiões e pólos According to regions and centers Regiões e Pólos Regions and Centers Norte / Nordeste North / Northeast Sudeste / Southeast Base Participação Exporters Participation 49 3,9% 1.254 Base 338 5,6% 6.023 Linhares (ES) 33 11,3% 291 Colatina (ES) 0 0,0% 194 Ubá (MG) 0 0,0% 420 Bom Despacho (MG) 0 0,0% 65 Martinho de Campos (MG) 0 0,0% 0 Votuporanga (SP) 33 16,9% 194 Mirassol (SP) 33 10,1% 323 67 2,5% 2.645 1.603 27,9% 5.743 252 71,0% 355 Grande São Paulo (SP) Greater São Paulo (SP) Sul / South Arapongas (PR) Curitiba (PR) Bento Gonçalves (RS) Lagoa Vermelha (RS) São Bento do Sul (SC) Rio Negrinho (SC) Centro-Oeste / Midwest Total / Total Fonte: IEMI – Source: IEMI 72 Empresas / Companies Exportadores 0 0,0% 452 295 38,0% 775 92 40,6% 226 262 81,1% 323 98 50,7% 194 0 0,0% 757 1.989 14,1% 14.106 O gráfico a seguir apresenta os principais pólos produtores de móveis, ranqueados segundo a ocorrência de empresas que já exportam parte do que produzem: The graph below shows the main furniture producing centers ranked according to the occurrence of companies that already export part of what they produce: Pólos produtores com maior ocorrência de empresas exportadoras Producing centers with greater incidence of exporting companies São Bento do Sul (SC) 8,% 7,0% Arapongas (PR) 50,7% Rio Negrinho (SC) 40,6% Lagoa Vermelha (RS) Bento Gonçalves (RS) 8,0% Votuporanga (SP) Linhares (ES) Mirassol (SP) Grande/Greater São Paulo (SP) 6,9% ,% 0,% ,5% Suas exportações são basicamente de móveis residenciais e para escritórios. Móveis modulados e colchões figuram em menor proporção nas exportações declaradas. These exports are basically home and office furniture. Modular furniture and mattresses have smaller shares of declared exports. Distribuição das empresas exportadoras por tipo de móvel produzido Distribution of exporting companies by type of furniture produced Linha de produto / Product Lines Empresas Exportadoras / Exporting Companies Escritório / Office 18,7% Dormitório / Bedroom 16,3% Sala de Jantar / Dining Room 15,2% Sala de Estar / Living Room 15,4% Estofados / Upholstered Furniture 11,8% Banheiros Modulados / Modular Bathrooms 4,0% Cozinhas Moduladas / Modular Kitchens 7,5% Outros Móveis / Other Furniture 6,0% Colchões / Mattresses Total / Total 9,4% 14,1% Fonte: IEMI – Source: IEMI 73 BRASIL MÓVEIS – 2006 / FURNITURE BRAZIL - 2006 perspectivas PARA 2006 PERSPECTIVES FOR 2006 74 Perspectivas para 2006 1. Estimativas para o número de empresas e empregos O número de indústrias no setor de móveis no Brasil, vem apresentando contínuo crescimento anual. Este crescimento está muito concentrado em micros e pequenas empresas, que estão se formalizando, PERSPECTIVES FOR 2006 estimuladas por políticas públicas. A mesma coisa vem sendo notado no emprego do setor, 1. Estimates for the number of companies and jobs que vem apresentando crescimento anual a uma taxa média próxima a 2,5%, apesar da produção The number of furniture sector companies in Brazil has been showing nacional estar apresentando um desempenho continuous annual growth. This growth is very concentrated in micro muito fraco nos últimos 3 anos. and small companies that are becoming formal companies, motivated by public policies. The same thing has been observed in the sector’s employment, which has been showing average annual growth rates near 2.5% despite domestic production showing a weak performance over the past 3 years. Indústrias e empregos no setor de móveis e colchões no Brasil Industries and jobs in the furniture and mattress sector in Brazil Ano Indústrias(2) Evolução Empregos Evolução Year Industries Evolution Jobs Evolution 2003 14.108 100,0 217.778 100,0 2004 14.290 101,3 226.725 104,1 2005 14.401 102,1 227.648 104,5 2006 14.550 103,1 236.526 108,6 (1) Fonte: RAIS/IBGE/IEMI Notas: (1) Estimativas IEMI. (2) Não inclui empresas sem empregados. Source: RAIS/IBGE/IEMI Notes: (1) IEMI Estimates. (2) Does not include companies without employees. 2. Estimativas para o mercado de móveis em 2006 Embora o setor produtor de móveis venha apresentando um forte crescimento de suas receitas em dólares, seja na produção, seja no consumo interno, nos últimos dois anos, estes dados refletem não 2. Estimates for the 2006 furniture market mais do que uma forte apreciação da moeda nacional frente ao dólar, com efeitos danosos Although the furniture producing sector has been showing strong sobre a competitividade internacional do growth in revenues in dollars, whether for production or domestic móvel brasileiro, que começa a perder espaço consumption over the past two years, these data reflect nothing more no mercado internacional. O resultado deste than a strong appreciation of domestic currency to the dollar, with movimento, não há dúvida, está sendo sentido na harmful effects on Brazilian furniture’s international competitiveness, pele pelos produtores nacionais, que passaram which begins to lose space in the international market. The result of a ter que redirecionar seus excedentes para o this shift is no doubt being felt by national producers who began to mercado local, enfrentando uma sobre-oferta need to redirect surplus products to the domestic market and deal no varejo e uma forte compressão dos preços with excess supply in the retail market and strong compression of médios de seus produtos. their products’ average prices. 75 BRASIL MÓVEIS – 2006 / FURNITURE BRAZIL - 2006 O mercado brasileiro de móveis e colchões (US$ milhões)(1) The Brazilian furniture and mattress market (in US$ million)(1) Ano Faturamento Consumo Interno Exportação Importação Saldo Year Earnings Dom. Consumption Exports Imports Balance 2003 5.345 4.775 670 100 570 2004 5.723 4.913 951 141 810 2005 6.990 6.147 1.002 159 843 7.934 7.191 922 179 743 2006 (2) Fonte: Secex/Abimóvel/IBGE/IEMI Notas: (1) Valores diferem dos apresentados no panorama mundial porque aqui inclui colchões. (2) Estimativas IEMI, considerando a taxa cambial de R$ 2,20 por dólar para 2006. Source: Secex/Abimóvel/IBGE/IEMI Notes: (1) Values differ from those shown in world market because mattresses are included here. (2) IEMI estimates, considering an exchange rate of R$ 2.20 per dollar for 2006. Evolução do mercado brasileiro de móveis e colchões Evolution of the Brazilian market for furniture and mattresses Ano Faturamento Consumo Interno Exportação Importação Saldo Year Earnings Dom. Consumption Exports Imports Balance 2003 100,0 100,0 100,0 100,0 100,0 2004 107,1 102,9 141,9 141,0 142,1 2005 130,8 128,7 149,6 159,0 147,9 2006 148,4 150,6 137,6 179,0 130,4 Fonte: Secex/Abimóvel/IBGE/IEMI – Source: Secex/Abimóvel/IBGE/IEMI 76 Estatísticas macro-econômicas do Brasil MACROECONOMIC STATISTICS FOR BRAZIL 77 BRASIL MÓVEIS – 2006 / FURNITURE BRAZIL - 2006 Estatísticas Macro-Econômicas do Brasil Complementarmente ao estudo do setor produtor de móveis no Brasil, o IEMI apresenta as principais estatísticas macro-econômicas do país, a título de informação, ou mesmo de comparação, àqueles que se utilizam desta publicação como MACROECONOMIC STATISTICS FOR BRAZIL fonte para as suas análises. Complementary to the study of the furniture producing sector in Brazil, the IEMI shows the main macroeconomic statistics of the country for information purposes, or even for comparison, to those who make use of this publication as a source for analyses. ESTATÍSTICAS MACRO-ECONÕMICAS DO BRASIL MACROECONOMIC STATISTICS FOR BRAZIL Principais Indicadores Indicators 2002 2003 2004 2005 173.822 176.391 178.985 181.586 184.184 1.199 1.346 1.556 1.767 1.938 510 459 507 604 796 População Population (em milhões) (in millions) PIB (R$ bilhões) GNP (R$ billions) PIB (US$ bilhões) GNP (US$ billions) PIB per capita (R$) GNP per capita (R$) 6.896 7.631 8.694 9.729 10.520 PIB per capita (US$) GNP per capita (US$) 2.932 2.604 2.831 3.326 4.322 Inflação (%) Inflation (%) 7,67 12,53 9,3 7,6 5,69 58,2 60,3 73,1 96,5 118,3 (1) Exportação (US$ bi) (1) Exportation (US$ bi) Exportação/PIB (%) Exportation/GNP (%) 11,4 13,1 14,4 16,0 14,9 Importação (US$ bi) Importation (US$ bi) 55,6 47,2 48,3 62,8 73,6 Importação Importation PIB (%) GNP (%) 10,9 10,3 9,5 10,4 9,2 Saldo balança comercial Commercial trade balance (US$ bi) (US$ bi) 2,6 13,1 24,8 33,7 44,7 2,35 2,93 3,07 2,93 2,43 22,5 16,6 10,1 18,2 15,2 35,9 37,8 49,3 52,9 53,8 7,0 8,2 9,7 8,7 6,8 530 654,3 726,7 818,1 952,2 44,2 48,6 46,7 46,2 49,1 162,7 164,8 151 135,7 101,1 31,9 35,9 29,8 22,4 12,7 6,2 10,5(4) 10,9 9,6 8,3 Taxa câmbio Exchange rate (R$/US$) (R$/US$)(2) Investimento ext. direto Direct external (US$ bi) investments (US$ bi) Reservas internacionais International reserves (US$ bi) (US$ bi) (2) Reservas/PIB (%) Reserves/GNP (%) Dívida interna líquida Internal net debt (R$ bi)(3) (R$ bi)(3) Dívida interna líquida Internal net debt PIB % GNP % Dívida externa líquida total Total net external debt (US$ bi) (US$ bi) Divida externa External debt PIB (%) GNP (%) Taxa de Unempolyment desemprego (%) rate (%) Fontes: IBGE/Banco Central do Brasil Notas: (1) IPCA-IBGE. (2) Média anual da taxa de venda. (3) Dívida interna líquida do setor público. (4) Alteração de critério em 2002. 78 2001 Sources: IBGE/Brazilian Central Bank Notes: (1) IPCA-IBGE. (2) Annual sales rates average. (3) Internal net debt of the public sector. (4) Change in 2002 the criteria. 596 Empresas do setor de móveis no brasil 596 COMPANIES IN THE BRAZILIAN FURNITURE SECTOR 79 BRASIL MÓVEIS – 2006 / FURNITURE BRAZIL - 2006 Região Sul South Region Nº # 80 Empresas / Companies Sede / City 1 A M DOS SANTOS MÓVEIS Maringá 2 ADEMIR WOLFF - ME 3 ADS ARAMADOS E TUBULARES LTDA. 4 UF Contato / Contact State PR 55 44 3267-8633 Gramado RS 55 54 3286-8522 Jaraguá do Sul SC 55 47 3370-4988 ÁGUIA SISTEMAS DE ARMAZENAGEM S.A. Ponta Grossa PR www.aguiasistemas.com.br 5 ANTARES MÓVEIS LTDA. Lagoa Vermelha RS www.antaresmoveis.com.br 6 ANTONIO PAULO DA SILVA MÓVEIS Canela RS 55 54 3282-3232 7 ARAMÓVEIS IND. REUNIDAS DE MÓVEIS E EST LTDA. Arapongas PR www.aramoveis.com.br 8 ARAPLAC - IND. COM. DE MÓVEIS LTDA. Arapongas PR 55 43 3276-2355 9 ARTESANATO CENTENARIO LTDA. Torres RS www.centenarte.com.br 10 ARTESANO MÓVEIS LTDA. Bento Gonçalves RS www.artesano.com.br 11 ARTESTILO LTDA. São Bento do Sul SC 55 47 3633-5568 12 AUGUSTO STOCCO Curitiba PR 55 41 3246-2434 13 AVI MÓVEIS LTDA. Gramado RS 55 54 3286-3538 14 BARCELLONA IND. COM. DE MÓVEIS LTDA. Lagoa Vermelha RS www.barcellonamoveis.com.br 15 BEDAME TORNEADOS LTDA. Bento Gonçalves RS www.bedame.com.br 16 BEL METAIS MÓVEIS LTDA. Rio Negrinho SC 55 47 3644-8294 17 BENFATTO MÓVEIS LTDA. Bento Gonçalves RS www.benfatto.com.br 18 BERTOLINI S.A. Bento Gonçalves RS www.bertolini.com.br 19 BERTON IND. DE MÓVEIS LTDA. Guaramirim SC www.berton.com.br 20 BIG MOON IND. DE MÓVEIS LTDA. Farroupilha RS 55 54 3261-0500 21 BRASIL SUL ESTOFADOS E DECORAÇÕES LTDA. Arapongas PR 55 43 3276-3180 22 BRAZIMÓVEIS LTDA. Santa Cecília SC 55 49 3244-2325 23 CADERODE MÓVEIS PARA ESCRITÓRIO LTDA. Flores da Cunha RS www.caderode.com.br 24 CARIBE LTDA. Francisco Beltrão PR 55 46 3524-2625 25 CELULOSE IRANI S.A. Rio Negrinho SC www.irani.com.br 26 CENTRAL GS IND. COM. DE MÓVEIS LTDA. Garibaldi RS www.centralgs.com.br 27 CINEX IND. DO MOBILIARIO LTDA. Bento Gonçalves RS www.cinex.com.br 28 COMPACE ARTEFATOS DE MADEIRA LTDA. Cascavel PR 55 45 3223-8131 29 COMPANHIA DE MÓVEIS TRÊS S.A. Bento Gonçalves RS www.moveistres-s.com.br www.conforflex.com.br 30 CONFORFLEX MÓVEIS LTDA. Estrela RS 31 COTONIPE MÓVEIS LTDA. Bento Gonçalves RS www.cotonipe.com.br 32 COZINHAS DAL MOBILE LTDA. Bento Gonçalves RS 55 54 3453-4488 55 54 3282-2482 33 D & C MÓVEIS LTDA. Canela RS 34 DECORMASI IND. COM. DE MADEIRAS LTDA. Curitiba PR 55 41 3278-0361 35 DIVICAR MÓVEIS LTDA. Lagoa Vermelha RS www.divicar.com.br 36 DORMEBEM COLCHÕES E ESPUMA LTDA. Janiópolis PR 55 44 3553-1648 37 DOSSIN, ONZI & CIA LTDA. Caxias do Sul RS www.moveisdossin.com.br 38 ECOFLEX FAB. DE ESPUMAS E COLCHÕES LTDA. São Bento do Sul SC www.ecoflexnet.com.br 39 ESTOBEL IND. DE ESTOFADOS LTDA. Farroupilha RS www.estobel.com 40 ESTOFADOS ADHE-MAR LTDA. Farroupilha RS www.estofadosklassic.com.br 41 ESTOFADOS DORIGON LTDA. Farroupilha RS www.dorigon.com.br 42 ESTOFADOS GERMANIA LTDA. Nova Petrópolis RS www.germania.com.br 43 ESTOFADOS GRANDO LTDA. Farroupilha RS www.estofadosgrando.com.br 44 ESTOFADOS HAVAI LTDA. Bento Gonçalves RS 55 54 3454-9822 45 ESTOFADOS ORYON LTDA. Umuarama PR 55 44 3639-7273 46 ESTOFADOS SOFANI LTDA. Bento Gonçalves RS www.sofani.com.br 47 ESTOFADOS SULANDES LTDA. Farroupilha RS www.sulandes.com.br 48 ETELMIR BUFON - ME Coronel Freitas SC 55 49 3347-0569 • • • • • • • • • • • • • • • • • • • • • • • 5 • 1.997 12 6 1.973 300 7 • • • 1.976 377 8 • 1.984 46 9 • 1.982 189 10 • 1.984 58 • 13 • 1.998 90 • 14 • 1.994 14 • 2.001 25 • • 1.998 10 • 17 • • 1.972 730 • 18 • • 2.000 33 • 2.001 44 • 1.994 37 • 1.999 170 • • 1.994 40 • 23 • 1.998 67 • 24 • 25 • 27 • • • • • • • • • • • • • • • • • • • • 21 22 116 1.994 28 28 • 1.966 80 29 • 1.996 130 • 30 • 1.987 100 • 31 • 1.977 82 • 32 • 2.004 90 • 1.994 7 • 1.993 87 2.000 12 1.974 23 1.987 150 • 38 • 39 • • • 26 33 34 • 35 36 37 • 1.986 90 • • 1.992 56 • • 1.966 60 • 41 • • • • 20 • • 40 1.976 69 • 42 1.979 54 • 43 • 1.993 8 44 • 2.002 95 45 • 1.993 13 46 1.973 133 2.000 4 • • • • 1.991 • • • 19 • • • 16 40 • • 15 306 • • 12 1.999 • • 11 1.994 • • • • • • • Exporta Export 94 4 • • Nº de Funcionários Number of Employees 1.996 113 • • Fundação Foundation 4 • 3 1.972 • • Outras Others • 1.966 • • Espuma Spume 595 • • • Plástico Plastic 1.988 • • 2 36 11 • • 1 1.994 • • • 2 1.996 • • • 2.001 • • • Vime - Ratan Wattle - Rattan • • Nº # Material / Material • • Metal Metal Madeira Wood Colchões Mattresses Partes de Móveis Furniture parts Institucionais Institutionals Terraços - Jardins Terrace - Gardens Cozinha - Banheiro Kitchen - Bathroom Estofados Upholsters Salas de Estar Living Room Salas de Jantar Room dinners Escritórios Offices Dormitórios Bedrooms Principais Produtos / Main products • • • 47 48 81 BRASIL MÓVEIS – 2006 / FURNITURE BRAZIL - 2006 Região Sul South Region Nº # 82 Empresas / Companies Sede / City UF Contato / Contact State 49 EVANDRO CAMARGO TRENTO - ME Umuarama PR 55 44 3622-2057 50 EVIDÊNCIA MÓVEIS LTDA. Lagoa Vermelha RS 55 54 3358-2930 51 EVISA - METALÚRGICA LTDA. Curitiba PR www.evisa.com.br 52 FA MARINGA LTDA. Maringá PR www.famaringa.com.br 53 FAB. DE COLCHÕES SORRISO DO LAR LTDA. Maringá PR 55 44 3222-8211 54 FAB. DE ESP. E COLCHÕES NORTE PARANAENSE LTDA. Arapongas PR www.ortobom.com.br 55 FAB. DE MÓVEIS FLORENSE LTDA. Flores da Cunha RS www.florense.com.br 56 FAB. DE MÓVEIS RIO NEGRINHO LTDA. Rio Negrinho SC www.famorine.com.br 57 FÉLIX & CAVALIERI LTDA. Umuarama PR 55 44 3623-2024 58 FLEXMOLD IND. COM. DE COLCHÕES E ESPUMAS LTDA. Colombo PR 55 41 3663 6072 59 FRANCISCO SERGIO NUNES - ME Canela RS 55 54 3282-2651 60 FRIONE COM. DE REFRIGERACÃO LTDA. Curitiba PR www.frione.com.br 61 FRITZ MÓVEIS LTDA. Mafra SC www.fritzmoveis.com.br 62 G M SANTOS ESPUMAS LTDA. Araranguá SC 55 48 3524-2847 63 GIOSUL ARAMADOS LTDA. Garibaldi RS www.giosul.com.br 64 GLOBO COLCHÕES LTDA. Glorinha RS www.ciadosono.com.br 65 GRALHA AZUL IND. COM. LTDA. Arapongas PR www.gralha-azul.ind.br 66 GRAMITO MÓVEIS E DECORACÕES LTDA. Gramado RS 55 54 3286-2758 67 GRANDELAR IND. METALÚRGICA LTDA. Garibaldi RS www.grandelar.com.br 68 GULI DECORAÇÕES LTDA. Cascavel PR 55 45 3228-2244 69 HABG MÓVEIS LTDA. Garibaldi RS www.sleeper.com.br 70 INAPRAM MÓVEIS LTDA. Bento Gonçalves RS www.inapram.com.br 71 INCEMA IND. COM. DE MÓVEIS LTDA. São José SC www.incema.com.br 72 INCOFAL IND. COM. LTDA. Xanxerê SC 55 49 3433-1373 73 IND. ARTEFAMA S.A. São Bento do Sul SC www.artefama.com.br 74 IND. COM. DE MÓVEIS AGARDI LTDA. Araranguá SC www.darabasagardi.com.br 75 IND. COM. DE MÓVEIS ARENGUE LTDA. Londrina PR 55 43 3338-9959 76 IND. COM. DE MÓVEIS DAIAL LTDA. Coronel Freitas SC 55 49 3347-0471 77 IND. COM. DE MÓVEIS MADECLAP LTDA. Francisco Beltrão PR 55 46 3524-2506 78 IND. COM. DE MÓVEIS WARM LTDA. Londrina PR 55 43 3337-6045 79 IND. DE ESTOFADOS ITALIA LTDA. Farroupilha RS www.estofadositalia.com.br 80 IND. DE MÓVEIS 3 IRMÃOS S.A. Campo Alegre SC 55 47 3632-9000 81 IND. DE MÓVEIS AMERICA LTDA. São Bento do Sul SC www.americamoveis.com.br 82 IND. DE MÓVEIS B & B LTDA. Veranópolis RS 55 54 3441-4322 83 IND. DE MÓVEIS CLAYR LTDA. Erechim RS 55 54 3522-1713 84 IND. DE MÓVEIS GREGO LTDA. Caxias do Sul RS www.moveisgrego.com.br 85 IND. DE MÓVEIS M K LTDA. Erechim RS 55 54 3321-5551 86 IND. DE MÓVEIS RIZZON LTDA. São Marcos RS www.imrizzon.com.br 87 IND. DE MÓVEIS SILVA SANTOS LTDA. Viamão RS 55 51 3054-5400 88 IND. DE MÓVEIS THB LTDA. Camacuã RS www.moveisthb.com.br 89 IND. METALÚRGICA TUMAR LTDA. Garibaldi RS www.tumar.com.br 90 IND. ZIPPERER LTDA. São Bento do Sul SC www.zipperer.com.br 91 INOVARE MÓVEIS E DIVISÓRIAS LTDA. Porto Alegre RS www.inovare.com.br • • • • • • • Exporta Export • 52 1.995 20 391 • • 1.966 38 53 • • 1.998 391 54 • 1.953 780 • 55 • 1.970 300 • 56 1.996 14 57 1.997 6 58 • • • • • • 1.989 6 59 10 60 1.986 200 • 1.987 42 62 • 1.995 10 63 • 1.997 52 1.989 400 • • • • • • • • 51 2.000 • • • 50 1.966 • • 49 • • • • Nº de Funcionários Number of Employees 40 • • • Fundação Foundation 17 1.999 • • • Outras Others 1.997 • • • Espuma Spume Plástico Plastic Vime - Ratan Wattle - Rattan • • • Nº # Material / Material • • Metal Metal Madeira Wood Colchões Mattresses Partes de Móveis Furniture parts Institucionais Institutionals Terraços - Jardins Terrace - Gardens Cozinha - Banheiro Kitchen - Bathroom Estofados Upholsters Salas de Estar Living Room Salas de Jantar Room dinners Escritórios Offices Dormitórios Bedrooms Principais Produtos / Main products 1.992 32 1.980 160 • 61 64 • 65 66 • 67 • 1.996 9 • • 1.982 100 • • • 1.985 76 • 70 • • 1.984 100 • 71 • • • • • • • 180 74 7 75 • 1.995 47 76 • 2.000 10 77 • 1.994 8 78 • • • • • • • • 1.979 32 • 79 • 1.971 386 • 80 • 1.977 360 • 81 • 1.990 50 • 82 • 1.999 4 83 • 1.983 4 84 • 1.978 10 • • • 1.983 93 • 86 • • • 1.975 70 • 87 • • 1.993 74 • 88 • • • • • 73 1.997 • • 72 1.260 1.998 • • 2 1.966 • • • 2.000 • • • • • • • • 69 • • • • 68 • • • • • • • 85 1.992 46 • 89 1.970 258 • 90 1.992 65 91 83 BRASIL MÓVEIS – 2006 / FURNITURE BRAZIL - 2006 Região Sul South Region Nº # 84 Empresas / Companies Sede / City UF Contato / Contact State 92 INTERDESIGN MÓVEIS LTDA. Caxias do Sul RS www.saccaro.com.br 93 INTERIOR MÓVEIS E DECORAÇÕES LTDA. Rio Negrinho SC 55 47 3644-3741 94 IPEL MÓVEIS PERSONALIZADOS LTDA. Caxias do Sul RS 55 54 3213-1409 95 ITALINEA IND. DE MÓVEIS LTDA. Bento Gonçalves RS www.italinea.com.br 96 J FLORES & CIA LTDA. Curitiba PR 55 41 3247-1103 97 J MARCON IND. COM. DE MÓVEIS LTDA. São Marcos RS www.jmarcon.com.br 98 JANDAIA IND. MOVELEIRA LTDA. Jandaia do Sul PR 55 43 3432-2318 99 JCC TOIGO S.A. IND. COM. DE MÓVEIS Flores da Cunha RS 55 54 3292-9500 100 K C G IND. COM. DE MADEIRA LTDA. Umuarama PR 55 44 3639-2535 101 KENDY MÓVEIS LTDA. Paraí RS www.kendymoveis.com.br 102 LÍDER LAR ESTOFADOS E COLCHÕES LTDA. Araruna PR www.liderlar.com.br 103 LIMANSKY DO BRASIL IND. COM. LTDA. Bento Gonçalves RS www.limansky.com 104 LINEA BRASIL IND. COM. DE MÓVEIS LTDA. Arapongas PR www.lineabrasil.com.br 105 LINTZ MÓVEIS EM ARTE IND. COM. LTDA. São José SC www.lintz.com.br 106 LUIZ GAIGNER & CIA LTDA. Arapongas PR 55 43 3252-7301 107 LUMINAR DESIGN IND. COM. DE MÓVEIS LTDA. Arapongas PR 55 43 3276-6236 108 LUSTRADORA BRILUX LTDA. São Bento do Sul SC 55 47 3635-1222 109 M C COMPONENTES PARA MÓVEIS DE ESCRITÓRIO LTDA. Caxias do Sul RS www.mccomponentes.com.br 110 MADARCO S.A. - IND. COM. Caxias do Sul RS www.madarco.com.br 111 MADECENTER MÓVEIS LTDA. Bento Gonçalves RS 55 54 3451-2255 112 MADEIREIRA HERVAL LTDA. Dois Irmãos RS www.herval.com.br 113 MADELLEGNO MÓVEIS LTDA. Bento Gonçalves RS www.madellegno.com.br 114 MADEM S.A. IND. COM. DE MADEIRAS E EMBALAGENS Garibaldi RS www.madem.com.br 115 MAIBE IND. COM. DE MÓVEIS LTDA. Gramado RS www.maibemoveis.com.br 116 MAKTUB IND. COM. ARTEFATOS DE TUBOS LTDA. Curitiba PR www.maktubmoveis.com.br 117 MANBEL MÓVEIS LTDA. Lagoa Vermelha RS www.manbelmoveis.com.br 118 MANNES LTDA. Guaramirim SC www.mannes.com.br 119 MARCENARE IND. DE MÓVEIS E DECORAÇÕES LTDA. Curitiba PR 55 41 3286-1918 120 MARCENARIA SULAR LTDA. Caxias do Sul RS www.sular.com.br 121 MAREL IND. DE MÓVEIS S.A. Francisco Beltrão PR www.marel.com.br 122 MARELLI MÓVEIS PARA ESCRITÓRIO LTDA. Caxias do Sul RS www.marelli.com.br 123 MARINI MÓVEIS LTDA. Flores da Cunha RS 55 54 3292-7051 124 MARTINUCCI DO BRASIL MÓVEIS PARA ESCRITÓRIO LTDA. Sarandi PR www.martinucci.com.br 125 MASUTTI COPAT CIA LTDA. Bento Gonçalves RS www.masutticopat.com.br 126 MATREZAN IND. DE MÓVEIS LTDA. Nova Araça RS www.matrezan.com.br 127 MATRIX IND. COM. DE MÓVEIS LTDA. Arapongas PR 55 43 3276-6256 128 MEBELFLEX IND. COM. DE MÓVEIS E SERVIÇOS Cachoeira do Sul RS www.mebelflex.com.br 129 MENEGOLLA MÓVEIS E DECORAÇÕES LTDA. Caxias do Sul RS www.menegolla.com.br 130 METALÚRGICA MASCARELLO LTDA. Flores da Cunha RS www.cadeirasmascarello.com.br 131 METALÚRGICA MAZZOCCO LTDA. Farroupilha RS 55 54 3458-7055 132 METALÚRGICA MEDALFO LTDA. Nova Bassano RS 55 54 3273-1516 133 METALÚRGICA UNIVERSO LTDA. Alvorada RS www.universomoveis.com 134 METALÚRGICA VILLARTE LTDA. Garibaldi RS 55 54 3463-8484 • Exporta Export Nº de Funcionários Number of Employees Fundação Foundation Outras Others Espuma Spume Plástico Plastic Vime - Ratan Wattle - Rattan Metal Metal Madeira Wood Colchões Mattresses Partes de Móveis Furniture parts Institucionais Institutionals Terraços - Jardins Terrace - Gardens Cozinha - Banheiro Kitchen - Bathroom Estofados Upholsters Salas de Estar Living Room Salas de Jantar Room dinners Escritórios Offices Dormitórios Bedrooms Principais Produtos / Main products Nº # Material / Material • • • 1.946 260 • 1.996 8 • 92 93 • • • 1.981 3 • • • 1.997 65 • • • 1.986 2 • • 1.984 94 • 97 • 1.997 48 • 98 • 1.950 200 • 99 • 101 • • • • • • • • • • • • 100 • 1.986 100 • 1.996 105 • 103 1.992 160 • 104 • • • • • • 96 • • • 27 20 95 • • • 1.997 1.993 94 • 102 1.996 40 105 • 1.999 10 106 • 2.002 20 • 1.979 8 • • 107 • 108 • 110 2.000 29 • • 1.966 270 • • 1.976 41 • • 1.982 1.723 • • 1.987 72 • 113 • 1.966 150 • 114 1.998 10 115 1.991 5 116 • • • • • • • • • • • • • • • • • • • • • • • • • • • • • • • • • 117 • 118 8 119 55 120 • 1.967 300 121 • 1.983 150 • 122 • 1.967 106 • 123 1.984 118 • 124 1.980 80 • 125 • 1.992 150 • 126 • 2.000 381 • 1.995 32 • 1.981 40 • 1.990 10 130 • 1.977 16 131 • 1.993 14 • 132 1.966 70 • 133 1.994 28 • • • 69 364 1.977 • • 1.993 1.972 1.994 • • 112 • • • 111 • • • 109 • • 127 • 128 129 134 85 BRASIL MÓVEIS – 2006 / FURNITURE BRAZIL - 2006 Região Sul South Region Nº # 86 Empresas / Companies Sede / City UF Contato / Contact State 135 MEZZOM MÓVEIS LTDA. Gramado RS www.mezzom.com 136 MF IND. COM. PLÁSTICOS REFORÇADOS LTDA. Caxias do Sul RS www.moveismf.com.br 137 MILAMÓVEIS LTDA. Rio Negrinho SC 55 47 3644-2500 138 MOBILAR IND. COM. DE MÓVEIS LTDA. Flores da Cunha RS 55 54 3292-2740 139 MOBISUL IND. MOVELEIRA DO PARANÁ LTDA. Rolândia PR 55 43 3256-7018 140 MOBITEC IND. DE MÓVEIS LTDA. Bento Gonçalves RS www.mobitecmoveis.com.br 141 MODULAQUE IND. COM. DE MÓVEIS LTDA. Maringá PR 55 44 3267-1331 142 MONTANHEZ MÓVEIS DECORAÇÕES LTDA. Gramado RS 55 54 3286-3493 143 MOVAL MÓVEIS ARAPONGAS LTDA. Arapongas PR www.moval.com.br 144 MÓVEIS ARMIL LTDA. Gramado RS www.moveisarmil.com.br 145 MÓVEIS BENTEC LTDA. Bento Gonçalves RS www.bentec.com.br 146 MÓVEIS BOSI LTDA. Bento Gonçalves RS www.bosi.com.br 147 MÓVEIS BRASTUBO LTDA. Bento Gonçalves RS www.moveisbrastubo.com.br 148 MÓVEIS CAPANEMA LTDA. Cascavel PR 55 45 3228-3233 149 MÓVEIS CARRARO S.A. Bento Gonçalves RS www.carraro.com.br 150 MÓVEIS CASTRO LTDA. Taquari RS www.moveiscastro.com.br 151 MÓVEIS CENCI LTDA. Bento Gonçalves RS www.moveiscenci.com.br 152 MÓVEIS CIVARDI LTDA. Muçum RS www.decibal.com.br 153 MÓVEIS CONSULAR S.A. São Bento do Sul SC 55 47 3634-1197 154 MÓVEIS DALLA COSTA LTDA. Bento Gonçalves RS www.dallacosta.com.br 155 MÓVEIS DEL REY LTDA. Antonio Prado RS www.moveisdelrey.com.br 156 MÓVEIS ELEANDRE IND. COM. LTDA. Jaraguá do Sul SC 55 47 3376-1497 157 MÓVEIS FERRARTE LTDA. Bento Gonçalves RS www.ferrarte.com.br 158 MÓVEIS FOSCARINI LTDA. Antonio Prado RS www.moveisfoscarini.com.br 159 MÓVEIS GAUDÊNCIO LTDA. Restinga Seca RS www.gaudencio.com.br 160 MÓVEIS IRMAOS MARCADENTI LTDA. Gramado RS 55 54 3286-8181 161 MÓVEIS JOR LTDA. Rio Negro PR www.moveisjor.com.br 162 MÓVEIS KAPPESBERG LTDA. Tupandi RS www.kappesberg.com.br 163 MÓVEIS KATZER LTDA. São Bento do Sul SC 55 47 3634-1378 164 MÓVEIS LUSTRO LTDA. Gramado RS www.moveislustro.com.br 165 MÓVEIS MAGNUS LTDA. Gramado RS www.moveismagnus.com.br 166 MÓVEIS MASOTTI LTDA. Gramado RS www.masotti.com.br 167 MÓVEIS MORO LTDA. Curitiba PR 55 41 3262-7345 168 MÓVEIS PELIZZER LTDA. Bento Gonçalves RS 55 54 3451-2088 169 MÓVEIS POMZAN S.A. Bento Gonçalves RS www.pomzan.com.br 170 MÓVEIS PONZONI LTDA. Nova Prata RS 55 54 3242-1890 171 MÓVEIS RODIAL LTDA. Lagoa Vermelha RS www.rodial.com.br 172 MÓVEIS ROHDE LTDA. Restinga Seca RS www.rohde.com.br 173 MÓVEIS RUDNICK S.A. São Bento do Sul SC www.rudnick.com.br 174 MÓVEIS RUECKL LTDA. Rio Negrinho SC 55 47 3644-2469 175 MÓVEIS SANDRIN LTDA. Bento Gonçalves RS www.sandrin.com.br 176 MÓVEIS SERRALTENSE LTDA. São Bento do Sul SC www.serraltense.com.br 177 MÓVEIS SRM LTDA. Restinga Seca RS 55 55 3261-1922 • • • • • • • • • • • • • • • 7 • 2.004 150 • 139 • 1.982 30 • 140 • 141 1.967 916 • 143 • 1.985 85 • 144 • • 1.976 134 • • 1.983 36 • 146 1.994 3 147 • 1.996 10 • 1.969 700 • 149 148 1.986 211 • 150 • 1.992 60 • 151 • • 1.992 64 • 152 • 1.972 120 • 153 • 1.986 105 • 154 • 1.994 38 • 155 • 157 • 159 • • • • • 145 • • • 142 • • • 138 • • • 137 8 • • • 227 • • Exporta Export 211 1.994 136 1.993 • • 135 1.974 • • Nº de Funcionários Number of Employees 1.998 • • • Fundação Foundation • • • • • • Outras Others 58 25 • • Espuma Spume 1.990 1.977 • • • Plástico Plastic • • Nº # Material / Material • • Vime - Ratan Wattle - Rattan Metal Metal Madeira Wood Colchões Mattresses Partes de Móveis Furniture parts Institucionais Institutionals Terraços - Jardins Terrace - Gardens Cozinha - Banheiro Kitchen - Bathroom Estofados Upholsters Salas de Estar Living Room Salas de Jantar Room dinners Escritórios Offices Dormitórios Bedrooms Principais Produtos / Main products • 1.994 5 1.987 77 156 • 1.975 40 • 1.973 120 • 1.995 27 • 1.976 160 • 161 • 1.995 350 • 162 • 1.985 340 • 163 • 1.976 60 • • 1.990 25 • • 1.959 150 • 1.966 8 167 • 1.991 2 168 • 1.969 105 • 169 • 1.981 450 • 170 • • 1.968 92 • 171 • • 1.966 60 • 172 1.998 1.150 • 173 1.966 350 • 174 • • • • • • • • • • • • • • • • • • • • • • • • • • • • • • • • • • • • • • • • • • • • • • • • • • • • • 158 160 164 165 • 166 1.971 240 • 175 1.966 200 • 176 1.999 30 • 177 87 BRASIL MÓVEIS – 2006 / FURNITURE BRAZIL - 2006 Região Sul South Region Nº # 88 Empresas / Companies Sede / City UF Contato / Contact State 178 MÓVEIS SUL IND. COM. LTDA. Lagoa Vermelha RS www.moveissul.com.br 179 MÓVEIS TOGO LTDA. Curitiba PR 55 41 3323-2416 180 MÓVEIS TREMARIN LTDA. Farroupilha RS www.tremarin.com.br 181 MÓVEIS VASCARI LTDA. Bento Gonçalves RS www.primadesign.com.br 182 MÓVEIS WALFRIDO LTDA. São Bento do Sul SC 55 47 3635-1333 183 MÓVEIS WEIHERMANN S.A. São Bento do Sul SC 55 47 3635-0733 184 MÓVEIS WINGERT LTDA. Gramado RS 55 54 3286-8446 185 MOVINT MÓVEIS LTDA. Caxias do Sul RS www.movint.com.br 186 MSUL IND. DE MÓVEIS LTDA. Paraí RS www.msulmoveis.com.br 187 MULTICENTER IND. DE MÓVEIS LTDA. Bento Gonçalves RS www.multicentermoveis.com.br 188 MULTICLASSE COLCHÕES E ESPUMA LTDA. Maringá PR 55 44 3222-8675 189 MULTIMÓVEIS IND. DE MÓVEIS LTDA. Bento Gonçalves RS www.multimoveis.com 190 MULTISPUMA IND. COM. LTDA. Caxias do Sul RS www.multispuma.com.br 191 NACIONAL CHIK LTDA. Toledo PR 55 45 3252-7235 192 NASA INDL. IMP E EXP DE MANUFATURADOS LTDA. Campo Alegre SC 55 47 3632-2044 193 NF TORNEADOS LTDA. Bento Gonçalves RS 55 54 3452-2079 194 NICIOLI IND. COM. DE MÓVEIS LTDA. Arapongas PR www.nicioli.com.br 195 NIROFLEX IMP E EXP LTDA. Arapongas PR www.niroflex.com.br 196 ODIVALDO GASPAROTO - MÓVEIS Sarandi PR www.sanecmoveis.com.br 197 P PROJETO IND. DE MÓVEIS E CADEIRAS LTDA. Venâncio Aires RS www.moveisprojeto.com.br 198 PAULO NATAL CAPALONGA & CIA LTDA. Encantado RS www.moveisrodeio.com.br 199 PEDRO GUBIANI E FILHO LTDA. Cascavel PR 55 45 3224-8905 200 PERFEZIONE IND. DE MÓVEIS LTDA. Bento Gonçalves RS 55 54 3451-8684 201 PIELLO IND. COM. DE MÓVEIS LTDA. Garibaldi RS 55 54 3462-4700 202 PILATI MÓVEIS LTDA. São Marcos RS www.pilati.com.br 203 PLASCARI IND. PLÁSTICA LTDA. Bento Gonçalves RS www.plascari.com.br 204 POLIBRILHO IND. DE METAIS FINOS LTDA. Bento Gonçalves RS 55 54 3451-2399 205 POLIMAN IND. COM. DE MÓVEIS LTDA. Arapongas PR 55 43 3274-6316 206 POLITORNO MÓVEIS LTDA. Bento Gonçalves RS www.politorno.com.br 207 POQUEMA IND. COM. DE MÓVEIS LTDA. Arapongas PR www.poquema.com.br 208 PORTIERE FAB. E COM. DE MÓVEIS LTDA. Porto Alegre RS www.portiere.com.br 209 POZZA S.A. INDL. MOVELEIRA Bento Gonçalves RS www.pozza.com.br 210 PRACOLO MÓVEIS LTDA. Flores da Cunha RS 55 54 3292-9803 211 QUIDITA MÓVEIS LTDA. Bento Gonçalves RS 55 54 3458-1001 212 R DELÁZZERI Garibaldi RS 55 54 3462-1802 213 RAIMUNDINI INDL. E COMERCIAL LTDA. Curitiba PR www.raimundini.com.br 214 RANALUTI ARTES LTDA. Gramado RS www.ranalutiferrao.com.br 215 REALE COZINHAS LTDA. Curitiba PR 55 41 3668-1617 216 REALITÁ IND. DE MÓVEIS LTDA. Antonio Prado RS 55 54 3293-1888 217 RENAR MÓVEIS S.A. Fraiburgo SC www.renar.com.br 218 RESEVILA IND. COM. DE MÓVEIS LTDA. Flores da Cunha RS www.resevila.com.br 219 ROHDEN PORTAS E PAINÉIS LTDA. Pouso Redondo SC www.rohden.com.br 220 RONALDO PEREIRA COLCHÕES - ME Maringá PR 55 44 3031-2407 • • • • • • • • • • • • • • • 180 8 • 181 92 • 182 400 • 183 • • 1.994 26 • • 1.993 35 • 185 • 1.998 49 • 1.997 34 • 187 • • • • • • 7 1.995 149 • 189 • 1.985 280 • 190 • • 192 1.999 9 • 1.988 174 • 1.997 4 • 1.982 230 • 194 • 195 193 1.986 550 • 1.994 36 • 1.986 130 • 197 • 1.984 70 • 198 • 1.990 7 199 • 1.999 5 200 • • • 191 • • • • • • • • • • • • • • 196 1.996 30 1.986 52 201 1.995 65 203 1.990 24 204 • 202 • • 1.998 109 • 205 • • 1.985 60 • 206 • • 1.986 76 • 207 • • 1.999 315 1.970 40 • 209 • 1.999 32 • 210 • 1.996 50 • 211 1.994 13 212 1.996 23 213 • • • • • • • • • • • • • • • 188 • • • 186 • • • 184 1.998 • • • 179 1.966 • • 178 1.966 • • Exporta Export 52 • • • Nº de Funcionários Number of Employees 1.979 1.977 • • • • • Fundação Foundation 10 • • • Outras Others 43 1.993 • • • Espuma Spume Plástico Plastic Vime - Ratan Wattle - Rattan 1.988 • • • • • • • Nº # Material / Material • • Metal Metal Madeira Wood Colchões Mattresses Partes de Móveis Furniture parts Institucionais Institutionals Terraços - Jardins Terrace - Gardens Cozinha - Banheiro Kitchen - Bathroom Estofados Upholsters Salas de Estar Living Room Salas de Jantar Room dinners Escritórios Offices Dormitórios Bedrooms Principais Produtos / Main products • • • • 208 1.991 11 214 • 1.999 4 215 • 2.001 80 • 1.973 524 • 1.979 36 • 1.997 789 1.997 6 • 216 • 217 • 219 218 220 89 BRASIL MÓVEIS – 2006 / FURNITURE BRAZIL - 2006 Região Sul South Region Nº # 90 Empresas / Companies Sede / City UF Contato / Contact State 221 RONCONI LTDA. Colombo PR www.ronconi.com.br 222 ROSANE INES HAMESTER HUNHOFF - ME Santa Maria RS 55 55 3226-2313 223 RUDIMAR DA SILVA GROSS - ME Canela RS 55 54 3282-6456 224 RUDIMAR LUIZ ARGENTA TIBOLLA - ME Passo Fundo RS www.marcenariatibola.com.br 225 RUMICAR IND. METALÚRGICA LTDA. Bento Gonçalves RS www.mercadodoferro.com.br 226 RV ROSSI IND. DE ESTOFADOS LTDA. Coronel Freitas SC 55 49 3347-0541 227 S C A - IND. DE MÓVEIS LTDA. Bento Gonçalves RS www.sca.com.br 228 SABATINI MÓVEIS E COZINHAS LTDA. Curitiba PR 55 41 3377-5567 229 SABEMIL IND. DE MÓVEIS TUBULARES LTDA. Coronel Freitas SC www.sabemil.com.br 230 SADEMI IND. DE MÓVEIS LTDA. Bento Gonçalves RS www.sademi.com.br 231 SANTOS & CESARIO LTDA. Cascavel PR 55 45 3228-3242 232 SÃO MARCOS IND. DE MÓVEIS LTDA. São Marcos RS www.bontempo.com.br 233 SCABURI & CIA LTDA. Londrina PR 55 43 3342-6414 234 SCOLARI & TASCHETTO LTDA. Santa Maria RS 55 55 3211-1196 235 SIERRA MÓVEIS LTDA. Gramado RS www.sierra.com.br 236 SILVIO ANTONIO TROMBINI Flores da Cunha RS www.ergoflex.com.br 237 SIMBAL SOCIEDADE INDL. MÓVEIS BANROM LTDA. Rolândia PR 55 43 3255-7200 238 SMK IND. COM. E REPRESENTAÇÕES LTDA. Bento Gonçalves RS 55 54 3452-8541 239 SONO MASTER - IND. COM. DE COLCHÕES LTDA. Sapucaia do Sul RS 55 51 3451-1778 240 SUL SERRA ESTOFADOS LTDA. Farroupilha RS 55 54 3268-6560 241 SULTEC METALÚRGICA LTDA. Bento Gonçalves RS www.sultecmoveis.com.br 242 TECNOMOBILE LTDA. Garibaldi RS 55 54 3463-8311 243 TELASUL S.A. Garibaldi RS www.angelgarden.com.br 244 TISSOT COM. DE MADEIRAS LTDA. Curitiba PR 55 41 3373-0343 245 TODESCHINE EXPORT IND. COM. LTDA. Bento Gonçalves RS 55 54 3453-3333 246 TODESCHINI S.A. IND. COM. Bento Gonçalves RS www.todeschinisa.com.br 247 TOSCANO MÓVEIS LTDA. Flores da Cunha RS 55 54 3292-3105 248 TREBOLL MÓVEIS LTDA. Flores da Cunha RS 55 54 3292-9400 249 TREMÓVEL IND. DE MÓVEIS LTDA. São Bento do Sul SC 55 47 3635-1587 250 ÚNICA IND. DE MÓVEIS S.A. Bento Gonçalves RS www.dellanno.com.br 251 UNIVERSUM DO BRASIL IND. MOVELEIRA LTDA. Antonio Prado RS www.universum.com.br 252 V V J R IND. COM. DE MÓVEIS LTDA. Gramado RS www.mezzom.com 253 VALDENILSON PEREIRA MEIRELES - ME Londrina PR www.meirelesmoveis.com.br 254 VALEVAN IND. COM. DE MÓVEIS LTDA. Maringá PR 55 44 3224-0755 255 VALMIR PERETTO LTDA. Flores da Cunha RS 55 54 3292-2744 256 VAMOL IND. MOVELEIRA LTDA. Arapongas PR www.vamol.com.br 257 VILA NOBRE ESTOFADOS LTDA. Caxias do Sul RS www.vilanobre.com.br 258 VIMERAMA IND. COM. LTDA. Cascavel PR 55 45 3035-5584 259 W3 IND. METALÚRGICA LTDA. Ponta Grossa PR www.w3.ind.br 260 WALDIR VICENTE EWALD Lajeado RS 55 51 3714-5254 261 WR LOPES & CIA LTDA. Umuarama PR 55 44 3623-3145 262 ZAMPROGNA MÁRMORES E GRANITOS LTDA. Francisco Beltrão PR 55 46 3524-5712 263 ZICO MÓVEIS LTDA. São Bento do Sul SC 55 47 3635-2293 • • • • • • • • • • • • • • • • • • • • 226 • • 1.967 237 • • 2.001 9 • • 1.997 14 • • 1.992 26 • 1.996 8 • 1.978 210 2.000 11 • • 1.994 7 • 1.989 276 • • • • • • • • 230 231 • 232 233 234 • 235 2.001 43 236 800 237 1.986 13 238 • 2.000 7 239 • 2.001 20 240 • • 1.987 49 241 2.000 70 • 1.972 330 242 • 243 • 1.990 5 • • 2.004 58 • 245 • • 1.966 440 • 246 • 1.987 4 • 1.997 320 • 248 • 1.981 150 • 249 • • 1.985 473 • 250 • • 1.980 146 • 251 • 1.990 55 • 252 • • 229 • • • • 228 1.976 • • 227 • • • • • • • • • Exporta Export 225 5 • • Nº de Funcionários Number of Employees 224 22 • • Fundação Foundation 223 7 • • Outras Others 15 1.987 • • Espuma Spume 1.985 • • 221 1.998 • • Plástico Plastic Vime - Ratan Wattle - Rattan 222 • • • • 1.991 • • 8 • • • 400 1.988 • • • 1.966 • • • • • • • Nº # Material / Material • • Metal Metal Madeira Wood Colchões Mattresses Partes de Móveis Furniture parts Institucionais Institutionals Terraços - Jardins Terrace - Gardens Cozinha - Banheiro Kitchen - Bathroom Estofados Upholsters Salas de Estar Living Room Salas de Jantar Room dinners Escritórios Offices Dormitórios Bedrooms Principais Produtos / Main products • 244 247 • • • 1.999 6 253 • • • 1.995 4 254 • 2.001 10 • 1.993 315 • • • • • • • • • • • • • • • • • • • • • 255 • 256 1.988 40 257 1.972 1 258 1.989 300 259 1.996 33 260 1.988 5 261 1.996 6 262 1.994 6 263 91 BRASIL MÓVEIS – 2006 / FURNITURE BRAZIL - 2006 Região Sudeste Southeast Region Nº # 92 Empresas / Companies Sede / City UF Contato / Contact State 264 A CISNE MÓVEIS LTDA. Montes Claros MG 55 38 3221-1933 265 ADALBERTO JOSE DE SOUZA- ME Uberaba MG www.arteobjetosdesigner.com.br 266 ADALBERTO SEBASTIAO CHIQUETTI- ME Ribeirão Preto SP 55 16 3628-0934 267 AGUIAR BOLZAN LTDA. São José do Rio Preto SP 55 17 3227-4894 268 ALAIR ANDRE DE MOURA E CIA LTDA. Ubá MG 55 32 3531-6660 269 ALANFER IND. COM. DE MÓVEIS LTDA. Votuporanga SP 55 17 3421-7476 270 ALBERFLEX IND.DE MÓVEIS LTDA. Sorocaba SP www.alberflex.com.br 271 ALBERTO LANNES- ME Belo Horizonte MG 55 31 3434-6021 272 ALCIONE ALVES SANTOS- ME Carmo do Cajuru MG 55 37 3244-1347 273 ALMEIDA OLIVEIRA LTDA. Cataguases MG 55 32 3421-6611 274 AMACOL AMERICA IND. COM. LTDA. Perdões MG 55 35 3864-1422 275 AMBIENTAL JABOTICABAL IND. COM. DE MÓVEIS LTDA. Jaboticabal SP www.ambientalmoveis.com.br 276 AMERICANFLEX INDS REUNIDAS LTDA. São José do Rio Preto SP www.americanflex.com.br 277 ANGELO ARTE IND. COM. DECORAÇÕES LTDA. São Paulo SP www.angeloarte.com.br 278 ARAÇATUBA IND. COM. ESPUMA COLCHÕES LTDA. Araçatuba SP 55 18 3624-4796 279 BATROL IND. COM. DE MÓVEIS LTDA. Porto Ferreira SP www.batrol.com.br 280 BEL SONNO COLCHÕES LTDA. Campinas SP www.belsonno.com.br 281 BIANCHI IND. COM. DE MÓVEIS LTDA. Ubá MG 55 32 3539-7300 282 BIGSPUMA IND. COM. LTDA. São Paulo SP 55 11 3392-5595 283 BRIGATTO INDS DE MÓVEIS LTDA. Limeira SP www.brigatto.com.br 284 BUMI IND. COM. DE MÓVEIS LTDA. Birigui SP www.bumi.com.br 285 BUSCARIOLI & BUSCARIOLI LTDA. Mogi Mirim SP www.cadeirasbuscarioli.com.br 286 CAIAFA IND. COM. DE MÓVEIS DE AÇO LTDA. Ubá MG 55 32 3532-3524 287 CAPRICHO MÓVEIS E DECORAÇÕES LTDA. São Bernardo do Campo SP 55 11 4178-1970 288 CASA FINLAND IND. COM. LTDA. Teresópolis RJ 55 21 2642-6734 289 CELMARTHE IND. COM. LTDA. Salto de Pirapora SP www.celmarmoveis.com.br 290 CHP MÓVEIS LTDA. Itatiba SP www.moveisfenix.om.br 291 CICOPAL S.A. Cravinhos SP www.cicopal.com.br 292 COLCHÕES APOLO SPUMA LTDA. Itu SP 55 11 4023-0444 293 COLCHÕES E MÓVEIS CINCO IRMAOS LTDA. Juiz de Fora MG 55 32 3215-2556 294 COLCHÕES ECLIPSE LTDA. Ipatinga MG 55 31 3822-8294 295 COLCHÕES ITAPERUNENSE LTDA. Itaperuna RJ www.itapecol.com.br 296 COLCHONOBRE IND. COM. DE COLCHÕES LTDA. Sabara MG www.colchonobre.com.br 297 COLFLEX IND. COM. DE COLCHÕES LTDA. São Paulo SP 55 11 6783-6601 298 COLUNEX IND. COM. DE ESPUMAS LTDA. Magé RJ 55 21 2633 1626 299 COM IND.E TRANSPORTE LOPAS LTDA. Rodeiro MG www.grupolopas.com.br 300 COMAR IND.DE MÓVEIS LTDA. Jaci SP 55 17 3242-1491 301 CONFORTOMAX IND. COM. DE COLCHOARIA LTDA. São Paulo SP www.confortomax.com.br 302 COZIMAX MÓVEIS DE AÇO MIRASSOL LTDA. Mirassol SP www.cozimax.com.br 303 CRIS METAL MÓVEIS P/ BANHEIRO LTDA. Vargem Grande Paulista SP www.crismetal.com.br • • • • • • • • • • • • • • • • • • • 268 14 269 • 1.972 300 270 • 1.978 4 271 • • • 274 80 275 • 1.978 516 1.972 10 277 • 1.995 12 278 1.977 310 • 1.998 356 1.986 275 281 • 1.984 7 282 • 276 279 280 • 1.968 150 283 • 1.974 130 284 • 1.985 15 285 • 1.968 8 286 287 • • • • • • • 273 • • • 272 3 438 • • 6 1.998 • • 1.999 1.968 1.990 • • • • Exporta Export 10 1.996 • • • Nº de Funcionários Number of Employees 1.996 • • • Fundação Foundation • • • Outras Others 266 267 • • 265 10 • • 264 37 10 • • 14 1.996 1.993 • • 1.973 1.996 • • Nº # Material / Material • • Espuma Spume Plástico Plastic Vime - Ratan Wattle - Rattan Metal Metal Madeira Wood Colchões Mattresses Partes de Móveis Furniture parts Institucionais Institutionals Terraços - Jardins Terrace - Gardens Cozinha - Banheiro Kitchen - Bathroom Estofados Upholsters Salas de Estar Living Room Salas de Jantar Room dinners Escritórios Offices Dormitórios Bedrooms Principais Produtos / Main products • • 1.977 6 • • 1.966 250 • • • • 2.001 120 • • • • 1.998 357 • 290 • 1.973 160 • 291 • • • • 288 289 • • 1.970 100 292 • • 1.977 8 293 • • 2.001 18 294 • • 1.997 25 295 • • 1.976 75 296 • • 1.987 1 297 • • 1.999 14 298 1.985 319 2.001 27 300 2.001 8 301 1.997 120 302 1.966 130 303 • • • • • • • • • • • • • • • 299 93 BRASIL MÓVEIS – 2006 / FURNITURE BRAZIL - 2006 Região Sudeste Southeast Region Nº # 94 Empresas / Companies Sede / City UF Contato / Contact State 304 D CORREA DA SILVA MÓVEIS- ME São Paulo SP www.oficinamoveis.com.br 305 DADALTO BASSINI LTDA. Linhares ES 55 27 3373-1166 306 DALMAR INDS DE MÓVEIS DE AÇO LTDA. Itajobi SP 55 11 4496-1011 307 DELARE IND. COM. LTDA. Linhares ES www.delare.com.br 308 DELL’ ABITARE IND. COM. DE MÓVEIS LTDA. Rio de Janeiro RJ 55 21 2501-4759 309 DELTAFLEX IND. COM. DE MÓVEIS LTDA. Mogi Mirim SP 55 19 3862-3644 310 DESTAQUE IND. COM. DE MÓVEIS E DECORAÇÕES LTDA. São Paulo SP 55 11 6163-5263 311 DIRCEU GOMES DE SOUZA- ME Belo Horizonte MG 55 31 3443-6951 312 DJUAN COLCHÕES IND. COM. LTDA. São Bernardo do Campo SP 55 11 4393-5000 313 DOCELAR MÓVEIS LTDA. Linhares ES www.docelarmoveis.com.br 314 DRUL IND. COM. DE MÓVEIS LTDA. Ubá MG 55 32 3531-6514 315 ED JOS MÓVEIS E DECORAÇÕES LTDA. São Paulo SP 55 11 3985-9740 316 EDSON NOSSA JR - JACI Jaci SP www.edn.com.br 317 ENGEMOBILE IND. COM. LTDA. São Paulo SP www.engemobile.com.br 318 EREZ IND. COM. DE MÓVEIS LTDA. Rio de Janeiro RJ www.favomoveis.com.br 319 ERISTON IND. COM. DE MÓVEIS LTDA. São Paulo SP 55 11 6919-2585 320 ESTAMAC MÓVEIS E COMPONENTES LTDA. Guarulhos SP www.estamac.com.br 321 ESTOFADOS APOGEU LTDA. São José do Rio Preto SP www.estofadosapogeu.com.br 322 ESTOFADOS GRAÇA LTDA. Belo Horizonte MG 55 31 3462-5589 323 ESTOFADOS SULAMITA IND. COM. LTDA. São Bernardo do Campo SP 55 11 4399-3131 324 EXPAMBOX IND.DE MOBILIARIO LTDA. Campinas SP www.expambox.com.br 325 FAB. DE COLCHÕES E TRAVESSEIROS VICTORINO LTDA. São Paulo SP 55 11 6673-7455 326 FAB. DE ESPUMAS E COLCHÕES NOROESTE LTDA. São José do Rio Preto SP www.ortobom.com.br 327 FAB. DE MÓVEIS CASIMIRO LTDA. Iracemápolis SP 55 19 3456-1926 328 FABRIMÓVEIS INDL. LTDA. Mirassol SP www.fabrimoveis.com.br 329 FAMA MÓVEIS DE TUPA LTDA. Tupã SP 55 14 3441-2333 330 FAUZI ABDO MUSA-EPP Campinas SP 55 19 3213-2591 331 FEITALAR MÓVEIS LTDA. Ubá MG 55 32 3531-0557 332 FERREIRA E SILVA IND. COM. E REFORMA DE MÓVEIS LTDA. Rio de Janeiro RJ www.ferreirasilvamoveis.com.br 333 FIEL S.A. MÓVEIS E EQUIPAMENTOS INDS São Paulo SP www.fiel.com.br 334 FLEX DO BRASIL LTDA. Santa Barbara D’Oeste SP 55 19 3459-6800 335 FLEXFORM IND.METALÚRGICA LTDA. Guarulhos SP www.flexform.com.br 336 FORJA IND.DE MÓVEIS DE AÇO LTDA. São José do Rio Preto SP www.forja.com.br 337 G MÓVEIS LTDA. Carmo do Cajuru MG 55 37 3244-1857 338 GALERANI & PUGA LTDA. Valentim Gentil SP 55 17 3485-1409 339 GELIUS IND.DE MÓVEIS LTDA. Mirassol SP www.gelius.com.br 340 GELMÓVEIS IND. COM. DE MÓVEIS LTDA. São José do Rio Preto SP 55 17 3233-9299 341 GIROFLEX S.A. São Paulo SP www.giroflex.com.br 342 GLOBAL MOBILINEA S.A. São Paulo SP www.mobilinea.com.br • • • • • • • • • • • • • • • • Exporta Export Nº de Funcionários Number of Employees Fundação Foundation Outras Others Espuma Spume Vime - Ratan Wattle - Rattan Plástico Plastic • • • • • • • Nº # Material / Material • • Metal Metal Madeira Wood Colchões Mattresses Partes de Móveis Furniture parts Institucionais Institutionals Terraços - Jardins Terrace - Gardens Cozinha - Banheiro Kitchen - Bathroom Estofados Upholsters Salas de Estar Living Room Salas de Jantar Room dinners Escritórios Offices Dormitórios Bedrooms Principais Produtos / Main products • • • • • 1.997 8 304 1.982 60 305 1.985 524 306 1.973 255 307 1.999 7 308 1.997 27 309 1.979 7 310 • 1.999 13 311 • 1.998 552 312 • • 1.984 53 313 • • 1.996 8 314 • 1.992 5 • 1.998 275 • 1.982 4 317 • 1.999 60 318 • 1.978 6 319 1.985 49 320 • • 1.997 28 321 • • 1.991 5 322 • 1.979 13 323 1.961 206 • • • • • • • • • • • • • • • • • 315 • • 316 324 • • 1.967 12 325 • • 1.997 297 326 • 1.976 85 • • 1.980 73 328 • • 1.989 150 329 1.993 4 330 1.996 8 331 • • • • • • • • • • • • • • • • • • • • • • • 332 333 • 2.000 76 • 334 • 1.970 315 • 335 1.979 10 336 1.997 6 337 1.995 17 338 1.983 215 339 • 1.984 38 340 • 1.966 850 • 1.966 92 • • 150 • • • 8 1.943 • • • • 327 1.991 • • • • 341 342 95 BRASIL MÓVEIS – 2006 / FURNITURE BRAZIL - 2006 Região Sudeste Southeast Region Nº # 96 Empresas / Companies Sede / City UF Contato / Contact State 343 GREICE MÓVEIS LTDA. Ubá MG 55 32 3532-3718 344 GREMÓVEIS IND. COM. LTDA. Contagem MG 55 31 3333-2543 345 GUILHEM MÓVEIS E DECORAÇÕES IND. COM. LTDA. São Paulo SP www.guilhem.com.br 346 HARDMAN MÓVEIS E DECORAÇÕES LTDA. São Paulo SP www.hardman.com.br 347 HARPEX ARTEFATOS DE MADEIRA LTDA. Rio Claro SP www.harpex.com.br 348 HEITOR RUIZ JUNIOR MARCENARIA- ME São Bernardo do Campo SP 55 11 4178-2461 349 HELIO DE LIMA MÓVEIS- ME São Bernardo do Campo SP 55 11 4392-8817 350 HF IND. COM. LTDA. São Paulo SP www.hfbebe.com.br 351 HIPI IND. COM. DE MÓVEIS LTDA. Mirassol SP www.hipigab.com.br 352 HMY DO BRASIL LTDA. Jundiaí SP www.hmydobrasil.com.br 353 IBRAMOL EVYELYNE IND. COM. DE MÓVEIS LTDA. São Paulo SP www.evyelyne.com.br 354 INAMEL MÓVEIS DE AÇO LTDA. Mogi Mirim SP www.inamel.com.br 355 INCABRAS IND. COM. DE MÓVEIS LTDA. Fernandópolis SP 55 17 3465-0500 356 INCAM IND. COM. ARTEFATOS DE METAIS LTDA. Mogi Mirim SP www.incam.com.br 357 INCOMASA IND. COM. DE MÓVEIS LTDA. Linhares ES www.incomasa.hpg.com.br 358 IND. COM. CONFORTOESPUMA LTDA. Campinas SP 55 19 3232-8831 359 IND. COM. DE COLCHÕES CASTOR LTDA. Ourinhos SP www.colchoescastor.com.br 360 IND. COM. DE COLCHÕES EDMIL LTDA. Eloi Mendes MG www.lojasedmil.com.br 361 IND. COM. DE COLCHÕES TERRA LTDA. São Paulo SP 55 11 3293-6411 362 IND. COM. DE COLCHÕES VALE DO AÇO LTDA. Caratinga MG 55 31 3516-0970 363 IND. COM. DE MÓVEIS CAPELLO LTDA. Mirassol SP 55 17 3242-1491 364 IND. COM. DE MÓVEIS EDIEL LTDA. São Bernardo do Campo SP 55 11 4341-5725 365 IND. COM. DE MÓVEIS EUROPA LTDA. Ubá MG www.moveiseuropa.com.br 366 IND. COM. DE MÓVEIS J M BARRETO LTDA. Valentim Gentil SP www.grupobarreto.com.br 367 IND. COM. MÓVEIS CUJINOTTI LTDA. São José do Rio Preto SP 55 17 3224-1322 368 IND. DE COLCHÕES CLEIDE LTDA. São Paulo SP 55 11 6692-7787 369 IND. DE COZINHAS SP LTDA. Uberlândia MG 55 34 3238-3144 370 IND. DE MÓVEIS BARTIRA LTDA. Santo André SP 55 11 4463-7019 371 IND. DE MÓVEIS BECHARA NASSAR LTDA. Tanabi SP www.moveisbechara.com.br 372 IND. DE MÓVEIS BONATTO LTDA. Ribeirão Pires SP www.bonatto.com.br 373 IND. DE MÓVEIS COLONIAIS MALVAS LTDA. Votuporanga SP www.malvas.com.br 374 IND. DE MÓVEIS JACI LTDA. Jaci SP 55 17 3283-9500 375 IND. DE MÓVEIS JONAS LTDA. Mirassol SP www.cadeirajonas.com.br 376 IND. DE MÓVEIS MALUMBRES & ROSSI LTDA. São José do Rio Preto SP 55 17 3218-2084 377 IND. DE MÓVEIS MOVELAR LTDA. Linhares ES www.movelar.com.br 378 IND. DE MÓVEIS REAL LTDA. Belo Horizonte MG 55 31 3411-6311 379 IND. DE MÓVEIS SPERANDÍO LTDA. Ubá MG 55 32 3532-9198 380 IND. MANCHESTER DE MODELAÇÃO E MARCENARIA LTDA. Sorocaba SP 55 15 3228-2996 381 IND. MOGIMIRIANA DE MÓVEIS DE AÇO LTDA. Mogi Mirim SP www.imoaco.com.br 382 INDUSMÓVEIS IND. COM. DE MÓVEIS LTDA. São José do Rio Preto SP www.indusmoveis.com.br 383 INTERCASA IND. COM. DE MÓVEIS LTDA. Ribeirão Pires SP 55 11 4229-1955 • • • • • • • Exporta Export Nº de Funcionários Number of Employees Fundação Foundation Outras Others 18 345 1.974 12 346 • • 1.985 300 • • 1.996 4 348 • • 1.996 4 349 1.970 7 350 • • • • • • • • 2.000 19 110 1.983 110 353 • 1.979 206 354 1.977 228 355 • 1.998 28 356 • • 347 1.996 • • • • • • • 343 344 1.966 • • 28 50 • • • 2.000 1.993 • • • Nº # Material / Material • • Espuma Spume Plástico Plastic Vime - Ratan Wattle - Rattan Metal Metal Madeira Wood Colchões Mattresses Partes de Móveis Furniture parts Institucionais Institutionals Terraços - Jardins Terrace - Gardens Cozinha - Banheiro Kitchen - Bathroom Estofados Upholsters Salas de Estar Living Room Salas de Jantar Room dinners Escritórios Offices Dormitórios Bedrooms Principais Produtos /Main products 351 • 352 • 1.984 20 357 • • 1.969 2 358 • • 1.971 711 359 • • 1.980 1.000 360 • • 1.999 14 361 • 1.968 483 362 • • • 1.987 13 363 • • 1.971 11 364 • • 1.989 160 365 • • 1.990 70 366 • 1.995 10 367 • 1.966 6 368 • • • • • • • • 1.995 15 369 • • 1.966 899 370 • 1.966 119 • 1.966 106 • 1.993 50 • 373 • 1.984 114 • 374 • • • • • • • 372 1.976 37 375 2.002 16 376 • • 1.970 1.050 • • 1.994 3 378 2.002 69 379 1.988 11 380 1.966 33 381 • • • • • • • • • • • • 371 • • • • • 377 • • • 1.986 44 382 • • • 1.984 30 383 97 BRASIL MÓVEIS – 2006 / FURNITURE BRAZIL - 2006 Região Sudeste Southeast Region Nº # 98 Empresas / Companies Sede / City UF Contato / Contact State 384 IRCOL- INDS REUNIDAS DE COLCHÕES LTDA. Belo Horizonte MG www.ideal.com.br 385 IRMÃOS ZAPPAROLLI LTDA. São Paulo SP 55 11 3256-3390 386 ISMA S.A. IND.SILVEIRA DE MÓVEIS DE AÇO Mogi Mirim SP www.isma.com.br 387 ISRAEL MÓVEIS LTDA. Colatina ES 55 27 3721-3611 388 ITAPEMA IND.DE MÓVEIS LTDA. Guarulhos SP 55 11 6421-8300 389 ITATIAIA MÓVEIS S.A. Ubá MG www.itatiaiamoveis.com.br 390 JAIMAR MÓVEIS E DECORAÇÕES LTDA. São Paulo SP 55 11 6236-4489 391 JEAN MARCENARIA LTDA. São Paulo SP 55 11 6135-5466 392 JL COM. DE ESPUMAS LTDA. Barueri SP 55 11 4195-1000 393 JNXAVIER DIAS LTDA. Salinas MG 55 38 3841-1798 394 JOÃO ANTONIO VIEIRA DE SOUZA- ME Votuporanga SP 55 17 3485-1180 395 JOFRAN IND. COM. DE MÓVEIS LTDA. São Paulo SP 55 11 6911-3319 396 JOLUVEL DISPLAYS E DECORACOES LTDA. Itatiba SP 55 11 4524-4194 397 JOSÉ FLORISVALDO MATTOS- ME São José do Rio Preto SP 55 17 3227-6898 398 JOSÉ LUIS BOTAN- ME Colatina ES 55 27 3721-2274 399 JUDILART MÓVEIS LTDA. Valentim Gentil SP www.judilart.com.br 400 JUNCOVIME COM. E IND.LTDA. Belo Horizonte MG 55 31 3373-2278 401 KAMPALAR MÓVEIS LTDA. Ubá MG 55 32 3531-6899 402 LA LINEA IND.DE MÓVEIS E ESQUADRIAS LTDA. Belo Horizonte MG 55 31 3476-6092 403 LACCA S.A. IND. COM. DE MÓVEIS Rio de Janeiro RJ www.lacca.com.br 404 LAR DEL PLATA MÓVEIS DE AÇO LTDA. Valentim Gentil SP www.lardelplata.com.br 405 LARA MÓVEIS LTDA. Ubá MG www.laramoveis.com.br 406 LEAO AÇO IND. COM. E ESTAMPARIA LTDA. Valentim Gentil SP www.leao-aco.com.br 407 LEIFER IND. COM. DE MÓVEIS LTDA. Rodeiro MG www.leifermoveis.com.br 408 LEOMAR MÓVEIS LTDA. Ubá MG 55 32 3532-2611 409 LIA ESTOFADOS LTDA. Belo Horizonte MG 55 31 3464-0695 410 LÍDER COLCHÕES E ESTOFADOS LTDA. Carmo do Cajuru MG 55 37 3244-1477 411 LÍDER IND. COM. DE ESTOFADOS LTDA. Carmo do Cajuru MG www.mobiliariolider.com.br 412 LIGHTSPUMA IND. COM. DE COLCHÕES LTDA. Campinas SP 55 19 3246-1340 413 LINOFORTE MÓVEIS LTDA. Osvaldo Cruz SP www.linoforte.com.br 414 LUCKSPUMA IND. COM. LTDA. Ferraz de Vasconcelos SP www.luckspuma.com.br 415 LUDIVAL MÓVEIS LTDA. Rio Claro SP 55 19 3534-4455 416 LUIZ SERGIO SARTORI VOTUPORANGA- ME Votuporanga SP 55 17 3421-9461 417 LUIZZI COLCHÕES MULTIUSO LTDA. Itirapina SP 55 19 3575-4050 418 LUNAVITT IND.DE MÓVEIS LTDA. Votuporanga SP 55 17 3421-8083 419 M T A MÓVEIS LTDA. Piracicaba SP 55 19 3429-9990 420 MADCOM MADEIRAS E FERRAGENS LTDA. São Bernardo do Campo SP 55 11 4337-2686 421 MADEILAR IND. COM. DE MADEIRA LTDA. Uberaba MG 55 34 3333-2888 422 MADINE IND. COM. DE MÓVEIS LTDA. Araçatuba SP www.madine.com.br 423 MAGER IND. COM. DE MÓVEIS E DECORACÕES LTDA. São Paulo SP www.magermoveis.cbj.net 424 MALEAVEL ORIENTAL ARTESANATO LTDA. Belo Horizonte MG 55 31 3464-2722 425 MAQ- MÓVEIS IND.DE MÓVEIS ESCOLARES LTDA. São Paulo SP www.maqmovel.com.br • • • • • • • • • • • • • • • • • • • • • • • • • • • 391 2.000 6 392 1.996 18 393 5 394 6 395 • • 1.988 25 396 • • • • • • • 399 6 400 8 401 402 • • 1.974 187 403 • 1.997 19 404 1.989 50 405 • 2.001 12 406 • 1.991 209 407 • 1.996 15 408 • • • • • • 1.992 8 409 • • 1.996 1.000 410 1.990 418 • 1.989 39 412 1.966 492 413 • 1.991 330 414 • 1.974 400 415 • • • • • • 1.997 7 416 2.002 356 417 1.993 30 418 1.998 150 419 • 1.988 12 420 • 1.982 5 • 1.968 66 1.994 11 423 2.001 5 424 1.991 260 • • • • • • • • • 411 • • • • • • • 60 19 • • 1.997 1.978 1.994 • • 398 1.991 • • 397 • • • 3 12 • • • 1.989 1.994 • • • Exporta Export 390 9 389 1.977 • • Nº de Funcionários Number of Employees 8 1.982 • 388 • 2.000 • • Fundação Foundation 1.972 • • • 387 • • • 386 30 • • • 270 1.983 • • • 1.970 • • • 385 160 • • 384 7 800 • • 18 1.956 1.985 • • 1.969 1.964 • • Outras Others Espuma Spume • • • • Nº # Material / Material • • Plástico Plastic Vime - Ratan Wattle - Rattan Metal Metal Madeira Wood Colchões Mattresses Partes de Móveis Furniture parts Institucionais Institutionals Terraços - Jardins Terrace - Gardens Cozinha - Banheiro Kitchen - Bathroom Estofados Upholsters Salas de Estar Living Room Salas de Jantar Room dinners Escritórios Offices Dormitórios Bedrooms Principais Produtos / Main products • 421 • • 422 425 99 BRASIL MÓVEIS – 2006 / FURNITURE BRAZIL - 2006 Região Sudeste Southeast Region Nº # 100 Empresas / Companies Sede / City UF Contato / Contact State 426 MARCENARIA AFONSO PENA LTDA. Uberlândia MG 55 34 3232-5254 427 MARCENARIA AIRANECRAM LTDA. São Paulo SP 55 11 5062-7966 428 MARCENARIA CANAPOLIS LTDA. São Paulo SP www.marcenariacanapolis.com.br 429 MARCENARIA CANEVER LTDA. São Bernardo do Campo SP 55 11 4125-6031 430 MARCENARIA DAFF LTDA. São Bernardo do Campo SP www.daffmoveis.com.br 431 MARCENARIA DANIVAM LTDA. São Paulo SP 55 11 6331-0860 432 MARCENARIA E CARPINTARIA BRISTOL LTDA. São Paulo SP www.bristolmoveis.com.br 433 MARCENARIA EURIDICE LTDA. São Bernardo do Campo SP 55 11 4343-6097 434 MARCENARIA FELITÁ LTDA. São Bernardo do Campo SP www.felita.com.br 435 MARCENARIA IRMÃOS VAZ IND. COM. LTDA. Contagem MG 55 31 3357-7422 436 MARCENARIA LOUVRE PAULISTA LTDA. São Paulo SP 55 11 3966-9944 437 MARCENARIA ORIENTAL S.C LTDA. São Paulo SP 55 11 5621-2735 438 MARCENARIA SARAH LTDA. São Paulo SP 55 11 3782-1897 439 MARCENARIA X LTDA. São Paulo SP 55 11 5686-8376 440 MARCENARIA ZUCOLOTO LTDA. Ribeirão Preto SP 55 16 3630-2171 441 MARIGO DECORAÇÕES IND. COM. LTDA. São Paulo SP www.marigodecoracoes.com.br 442 MARIO SERGIO DO NASCIMENTO MÓVEIS- ME Colatina ES 55 27 3721-4055 443 MARSPUMA ANAT. IND. COM. DE ESPUMAS E COLCHÕES LTDA. Campo Limpo Paulista SP 55 11 4812-4407 444 MASIL ESPUMA E CONFECÇÕES LTDA. São Paulo SP 55 11 6246-3199 445 MASTER MÓVEIS LTDA. Piracicaba SP 55 19 3429-9990 446 MECTAL MÓVEIS IND. COM. LTDA. Belo Horizonte MG 55 31 3442-4270 447 MEL CRIAÇÕES LTDA. Contagem MG www.movelmel.com.br 448 MELANINO MÓVEIS E MÁQUINAS PARA ESCRITÓRIO LTDA. São Paulo SP www.melanino.com.br 449 METADIL IND. COM. METALÚRGICA LTDA. Guarulhos SP www.metadil.com.br 450 METALMIX IND. COM. LTDA. Birigui SP www.metalmix.com.br 451 METALÚRGICA ARIAM LTDA. Osasco SP www.ariam.ind.br 452 METALÚRGICA ATILA LTDA. Mogi Mirim SP www.atila.com.br 453 METALÚRGICA CATAGUAZES LTDA.- ME Valentim Gentil SP 55 17 3485-1509 454 MIMO IND.DE COLCHÕES E ESPUMAS LTDA. Limeira SP 55 19 3441-4218 455 ML MAGALHÃES IND. COM. DE MÓVEIS LTDA. Rio de Janeiro RJ www.mlmagalhaes.com.br 456 MOBILIADORA LÍDER LTDA. Carmo do Cajuru MG www.mobiliadoralider.ind.br 457 MODALI IND. COM. DECORAÇÕES LTDA. São Paulo SP www.modali.com.br 458 MODERN DESIGN DO BRASIL LTDA.- ME Itabira MG www.moveisdrumond.com.br 459 MODERNA IND.DE PLÁSTICOS E MÓVEIS LTDA. Contagem MG www.moderna.com.br 460 MÓDULO COM. DE MÓVEIS DE SÃO BERNARDO LTDA. São Bernardo do Campo SP 55 11 4356-1687 461 MOGIFLEX IND. COM. DE CADEIRAS LTDA. Mogi Mirim SP www.mogiflex.com.br 462 MÓVEIS CAMARGOS LTDA. Carmo do Cajuru MG 55 37 3244-1823 463 MÓVEIS CIRIANI ARTE EM MADEIRA LTDA. Uberaba MG 55 34 3321-5050 464 MÓVEIS CONQUISTA LTDA. Linhares ES www.moveisconquista.com.br • Exporta Export Nº de Funcionários Number of Employees Fundação Foundation Outras Others Espuma Spume Plástico Plastic Vime - Ratan Wattle - Rattan Metal Metal Madeira Wood Colchões Mattresses Partes de Móveis Furniture parts Institucionais Institutionals Terraços - Jardins Terrace - Gardens Cozinha - Banheiro Kitchen - Bathroom Estofados Upholsters Salas de Estar Living Room Salas de Jantar Room dinners Escritórios Offices Dormitórios Bedrooms Principais Produtos / Main products Nº # Material / Material • • 1.994 8 426 • • • 1.975 9 427 • • • 1.987 12 428 • • • 1.980 8 429 • • • 1.988 19 430 1.981 14 431 1.977 20 432 • • • • • • • • • • 1.987 7 433 • • 1.985 418 434 • • 1.981 7 435 • 1.966 9 436 • 1.998 6 437 • 1.979 4 438 • 1.997 8 439 • 1.979 5 440 • 1.975 10 441 • 1.997 32 442 • • 1.996 16 443 • • 1.994 4 444 • • • • • • • • • • • • • • • • • • • • • • • • • • • • • • • • • • • • • 1.981 150 445 1.991 6 446 1.987 95 447 1.994 26 448 1.974 50 • • 1.986 370 • • 1.966 270 • 1.961 35 • • • • • • • • • • • 449 • 450 • 452 451 1.995 9 453 1.987 4 454 1.970 150 455 • • • • 1.970 264 • • • • 1.977 70 457 • • • • • • • • • • • • • • 456 1.993 34 458 1.978 120 459 1.999 267 460 1.994 10 461 • 1.997 8 462 • • • • 1.953 7 463 • • • • 1.981 54 464 101 BRASIL MÓVEIS – 2006 / FURNITURE BRAZIL - 2006 Região Sudeste Southeast Region Nº # 102 Empresas / Companies Sede / City UF Contato / Contact State 465 MÓVEIS FLORESTA LTDA. Piedade SP 55 15 3244-4107 466 MÓVEIS GERMAI LTDA. Jaci SP www.germai.com.br 467 MÓVEIS HOTELEIROS OPTIMA LTDA. São Paulo SP www.optimamoveishoteleiros.com.br 468 MÓVEIS LAZZARINI LTDA. Batatais SP 55 16 3761-2922 469 MÓVEIS NOSSA SENHORA DO CARMO LTDA. São José do Rio Preto SP www.carmomoveis.com.br 470 MÓVEIS PADILHA LTDA. Ubá MG 55 32 3532-9284 471 MÓVEIS PROVÍNCIA IND. COM. LTDA. Guapiaçú SP www.moveisprovincia.com.br 472 MÓVEIS TEPERMAN LTDA. Santa Isabel SP 55 11 4657-7743 473 MÓVEIS WW S GERALDO LTDA. São Geraldo MG www.moveisww.com.br 474 MOVERAMA IND.DE MÓVEIS LTDA. Linhares ES 55 27 3373-1035 475 MOVIE DECORAÇÕES IND. COM. DE MÓVEIS LTDA. São Paulo SP 55 11 5678-2519 476 MOVITA IND.DE MÓVEIS DE AÇO LTDA. Itajobi SP www.movita.com.br 477 MUEBLE MARCENARIA S/C LTDA. São Paulo SP 55 11 3497-7000 478 NITRAM MÓVEIS LTDA. São José do Rio Preto SP 55 17 3238-1616 479 OLIVAN MÓVEIS PLANEJADOS LTDA. Belo Horizonte MG 55 31 3495-8836 480 OLIVAR DOS SANTOS CIA LTDA. Dracena SP 55 18 5821-1747 481 ONELIO DANIELATO- ME Ribeirão Preto SP 55 16 3626-1581 482 OPÇÃO 3R IND. COM. DE ESTOFADOS LTDA. São Bernardo do Campo SP www.opcao3r.com.br 483 ORTHOCRIN IND. COM. LTDA. Santa Luzia MG www.orthocrin.com.br 484 ORTHOFLEX IND. COM. DE COLCHÕES LTDA. Santana do Paraiso MG 55 31 3826-7070 485 ORTHOPAX- MG IND. COM. DE COLCHÕES LTDA. Contagem MG 55 31 3351-0777 486 P B ZANZINI CIA LTDA. Dois Córregos SP www.zanzini.com.br 487 PANDIN MÓVEIS DE ACO LTDA. São José do Rio Preto SP www.pandin.com.br 488 PEDERPINUS IND. COM. DE MÓVEIS LTDA. Pederneiras SP 55 14 3252-3244 489 PHENIX IND. COM. DE MOBILIÁRIO LTDA. Rio de Janeiro RJ www.colchoesphenix.com.br 490 PICASSO MÓVEIS E DECORAÇÕES LTDA. São Paulo SP 55 11 6341-1454 491 PICCOLO SPAZIO MÓVEIS ARTESANAIS LTDA. São Paulo SP 55 11 5511-1853 492 POLIVISUAL LTDA. Belo Horizonte MG www.sinalmix.com.br 493 POLLUS IND. COM. DE MÓVEIS LTDA. Votuporanga SP www.pollusmoveis.com.br 494 POLY MAR METALÚRGICA LTDA. Penápolis SP www.polymarmetalurgica.com.br 495 PROBEL S.A. Suzano SP www.probel.com.br 496 PRODIS INDL. DE MÓVEIS INST E EMPR LTDA. São Paulo SP www.prodis.com.br 497 QUALY IND. COM. DE MÓVEIS LTDA. Linhares ES 55 27 2103-1445 498 RAFALEX IND. COM. DE MÓVEIS LTDA. São Paulo SP 55 11 5071-4061 499 RAIMUNDO ROSARINO DA SILVA- ME Bom Despacho MG 55 37 3522-2545 500 REMANTEC IND. COM. DE MÓVEIS LTDA. São Paulo SP www.remantec.com.br 501 RHIK-FLEX COM. E TAPEÇARIA LTDA. São Paulo SP 55 11 5084-2301 502 RHODES S.A. Cambui MG www.rhodes.ind.br 503 RICARDO ROMERO PIRES MIRASSOL - ME Mirassol SP www.rzmoveis.com.br 504 RIMO S.A. IND. COM. Linhares ES www.rimo.com.br 505 RIVERA MÓVEIS IND. COM. LTDA. Araras SP www.riveramoveis.com.br 506 ROBEL IND.DE MÓVEIS LTDA. Mirassol SP www.robel.com.br • • Exporta Export Nº de Funcionários Number of Employees 210 • • • 465 • 466 1.999 9 467 1.976 80 468 • 1.985 64 • • 1.997 9 • 1.976 272 • 1.968 200 • 1.999 130 473 • 1.996 120 474 • • • • • • • Fundação Foundation 66 1.984 • • • Outras Others 1.992 • • • • • • • • • • • • • • • • • • • • • • • • • 475 50 476 2.000 5 477 1.968 94 480 • 1.992 7 481 • 1.994 21 482 • 1.964 264 483 • 1.988 272 484 • 1.975 39 1.965 275 • 486 1.966 266 • 487 1.989 32 • • 13 • • • 1.978 1.993 479 • • 472 478 • • 471 6 • • • 8 • • 470 2.002 • • 469 1.984 • • • • • • Espuma Spume Plástico Plastic Vime - Ratan Wattle - Rattan • • • Nº # Material / Material • • Metal Metal Madeira Wood Colchões Mattresses Partes de Móveis Furniture parts Institucionais Institutionals Terraços - Jardins Terrace - Gardens Cozinha - Banheiro Kitchen - Bathroom Estofados Upholsters Salas de Estar Living Room Salas de Jantar Room dinners Escritórios Offices Dormitórios Bedrooms Principais Produtos / Main products • 485 488 1.972 78 • 1.995 5 490 • 1.989 6 491 • 2.000 272 492 • • • • 489 1.989 250 1.994 75 493 494 1.974 1.100 495 • 1.971 70 496 • • 1.996 66 497 • • 1.993 9 498 • • 1.994 3 499 • • • • • • • • • • • • • • • • • 1.978 98 500 1.995 6 501 1.966 391 • 1.997 82 • 502 • 1.989 374 • 504 • 1.968 314 • 505 • 1.976 170 503 506 103 BRASIL MÓVEIS – 2006 / FURNITURE BRAZIL - 2006 Região Sudeste Southeast Region Nº # 104 Empresas / Companies Sede / City UF Contato / Contact State 507 ROBERTO EDUARDO DA SILVA Belo Horizonte MG 55 31 3332-9042 508 RONDOMÓVEIS LTDA. São Geraldo MG 55 32 3556-1368 509 ROTA MÓVEIS E DECORAÇÕES LTDA. São Paulo SP www.rotamoveis.com.br 510 RVZ INSTALAÇÕES COM. LTDA. São José do Rio Preto SP www.rvz.com.br 511 SABRINA MÓVEIS LTDA. Ipanema MG 55 33 3314-120 512 SANDES & BARRETO LTDA. Valentim Gentil SP 55 17 3485-1448 513 SANTA EMILIA IND. COM. DE MÓVEIS São Bernardo do Campo SP 55 11 4358-2375 514 SANTA TEREZA INDL. LTDA. Ribeirão das Neves MG www.santaterezamoveis.com.br 515 SANTOS & CARNAYBA LTDA. Mogi Mirim SP 55 19 3806-4249 516 SEALY DO BRASIL LTDA. Sorocaba SP www.sealy.com.br 517 SECURIT S.A. Guarulhos SP www.securit.com.br 518 SEIDAI MARCENARIA LTDA. São Paulo SP 55 11 5622-3276 519 SEME EL SAIFI COZINHAS - EPP São Bernardo do Campo SP www.semesa.com.br 520 SERBRA LTDA. Belo Horizonte MG www.lineaadora.com.br 521 SERRARIA CARVALHO IND. COM. LTDA. Porangaba SP www.sofaecolchoes.com.br 522 SERTA DO BRASIL IND. COM. LTDA. São João da Boa Vista SP 55 19 3633-5790 523 SILVESTRE MÓVEIS E DECORAÇÕES LTDA. São Paulo SP 55 11 3672-3709 524 SMG- IND. COM. DE MÓVEIS LTDA. Ribeirão Preto SP 55 16 3632-0696 525 SOFATEC ESTOFAMENTOS LTDA. Vitória ES 55 27 3222-3182 526 SOFORTE IND. COM. DE ESTOFADOS LTDA. Sorocaba SP www.soforte.com.br 527 STELLA & CIA LTDA. São Paulo SP 55 11 6946-9721 528 TACOLANDIA IND. COM. DE ARTEFATOS DE MADEIRA LTDA. São Paulo SP www.tacolandia.com.br 529 TALENTU’S MÓVEIS LTDA. Votuporanga SP 55 17 3421-6661 530 TCIL MÓVEIS LTDA. Ubá MG www.tcil.com.br 531 TECHFOAM IND. COM. LTDA. Suzano SP www.techfoam.com.br 532 THAISI IND. COM. DE MÓVEIS LTDA. Linhares ES www.thaisimoveis.com.br 533 THAMA IND. COM. DE MÓVEIS LTDA. Arthur Nogueira SP 55 19 3877-1522 534 TORA TORA MARCENARIA E DECORAÇÃO LTDA. São Paulo SP 55 11 3661-1024 535 TRADICIONAL MÓVEIS DE FAB. LTDA. Bom Despacho MG 55 37 3521-1290 536 TRÊS R MÓVEIS E CIA LTDA. Carmo do Cajuru MG 55 37 3244-1085 537 TRESELE IND. COM. DE MÓVEIS LTDA. Rio de Janeiro RJ www.tresele.com.br 538 UNIÃO INSTALAÇÕES COM. LTDA. Belo Horizonte MG 55 31 3383-0014 539 UNIERRE MÓVEIS LTDA. Guidoval MG www.unierre.com.br 540 VALDIRENE MAGDA CORGOZINHO DE CARVALHO SILVA- ME Martinho Campos MG 55 37 3524-2344 541 VALVERDE IND.E TRANSPORTES LTDA. Ubá MG www.valverde.ind.br 542 VERAZA IND. COM. LTDA. Contagem MG www.discanso.com.br 543 VERSATILE IND. COM. DE MÓVEIS LTDA. São Bernardo do Campo SP 55 11 4390-7090 544 VIA AURELIO IND. COM. DE MÓVEIS LTDA. São Paulo SP www.marcenariabrasileira.com.br 545 VICTORINO IND. COM. COLCHÕES LTDA. Atibaia SP 55 11 4411-0658 • • • • • • • • • • • Exporta Export Nº de Funcionários Number of Employees Fundação Foundation Espuma Spume Plástico Plastic Vime - Ratan Wattle - Rattan Outras Others Nº # Material / Material • • Metal Metal Madeira Wood Colchões Mattresses Partes de Móveis Furniture parts Institucionais Institutionals Terraços - Jardins Terrace - Gardens Cozinha - Banheiro Kitchen - Bathroom Estofados Upholsters Salas de Estar Living Room Salas de Jantar Room dinners Escritórios Offices Dormitórios Bedrooms Principais Produtos / Main products • • 6 507 1.991 316 508 1.969 35 509 • 1.975 50 510 • • 1.992 70 511 • • 1.998 65 512 • • 1.975 12 513 • 1.996 290 514 • 1.999 5 515 • • • • • 1.993 • • • • • 1.993 200 1.966 250 • 1.994 1 518 • 1.999 42 519 • 1.966 57 520 • 1.981 304 521 1.998 50 522 1.987 9 523 • • • • • • • • • • • • • • • • • • 516 • 517 1.994 27 524 • 1.998 10 525 • 1.995 304 526 • 1.967 5 527 • 1.984 12 528 • • 1.994 54 • • 1.990 313 1.988 120 531 1.997 52 532 • • • • • • • • • • • • • • • • • • • • • • 30 533 26 534 • 1.997 6 535 • 1.996 14 536 • • 1.990 60 537 • • 1.991 6 538 • 1.986 130 539 • 1.999 6 540 • • • • • • • • • • 1.996 1.993 • • • • 530 • • • • 529 • • • • • • • 1.988 130 541 1.995 25 542 2.001 9 543 1.986 50 544 2.000 5 545 105 BRASIL MÓVEIS – 2006 / FURNITURE BRAZIL - 2006 Região Sudeste Southeast Region Nº # Empresas / Companies Sede / City UF Contato / Contact State 546 VIDROALL LTDA. Uberlândia MG 55 34 3214-0041 547 VOKO INTERSTEEL MÓVEIS LTDA. Barueri SP www.voko.com.br 548 W A AVELINO Curvelo MG 55 38 3721-3804 549 XAVIER DE MENESES IND. COM. MÓVEIS LTDA. São Paulo SP www.mxdecoracoes.com.br 550 Y K IND. COM. DE MÓVEIS LTDA. São Paulo SP www.yukidesigne.com.br 551 ZANETTI GIAIN LTDA. Colatina ES www.zanettimoveis.com.br 552 ZANOTELI E PEZZIN LTDA. Colatina ES 55 27 3722-3626 553 ZIFF HEALTH DO BRASIL LTDA. Hortolândia SP 55 19 3887-1637 55 61 3234-5900 Região Centro-Oeste Midwest Region 554 COLLECTION MÓVEIS COM. IND.LTDA. Brasília DF 555 COM-ART IND. COM. DE MÓVEIS LTDA. Goiânia GO 55 62 3582-1565 556 COMPENSADOS TRIUNFO LTDA. Campo Grande MS www.compensadostriunfo.com.br 557 FLEXIBASE IND. COM. DE MÓVEIS LTDA. Aparecida de Goiânia GO www.flexibase.com.br 558 GAVE COZINHAS E ARMÁRIOS LTDA. Aparecida de Goiânia GO www.gave.com.br 559 IND. COM. DE ESPUMAS E COLCHÕES CUIABA LTDA. Várzea Grande MT www.ortobom.com.br 560 IND.DE MÓVEIS SOLAR PARK LTDA. Aparecida de Goiânia GO 55 62 3594-7078 561 LÍDER DO BRASIL & CIA LTDA. Aparecida de Goiânia GO 55 62 3284-6489 562 MAXIMA COZINHAS E ARMÁRIOS LTDA. Aparecida de Goiânia GO 55 62 3242-3398 563 METALÚRGICA VELGO IND. COM. DE MÓVEIS LTDA. Aparecida de Goiânia GO 55 62 3523-8900 564 NOBEL MÓVEIS LTDA. Brasília DF www.nobelmoveis.com.br Região Nordeste Northeast Region 106 565 DALBAN IND.REUNIDAS S.A. São Luiz MA 55 98 3241-1083 566 EL CANA IND. COM. DE MÓVEIS LTDA. Fortaleza CE 55 85 3257-7652 567 ELIZANGELA MARIA LIMA TEOTÔNIO DE SOUSA - ME Fortaleza CE 55 85 3276-5621 568 EUROFLEX IND. COM. DE COLCHÕES LTDA. Jaguaruana CE 55 88 3418-1171 569 F ALVES PINHEIRO - ME Fortaleza CE 55 85 3292-1430 570 F V FERREIRA MÓVEIS - ME Fortaleza CE 55 85 3296-1861 571 FRANCISCA ANA LUCIA FREIRE QUEIROZ- ME Fortaleza CE 55 85 3290-2782 572 IEDA MARIA FREIRE ORNELLAS - ME Vitória da Conquista BA 55 77 3421-4112 573 IND.CEARENSE DE COLCHÕES E ESPUMAS LTDA. Maracanaú CE 55 85 3499-8000 574 ITALSOFA BAHIA LTDA. Simões Filho BA www.natuzzi.com 575 JOSÉ HERCULANO TABOSA - ME Fortaleza CE 55 85 3235-4617 • • • • • • • • • • • • • • • • • • • • • • • • • • 1.998 7 552 • 1.991 24 553 • 1.974 35 554 • 1.984 58 • 1.996 200 2.002 51 557 1.994 24 558 1.966 391 1.996 6 560 2.001 2 561 2.000 18 562 1.990 37 563 1.973 180 564 1.986 55 565 1.998 10 566 • • • • • • • • • • • • • • • • • • 556 559 1.994 36 567 1.997 260 568 • 1.987 10 569 • • 1.995 8 570 1.996 8 571 • • • 1.997 40 572 1.998 244 573 • 2.000 695 • 1.997 1 • • 555 • • • • • • • Exporta Export • • • Nº de Funcionários Number of Employees • • • Fundação Foundation 551 • • 549 550 • • 548 5 15 • • 15 1.994 60 • • 1.999 547 1.982 • • 546 • 1.973 • • 8 297 • • • 1.993 1.992 • • • Nº # Material / Material • • Outras Others Espuma Spume Plástico Plastic Vime - Ratan Wattle - Rattan Metal Metal Madeira Wood Colchões Mattresses Partes de Móveis Furniture parts Institucionais Institutionals Terraços - Jardins Terrace - Gardens Cozinha - Banheiro Kitchen - Bathroom Estofados Upholsters Salas de Estar Living Room Salas de Jantar Room dinners Escritórios Offices Dormitórios Bedrooms Principais Produtos / Main products • • 574 575 107 BRASIL MÓVEIS – 2006 / FURNITURE BRAZIL - 2006 Região Nordeste Northeast Region Nº # Empresas / Companies Sede / City UF Contato / Contact State 576 M2 MACRO IND. COM. LTDA. Maceió AL 55 82 3338-1526 577 MEDICINAL IND. COM. E RECONDICIONAMENTO DE COLCHÃO LTDA. Assú RN 55 84 3331-2826 578 METALÚRGICA MOURA COM. IND.LTDA. Fortaleza CE 55 85 3291-6094 579 MJ PONTE LTDA. Fortaleza CE 55 85 3247-1422 580 NORDESPUMA IND. COM. LTDA. Recife PE 55 81 3462-9442 581 NORDESTE COLCHÕES IND. COM. LTDA. Teresina PI 55 86 3211-2525 582 OFICINA MOVESCOLAR LTDA. Aracaju SE 55 79 3249-2466 583 ONIX S.A. IND.DE COLCHÕES E ESPUMA Teresina PI 55 86 3229-3737 584 PIMENTEL LOPES ENGENHARIA E ARQUITETURA LTDA. Maceió AL www.multidoor.com.br 585 RECONFLEX IND. COM. DE COLCHÕES LTDA. Sto. Antônio de Jesus BA 55 75 3631-4303 586 SANFLEX INDL. LTDA. Aracaju SE 55 79 3249-1549 587 SÓ ARMÁRIOS IND. COM. LTDA. Aracaju SE 55 79 3249-3040 588 SOCIMOL IND.DE COLCHÕES E MÓVEIS LTDA. Teresina PI www.socimol.com.br 589 SPUMAR IND. COM. LTDA. Imperatriz MA 55 99 3525-2224 590 TUBOARTE IND. COM. LTDA. Jaguaribe CE www.tuboarte.com.br Região Norte North Region 108 591 COLCHOARIA SOUZA IND. LTDA. Manaus AM 55 92 3233-3057 592 ESPLANADA IND. DE COLCHÕES LTDA. Manaus AM 55 92 3622-0781 593 IND. DE ESPUMAS E COLCHÕES BELEM LTDA. Marituba PA 55 91 4005-9300 594 IND. DE MÓVEIS GUARARAPES LTDA. Manaus AM 55 92 3611-3559 595 MASO INDL. S.A. Ananindeua PA 55 91 4005-4848 596 SMARJ IND. DA AMAZÔNIA LTDA. Manaus AM 55 92 3633-4384 Principais Produtos /Main products • • • • • Material / Material • • • • • • • • • • • • • • • • • • • • • • • • • Nº # 2.005 10 576 2.001 10 577 1.996 48 578 1.994 25 579 • 1.974 36 580 • 1.986 8 581 1.965 30 582 2.000 542 1.981 150 • 584 583 • • 1.993 153 585 • • 1.999 20 586 1.987 6 587 • 1.976 430 588 • 1.991 202 • 589 1.997 213 • 590 • • 1.986 10 591 • • 1.989 118 592 • • 1.998 300 593 1.990 206 594 • • 1.986 80 595 • • 2.000 35 596 109 Exporta Export Nº de Funcionários Number of Employees Fundação Foundation Outras Others Espuma Spume Plástico Plastic Vime - Ratan Wattle - Rattan Metal Metal Madeira Wood Colchões Mattresses Partes de Móveis Furniture parts Institucionais Institutionals Terraços - Jardins Terrace - Gardens Cozinha - Banheiro Kitchen - Bathroom Estofados Upholsters Salas de Estar Living Room Salas de Jantar Room dinners Escritórios Offices Dormitórios Bedrooms aBIMÓVEL • APEX BRASIL • BRAZILIAN FURNITURE • CASA BRASIL • CGI • FIMMA • FINEP • INOVAÇÃO • MOVELSUL • MOVERGS • SINDMÓVEIS • SEBRAE • aBIMÓVEL • APEX BRASIL • BRAZILIAN FURNITURE • CASA BRASIL • CGI • FIMMA • FINEP • INOVAÇÃO • MOVELSUL • MOVERGS • BRASIL MÓVEIS – 2006 / FURNITURE BRAZIL - 2006 SINDMÓVEIS • SEBRAE • aBIMÓVEL • APEX BRASIL • BRAZILIAN FURNITURE • CASA BRASIL • CGI • FIMMA • FINEP • INOVAÇÃO • MOVELSUL • MOVERGS • SINDMÓVEIS • SEBRAE • aBIMÓVEL • APEX BRASIL • BRAZILIAN FURNITURE • CASA BRASIL • CGI • FIMMA • FINEP • INOVAÇÃO • MOVELSUL • MOVERGS • SINDMÓVEIS • SEBRAE • aBIMÓVEL • APEX BRASIL • BRAZILIAN FURNITURE • CASA BRASIL • CGI • FIMMA • FINEP • INOVAÇÃO • MOVELSUL • MOVERGS • SINDMÓVEIS • SEBRAE • aBIMÓVEL • APEX BRASIL • BRAZILIAN FURNITURE • CASA BRASIL • CGI • FIMMA • FINEP • INOVAÇÃO • MOVELSUL • MOVERGS • SINDMÓVEIS • SEBRAE • aBIMÓVEL • APEX BRASIL • BRAZILIAN FURNITURE • CASA BRASIL • CGI • FIMMA • FINEP • INOVAÇÃO • MOVELSUL • MOVERGS • SINDMÓVEIS • SEBRAE • aBIMÓVEL • APEX BRASIL • BRAZILIAN FURNITURE • CASA BRASIL • CGI • FIMMA • FINEP • INOVAÇÃO • MOVELSUL • MOVERGS • SINDMÓVEIS • SEBRAE • aBIMÓVEL • APEX BRASIL • BRAZILIAN FURNITURE • CASA BRASIL • CGI • FIMMA • FINEP • INOVAÇÃO • MOVELSUL • MOVERGS • SINDMÓVEIS • SEBRAE • aBIMÓVEL • APEX BRASIL • BRAZILIAN FURNITURE • CASA BRASIL • CGI • FIMMA • FINEP • INOVAÇÃO • MOVELSUL • MOVERGS • SINDMÓVEIS • SEBRAE • aBIMÓVEL • APEX BRASIL • BRAZILIAN FURNITURE • CASA BRASIL • CGI • FIMMA • FINEP • INOVAÇÃO • MOVELSUL • MOVERGS • SINDMÓVEIS • SEBRAE • aBIMÓVEL • APEX BRASIL • BRAZILIAN FURNITURE • CASA BRASIL • CGI • FIMMA • FINEP • INOVAÇÃO • MOVELSUL • MOVERGS • SINDMÓVEIS • SEBRAE • aBIMÓVEL • APEX BRASIL • BRAZILIAN FURNITURE • CASA BRASIL • CGI • FIMMA • FINEP • INOVAÇÃO • MOVELSUL • MOVERGS • SINDMÓVEIS • SEBRAE • aBIMÓVEL • APEX BRASIL • BRAZILIAN FURNITURE • CASA BRASIL • CGI • FIMMA • FINEP • INOVAÇÃO • MOVELSUL • MOVERGS • SINDMÓVEIS • SEBRAE • aBIMÓVEL • APEX BRASIL • BRAZILIAN FURNITURE • CASA BRASIL • CGI • FIMMA • FINEP • INOVAÇÃO • MOVELSUL • MOVERGS • SINDMÓVEIS • SEBRAE • aBIMÓVEL • APEX BRASIL • BRAZILIAN FURNITURE • CASA BRASIL • CGI • FIMMA • FINEP • INOVAÇÃO • MOVELSUL • MOVERGS • SINDMÓVEIS • SEBRAE • aBIMÓVEL • APEX BRASIL • BRAZILIAN FURNITURE • CASA BRASIL • CGI • FIMMA • FINEP • INOVAÇÃO • MOVELSUL • MOVERGS • SINDMÓVEIS • SEBRAE • aBIMÓVEL • APEX BRASIL • BRAZILIAN FURNITURE • CASA BRASIL • CGI • FIMMA • FINEP • INOVAÇÃO • MOVELSUL • MOVERGS • SINDMÓVEIS • SEBRAE • aBIMÓVEL • APEX BRASIL • BRAZILIAN FURNITURE • CASA BRASIL • CGI • FIMMA • FINEP • INOVAÇÃO • MOVELSUL • MOVERGS • SINDMÓVEIS • SEBRAE • aBIMÓVEL • APEX BRASIL • BRAZILIAN FURNITURE • CASA BRASIL • CGI • FIMMA • FINEP • INOVAÇÃO • MOVELSUL • MOVERGS • SINDMÓVEIS • SEBRAE • aBIMÓVEL • APEX BRASIL • BRAZILIAN FURNITURE • CASA BRASIL • CGI • FIMMA • FINEP • INOVAÇÃO • MOVELSUL • MOVERGS • SINDMÓVEIS • SEBRAE • aBIMÓVEL • APEX BRASIL • BRAZILIAN FURNITURE • CASA BRASIL • CGI • FIMMA • FINEP • INOVAÇÃO • MOVELSUL • MOVERGS • SINDMÓVEIS • SEBRAE • aBIMÓVEL • APEX BRASIL • BRAZILIAN FURNITURE • CASA BRASIL • CGI • FIMMA • FINEP • INOVAÇÃO • MOVELSUL • MOVERGS • SINDMÓVEIS • SEBRAE • aBIMÓVEL • APEX BRASIL • BRAZILIAN FURNITURE • CASA BRASIL • CGI • FIMMA • FINEP • INOVAÇÃO • MOVELSUL • MOVERGS • SINDMÓVEIS • SEBRAE • aBIMÓVEL • APEX BRASIL • BRAZILIAN FURNITURE • CASA BRASIL • CGI • FIMMA • FINEP • INOVAÇÃO • MOVELSUL • MOVERGS • SINDMÓVEIS • SEBRAE • aBIMÓVEL • APEX BRASIL • BRAZILIAN FURNITURE • CASA BRASIL • CGI • FIMMA • FINEP • INOVAÇÃO • MOVELSUL • MOVERGS • SINDMÓVEIS • SEBRAE • aBIMÓVEL • APEX BRASIL • BRAZILIAN FURNITURE • CASA BRASIL • CGI • FIMMA • FINEP • INOVAÇÃO • MOVELSUL • MOVERGS • SINDMÓVEIS • SEBRAE • aBIMÓVEL • APEX BRASIL • BRAZILIAN FURNITURE • CASA BRASIL • CGI • FIMMA • FINEP • INOVAÇÃO • MOVELSUL • MOVERGS • SINDMÓVEIS • SEBRAE • aBIMÓVEL • APEX BRASIL • BRAZILIAN FURNITURE • CASA BRASIL • CGI • FIMMA • FINEP • INOVAÇÃO • MOVELSUL • MOVERGS • SINDMÓVEIS • SEBRAE • aBIMÓVEL • APEX BRASIL • BRAZILIAN FURNITURE • CASA BRASIL • CGI • FIMMA • FINEP • INOVAÇÃO • MOVELSUL • MOVERGS • SINDMÓVEIS • SEBRAE • aBIMÓVEL • APEX BRASIL • BRAZILIAN FURNITURE • CASA BRASIL • CGI • FIMMA • FINEP • INOVAÇÃO • MOVELSUL • MOVERGS • SINDMÓVEIS • SEBRAE • aBIMÓVEL • APEX BRASIL • BRAZILIAN FURNITURE • CASA BRASIL • CGI • FIMMA • FINEP • INOVAÇÃO • MOVELSUL • MOVERGS • SINDMÓVEIS • SEBRAE • aBIMÓVEL • APEX BRASIL • BRAZILIAN FURNITURE • CASA BRASIL • CGI • FIMMA • FINEP • INOVAÇÃO • MOVELSUL • MOVERGS • SINDMÓVEIS • SEBRAE • aBIMÓVEL • APEX BRASIL • BRAZILIAN FURNITURE • CASA BRASIL • CGI • FIMMA • FINEP • INOVAÇÃO • MOVELSUL • MOVERGS • SINDMÓVEIS • SEBRAE • aBIMÓVEL • APEX BRASIL • BRAZILIAN FURNITURE • CASA BRASIL • CGI • FIMMA • FINEP • INOVAÇÃO • MOVELSUL • MOVERGS • SINDMÓVEIS • SEBRAE • aBIMÓVEL • APEX BRASIL • BRAZILIAN FURNITURE • CASA BRASIL • CGI • FIMMA • FINEP • INOVAÇÃO • MOVELSUL • MOVERGS • SINDMÓVEIS • SEBRAE • aBIMÓVEL • APEX BRASIL • BRAZILIAN FURNITURE • CASA BRASIL • CGI • FIMMA • FINEP • INOVAÇÃO • MOVELSUL • MOVERGS • SINDMÓVEIS • SEBRAE • aBIMÓVEL • APEX BRASIL • BRAZILIAN FURNITURE • CASA BRASIL • CGI • FIMMA • FINEP • INOVAÇÃO • MOVELSUL • MOVERGS • SINDMÓVEIS • SEBRAE • aBIMÓVEL • APEX BRASIL • BRAZILIAN FURNITURE • CASA BRASIL • CGI • FIMMA • FINEP • INOVAÇÃO • MOVELSUL • MOVERGS • SINDMÓVEIS • SEBRAE • aBIMÓVEL • APEX BRASIL • BRAZILIAN FURNITURE • CASA BRASIL • CGI • FIMMA • FINEP • INOVAÇÃO • MOVELSUL • MOVERGS • SINDMÓVEIS • SEBRAE • aBIMÓVEL • APEX BRASIL • BRAZILIAN FURNITURE • CASA BRASIL • CGI • FIMMA • FINEP • INOVAÇÃO • MOVELSUL • MOVERGS • SINDMÓVEIS • SEBRAE • aBIMÓVEL • APEX BRASIL • BRAZILIAN FURNITURE • CASA BRASIL • CGI • FIMMA • FINEP • INOVAÇÃO • MOVELSUL • MOVERGS • SINDMÓVEIS • SEBRAE • aBIMÓVEL • APEX BRASIL • BRAZILIAN FURNITURE • CASA BRASIL • CGI • FIMMA • FINEP • INOVAÇÃO • MOVELSUL • MOVERGS • SINDMÓVEIS • SEBRAE • aBIMÓVEL • APEX BRASIL • BRAZILIAN Preço deste Relatório R$ 290,00 – Para o exterior US$ 190.00 – Pedidos: 55 11 3167-3202 – email: [email protected] IEMI – instituto de estudos e marketing industrial www.iemi.com.br 110 BRASIL MÓVEIS – 2006 / FURNITURE BRAZIL - 2006 Apoio: ASSOCIAÇÃO DAS INDÚSTRIAS DE MÓVEIS DO ESTADO DO RIO GRANDE DO SUL Av. Osvaldo Aranha, 1.075 - 4º andar - Salas 401/402 - Bento Gonçalves - RS - CEP 95700-000 Caixa Postal 585 - Fone/Fax: (54) 2102-2450 - [email protected] - www.movergs.com.br 112
Download