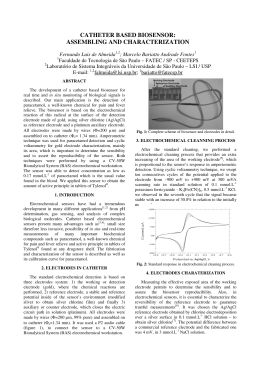
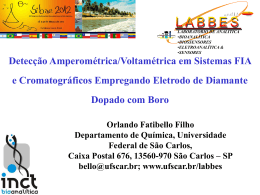
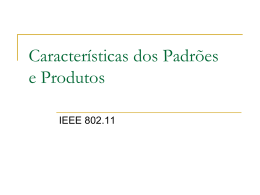
Portugaliae Electrochimica Acta 2011, 29(5), 343-348 DOI: 10.4152/pea.201105343 PORTUGALIAE ELECTROCHIMICA ACTA ISSN 1647-1571 Effect of the Hydrodynamic Conditions on the Electrochemical Degradation of Phenol on a BDD Anode S. Sobreira, M.J. Pacheco, L. Ciríaco and A. Lopes* UMTP and Department of Chemistry, University of Beira Interior, 6201-001 Covilhã, Portugal Received 3 January 2011; accepted 24 February 2011 Abstract The influence of the hydrodynamics of the system on the extent of the electrochemical degradation of phenol, using a boron doped diamond (BDD) anode was investigated. Two different electrochemical cells were used: a batch stirred cell (A), with a volume of 200 mL and a BDD anode of 17.5 cm2, and a batch with recirculation cell (B), with a BDD anode of 70 cm2 and connected to a tank of 30 L. Assays were performed at different stirring speeds and applied current density of 300 A m-2, for cell A, and various flow rates, with an imposed current density of 100 A m-2, for cell B. Chemical oxygen demand (COD) and total organic carbon (TOC) tests were performed to the samples collected throughout the assays, as well as UV-Vis spectrophotometric measurements. For cell A, after 2 h assay, COD removals between 84 and 94% and TOC removals ranging from 54 and 86 % were attained. For the assays run with cell B, during 10 h, COD and TOC removals varied from 27 to 51% and from 23 to 46%, respectively. The influence of the turbulence near the electrode’s surface in the combustion efficiency was also analysed. Keywords: phenol; boron doped diamond electrode; electrochemical oxidation; hydrodynamic conditions. Introduction Phenol is one of the pollutants whose degradation has been under intense study in the last decades. In fact, it is often chosen as model pollutant. G. Busca and collaborators presented an extensive review over the different ways to promote its degradation [1]. Electrochemical oxidation of effluents containing persistent organic pollutants is an alternative or tertiary treatment that has received much attention in the last years due to its interesting characteristics, since it is a clean process, can operate at low temperature and, in most cases, without adding any chemical and without * Corresponding author. E-mail address: [email protected] S. Sobreira et al. / Port. Electrochim. Acta 29 (2011) 343-348 sludge formation. Recently, the use of boron doped diamond (BDD) as anode material has proved to be very useful, since, besides its good mechanical and electrochemical stability, it has unique electrochemical characteristics, like large potential window for water decomposition [2], ability to produce hydroxyl radicals [3] poorly adsorbed on the electrode’s surface [4] and that can perform the oxidation of the pollutants simultaneously in the bulk of the solution. Therefore, BDD anodes are an excellent material for the oxidation of all kinds of pollutants [5]. In particular, the electrooxidation of phenol and other phenolic compounds has already been carried out with BDD anodes, at bench scale, with good degradation rate [6,7]. However, to scale-up the process to an industrial level, a better understanding of the mass transfer during the electrochemical process is needed. The objective of this work is to study the influence of the hydrodynamic conditions on the mass transfer process during the anodic oxidation of phenol, using BDD as anode material, in two different electrochemical cells: a small batch stirred cell and a pilot cell with re-circulating flow. Experimental Two sets of electrochemical assays were run, using different experimental setups. The first one (A) consisted of an electrochemical cell, with a BDD anode of 17.5 cm2 area, purchased from Adamant Technologies/CSEM, Switzerland, and the degradation was carried out in batch mode, for 2 h, at several stirring rates, using 200 mL of an aqueous 0.035 M Na2SO4 solution, containing 300 mg L-1 of phenol (purchased from Aldrich). Current was imposed by a laboratory power supply GW, model GPS-3O3OD. Cell B was a DiaCel 196PVDF, with two monopol BDD electrodes (70 cm2 area), from Adamant Technologies/CSEM, Switzerland, used with a Power supply DiaCell, PC-1500. These assays were performed in batch with recirculation mode, for 10 h, and a centrifugal pump, Wilo, Serie MHI, enabled the recirculation of the solution at the different flow rates tested. The composition of the solution was identical of that in cell A, but a volume of 30 L was used here and re-circulation flow rates of 200, 300 and 500 L h-1 were tested. The electrochemical assays were performed in galvanostatic mode, at imposed current densities of 300 and 100 A m-2 for cells A and B, respectively. Phenol degradation tests were followed by UV-Visible spectrophotometry, with absorbance being measured from 200 to 600 nm, using a UNICAM -Heλios-α UV/VIS spectrophotometer, by Chemical Oxygen Demand (COD) tests, using the closed reflux dichromate titrimetric method [8], and by Total Organic Carbon (TOC) determinations, performed in a Shimadzu TOC-VCPH apparatus. 344 S. Sobreira et al. / Port. Electrochim. Acta 29 (2011) 343-348 Results and discussion COD analysis Fig. 1 presents the experimental COD removal as a function of the assays’ duration, for the different experimental conditions tested with both electrochemical cells. In the case of the assays performed with cell A, at the applied current density of 30 A m-2, the electrodegradation is diffusion controlled and COD follows an exponential decay, according to equation [9]: COD=COD0 e - kd A t V (1) where COD0 refers to the initial COD, A, V and t are the area of the electrode, the volume of the solution and the time, respectively, and kd is the medium mass transfer coefficient. This exponential equation was fitted to experimental data up to 90 min, since after that period of time experimental data differs from fitted equation. This fact must be due to an incomplete combustion that leads to the formation and accumulation of new metabolites, with a different kd. The kd values, determined from the fittings depicted in Fig. 1 (Cell A), are presented in Table 1, showing that an increase in the stirring rate leads to an increase in the medium mass transfer coefficient, probably due to a decrease in the width of the diffusion layer. 0.8 COD / COD0 1.0 100 rpm 300 rpm 500 rpm y = exp (-0.0086 * x) 2 R =0.987 y = exp (-0.0165 * x) 2 R =0.996 y = exp (-0.0180 * x) 2 R =0.993 Cell A 0.6 Cell B 0.8 COD / COD0 1.0 0.4 0.6 200 L h-1 300 L h-1 500 L h-1 y = -0.0233 * x + 1 2 R =0.982 y = -0.0535 * x + 1 2 R =0.994 y = -0.0575 * x + 1 2 R =0.998 0.4 0.2 0.2 0.0 0.0 0 15 30 45 60 75 90 105 120 0 135 2 4 6 8 10 12 t/h t / min Figure 1. COD relative removal vs. time for the electrochemical degradation of phenol performed in cell A, at different stirring rates and applied current density of 30 A m-2, and in cell B, at different re-circulation flow rates and applied current density of 10 A m-2. Phenol initial concentration: 300 ppm; electrolyte: 0.035 M Na2SO4 aqueous solution. Regarding the assays performed with cell B, at 100 A m-2, the COD decay follows a linear fitting, typical from a current controlled process. However, in the fitting of linear equations to experimental results different slopes were obtained, which was not expected, since current intensity did not vary. The lower COD decay observed for the lower flow rate must be related with the formation of metabolites that may polarize the surface of the electrode, being removed more easily with the increase in flow rate. Also, in these assays, after an initial period, 345 S. Sobreira et al. / Port. Electrochim. Acta 29 (2011) 343-348 there is a change in the trend of COD decay, pointing out to an incomplete combustion of phenol, with the consequent formation of metabolites. Table 1. Removals of COD, TOC and Abs, measured at 210 and 270 nm, for the assays performed with cells A and B, after 2 h and 10 h run, respectively, as well as medium mass transfer coefficients, kd, determined for cell A, and combustion efficiencies, ηc, calculated for cells A and B at the different experimental conditions tested. Removal / % Cell Experimental conditions Stirring rate / rpm A Recirculation flow rate / L h-1 B Abs (270 nm) kd / 10 m s-1 dTOC dCOD ηc COD TOC Abs (210 nm) 100 84 64 69 72 1.6 0.259 0.80 300 88 82 88 90 3.1 0.248 0.77 500 94 86 93 96 3.6 0.243 0.76 -5 200 27 23 20 22 -- 0.218 0.67 300 45 40 32 32 -- 0.223 0.69 500 51 46 40 37 -- 0.245 0.76 TOC analysis The samples collected during the assays were analyzed for the total organic carbon content. Experimental results and the best equations fitted to the experimental points are presented in Fig. 2. TOC removal increases with the stirring speed and with the flow rate, like it was observed for the COD variation. However, the removal of TOC is slower than the removal of COD, meaning that the electrochemical oxidation does not correspond to a complete mineralization. In the case of the highest flow rate tested, there is a clear deviation, after 4 h assay, from the initial TOC decay trend, meaning that metabolites formed are more resistant to mineralization than phenol. 1.0 1.0 Cell A 0.8 TOC/ TOC0 TOC/ TOC0 0.8 Cell B 0.6 100 rpm 300 rpm 500 rpm y = exp (-0.0084 * x) 2 R = 0.994 y = exp (-0.0135 * x) 2 R = 0.989 y = exp (-0.0150 * x) 2 R = 0.983 0.4 0.2 0.6 200 L h-1 300 L h-1 500 L h-1 y = -0.0218 * x + 1 2 R = 0.982 y = -0.0408 * x + 1 2 R = 0.994 y = -0.0634 * x + 1 2 R = 0.998 0.4 0.2 0.0 0.0 0 15 30 45 60 75 90 105 120 135 0 2 4 6 8 10 12 t/h t / min Figure 2. TOC relative removal vs. time for the electrochemical degradation of phenol performed in cell A, at different stirring rates and applied current density of 30 A m-2, and in cell B, at different re-circulation flow rates and applied current density of 10 A m-2. Phenol initial concentration, 300 ppm; electrolyte, 0.035 M Na2SO4 aqueous solution. 346 S. Sobreira et al. / Port. Electrochim. Acta 29 (2011) 343-348 Ultraviolet-Visible spectrophotometry analysis In Fig. 3 the relative absorbance removal with time is depicted for some of the experiments performed in both cells. Two different wavelengths, related to maximum of absorbance, were chosen in the ultraviolet region, 210 and 270 nm. In the inserts of Fig. 3, it can also be observed the molecular structure of phenol and its UV-Vis. spectrum. For the assays performed in both electrochemical cells, the absorbance removal increases with stirring rate and flow rate. However, the decrease in absorbance depends on the wavelength, being, in general, the highest decrease observed for the band with a maximum at 210 nm. 100 rpm 100 rpm 300 rpm 300 rpm 500 rpm 500 rpm 1.0 0.9 Abs / Abs0 Abs / Abs0 0.8 0.6 0.4 2D Graph 1 0.8 / 210 nm / 270 nm / 210 nm / 270 nm / 210 nm / 270 nm 2.5 2 2.0 0.7 AO7 Abs 1.5 OH HO3S 200 L h-1 -1 200 L h 300 L h-1 -1 300 L h -1 500 L h 500 L h-1 Cell B / 210 nm / 270 nm / 210 nm / 270 nm / 210 nm / 270 nm Abs Cell A 1.0 OH 1 1.0 N 0.2 N 0.6 0.5 0 0.0 200 200 250 300 0.5 0.0 0 15 30 45 60 75 90 105 120 135 0 2 300 400 350 500 λ / λnm / nm 4 400 600 6 8 10 12 t/h t / min Figure 3. Relative absorbance (Abs) removal vs. time for the electrochemical degradation of phenol performed in cell A, at three different stirring rates and applied current density of 30 A m-2, and in cell B, at three different re-circulation flow rates and applied current density of 10 A m-2. Phenol initial concentration: 300 ppm; electrolyte: 0.035 M Na2SO4 aqueous solution. Inserts: phenol molecular structure and UV-Vis spectrum. Combustion efficiency According to Pacheco and co-workers [7], the efficiency of the combustion, ηc, can be estimated from the ratio between the rate of TOC decrease and the rate of COD decrease by: ηc = 32 n d TOC 12 4x d COD (2) where TOC is in mgC / L, COD in mg O / L, n is the number of electrons transferred to the electrode in the process of the complete combustion of the organic solute, and x is the number of carbon atoms in the organic molecule. For the calculation of n it was assumed that, for phenol, the combustion process is the following: 2 C6H6O + 11 H2O → 6 CO2 + 28 H+ + 28 e- 347 (3) S. Sobreira et al. / Port. Electrochim. Acta 29 (2011) 343-348 Plots of TOC vs. COD were then drawn to all assays performed in the different experimental conditions (data not shown), and the slopes thus obtained are listed in Table 1, as well as the combustion efficiencies calculated with eq. (2). Although the values of the combustion efficiencies for the different assays are similar, ηc presents a tendency to decrease with stirring rate, for the assays performed in cell A. However, in the case of the assays run in cell B, the combustion efficiency increases with the flow rate. Conclusions The electrochemical degradation of phenol was carried out in different hydrodynamic conditions, showing that an increase in turbulence near the electrode’s surface is a very important parameter and its control can be used to increase the rate of COD, TOC and absorbance removals. Regarding the mineralization index, measured as combustion efficiency, it slightly decreases with stirring rate in the assays performed in batch conditions and it increases with flow rate in the batch with recirculation experiments. Acknowledgements The financial support of Fundação para a Ciência e a Tecnologia, PDCT/AMB/59392/2004, PDCT/AMB/59388/2004 and PTDC/CTM/64856 /2006 as well as Adamant Technologies, are gratefully acknowledged. References 1. G. Busca, S. Berardinelli, C. Resini, L. Arrighi, J. Haz. Mat. 160 (2008) 265-288. 2. M. Fryda, D. Herrmann, L. Schäfer, C.P. Klages, A. Perret, W. Haenni, C. Comninellis, New Diam. Front. Carb. Technol. 9 (1999) 229-240. 3. C.A. Martínez-Huitle, S. Ferro, Chem. Soc. Rev. 35 (2006) 1324–1340. 4. B. Marselli, J. Garcia-Gomez, P.A. Michaud, M.A. Rodrigo, Ch. Comninellis, J. Electrochem. Soc. 150 (2003) D79-D83. 5. M. Panizza, G. Cerisola, Electrochim. Acta 51 (2005) 191-199. 6. A. Morão, A. Lopes, M.T. Pessoa de Amorim, I.C. Gonçalves, Electrochim. Acta 49 (2004) 1587-1595. 7. M.J. Pacheco, A. Morão, A. Lopes, L. Ciríaco, I. Gonçalves, Electrochim. Acta 53 (2007) 629-636. 8. A. Eaton, L. Clesceri, A. Greenberg, Standard Methods for Examination of Water and Wastewater, 21st Ed., APHA, AWWA, WEF, Washington, 2005. 9. M.A. Rodrigo, P.A. Michaud, I. Duo, M. Panizza, G. Cerisola, Ch. Comninellis, J. Electrochem. Soc. 148 (2001) 60-64. 348
Download