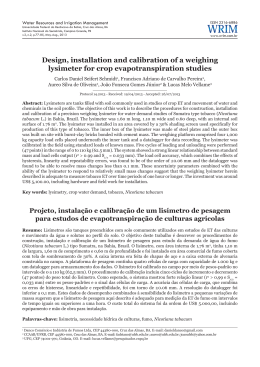
próximo artigo 93 4 Anais XIV Simpósio Brasileiro de Sensoriamento Remoto, Natal, Brasil, 25-30 abril 2009, INPE, p. 427-434. Assessment of daily actual evapotranspiration estimated by remote sensing algorithms Carlos Antonio Costa dos Santos1,2 Bergson Guedes Bezerra1 Bernardo Barbosa da Silva1 Christopher Michael Usher Neale2 1 Department of Atmospheric Science, Federal University of Campina Grande, Avenida Aprígio Veloso, 882, Bodocongó, Campina Grande, PB, CEP: 58109-970, Brazil [email protected]/ [email protected] 2 Biological and Irrigation Engineering Department, Utah State University, 4105 Old Main Hill, Logan, UT 84322, USA [email protected] Abstract: The main objective of this study was obtaining of the daily ET accuracy obtained through remote sensing algorithms when compared with Bowen ratio measurements on the cotton field. This experimental campaign was conducted in Ceará State, Brazil, in cotton experimental field of Embrapa. This study used 4 Landsat – 5TM images of 2005, to application of SEBAL and S-SEBI algorithms. The comparison between the estimated values by remote sensing algorithms and the measured values in the field showed that the methods presented accuracy considered satisfactory. However was evident the best performance of the SEBAL algorithm. The results evidenced that the S-SEBI algorithm is an important tool to be applied in analysis of semi-arid regions, because is not necessary uses meteorological data to solve the energy balance, and the processing is easier than SEBAL algorithm. Keywords: SEBAL, S-SEBI, evaporative fraction, Semi-arid, SEBAL, S-SEBI, fração evaporativa, semiárido 1 – Introduction The evapotranspiration (ET) including water evaporation from soil surfaces and vegetation transpiration represents a fundamental process of hydrological cycle and a key element of water resources management, particularly in semi-arid and arid regions (Gao et al., 2008). The partition of energy and water fluxes at the surface of Earth is controlled by ET. Most studies have demonstrated that the temporal and spatial patterns of ET depend on a large variety of factors, specifically vegetation and soil types, topography, and the meteorological conditions (Bastiaanssen et al., 1998). The conventional methods to measure ET are subject to field or landscape scales (for example, Bowen ratio, eddy covariance system, soil water balance), but are not used to fluxes estimation in larger spatial scales due the heterogeneity inherent in land surfaces and the dynamic nature of water-heat transport processes (Gao et al., 2008). Currently, remote sensing techniques are the only way to obtain variables at various temporal and spatial scales required to estimate ET. The Surface Energy Balance Algorithm for Land (SEBAL) (Bastiaanssen et al., 1998) uses spectral radiance and traditional meteorological data to solve the energy balance at the land surface. Another important algorithm is the Simplified Surface Energy Balance Index (S-SEBI) (Roerink et al., 2000). 427 Anais XIV Simpósio Brasileiro de Sensoriamento Remoto, Natal, Brasil, 25-30 abril 2009, INPE, p. 427-434. The main difference between these algorithms is because to application of S-SEBI is not necessary use meteorological data to solve the energy balance. In addition, while SEBAL compute the ET using the residual energy balance, the S-SEBI compute using the evaporative fraction (Λ) obtained through parameterizations based in surface albedo and surface temperature (Roerink et al., 2000), and instantaneous available energy (Rn − G ) , where Rn is net radiation and G is soil heat flux. The extrapolation of instantaneous to daily ET values constitutes an important step of the methods that use remote sensing data. The difficult task is to obtain the behavior of weather parameters, as cloudiness, for instance, before and/or after the satellite overpass. In SEBAL (Bastiaanssen et al., 1998; Bastiaanssen, 2000) and S-SEBI (Roerink et al, 2000; Sobrino et al., 2005, 2007) daily ET is estimated based in conservation of the daily fluxes (Brutsaert and Sugita, 1992). Thus, the ET calculation is based on the evaporative fraction, ratio between latent heat flux and available energy that is calculated instantly and adopted constant during the daily period. The cloudiness after the satellite overpass is counted in the calculation of daily ET in the curve of measured global radiation, however, other factors as the advection effect, that also constitutes an important element in ET are neglected, what can compromise the ET accuracy. The emphasis of this study is the evaluation of the daily ET accuracy obtained through remote sensing algorithms. The estimates values of the methods will be compared with field observations on the cotton crop. In this research the study area is located in a semi-arid region of Brazil, with few weather stations in operation, for this reason, the understanding of applications of the different remote sensing algorithms to obtain the ET is necessary. 2 – Material and methods 2.1 – Study area and data This experimental campaign was conducted in South of Ceará State, Brazil (Figure 1). The studied area correspond at experimental field of Embrapa (Brazilian Company of Agricultural Research) located in Barbalha – CE (7º17’S, 39º16’W). The regional climate is C1S2A’a’ sub humid with small water excess during the wet season, mega thermal and with vegetation during the year (Thornthwaith and Mather, 1955). This study used 4 Landsat – 5TM images of DOY 272, 288, 304, 320 of 2005, during the growth cycle of herbaceous cotton crop (cultivar 200-brown BRS). The data used in the validation of algorithms were obtained using the Bowen ratio energy balance (BREB) technique (Verma et al., 1978). The air temperature gradient between the dry and wet bulb, used in BREB, was measurement using the thermometers psychrometers, type T copper-constantan thermocouples installed in two levels at 0.5 m and 1.5 m above crop canopy. The net radiation (Rn) was measurement using the net radiometer (NR-LITE; Kipp & Zonen, Delft, The Netherlands), while the global radiation (Rg) and solar radiation incoming (Rg↓) was obtained with a radiometer (CM3; Kipp & Zonen Delft, The Netherlands), all radiation instruments were installed at 1.0 m above crop canopy, and soil heat flux (G) was measured with two heat flux plates (model HFP01SC-L, Campbell Scientific, Inc., Logan, UT) at 5.0 cm soil depth. 428 Anais XIV Simpósio Brasileiro de Sensoriamento Remoto, Natal, Brasil, 25-30 abril 2009, INPE, p. 427-434. Figure 1: Maps of Brazil and Ceará State with highlight to location of the study area, scene studied in the RGB composition and the cotton crop irrigated field localization (red rectangle) 2.2 – Algorithms descriptions SEBAL The actual ET was obtained using the energy balance equation, which models a system formed by vegetation, surrounding soil, and atmosphere: λET = Rn − H − G (1) The Rn, used in SEBAL and S-SEBI algorithms, was calculated using the following equation: Rn = (1 − α )RS ↓ + RL↓ − RL↑ − (1 − ε 0 )RL↓ (2) where α is the surface albedo, RL↑ is the longwave radiation (thermal) emitted by the surface, εo is the surface emissivity obtained through Leaf Area Index (LAI), RS↓ is the short-wave incident radiation, RL↓ is the longwave incident radiation, estimated from the Stefan-Boltzmann equation based on the air temperature at the instant of the satellite overpass (Bastiaanssen et al., 1998). The G (Wm-2), used in SEBAL and S-SEBI algorithms, was obtained through the following equation (Bastiaanssen, 2000): Ts G = (0.0038α + 0.0074α 2 )(1 − 0.98 DVI 4 ) Rn (3) α where TS is the surface temperature, and DVI is the Normalized Difference Vegetation Index. The difficult task in SEBAL is the method to calculate of H that is computed using the following equation of the heat transport: 429 Anais XIV Simpósio Brasileiro de Sensoriamento Remoto, Natal, Brasil, 25-30 abril 2009, INPE, p. 427-434. H= (ρcP dT ) (4) rah where ρ is the air density (kg m-3), cP is the air specific heat in constant pressure (J kg-1 K1 ), dT is the temperature difference (T1 − T2 ) between two height (z1 and z2), and rah is the aerodynamic resistance to heat transport (s m-1). This calculation is developed as function of the gradient temperature, surface roughness and wind speed. However, the equation 4 is difficult to solve, because dT and rah terms are unknown. To facilitate, it is used the “anchors” pixels, called hot and cold pixels, that must represent maximum conditions of temperature and humidity, where it is possible to obtain the values of H and dT. The obtaining of the rah and dT values to entire scene are computed admitting neutral atmosphere conditions by iterative process (Bastiaanssen et al., 1998). The first stage for the daily ET calculation using SEBAL methodology is the integration of instantaneous LE for hourly values, according to following equation: LET EThour = 3600 (5) L where EThour is the hourly evapotranspiration (mm h-1), 3600 is the time conversion from seconds to hours and L is the latent heat of vaporization or the heat absorbed when a kilogram of water evaporates (Jkg-1). According with Trezza (2002) the Reference ET Fractions (ETrF) is similar to crop coefficient (Kc) obtained through the equation 6: EThour ETrF = (6) ETr where ETr is the hourly reference evapotranspiration, calculated based in the FAO-PenmanMonteith method and data originating from weather station in the intervals between 9:00 and 10:00 hr local time. Considering that ETrF is equal to Kc (Trezza, 2002), and that maintain constant during the day, the daily actual ET was calculated by the classic method of FAO-56 (Allen et al., 1998): ET = ETrFETr (24 ) (7) where ETr(24) is the daily reference evapotranspiration, calculated using data proceeding from weather station and FAO-Penman-Monteith method (Allen et al., 1998). S-SEBI The solution of energy balance in S-SEBI is obtained using the evaporative fraction (Λ ) through of parameterizations proposed by Roerink et al. (2000). T − TS Λ= H (8) TH − TLE where Ts is the surface temperature, TH is the temperature of maximum sensible heat pixels, obtained through linear relationship between the surface temperature (dependent variable) and albedo (independent variable), TLET is temperature of the maximum ET pixels that is obtained of similar form of TH, using linear relationship between temperature and albedo on pixels of maximum evapotranspiration. 430 Anais XIV Simpósio Brasileiro de Sensoriamento Remoto, Natal, Brasil, 25-30 abril 2009, INPE, p. 427-434. Substituting the linear regression, obtained by methodology proposed in Roerink et al. (2000), of TH and TLE in equation 8, the evaporative fraction (Λ ) was calculated as: a H + bH α − Ts Λ= (9) a H − a LE + (bH − bLE )α The sensible heat flux (H) and latent heat flux (LE) is obtained using the available energy and evaporative fraction through the Equation 10 and 11. H = (1 − Λ )(Rn − G ) (10) LET = Λ (Rn − G ) (11) Finally, the daily ET estimated by S-SEBI is based in the theory that the instantaneous evaporative fraction (Λ i ) is equal at daily evaporative fraction (Λ d ) and that for the equation 11, obtain: LETi LETd Λi = Λd = = (12) (Rn i − Gi ) (Rn d − Gd ) Considering that the soil heat flux during the day is equal to zero, the daily ET is calculated using the Equation 13: R nd ET = LETi (13) L(Rni − Gi ) where Rni and Gi are instantaneous net radiation and soil heat flux in the satellite overpass time, calculated through equations 5 and 6, respectively. The constant L is the latent heat of vaporization and Rnd is daily net radiation (Allen et al., 1998). 3 – Results and discussion The SEBAL and S-SEBI algorithms although of the present proposed methodological different for the calculation of daily ET, showed similar results to ET values obtained by each method for DOY 288 that present the respective histograms in the Figures 5a and 5c. The maximum values of daily ET (blue areas) reply the area occupied by different irrigated agricultural crop, to example of the cotton field, where data were collected for validation of the algorithms used in this study. The similarity between SEBAL and S-SEBI results had already been verified by Weligepolage (2005) that observed strong correlations between both algorithms, presenting coefficient of determination (R2) of 0.95. The comparison between the estimated values by remote sensing algorithms and the field observations (BREB) showed that the methods presented accuracy that can be considered satisfactory, as values presented in Tables 1 and 2, however is considerably evident that the performance of the SEBAL is better than S-SEBI algorithm, with differences smaller than 0.5 mm day-1, presenting daily errors inferior that 7.2% and Mean Absolute Difference (MAD) of 0.30 mm day-1. The results obtained through the S-SEBI algorithm has presented maximum difference of 1.0 mm day-1 and error maximum of 16.1% for DOY 320. In other dates the differences has been inferior to 0.5 mm day-1 and errors smaller than 10%, and MAD inferior to 0.5mm day-1, as showed in the Table 2. Sobrino et al. (2005) also obtained differences between estimated values by S-SEBI and measured value in the field; lower than 1.0 mm day-1. 431 Anais XIV Simpósio Brasileiro de Sensoriamento Remoto, Natal, Brasil, 25-30 abril 2009, INPE, p. 427-434. Table 1: Observed daily evapotranspiration in the cotton crop field using the Bowen ratio method and the estimated value by SEBAL algorithm using Landsat 5 – TM images. DOY Measured SEBAL Absolute Difference a Percentual Error b (mm day-1) (%) 272 4.5 4.2 0.30 288 5.6 5.2 0.40 304 5.3 5.2 0.10 320 6.2 5.8 0.40 a Absolute difference = observed – estimated b Percentual Error = (Absolute difference / observed)x100 n 1 c MAD = ∑ observed − estimated n i =1 6.7 7.1 1.9 6.5 MAD c (mm day-1) 0.30 Table 2: Observed daily evapotranspiration in the cotton crop field using the Bowen ratio method and the estimated value by S-SEBI algorithm using Landsat 5 – TM images. DOY Measured SEBAL 272 288 304 320 4.5 5.6 5.3 6.2 4.2 5.2 5.5 5.2 Absolute Difference a (mm day-1) 0.30 0.40 0.20 1.00 Percentual Error b (%) 6.7 7.1 3.8 16.1 MAD c (mm day-1) 0.48 Figure 2: Spatial distribution of the daily evapotranspiration (ET) to DOY 288 and the respective histograms to experimental field in Embrapa/Barbalha –CE estimated by a) SEBAL (a) and S-SEBI (b). Table 3 presents the correlations coefficients (r) to statistical significance at 5% level (p<0.05), Mean Bias Error (MBE) and Root Mean Square Error (RMSE), between the daily 432 Anais XIV Simpósio Brasileiro de Sensoriamento Remoto, Natal, Brasil, 25-30 abril 2009, INPE, p. 427-434. evapotranspiration values of 6,000 pixels obtained by SEBAL and S-SEBI algorithms. In general, the correlations between SEBAL and S-SEBI presented values greater than 0.85, showing a stronger agreement among these algorithms. The MBE presented maximum value of 0.04 mm day-1 and minimum value of 0.02 mm day-1, with RMSE of 0.56 mm day1 and 0.38 mm day-1 to maximum and minimum values, respectively. Table 3: Correlations coefficients between ET values of the 6,000 pixels, obtained through remote sensing algorithms and Landsat images. DOY a (SEBAL/S-SEBI) a 272 0.93 288 0.92 304 0.86 320 0.90 Statistically significant to 5% level (p<0.05) MBE (mm day-1) RMSE (mm day-1) 0.04 -0.02 0.04 -0.02 0.38 0.45 0.56 0.47 4 – Conclusions This study presents analyzes of the results of daily ET obtained through SEBAL and S-SEBI algorithms and comparisons between the algorithms results and values measured in the cotton field using the BREB method. The comparison between the estimated values by remote sensing algorithms and the measured values in the field showed that the methods presented accuracy considered satisfactory. However was evident the best performance of the SEBAL algorithm, with differences smaller than 0.5 mm day-1, presenting daily errors inferior that 7.2% and MAD of 0.30 mm day-1. The results obtained through the S-SEBI algorithm has presented maximum difference of 1.0 mm day-1 and error maximum of 16.1% for DOY 320. However, in other dates the differences has been inferior to 0.5 mm day-1 and errors smaller than 10%, and MAD inferior to 0.5 mm day-1. In general, the correlations between SEBAL and S-SEBI presented values greater than 0.85, showing a stronger agreement between these algorithms. The MBE presented maximum value of 0.04 mm day-1 and minimum value of 0.02 mm day-1, with RMSE of 0.56 mm day-1 and 0.38 mm day-1 to maximum and minimum values, respectively. These results evidence that the S-SEBI algorithm is an important tool to be applied in analysis of semi-arid regions that weather stations is not available, because, in S-SEBI, is not necessary uses meteorological data to solve the energy balance, and the processing is easier than SEBAL algorithm. Acknowledgements The authors are grateful for the PhD scholarship provided by National Council for Scientific and Technological Development (CNPq) to the first author and the Embrapa (Brazilian Company of Agricultural Research) to provided the cotton field data. References Allen, R. G.; Pereira, L. S.; Raes, D.; Smith, M. Crop evapotranspiration - Guidelines for computing crop water requirements – FAO Irrigation and drainage paper 56. Rome-Italy, 1998. 433 Anais XIV Simpósio Brasileiro de Sensoriamento Remoto, Natal, Brasil, 25-30 abril 2009, INPE, p. 427-434. Bastiaanssen, W. G. M.; Menenti, M.; Feddes, R. A.; Holtslag, A. A. M. A remote sensing surface energy balance algorithm for land (SEBAL) 1. Formulation. Journal of Hydrology, v. 212–213, p.198–212. 1998. Brutsaert, W.; Sugita, M. Application of self-preservation in the diurnal evolution of the surface energy budget to determine daily evaporation. Journal of Geophysical Research v.97, n.18, p.377-382, 1992. Gao, Y.; Long, D.; Li, Z. Estimation of daily evapotranspiration from remotely sensed data under complex terrain over the upper Chao river basin in North China. International Journal of Remote Sensing, v. 29, n. 11, p. 3295-3315, 2008. Roerink, G. J.; Su, Z.; Menenti, M. S-SEBI: A Simple Remote Sensing Algorithm to Estimate the Surface Energy Balance. Phys. Chem. Earth (B), v.25, n.2, p.147-157, 2000. Sobrino, J. A.; Gómez, M.; Jiménez-Moñoz, J. C.; Olioso, A.; Chehbouni, G. A simple algorithm to estimate evapotranspiration from DAIS data: Application to the DAISEX campaigns. Journal of Hydrology, v.315, p.117-125, 2005. Sobrino, J. A.; Gómez, M.; Jiménez-Muñoz, J. C.; Olioso, A. Application of a simple algorithm to estimate daily evapotranspiration from NOAA-AVHRR images for the Iberian Peninsula. Remote Sensing of Environment, v.110, n.2, p.139-148, 2007. Torhnthwaite, C. W.; Mather, J. R. The Water Balance: publication in climatology. New Jersey: Drextel Institute of Technology, 1955, 104p. Trezza, R. Evapotranspiration using a satellite-based Surface energy balance with standardized ground control. 247f. Thesis (Doctor of Philosophy in Biological and Agricultural Engineering). Utah State University. Logan, Utah, 2002. Verma, S. B.; Rosenberg, N. J.; Blad, B. L. Turbulent exchange coefficients for sensible heat and water vapor under advective conditions. Journal Applied of Meteorology, v. 103, n. 3, p. 330-338, 1978. Wilegepolage, K. Estimation of spatial and temporal distribution of evapotranspiration by satellite remote sensing. 114f. Dissertation (Master of Science in Geo-information Science and Earth Observation in Water Resources and Environmental Management), ITC, International Institute for Geo-Information Science and Earth Observation, Enschede, 2005. 434
Download