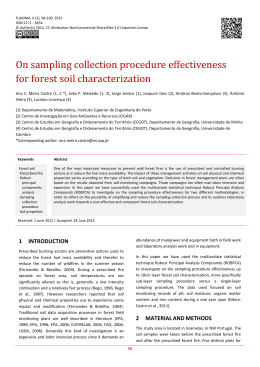
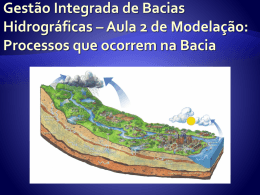
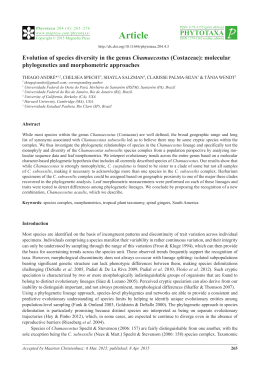
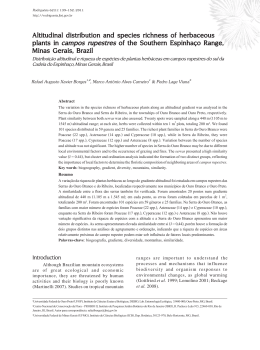
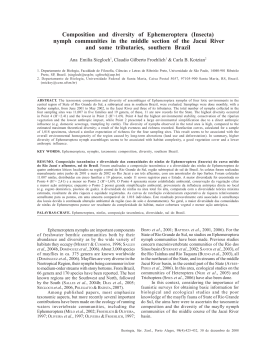
RESEARCH
RESEARCH ARTICLE SUMMARY
FUNGAL BIOGEOGRAPHY
Global diversity and geography
of soil fungi
Leho Tedersoo,*† Mohammad Bahram,† Sergei Põlme, Urmas Kõljalg, Nourou S. Yorou,
Ravi Wijesundera, Luis Villarreal Ruiz, Aída M. Vasco-Palacios, Pham Quang Thu,
Ave Suija, Matthew E. Smith, Cathy Sharp, Erki Saluveer, Alessandro Saitta,
Miguel Rosas, Taavi Riit, David Ratkowsky, Karin Pritsch, Kadri Põldmaa,
Meike Piepenbring, Cherdchai Phosri, Marko Peterson, Kaarin Parts, Kadri Pärtel,
Eveli Otsing, Eduardo Nouhra, André L. Njouonkou, R. Henrik Nilsson, Luis N. Morgado,
Jordan Mayor, Tom W. May, Luiza Majuakim, D. Jean Lodge, Su See Lee,
Karl-Henrik Larsson, Petr Kohout, Kentaro Hosaka, Indrek Hiiesalu, Terry W. Henkel,
Helery Harend, Liang-dong Guo, Alina Greslebin, Gwen Grelet, Jozsef Geml,
Genevieve Gates, William Dunstan, Chris Dunk, Rein Drenkhan, John Dearnaley,
André De Kesel, Tan Dang, Xin Chen, Franz Buegger, Francis Q. Brearley,
Gregory Bonito, Sten Anslan, Sandra Abell, Kessy Abarenkov
The kingdom Fungi
is one of the most diverse groups of
organisms on Earth, and they are integral
ecosystem agents that govern soil carbon
cycling, plant nutrition, and pathology.
Fungi are widely distributed in all terrestrial ecosystems, but the distribution of
species, phyla, and functional groups has
been poorly documented. On the basis
of 365 global soil samples from natural ecosystems, we determined
the main drivers and biogeographic patterns of fungal
diversity and community composition.
INTRODUCTION:
RATIONALE: We identified soil-inhabiting
fungi using 454 Life Sciences (Branford,
CN) pyrosequencing and through comparison against taxonomically and functionally
annotated sequence databases. Multiple regression models were used to disentangle
the roles of climatic, spatial, edaphic, and
floristic parameters on fungal diversity and
community composition. Structural equation models were used to determine the
direct and indirect effects of climate
on fungal diversity, soil chemistry,
and vegetation. We also examined whether fungal biogeographic patterns matched
paradigms derived
from plants and
animals—namely, that species’ latitudinal
ranges increase toward the poles (Rapoport’s rule) and diversity increases toward
the equator. Last, we sought group-specific
global biogeographic links among major biogeographic regions and biomes using a network approach and area-based clustering.
Metabarcoding analysis of
global soils revealed fungal richness estimates approaching the number of species
recorded to date. Distance from equator
and mean annual precipitation had the
strongest effects on richON OUR WEB SITE
ness of fungi, including
most fungal taxonomic
Read the full article
and functional groups.
at http://dx.doi
.org/10.1126/
Diversity of most funscience.1256688
gal groups peaked in
tropical ecosystems, but
ectomycorrhizal fungi and several fungal
classes were most diverse in temperate or
boreal ecosystems, and many fungal groups
exhibited distinct preferences for specific
edaphic conditions (such as pH, calcium,
or phosphorus). Consistent with Rapoport’s
rule, the geographic range of fungal taxa increased toward the poles. Fungal endemicity
was particularly strong in tropical regions,
but multiple fungal taxa had cosmopolitan
distribution.
RESULTS:
CONCLUSIONS: Climatic factors, followed
by edaphic and spatial patterning, are the
best predictors of soil fungal richness and
community composition at the global scale.
Richness of all fungi and functional groups
is causally unrelated to plant diversity, with
the exception of ectomycorrhizal root symbionts, suggesting that plant-soil feedbacks do
not influence the diversity of soil fungi at the
global scale. The plant-to-fungi richness ratio declined exponentially toward the poles,
indicating that current predictions—assuming globally constant ratios—overestimate
fungal richness by 1.5- to 2.5-fold. Fungi follow similar biogeographic patterns as plants
and animals, with the exception of several
major taxonomic and functional groups that
run counter to overall patterns. Strong
biogeographic links among distant
continents reflect relatively efficient
long-distance dispersal compared with
macro-organisms. ■
RELATED ITEMS IN SCIENCE
D. A. Wardle and B. D. Lindahl, Disentangling the
global mycobiome. Science 346, 1052–1053 (2014).
DOI: 10.1126/science.aaa1185
Direct and indirect effects of climatic and edaphic variables on plant and fungal richness.
Line thickness corresponds to the relative strength of the relationships between the variables
that affect species richness. Dashed lines indicate negative relationships. MAP, mean annual
precipitation; Fire, time since last fire; Dist. equator, distance from the equator; Ca, soil calcium
concentration; P, soil phosphorus concentration; pH, soil pH.
1078
The list of author affiliations is available in the full article online.
*Corresponding author. E-mail: [email protected]
†These authors contributed equally to this work.
Cite this article as: L. Tedersoo et al., Science 346, 1256688
(2014). DOI: 10.1126/science.1256688
sciencemag.org SCIENCE
28 NOVEMBER 2014 • VOL 346 ISSUE 6213
Published by AAAS
R ES E A RC H
RESEARCH ARTICLE
◥
FUNGAL BIOGEOGRAPHY
Global diversity and geography
of soil fungi
Leho Tedersoo,1*† Mohammad Bahram,2† Sergei Põlme,1 Urmas Kõljalg,2
Nourou S. Yorou,3 Ravi Wijesundera,4 Luis Villarreal Ruiz,5 Aída M. Vasco-Palacios,6
Pham Quang Thu,7 Ave Suija,2 Matthew E. Smith,8 Cathy Sharp,9 Erki Saluveer,2
Alessandro Saitta,10 Miguel Rosas,11 Taavi Riit,2 David Ratkowsky,12 Karin Pritsch,13
Kadri Põldmaa,2 Meike Piepenbring,11 Cherdchai Phosri,14 Marko Peterson,2
Kaarin Parts,2 Kadri Pärtel,2 Eveli Otsing,2 Eduardo Nouhra,15 André L. Njouonkou,16
R. Henrik Nilsson,17 Luis N. Morgado,18 Jordan Mayor,19 Tom W. May,20
Luiza Majuakim,21 D. Jean Lodge,22 Su See Lee,23 Karl-Henrik Larsson,24 Petr Kohout,2
Kentaro Hosaka,25 Indrek Hiiesalu,2 Terry W. Henkel,26 Helery Harend,2
Liang-dong Guo,27 Alina Greslebin,28 Gwen Grelet,29 Jozsef Geml,18 Genevieve Gates,12
William Dunstan,30 Chris Dunk,19 Rein Drenkhan,31 John Dearnaley,32 André De Kesel,33
Tan Dang,7 Xin Chen,34 Franz Buegger,13 Francis Q. Brearley,35 Gregory Bonito,20
Sten Anslan,2 Sandra Abell,36 Kessy Abarenkov 1
Fungi play major roles in ecosystem processes, but the determinants of fungal diversity and
biogeographic patterns remain poorly understood. Using DNA metabarcoding data from
hundreds of globally distributed soil samples, we demonstrate that fungal richness is decoupled
from plant diversity.The plant-to-fungus richness ratio declines exponentially toward the poles.
Climatic factors, followed by edaphic and spatial variables, constitute the best predictors of
fungal richness and community composition at the global scale. Fungi show similar latitudinal
diversity gradients to other organisms, with several notable exceptions. These findings advance
our understanding of global fungal diversity patterns and permit integration of fungi into a
general macroecological framework.
ungi are eukaryotic microorganisms that
play fundamental ecological roles as decomposers, mutualists, or pathogens of plants
and animals; they drive carbon cycling in
forest soils, mediate mineral nutrition of
plants, and alleviate carbon limitations of other
soil organisms. Fungi comprise some 100,000 described species (accounting for synonyms), but
the actual extent of global fungal diversity is estimated at 0.8 million to 5.1 million species (1).
Globally, the biomass and relative proportions
of microbial groups, including fungi, co-vary with
the concentration of growth-limiting nutrients in
soils and plant tissues. Such patterns suggest that
the distribution of microbes reflects latitudinal
variation in ecosystem nutrient dynamics (2–4).
Richness of nearly all terrestrial and marine macroorganisms is negatively related to increasing
latitude (5)—a pattern attributed to the combined
effects of climate, niche conservatism, and rates
of evolutionary radiation and extinction (6). Although morphological species of unicellular microbes are usually cosmopolitan (7), there is growing
evidence that the distribution of microorganisms
is shaped by macroecological and community assembly processes (8). Only a few of these biogeographic processes have been demonstrated
for fungi at the local scale (9). Despite their enormous diversity and importance in ecosystem function, little is known about general patterns of
fungal diversity or functional roles over large
F
SCIENCE sciencemag.org
geographic scales. We used a global data set to
disentangle the roles of climatic, edaphic, floristic, and spatial variables governing global-scale
patterns of soil fungal diversity. We also address
macroecological phenomena and show that fungi
largely exhibit strong biogeographic patterns that
appear to be driven by dispersal limitation and
climate.
Materials and methods
We collected 40 soil cores from natural communities in each of 365 sites across the world using
a uniform sampling protocol (Fig. 1A and data
file S1). Most plots (2500 m2) were circular, but
in steep mountain regions and densely forested
areas, some plots were oblong. We randomly selected 20 trees located at least 8 m apart. In two
opposite directions, 1 to 1.5 m from each tree
trunk, loose debris was removed from the forest
floor. Polyvinyl chloride (PVC) tubes (5 cm in diameter) were hammered into the soil down to
5 cm depth. These soil cores almost always included fine roots and comprised both the organic
layer and top mineral soil. Although deep soil
may contain some distinctive organisms adapted
to anoxic conditions or low nutrient levels, our
sampling was limited to topsoil for the following
reasons. First, in the vast majority of soil types,
>50% of microbial biomass and biological activity occur in the topmost organic soil layer. Second,
deeper sampling was impossible in shallow, rocky
soils or those with high clay concentrations and
hardpans. Third, differences among soil horizons
may be masked by other variables across large
geographic scales (10). The 40 soil cores taken in
each site were pooled, coarse roots and stones
were removed, and a subset of the soil was airdried at <35°C. Dried soil was stored in zip-lock
plastic bags with silica gel in order to minimize
humidity during transit. In the laboratory, we
ground dried soil into fine powder using bead
beating.
We extracted DNA from 2.0 g of soil using
the PowerMax Soil DNA Isolation kit (MoBio,
Carlsbad, CA) following manufacturer’s instructions. We performed polymerase chain reaction
(PCR) using a mixture of six forward primers (in
equimolar concentration) analogous to ITS3 and
a degenerate reverse primer analogous to ITS4
(hereafter referred to as ITS4ngs). We shortened
and modified forward and reverse primers to
1
Natural History Museum, University of Tartu, Tartu, Estonia.
Institute of Ecology and Earth Sciences, University of
Tartu, Tartu, Estonia. 3Faculté d´Agronomie, Université de
Parakou, Parakou, Benin. 4Department of Plant Sciences,
University of Colombo, Colombo 3, Sri Lanka. 5Postgrado en
Recursos Genéticos y Productividad-Genética, LARGEMBIO,
Colegio de Postgraduados–Líneas Prioritarias de
Investigación 6, México City, Mexico. 6The Fungal Biodiversity
Centre, Centraalbureau voor Schimmelcultures–Royal
Netherlands Academy of Arts and Sciences, Utrecht,
Netherlands. 7Vietnamese Academy of Forest Sciences,
Hanoi, Vietnam. 8Department of Plant Pathology, University
of Florida, Gainesville, FL, USA. 9Natural History Museum,
Bulawayo, Zimbabwe. 10Department of Agricultural and
Forest Sciences, Università di Palermo, Palermo, Italy.
11
Department of Mycology, Goethe University Frankfurt,
Frankfurt am Main, Germany. 12Tasmanian Institute of
Agriculture, Hobart, Tasmania, Australia. 13Institute of Soil
Ecology, Helmholtz Zentrum München, Neuherberg, Germany.
14
Department of Biology, Nakhon Phanom University,
Nakhon Phanom, Thailand. 15Instituto Multidisciplinario de
Biología Vegetal, Córdoba, Argentina. 16Department of
Biological Sciences, University of Bamenda, Bambili,
Cameroon. 17Department of Biological and Environmental
Sciences, University of Gothenburg, Göteborg, Sweden.
18
Naturalis Biodiversity Center, Leiden, Netherlands.
19
Department of Forest Ecology and Management, Swedish
University of Agricultural Sciences, Umeå, Sweden.
20
Royal Botanic Gardens Melbourne, Melbourne, Victoria,
Australia. 21Institute for Tropical Biology and Conservation,
University Malaysia Sabah, Sabah, Malaysia. 22Center
for Forest Mycology Research, U.S. Department of
Agriculture–Forest Service, Luquillo, Puerto Rico. 23Forest
Research Institute Malaysia, Kepong, Selangor, Malaysia.
24
Natural History Museum, University of Oslo, Oslo, Norway.
25
Department of Botany, National Museum of Nature and
Science, Tsukuba, Japan. 26Department of Biological
Sciences, Humboldt State University, Arcata, CA, USA.
27
State Key Laboratory of Mycology, Institute of Microbiology,
Chinese Academy of Sciences, Beijing, China. 28Consejo
Nacional de Investigaciones Científicas y Técnicas–Facultad
de Cs. Naturales, Universidad Nacional de la Patagonia
SJB, Esquel, Chubut, Argentina. 29Ecosystems and Global
Change team, Landcare Research, Lincoln, New Zealand.
30
School of Veterinary & Life Sciences, Murdoch University,
Western Australia, Australia. 31Institute of Forestry and
Rural Engineering, Estonian University of Life Sciences, Tartu,
Estonia. 32Faculty of Health, Engineering and Sciences,
University of Southern Queensland, Toowoomba, Queensland,
Australia. 33Botanic Garden Meise, Meise, Belgium.
34
College of Life Sciences, Zhejiag University, Hangzhou
310058, China. 35School of Science and the Environment,
Manchester Metropolitan University, Manchester, UK.
36
School of Marine and Tropical Biology, James Cook
University, Cairns, Queensland, Australia.
2
*Corresponding author. E-mail: [email protected] †These
authors contributed equally to this work.
28 NOVEMBER 2014 • VOL 346 ISSUE 6213
1256688-1
R ES E A RC H | R E S EA R C H A R T I C LE
nology and Titanium chemistry as implemented
by Beckman Coulter Genomics (Danvers, MA).
Bioinformatics
Fig. 1. Maps of global sampling and interpolated taxonomic richness of all fungi. (A) Map of global
sampling. Circles indicate study sites. (B) Interpolated taxonomic richness of all fungi using IDW
algorithm and accounting for the relationship with mean annual precipitation (based on the best multiple
regression model). Different colors depict residual OTU richness of all fungi accounting for sequencing
depth. Warm colors indicate OTU-rich sites, whereas cold colors indicate sites with fewer OTUs.
completely match >99.5% of all fungi [except
~60% of Tulasnellaceae that exhibit highly divergent 5.8S ribosomal DNA (rDNA) and Microsporidia that exhibit rearrangements in rDNA]
(table S1). The ITS4ngs primer was tagged with
one of 110 identifiers (multiplex identifiers, 10 to
12 bases) that were modified from those recommended by Roche (Basel, Switzerland) to differ
by >3 bases, start only with adenosine, and consist of between 30 and 70% adenosine and thymidine in order to optimize the adaptor ligation
step. The PCR cocktail consisted of 0.6 ml DNA
extract, 0.5 ml each of the primers (20 pmol),
5 ml 5xHOT FIREPol Blend Master Mix (Solis
Biodyne, Tartu, Estonia), and 13.4 ml doubledistilled water. We carried out PCR in four replicates
using the following thermocycling conditions: an
initial 15 min at 95°C, followed by 30 cycles at 95°C
for 30 s, 55°C for 30 s, 72°C for 1 min, and a final
cycle of 10 min at 72°C. PCR products were
pooled, and their relative quantity was estimated
1256688-2
by running 5 ml amplicon DNA on 1% agarose
gel for 15 min. DNA samples yielding no visible
band were reamplified by using 35 cycles in an
effort to obtain sufficient PCR product, whereas samples with a very strong band were reamplified with only 25 cycles. It is important to
use as few cycles as possible to minimize chimera
formation and to be able to interpret sequence
abundance in a semiquantitative manner (11).
We used negative (for DNA extraction and PCR)
and positive controls throughout the experiment.
Amplicons were purified with Exonuclease I and
FastAP thermosensitive alkaline phosphatase
enzymes (Thermo Scientific, Pittsburgh, PA). Purified amplicons were subjected to quantity normalization with a SequalPrep Normalization
Plate Kit (Invitrogen, Carlsbad, CA) following
manufacturer’s instructions. We divided normalized amplicons into five pools that were subjected to 454 adaptor ligation, emulsion PCR, and
454 pyrosequencing by using the GS-FLX+ tech-
28 NOVEMBER 2014 • VOL 346 ISSUE 6213
Pyrosequencing on five half-plates resulted in
2,512,068 reads with a median length of 409 bases.
The sequences were reassigned to samples in
mothur 1.32.2 (www.mothur.org) based on the barcodes and then trimmed (parameters: minlength =
300; maxambigs = 1; maxhomop = 12; qwindowaverage = 35; qwindowsize = 50; and bdiffs = 1)
to exclude short and low-quality sequences, resulting in 2,231,188 high-quality sequences. We
used ITSx 1.0.7 (http://microbiology.se/software/
itsx) to remove the flanking 5.8S and 28S rRNA
genes for optimal resolution of ITS2 clustering
and removal of compromised and nontarget sequences. As a filter to remove most of the partial
sequences, we retained only sequences >99 base
pairs (bp) in length. Chimera control was exercised through UCHIME 4.2 (www.drive5.com/
uchime). After these filtering steps, 1,397,679
sequences were retained and further clustered
at 90.0% and 95.0 to 99.0% sequence similarity
thresholds (12) as implemented in CD-Hit 4.6.1
(www.cd-hit.org). Clustering revealed 37,387,
59,556, 66,785, 77,448, 94,255, and 157,956 taxa
based on 90.0, 95.0, 96.0, 97.0, 98.0, and 99.0%
sequence similarity thresholds, respectively. The
longest sequence of each Operational Taxonomic
Unit (OTU), based on clustering at 98.0% sequence similarity, was selected as the representative for BLASTn searches (word size = 7;
penalties: gap = –1; gap extension = –2; and
match = 1) against the International Nucleotide
Sequence Databases Collaboration (INSDC; www.
insdc.org) and UNITE (unite.ut.ee) databases. In
addition, we ran BLASTn searches against established reference sequences of all fungi in 99.0%
similarity clusters that include third-party taxonomic and metadata updates (12) as implemented
in the PlutoF workbench (13). For each query, we
considered the 10 best-matching references to
annotate our global sequences as accurately as
possible. If no reliable taxon name was available,
we ran manual BLASTn searches against INSDC
with 500 best-matching sequences as output. We
typically relied on 90, 85, 80, and 75% sequence
identity as a criterion for assigning OTUs with
names of a genus, family, order, or class, respectively. Sequence identity levels were raised in
subsets of Sordariomycetes, Leotiomycetes, and
Eurotiomycetes, because these taxa contain multiple genera and families that have unusually conserved internal transcribed spacer (ITS) sequences.
As a rule, we considered e-values of BLASTn search
results e−50 reliable to assign sequences to the
fungal kingdom, whereas those >e−20 were considered “unknown.” E-values between e−20 and e−50
were manually checked against the 10 best matches
for accurate assignment. We followed INSDC for
higher-level taxonomy of eukaryotes (14) and the
Index Fungorum (www.indexfungorum.org) for
species through class-level taxonomy of fungi. Our
group of taxonomic experts assigned each fungal
genus, family, or order to functional categories
(data file S2). If different functional categories
sciencemag.org SCIENCE
RE S E ARCH | R E S E A R C H A R T I C L E
were present within a specific genus, we chose
the dominant group (>75% of species assigned
to a specific category) or considered its ecology
unknown (<75% of species assignable to a single category). All Glomeromycota were considered
to be arbuscular mycorrhizal (AM). Taxa were
considered to be ectomycorrhizal (EcM) if they
best matched any sequences of known EcM lineages (15) and exhibited sequence length/BLASTn
scores above lineage-specific thresholds. For several taxonomic groups, we constructed phylogenetic trees to assess the performance of clustering,
sequence quality of singletons, accuracy of OTU
separation, and taxonomic assignments (fig. S1).
In the course of this project, we provided 10,232
third-party taxonomic reannotations to INSDC
sequences to improve subsequent identification
of fungal sequences and made these available
through the UNITE database.
Statistical analyses
Estimates of the mean annual temperature
(MAT), mean annual precipitation (MAP), soil
moisture, and soil carbon at 30 arc second resolution were obtained from the WorldClim database (www.worldclim.org). Estimates of potential
evapotranspiration (PET) and net primary productivity (NPP) at 30 arc minute resolution were
obtained from the Atlas of the Biosphere (www.
sage.wisc.edu/atlas/maps.php). Variation coefficients for MAT and MAP were computed based
on the average monthly values to represent seasonality of temperature and precipitation. We
also calculated the difference of MAP to PET in
order to evaluate the effect of rainfall surplus or
deficit. On the basis of vegetation type and geographical distribution, sites were categorized into
biogeographic regions and biomes following the
classification of the World Wildlife Foundation
(http://worldwildlife.org) with a few exceptions:
(i) temperate deciduous forests in the Northern
and Southern hemispheres were treated separately; (ii) tropical montane forests (>1500 m
elevation) were separated from the tropical lowland moist forests; and (iii) grasslands and shrublands of all geographic origins were pooled. At
each site, we also determined the age of vegetation, time since the last fire, and EcM plant species
along with their relative contribution to stand
basal area. EcM plants are usually conspicuous
trees or prominent shrubs that are relatively easy
to identify, and their mycorrhizal status is verifiable in the field by using root excavation and
microscopy. Complete lists of tree species were
available for <10% of the sites, so we did not
directly include plant community composition
parameters in our analyses.
Concentrations of N, C, 13C/12C, and 15N/14N
were determined from 1 to 20 mg of soil by
using GC-combustion coupled to isotope-ratio
mass spectrometry (16). Concentrations of soil
calcium, potassium, magnesium, and phosphorus were determined as in (16). Soil pH was measured in 1 N KCl solution.
For analyses of fungal richness, we calculated
residuals of OTU richness in relation to the square
root of the number of obtained sequences to
SCIENCE sciencemag.org
account for differences in sequencing depth.
This method outperformed the commonly used
rarefaction to the lowest number of sequences
method, which removes most of the data (17). We
also calculated the richness of major class-level
taxonomic and functional groups (comprising
>100 OTUs). We excluded outlying samples dominated by a few OTUs of molds, which are indicative
of poor sample preservation (relative abundance
of sequences belonging to Trichocomaceae >5%,
Mortierellaceae >20%, or Mucoraceae >20% that
exceeded three times the mean + SD). Although
these samples were fairly homogeneously distributed across the world, they had conspicuously
lower fungal richness. We also excluded samples
that yielded less than 1200 sequences per sample.
To determine the relationship between plant
and fungal richness, we relied on co-kriging values
from the global vascular plant species richness
data set (18), which covered 96.7% of our sites.
These scale-free values of plant richness were
then regressed with residuals from the best-fit
models for fungal richness and fungal functional
groups. We further calculated the ratio of relative
plant richness to fungal richness and fitted this
ratio with latitude using polynomial functions to
test the assumed uniformity of plant-to-fungal
richness ratios at the global scale (1, 19, 20). To
account for potential latitudinal biases in plantto-fungal diversity estimates, we took into account
the nonuniform distribution of land surfaces by
calculating an inverse distance weighting (IDW)
spatial interpolation of standardized ratios of plantto-residual fungal diversity using the “gstat” package in R (21). We then used IDW to interpolate
total fungal diversity beyond sampling sites by
accounting for MAP as based on the best-fitting
multiple regression model.
Distance from the equator, altitude, age of
vegetation, time since last fire, climatic variables, and concentrations of nutrients were logtransformed before analyses in order to improve
the distribution of residuals and reduce nonlinearity. To account for potential autocorrelation
effects, we calculated spatial eigenvectors using
SAM version 4 (22). To determine the best predictors of global fungal diversity, we included
edaphic, climatic, floristic, and spatial variables
in multiple regression models. Because of the
large number of predictors, we preselected 16 candidate predictors that were revealed through exploratory multiple linear and polynomial regression
analyses based on coefficients of determination and forward selection criteria. The most parsimonious models were determined according to
the corrected Akaike information criterion (AICc),
which penalizes over-fitting. Last, components of
the best models were forward-selected to determine their relative importance as implemented in
the “packfor” package in R.
To test the direct effects of climatic variables
on richness of fungi and their functional groups,
and indirect climatic effects (via soil nutrients
and vegetation), we used Structural Equation
Modeling (SEM) in Amos version 22 (SPSS Software, Chicago, IL). Model fits were explored based
on both c2 test and root-mean-square error of
approximation (RMSEA). First, we included all
potentially important variables (inferred from
both the multiple regression models and correlations for individual response variables) to construct separate SEM models. We tested all direct
and indirect relations between exogenous and
endogenous variables, including their error terms.
Then, we used backward elimination to remove
nonsignificant links to maximize whole-model
fit. Last, we combined the obtained SEM models
in a unified path model, following the same elimination procedure.
In addition to full models, we specifically tested
the relationships between OTU richness and distance from the equator and soil pH because these
or closely related variables were usually among
the most important predictors. For these analyses, we calculated residuals of richness that accounted for other significant variables of the
best models. To address nonlinear relationships,
we fitted up to fifth-order polynomial functions
and selected best-fit models on the basis of AICc
values.
The relative effects of climatic, edaphic, spatial,
and floristic variables on the total fungal community composition and on particular functional
groups were determined by using Hellinger dissimilarity (calculated if >90% sites were represented by >1 shared OTUs), exclusion of all OTUs
that occurred once, and a multistage model selection procedure as implemented in the DISTLM
function of Permanova+ (www.primer-e.com/
permanova.htm). Considering computational
requirements, 15 candidate variables were
preselected based on unifactorial (marginal test
based on largest Fpseudo values) and multifactorial (forward selection) models. Spatial eigenvectors were not included in these analyses
because they typically were of minor importance
in variation partitioning analyses and to avoid
making the models computationally prohibitive.
Optimal models were selected based on the AICc.
To obtain coefficients of determination (cumulative R2adjusted) and statistics (Fpseudo and P values)
for each variable, components of the best models were forward selected. In parallel, we prepared Global Nonmetric Multidimensional Scaling
(GNMDS) graphs using the same options. Significant variables were fitted into the GNMDS
ordination space by using the “envfit” function
in the “vegan” package of R. We also grouped all
climatic, edaphic, spatial, and floristic variables into a variation partitioning analysis by
integrating procedures in the “vegan” and “packfor” packages of R. Besides group effects, variation partitioning estimates the proportion of shared
variation among these groups of predictors.
For global biogeographic analyses, we excluded
OTUs from the order Hypocreales and family
Trichocomaceae (both Ascomycota) because the
ITS region provides insufficient taxonomic resolution, and known biological species are grouped
together within the same OTU (23). We tested
the differences among fungal taxonomic and functional groups for the occurrence frequency (number of sites detected) and latitudinal range of
OTUs using a nonparametric Kruskal-Wallis
28 NOVEMBER 2014 • VOL 346 ISSUE 6213
1256688-3
R ES E A RC H | R E S EA R C H A R T I C LE
test and Bonferroni-adjusted multiple comparisons among mean ranks. To test the validity of
Rapoport’s rule in soil fungi, we calculated the
average latitudinal range of OTUs for each site
(24). The average latitudinal range was regressed with the latitude of study sites by means of
polynomial model selection based on the AICc
criterion. This analysis was run with and without OTUs only detected at a single site (range = 0).
Because the results were qualitatively similar, we
report results including all OTUs. To construct
biogeographic relationships among major regions
and biomes, we generated cross-region and crossbiome networks based on the number of shared
OTUs. We excluded occurrences represented by a
single sequence per site. Ward clustering of biogeographic regions and biomes were constructed
by using the Morisita-Horn index of similarity,
which is insensitive to differences in samples size,
by use of the “pvclust” package of R. In this procedure, P values are inferred for nonterminal
branches based on multiscale bootstrap resampling with 1000 replicates.
Taxonomic and functional diversity
Pyrosequencing analysis of global soil samples
revealed 1,019,514 quality-filtered sequences that
were separated into 94,255 species-level OTUs
(supplementary materials). Altogether, 963,458
(94.5%) sequences and 80,486 (85.4%) OTUs were
classified as Fungi. Most other taxa belonged to
animals (Metazoa, 3.3%), plants (Viridiplantae,
3.1%), alveolates (Alveolata, 2.8%), and amoebae
(mostly Rhizaria, 1.3%). Kingdom-level assign-
ment of 3.8% OTUs remained elusive. The fungal
subset included 35,923 (44.6%) OTUs that were
represented by a single sequence; these were removed from further analyses in order to avoid
overestimating richness based on these potentially erroneous sequences (25). The remaining
44,563 nonsingleton fungal OTUs in our data
set numerically correspond to approximately
half of the described fungal species on Earth
(1). For comparison, there are currently 52,481
OTUs based on 98.0% similarity clustering of
all fungal ITS sequences in publicly available
databases (12). Global soil sampling revealed
representatives of all major phyla and classes
of Fungi. Of fungal taxa, Basidiomycota (55.7%),
Ascomycota (31.3%), Mortierellomycotina (6.3%),
and Mucoromycotina (4.4%) encompassed the
Fig. 2. Relative proportion of fungal sequences assigned to major taxonomic groups in different biomes.
1256688-4
28 NOVEMBER 2014 • VOL 346 ISSUE 6213
sciencemag.org SCIENCE
RE S E ARCH | R E S E A R C H A R T I C L E
largest proportion of sequences (Fig. 2), whereas
the most OTU-rich phyla were the Ascomycota
(48.7%), Basidiomycota (41.8%), Chytridiomycota
(2.3%), and Cryptomycota (syn. Rozellida; 2.1%)
(fig. S2 and data file S1). Except for the recently
described phylum Cryptomycota (26), the relative proportions of major phyla correspond to
the proportional distribution of taxa described
and sequenced to date (www.indexfungorum.
org) (12). Below the phylum level, ~6% of all
fungal OTUs could not be assigned to any known
class of fungi. Further clustering of unidentified
fungal sequences at 70% sequence similarity revealed 14 distinct taxonomic groups comprising
>7 OTUs, suggesting that there are several deeply
divergent class-level fungal lineages that have
not yet been described or previously sequenced.
Our classification revealed that 10,801 (24.2%)
fungal OTUs exhibited >98% sequence similarity, and 33.8% exhibited >97% similarity, to preexisting ITS sequences in public databases. This
is consistent with (19), reporting 48% of OTUs
amplified from Alaskan soils with >97% similarity to any database sequences. In our study,
only 4353 fungal OTUs (9.8%) were matched to
sequences from herbarium specimens or fully
described culture collections at >98.0% sequence
similarity. Although many type collections are
yet to be sequenced, the paucity of matches to
database entries indicates that a majority of
soil-inhabiting fungal taxa remain undescribed
(19, 20). These results highlight the current lack
of data from understudied tropical and subtropical ecosystems. The phenomenon of high
cryptic diversity and low success in naming
OTUs at the genus or species level have been
found in other groups of soil microbes and invertebrates, emphasizing our poor overall knowledge of global soil biodiversity (27, 28).
The main fungal phylogenetic and functional
groups were present in all ecosystems, but their
relative proportions varied severalfold across
biomes (Fig. 2 and figs. S2 to S4). The ratio of
Ascomycota to Basidiomycota OTUs was highest
in grasslands and shrublands (1.86) and tropical
dry forests (1.64) but lowest in the temperate
deciduous forests (0.88). Chytridiomycota, Cryptomycota, and Glomeromycota were relatively
more diverse in the grasslands and shrublands,
accounting for 4.6, 3.6, and 1.4% of OTU richness, respectively. The relative OTU richness of
Mortierellomycotina and Mucoromycotina (including most fast-growing molds but also some
plant symbionts) peaked in the tundra biome
(4.8 and 2.7%, respectively), but their abundance
was lowest in tropical dry forests (1.0 and 0.6%,
respectively). Archaeorhizomycetes, a recently
described class of Ascomycetes from a boreal
forest (29), was most diverse in tropical moist
and montane forests, particularly in northern
South America and New Guinea.
Among all fungal taxa, OTUs assigned to
saprotrophs, EcM mutualists, and plant pathogens comprised 19,540 (43.8%), 10,334 (23.2%),
and 1770 (4.0%), respectively (fig. S4). Other
trophic categories contained <1% of remaining
OTUs. EcM fungi contributed 34.1% of all taxa
SCIENCE sciencemag.org
in the northern temperate deciduous forests
but accounted for a relatively low proportion
(11.9%) in grasslands and shrublands, reflecting
the paucity of host plants in these ecosystems.
Similarly, the proportion of EcM fungal taxa was
lowest in northern South America (8.0%), where
AM trees often dominate. Plant pathogens were
relatively more abundant and diverse in lowland
tropical moist (6.2%) and dry (6.3%) forests.
Predictors of global richness
Structural equation models revealed that climate
has both a strong direct effect on plant and
fungal richness and functional groups, but it
also indirectly affects these metrics by altering
edaphic conditions (fig. S5). Both SEM and regression models suggest that the best predictors
of diversity differed among phylogenetic and
functional groups of fungi. Positive effects of
mean annual precipitation (MAP) and soil calcium (Ca) concentration were the strongest predictors of total fungal diversity, explaining 7.2
and 8.9% of residual richness, respectively (table
S2). Richness of EcM fungi responded positively
to the relative proportion and species richness of
EcM plants (explaining 18.3 and 8.5% of variance,
respectively), as well as soil pH (13.0%). EcM host
species richness (5.9%) and soil pH (20.4%) remained the strongest predictors in the best model for sites with EcM vegetation, accounting for
>60% of basal area, a critical point above which
the proportion of EcM plants had no further effect on EcM fungal richness. MAP had a strong
positive effect (14.8%) on richness of saprotrophs.
Diversity of plant pathogens declined with increasing distance from the equator (17.8%) and
soil carbon/nitrogen (C/N) ratio (11.6%). Animal
parasites responded positively to MAP (20.3%),
whereas monthly variation of precipitation (MAP
CV) had a negative impact on richness of mycoparasites (fungus-parasitic fungi; 8.2%). Richness
of the AM Glomeromycota was negatively related
to the age of vegetation (7.3%) but positively related to PET (3.5%) and soil pH (4.3%). Of the
major taxonomic groups, the richness of Ascomycota in general (18.5%) and that of Archaeorhizomycetes (21.7%) were negatively related to
distance from the equator in best-fit models.
Climatic variables were the best predictors for
richness of Mortierellomycotina (MAT, negative effect, 26.1%) and the ascomycete classes
Dothideomycetes (MAT, positive effect, 20.9%),
Lecanoromycetes (MAT, negative effect, 26.7%),
Leotiomycetes (MAT, negative effect, 30.1%),
Orbiliomycetes (MAT, positive effect, 12.8%),
and Sordariomycetes (MAP, positive effect, 33.4%).
The richness of Chytridiomycota and the ascomycete class Pezizomycetes was best explained by a
positive response to soil pH (8.6 and 40.5%, respectively). Concentration of soil nutrients or their
ratio to other nutrients were the strongest predictors for OTU richness of Cryptomycota (N concentration, positive effect, 10.1%), Geoglossomycetes
[N/phosphorus (P) ratio, positive effect, 3.7%],
Mucoromycotina (C/N ratio, positive effect, 19.0%),
and Wallemiomycetes (P concentration, negative
effect, 14.9%). The richness of Basidiomycota and
its class Agaricomycetes were best explained by a
positive response to soil Ca concentration (13.5 and
12.8%, respectively).
Although geographical distance per se had
negligible effects on richness (Moran’s I = 0.267),
spatial predictors were included in the best richness models of nearly all functional and phylogenetic groups (except Glomeromycota), indicating
regional- or continental-scale differences in OTU
richness (Fig. 1B). Compared with other tropical
regions, richness of fungi was conspicuously lower
in Africa, independent of biome type. These results might reflect the relatively lower MAP in
much of Africa as compared with other tropical
continents. Alternatively, lower fungal richness
could be related to the disproportionately strong
shifts in biomes during the Pleistocene, which
impoverished the African flora (18).
Among edaphic variables, soil pH and Ca
concentration were typically the most important predictors of fungal OTU richness. These
variables positively correlated with fungal richness at the global scale (F1,335 = 290.7; RPearson =
0.682; P < 0.001). The strong positive influence of
soil Ca concentration on richness of fungi, in
particular Basidiomycota, is congruent with a
similar positive relationship found for Ca and
EcM fungal richness associated with Northern
Hemisphere Alnus spp. (30). Exchangeable Ca
is important for many physiological processes
in plants and microorganisms and influences
the turnover rate of soil organic matter (31). In
soil geochemical processes, pH and Ca concentration affect each other and thus may have
both direct and indirect effects on soil biota.
Fungal functional groups were differentially affected by pH. Richness of EcM fungi was greatest
in slightly acidic to neutral soils (fig. S6), whereas
saprotrophs, especially white rot decomposers,
were more diverse in moderately to strongly
acidic soils. Richness of Pezizomycetes peaked
distinctly in neutral soils.
Macroecological patterns
In general agreement with biogeographic patterns of plants, animals, and foliar endophytic
fungi (5, 32), the overall richness of soil fungi
increased toward the equator (Fig. 3A). However, major functional and taxonomic groups
showed dramatic departures from the general
latitudinal richness patterns (Fig. 3 and fig. S7).
Namely, diversity of saprotrophic fungi, parasites, and pathogens increased at low latitudes,
whereas richness of EcM fungi peaked at midlatitudes, especially in temperate forests and
Mediterranean biomes of the Northern Hemisphere (40° to 60°N) (fig. S8). In contrast,
saprotrophic fungi had a broad richness peak
spanning from ~45°S to 25°N. Richness of
Ascomycota—in particular, that of Archaeorhizomycetes, Dothideomycetes, Eurotiomycetes,
Orbiliomycetes, and Sordariomycetes—peaked
in tropical ecosystems (fig. S7). Conversely, the
ascomycete classes Lecanoromycetes and Leotiomycetes, as well as Microbotryomycetes
(basidiomycete yeasts), Mortierellomycotina, and
Mucoromycotina increased in diversity toward
28 NOVEMBER 2014 • VOL 346 ISSUE 6213
1256688-5
R ES E A RC H | R E S EA R C H A R T I C LE
Instead, it revealed that ancient lineages are relatively more common in nonwooded ecosystems.
Relation of plant and fungal richness
Fig. 3. Relationships between residual richness of fungal taxonomic or functional groups and distance
from the equator. (A) All fungi. (B) EcM fungi. (C) Saprotrophic fungi. (D) Plant pathogens. (E) Animal
parasites. (F) Mycoparasites. (G) White rot decomposers. (H) Yeasts. Lines indicate best-fitting linear or
polynomial functions.
the poles, with no noticeable decline in boreal
forests and tundra biomes. Agaricomycetes,
Pezizomycetes, and Tremellomycetes exhibited
distinct richness peaks at mid-latitudes. Richness
of Agaricomycetes was greater in the Northern
Hemisphere, whereas that of Microbotryomycetes,
Tremellomycetes, and Wallemiomycetes peaked
in the Southern Hemisphere temperate ecosystems (fig. S8).
All of these phylogenetic groups originated
>150 million years ago on the supercontinent
1256688-6
Pangaea (33) and have had sufficient time for
long-distance dispersal. However, our data suggest that particular regional biotic or abiotic
conditions (such as soil pH and favorable climatic conditions) have likely stimulated evolutionary radiations in certain geographic areas
and not in others. Adaptation to cold climate in
younger fungal phyla has been suggested to explain differential latitudinal preferences among
fungal groups (34). However, our global analysis
provided no support for this hypothesis (fig. S9).
28 NOVEMBER 2014 • VOL 346 ISSUE 6213
Plant and fungal richness were positively correlated (fig. S10), but plant richness explained
no residual richness of fungi according to the
best regression model (R2adj < 0.01; P > 0.05).
These results and SEM path diagrams suggest
that correlations between plant and fungal richness are best explained by their similar response
to climatic and edaphic variables (covariance)
rather than by direct effects of plants on fungi.
However, when separating functional categories,
trophic groups of fungi exhibited differential
response to plant diversity and relative proportion of potential hosts.
Plant pathogens usually attack a phylogenetically limited set of host plants (35), suggesting
that plant pathogens have at least partly coevolved with their hosts and may have radiated
more intensively in the tropics, where high plant
diversification and richness permit greater diversification. Strong phylogenetic signals in soil feedbacks, adaptive radiation, and negative density
dependence (the Janzen-Connell hypothesis) have
probably contributed to the pronounced richness
of both plants and their pathogens at low latitudes (36, 37). However, our analyses revealed no
significant effects of plant richness per se on residual richness of pathogens in soil. Similarly to
pathogens, richness of AM fungi was unrelated
to the proportion of AM host trees or interpolated host richness, which may result from nonspecific associations with tree and understory
species. Hence, both AM and soil pathogen richness were unaffected by plant richness. In contrast, host richness explained 6% of variation in
EcM fungal richness, indicating either niche differentiation of fungi in forests of mixed hosts or
sampling effects (forests with higher host diversity are more likely to include plant species that
harbor high fungal diversity). With a few notable
exceptions, most studies have found low levels of
host preference or host specificity among EcM
fungi (38). We found that relative EcM host
density had a strong influence on EcM fungal
richness, suggesting that greater availability of
colonizable roots in soil provides more carbon
for EcM fungi and thereby yields greater species
density and local-scale richness regardless of latitude. The peak of EcM fungal taxonomic and
phylogenetic richness in northern temperate
biomes coincides with the geographical distribution and dominance of Pinaceae, which is the
oldest extant EcM plant family (15, 39).
The ratio of plant-to-fungal richness decreased
exponentially with increasing latitude because
plant diversity dropped precipitously toward the
poles relative to fungal diversity (Fig. 4). This
finding calls into question present global fungal
richness estimates. These estimates assume similar spatial turnover of plant and fungal species
and a constant plant-to-fungus ratio and have
been formulated mostly based on data from temperate and boreal ecosystems (1, 19, 20). Yet,
local-scale beta diversity of both plants and fungi
sciencemag.org SCIENCE
RE S E ARCH | R E S E A R C H A R T I C L E
(table S3 and fig. S12). PET contributed 3.8, 2.8,
and 11.7% to community structure of saprotrophs,
plant pathogens, and yeasts, respectively. Distance
from the equator (1.3%) and soil pH (0.7%) were
the strongest predictors of EcM fungal community composition, whereas mean annual temperature (4.0%) was the strongest predictor for
animal parasites, and distance from the equator (3.5%) was the best predictor for mycoparasites (table S3 and fig. S12).
These results indicate that both environmental and spatial predictors generally have a minor
influence on species-level composition of fungi at
the global scale. Nonetheless, the significant globalscale pH effect in several groups of fungi is
consistent with the substantial influence of pH
on the phylogenetic structure of soil fungal and
bacterial communities in both local and continental scales (27, 45). The relatively stronger
climatic and edaphic drivers of richness at the
class and phylum level suggest that phylogenetic
niche conservatism in fungal lineages is similar
to cross-biome distribution patterns in vascular
plants (46) and protists (47).
Global biogeography
Fig. 4. Relationship between standardized plant richness to fungal richness ratio and distance
from the equator. (A) Interpolated values. (B) Polynomial regression. Residuals of fungal richness are
taken from the best linear regression model accounting for other significant predictors. Warm colors
indicate high plant-to-fungal richness ratio, whereas cold colors indicate low plant-to-fungal richness.
differ among temperate and tropical sites (40, 41),
and there are profound differences in plant species turnover depending on propagule size (42).
Natural distribution of very few vascular plant
species encompass several continents, but there
are multiple fungal species with circumpolar or
cosmopolitan distribution (43, 44). Although we
cannot directly compare plant and fungal beta
diversity, spatial turnover of plant species is inarguably greater (42). Based on the function of
fungi-to-plant richness ratio to latitude and latitudinal distribution of land, we calculated that
fungal richness is overestimated by 1.5- and 2.5-fold
on the basis of constant temperate (45° latitude)
and boreal (65° latitude) richness ratios, respectively.
Because richness estimates are calculated
based on the frequency of the rarest species,
the reliability of singleton data call into question
biologically meaningful extrapolations (11). In
SCIENCE sciencemag.org
metabarcoding studies such as ours, sequencing errors tend to give rise to singleton sequences, and the number of rare artificial taxa grows
rapidly with increasing sequencing depth (25).
Therefore, despite the size of our data set, it cannot readily be used to produce reliable taxonomic
richness extrapolations.
Community ecology
Variation partitioning analysis revealed that
climatic, edaphic, and floristic variables (and
their shared effects) are the strongest predictors for community composition of all fungi and
most of their functional groups (fig. S11). However, the saprotroph community composition
was most strongly explained by purely spatial
variables. More specifically, PET and soil pH
explained 2.4 and 1.5%, respectively, of the variation in total fungal community composition
Consistent with Rapoport’s rule formulated for
macro-organisms (24) and later applied to marine bacteria (48), the mean latitudinal range of
fungi strongly increased toward the poles (fig. S13).
These results also suggest that a greater proportion of fungi are endemic within tropical rather
than extratropical ecosystems.
Major taxonomic and functional groups of
fungi differed markedly in their distribution
range (figs. S14 and S15). Animal parasites were
more widely distributed as compared with all other
groups, suggesting that there are many generalist OTUs with global distribution. Saprotrophs
and plant pathogens had broader distribution
ranges than EcM and AM root symbionts. Taxa
belonging to Mortierellomycotina, Mucoromycotina, Tremellomycetes, and Wallemiomycetes—
groups that include a large proportion of saprotrophs and parasites that produce exceptionally
large quantities of aerially dispersed mitospores—
were generally most widely distributed. Besides
the AM Glomeromycota, OTUs belonging to the
ascomycete classes Archaeorhizomycetes, Geoglossomycetes, and Orbiliomycetes were detected
from the fewest sites.
The northernmost biogeographic regions (Europe,
West Asia, East Asia, and North America) had
the most similar fungal communities as revealed by shared fungal OTUs (Fig. 5). According to the Morisita-Horn similarity index, the
northern and southern temperate regions clustered together with marginally nonsignificant
support (P = 0.064) (Fig. 6A). In spite of the large
geographical distance separating them, paleoand neotropical biogeographic regions clustered
together (P = 0.059). However, biogeographic
clustering of regions deviated markedly in certain functional groups of fungi (Fig. 6). For instance, EcM fungi in the southern temperate
and tropical regions had greater similarity as
compared with northern temperate ecosystems
28 NOVEMBER 2014 • VOL 346 ISSUE 6213
1256688-7
R ES E A RC H | R E S EA R C H A R T I C LE
Fig. 5. Connectedness of biogeographic regions by shared OTUs of EcM fungi, saprotrophs, and plant pathogens. Blue, EcM fungi; Black,
saprotrophs; and red, plant pathogens. The width of lines and diameter of circles are proportional to the square root of the number of connections and
sample size (number of sites), respectively. Numbers in circles indicate the number of OTUs found in each region. OTUs with a single sequence per site
and OTUs belonging to Hypocreales and Trichocomaceae (in which the ITS region is too conservative for species-level discrimination) were excluded.
(P = 0.001). Among biomes, boreal forests, temperate coniferous forests, and temperate deciduous forests shared the largest numbers of fungal
OTUs (fig. S16). Fungal OTUs in temperate deciduous forests were highly similar to Mediterranean
and tropical montane forests, whereas fungal
OTUs in tropical montane forests were linked
to tropical moist forests, which in turn exhibited
substantial connections with tropical dry forests
and savannas. As a result, cluster analysis supported separation of tropical and nontropical
biomes (Fig. 6B). Consistent with biogeographic
region-level analysis, lowland tropical biomes,
arctic tundra and boreal forests biomes, and
temperate biomes formed three well-supported
clusters. Tropical montane forests and grasslands
and shrublands were clustered with temperate
biomes according to distribution of all fungi and
most functional groups. However, in EcM fungi,
taxa from southern temperate forests, tropical
montane forests, and grass/shrublands clustered
with tropical lowland and Mediterranean biomes. A relatively large proportion of EcM fungal
taxa were shared across various biomes in
Australia and New Guinea, which explains these
1256688-8
deviating patterns. In contrast, plant pathogens
from tropical montane forests clustered with
tropical lowland biomes rather than with temperate biomes.
Our biogeographic analyses complement the
community-level results, suggesting that both
climate and biogeographic history shape macroecological patterns of fungi. Comigration with
hosts over Pleistocene land bridges (such as
Beringia, Wallacea, and Panamanian) and longdistance dispersal by spores appear to have
played important roles in shaping current fungal
distribution patterns (30, 43). The relative influence of climate and biotrophic associations
with host plants of varying extant distributions
probably contribute to differences in the range
and biogeographic relationships among fungal
functional groups (49). In addition, taxon-specific
constraints for dispersal, such as shape and size
of propagules and sensitivity to ultraviolet light,
may differentially affect long-distance dispersal
among taxa (7). For instance, Glomeromycota
OTUs, which form relatively large non–winddispersed asexual spores, had the lowest average
geographical range. In general, region-based dis-
28 NOVEMBER 2014 • VOL 346 ISSUE 6213
tribution patterns of fungi are somewhat conflicting with clustering of plants and animals,
where Holarctic lineages are deeply nested within larger tropical groups (50). Consistent with
macroorganisms, fungi from the Southern Hemisphere temperate landmasses cluster together.
Differences observed in macroecological patterns
among fungi, plants, and animals may originate
from the relative strength of dispersal limitation
and phylogeographic history, but exaggeration
from methodological differences among studies
cannot be discounted. The use of homogenous
sampling and analytical methods, as done in this
study, are necessary to confidently compare macroecological patterns among distinct life forms
and to reliably test degrees of consistency among
all kingdoms of life.
Conclusions and perspectives
Climatic variables explained the greatest proportion of richness and community composition in
fungal groups by exhibiting both direct and
indirect effects through altered soil and floristic
variables. The strong driving climatic forces identified here open up concerns regarding the
sciencemag.org SCIENCE
RE S E ARCH | R E S E A R C H A R T I C L E
Fig. 6. Ward clustering of biogeographic regions and biomes based on the Morisita-Horn pairwise
similarity index. Left, biogeographic regions; right, biomes. (A and B) All fungi. (C and D) EcM fungi.
(E and F) Saprotrophs. (G and H) Plant pathogens. Numbers above branches indicate P values.
impact of climate change on the spread of disease (51) and the functional consequences of
altered soil microorganism communities (52).
The observed abrupt functional differences between fungal communities in forested and treeless ecosystems, despite spatial juxtaposition,
suggests that plant life form and mycorrhizal
associations determine soil biochemical processes more than plant species per se. Loss of
tree cover and shrub encroachment resulting from
drying and warming may thus have a marked
impact on ecosystem functioning both aboveand belowground.
In addition to natural mechanisms, such as
long-distance dispersal and migration over past
land bridges, global trade has enhanced the spread
of some non-native soil organisms into other ecosystems, where they sometimes become hazardous
to native biota, economy, and human health (53).
Our results highlight how little insight we still
SCIENCE sciencemag.org
have into natural microbial distribution patterns,
and this undermines our ability to appraise the
actual role of humans in shaping these biogeographic processes. Even larger-scale sampling
campaigns are needed to provide data for establishing natural distributions and building
species distribution models (52), which will
enable us to predict the spread and habitat suitability of non-native microorganisms.
RE FERENCES AND NOTES
1. M. Blackwell, The fungi: 1, 2, 3 ... 5.1 million species?
Am. J. Bot. 98, 426–438 (2011). doi: 10.3732/ajb.1000298;
pmid: 21613136
2. N. Fierer, M. S. Strickland, D. Liptzin, M. A. Bradford,
C. C. Cleveland, Global patterns in belowground
communities. Ecol. Lett. 12, 1238 (2009).
doi: 10.1111/j.1461-0248.2009.01360.x
3. H. Serna-Chavez, N. Fierer, P. M. van Bodegom, Global
drivers and patterns of microbial abundance in soil. Glob.
Ecol. Biogeogr. 22, 1162–1172 (2013).
doi: 10.1111/geb.12070
4. X. Xu, P. Thornton, W. M. Post, A global analysis of soil
microbial biomass carbon, nitrogen and phosphorus in
terrestrial ecosystems. Glob. Ecol. Biogeogr. 22,
737–749 (2013). doi: 10.1111/geb.12029
5. H. Hillebrand, On the generality of the latitudinal diversity
gradient. Am. Nat. 163, 192–211 (2004). doi: 10.1086/381004;
pmid: 14970922
6. G. G. Mittelbach et al., Evolution and the latitudinal diversity
gradient: Speciation, extinction and biogeography. Ecol. Lett.
10, 315–331 (2007). doi: 10.1111/j.1461-0248.2007.01020.x;
pmid: 17355570
7. B. J. Finlay, Global dispersal of free-living microbial eukaryote
species. Science 296, 1061–1063 (2002). doi: 10.1126/
science.1070710; pmid: 12004115
8. D. R. Nemergut et al., Patterns and processes of microbial
community assembly. Microbiol. Mol. Biol. Rev. 77, 342–356
(2013). doi: 10.1128/MMBR.00051-12; pmid: 24006468
9. K. G. Peay, M. I. Bidartondo, A. E. Arnold, Not every fungus is
everywhere: Scaling to the biogeography of fungal-plant
interactions across roots, shoots and ecosystems. New Phytol.
185, 878–882 (2010). doi: 10.1111/j.1469-8137.2009.03158.x;
pmid: 20356342
10. J. M. Talbot et al., Endemism and functional convergence
across the North American soil mycobiome. Proc. Natl. Acad.
Sci. U.S.A. 111, 6341–6346 (2014). doi: 10.1073/
pnas.1402584111; pmid: 24733885
11. B. D. Lindahl et al., Fungal community analysis by
high-throughput sequencing of amplified markers—A
user’s guide. New Phytol. 199, 288–299 (2013).
doi: 10.1111/nph.12243; pmid: 23534863
12. U. Kõljalg et al., Towards a unified paradigm for sequencebased identification of fungi. Mol. Ecol. 22, 5271–5277 (2013).
doi: 10.1111/mec.12481; pmid: 24112409
13. K. Abarenkov et al., Evol. Bioinform. 6, 189 (2010).
14. S. M. Adl et al., The revised classification of eukaryotes.
J. Eukaryot. Microbiol. 59, 429 (2012). doi: 10.1111/j.15507408.2012.00644.x; pmid: 22742560
15. L. Tedersoo, M. E. Smith, Lineages of ectomycorrhizal fungi
revisited: Foraging strategies and novel lineages revealed by
sequences from belowground. Fungal Biol. Rev. 27, 83–99
(2013). doi: 10.1016/j.fbr.2013.09.001
16. L. Tedersoo et al., Enzymatic activities and stable isotope
patterns of ectomycorrhizal fungi in relation to phylogeny and
exploration types in an afrotropical rain forest. New Phytol.
195, 832–843 (2012). doi: 10.1111/j.1469-8137.2012.04217.x;
pmid: 22758212
17. I. Hiiesalu et al., Species richness of arbuscular mycorrhizal
fungi: Associations with grassland plant richness and biomass.
New Phytol. 203, 233–244 (2014). doi: 10.1111/nph.12765;
pmid: 24641509
18. H. Kreft, W. Jetz, Global patterns and determinants of
vascular plant diversity. Proc. Natl. Acad. Sci. U.S.A.
104, 5925–5930 (2007). doi: 10.1073/pnas.0608361104;
pmid: 17379667
19. D. L. Taylor et al., A first comprehensive census of fungi in soil
reveals both hyperdiversity and fine-scale niche partitioning.
Ecol. Monogr. 84, 3–20 (2014). doi: 10.1890/12-1693.1
20. H. E. O’Brien, J. L. Parrent, J. A. Jackson, J. M. Moncalvo,
R. Vilgalys, Fungal community analysis by large-scale
sequencing of environmental samples. Appl. Environ. Microbiol.
71, 5544–5550 (2005). doi: 10.1128/AEM.71.9.55445550.2005; pmid: 16151147
21. R Core Team, R: A Language and Environment for Statistical
Computing (R Foundation for Statistical Computing, Vienna
2014).
22. T. F. Rangel, J. A. F. Diniz-Filho, L. M. Bini, SAM: A comprehensive
application for Spatial Analysis in Macroecology. Ecography
33, 46–50 (2010). doi: 10.1111/j.1600-0587.2009.06299.x
23. C. L. Schoch et al.Fungal Barcoding ConsortiumFungal
Barcoding Consortium Author List, Nuclear ribosomal internal
transcribed spacer (ITS) region as a universal DNA barcode
marker for Fungi. Proc. Natl. Acad. Sci. U.S.A. 109, 6241–6246
(2012). doi: 10.1073/pnas.1117018109; pmid: 22454494
24. G. C. Stevens, The latitudinal gradient in geographical range:
How so many species coexist in the tropics. Am. Nat. 133, 240
(1989). doi: 10.1086/284913
25. I. A. Dickie, Insidious effects of sequencing errors on perceived
diversity in molecular surveys. New Phytol. 188, 916–918
(2010). doi: 10.1111/j.1469-8137.2010.03473.x;
pmid: 20854395
26. M. D. M. Jones et al., Discovery of novel intermediate forms
redefines the fungal tree of life. Nature 474, 200–203 (2011).
doi: 10.1038/nature09984; pmid: 21562490
28 NOVEMBER 2014 • VOL 346 ISSUE 6213
1256688-9
R ES E A RC H | R E S EA R C H A R T I C LE
27. C. L. Lauber, M. Hamady, R. Knight, N. Fierer, Pyrosequencingbased assessment of soil pH as a predictor of soil bacterial
community structure at the continental scale. Appl. Environ.
Microbiol. 75, 5111–5120 (2009). doi: 10.1128/AEM.00335-09;
pmid: 19502440
28. M. S. Robeson et al., Soil rotifer communities are extremely
diverse globally but spatially autocorrelated locally. Proc. Natl.
Acad. Sci. U.S.A. 108, 4406–4410 (2011). doi: 10.1073/
pnas.1012678108; pmid: 21368117
29. A. Rosling et al., Archaeorhizomycetes: Unearthing an ancient
class of ubiquitous soil fungi. Science 333, 876–879 (2011).
doi: 10.1126/science.1206958; pmid: 21836015
30. S. Põlme et al., Biogeography of ectomycorrhizal fungi
associated with alders (Alnus spp.) in relation to biotic and
abiotic variables at the global scale. New Phytol. 198,
1239–1249 (2013). doi: 10.1111/nph.12170; pmid: 23421531
31. P. B. Reich et al., Linking litter calcium, earthworms and soil
properties: A common garden test with 14 tree species. Ecol.
Lett. 8, 811–818 (2005). doi: 10.1111/j.1461-0248.2005.00779.x
32. A. E. Arnold, Understanding the diversity of foliar endophytic
fungi: Progress, challenges, and frontiers. Fungal Biol. Rev. 21,
51–66 (2007). doi: 10.1016/j.fbr.2007.05.003
33. M. L. Berbee, J. W. Taylor, Dating the molecular clock in
fungi—How close are we? Fungal Biol. Rev. 24, 1–16
(2010). doi: 10.1016/j.fbr.2010.03.001
34. K. K. Treseder et al., Evolutionary histories of soil fungi are
reflected in their large-scale biogeography. Ecol. Lett. 17,
1086–1093 (2014). pmid: 24912000
35. G. S. Gilbert, C. O. Webb, Phylogenetic signal in plant
pathogen-host range. Proc. Natl. Acad. Sci. U.S.A. 104,
4979–4983 (2007). doi: 10.1073/pnas.0607968104;
pmid: 17360396
36. X. Liu et al., Experimental evidence for a phylogenetic
Janzen-Connell effect in a subtropical forest. Ecol. Lett. 15,
111–118 (2012). doi: 10.1111/j.1461-0248.2011.01715.x;
pmid: 22082078
37. R. Bagchi et al., Pathogens and insect herbivores drive
rainforest plant diversity and composition. Nature 506, 85–88
(2014). doi: 10.1038/nature12911; pmid: 24463522
38. M. Bahram, H. Harend, L. Tedersoo, Network perspectives of
ectomycorrhizal associations. Fungal Ecol. 7, 70–77
(2013). doi: 10.1016/j.funeco.2013.10.003
1256688-10
39. L. Tedersoo et al., Towards global patterns in the diversity and
community structure of ectomycorrhizal fungi. Mol. Ecol. 21,
4160–4170 (2012). doi: 10.1111/j.1365-294X.2012.05602.x;
pmid: 22568722
40. M. Bahram et al., The distance decay of similarity in
communities of ectomycorrhizal fungi in different ecosystems
and scales. J. Ecol. 101, 1335–1344 (2013). doi: 10.1111/13652745.12120
41. H. Qian, S. Chen, L. Mao, Z. Ouyang, Drivers of b-diversity
along latitudinal gradients revisited. Glob. Ecol. Biogeogr. 22,
659–670 (2013). doi: 10.1111/geb.12020
42. H. Qian, Beta diversity in relation to dispersal ability for
vascular plants in North America. Glob. Ecol. Biogeogr. 18,
327–332 (2009). doi: 10.1111/j.1466-8238.2009.00450.x
43. J. Geml et al., An arctic community of symbiotic fungi
assembled by long-distance dispersers: Phylogenetic diversity
of ectomycorrhizal basidiomycetes in Svalbard based on soil
and sporocarp DNA. J. Biogeogr. 39, 74–88 (2012).
doi: 10.1111/j.1365-2699.2011.02588.x
44. I. Timling, D. A. Walker, C. Nusbaum, N. J. Lennon, D. L. Taylor,
Rich and cold: Diversity, distribution and drivers of fungal
communities in patterned-ground ecosystems of the North
American Arctic. Mol. Ecol. 23, 3258–3272 (2014).
doi: 10.1111/mec.12743; pmid: 24689939
45. J. Rousk et al., Soil bacterial and fungal communities across a
pH gradient in an arable soil. ISME J. 4, 1340–1351 (2010).
doi: 10.1038/ismej.2010.58; pmid: 20445636
46. M. D. Crisp et al., Phylogenetic biome conservatism on a global
scale. Nature 458, 754–756 (2009). doi: 10.1038/
nature07764; pmid: 19219025
47. S. T. Bates et al., Global biogeography of highly diverse
protistan communities in soil. ISME J. 7, 652–659 (2013).
doi: 10.1038/ismej.2012.147; pmid: 23235291
48. W. J. Sul, T. A. Oliver, H. W. Ducklow, L. A. Amaral-Zettler,
M. L. Sogin, Marine bacteria exhibit a bipolar distribution. Proc.
Natl. Acad. Sci. U.S.A. 110, 2342–2347
(2013). doi: 10.1073/pnas.1212424110; pmid: 23324742
49. H. Sato, R. Tsujino, K. Kurita, K. Yokoyama, K. Agata,
Modelling the global distribution of fungal species: New
insights into microbial cosmopolitanism. Mol. Ecol. 21,
5599–5612 (2012). doi: 10.1111/mec.12053;
pmid: 23062148
28 NOVEMBER 2014 • VOL 346 ISSUE 6213
50. I. Sanmartín, F. Ronquist, Southern Hemisphere biogeography
inferred by event-based models: Plant versus animal
patterns. Syst. Biol. 53, 216–243 (2004). doi: 10.1080/
10635150490423430; pmid: 15205050
51. S. Altizer, R. S. Ostfeld, P. T. Johnson, S. Kutz, C. D. Harvell,
Climate change and infectious diseases: From evidence to a
predictive framework. Science 341, 514–519 (2013).
doi: 10.1126/science.1239401; pmid: 23908230
52. W. H. Van der Putten, M. Macel, M. E. Visser,
Predicting species distribution and abundance responses to
climate change: Why it is essential to include biotic
interactions across trophic levels. Philos. Trans. R. Soc. B 365,
2025–2034 (2010). doi: 10.1098/rstb.2010.0037
53. M.-L. Desprez-Loustau et al., The fungal dimension of
biological invasions. Trends Ecol. Evol. 22, 472–480 (2007).
doi: 10.1016/j.tree.2007.04.005; pmid: 17509727
AC KNOWLED GME NTS
The sequence data and metadata are deposited in the Short Read
Archive (accession SRP043706) and UNITE databases. Data used for
analyses are available as supplementary materials, data files S1
and S2. We thank A. Corrales, H. Mann, D. Sveshnikov, F. O. P. Stefani,
A. Voitk, and Y. Wu for supplying single soil samples; R. Puusepp,
M. Haugas, and M. Nõukas for sample preparation; H. Kreft for
providing interpolated plant diversity data; S. Jüris for designing the
printed figure; M. I. Bidartondo, K. G. Peay, and three anonymous
reviewers for constructive comments on the manuscript; and relevant
institutions of multiple countries for issuing permissions for sampling
and delivery. The bulk of this project was funded from Estonian
Science Foundation grants 9286, 171PUT, and IUT20-30; EMP265;
Frontiers in Biodiversity Research; European Research Council; and in
part by numerous funding sources that facilitated co-author efforts
in collecting and preprocessing samples.
SUPPLEMENTARY MATERIALS
www.sciencemag.org/content/346/6213/1256688/suppl/DC1
Figs. S1 to S17
Tables S1 to S3
Data Files S1 and S2
29 May 2014; accepted 16 October 2014
10.1126/science.1256688
sciencemag.org SCIENCE
Download