Analysis of Pel Decimation and Technology Choices to
Reduce Energy on SAD Calculation
Ismael Seidel, André Beims Bräscher, Bruno George de Moraes, Marcio Monteiro, José Luis Güntzel
Embedded Computing Lab. (ECL) – Department of Informatics and Statistics - PPGCC
Federal University of Santa Catarina (UFSC) - Florianópolis, Brazil
e-mail: {ismaelseidel, andre.brascher, brunogm, marcio, guntzel}@inf.ufsc.br
ABSTRACT
As the number of pixels per frame tends to increase in new high definition video coding standards such as HEVC
and VP9, pel decimation appears as a viable means of increasing the energy efficiency of Sum of Absolute
Differences (SAD) calculation. First, we analyze the quality costs of pel decimation using a video coding software.
Then we present and evaluate two VLSI architectures to compute the SAD of 4x4 pixel blocks: one that can be
configured with 1:1, 2:1 or 4:1 sampling ratios and a non-configurable one, to serve as baseline in comparisons.
The architectures were synthesized for 90nm, 65nm and 45nm standard cell libraries assuming both nominal and
Low-Vdd/High-Vt (LH) cases for maximum and for a given target throughput. The impacts of both subsampling
and LH on delay, power and energy efficiency are analyzed. In a total of 24 syntheses, the 45nm/LH configurable
SAD architecture synthesis achieved the highest energy efficiency for target throughput when operating in pel
decimation 4:1, spending only 2.05pJ for each 4×4 block. This corresponds to about 13.65 times less energy than
the 90nm/nominal configurable architecture operating in full sampling mode and maximum throughput and about
14.77 times less than the 90nm/nominal non-configurable synthesis for target throughput. Aside the improvements achieved by using LH, pel decimation solely was responsible for energy reductions of 40% and 60% when
choosing 2:1 and 4:1 subsampling ratios, respectively, in the configurable architecture. Finally, it is shown that the
configurable architecture is more energy-efficient than the non-configurable one.
Index Terms: Video Coding; VLSI Design; Sum of Absolute Differences; Pel Decimation; Energy efficiency.
I. INTRODUCTION
Video compression is a computationally intensive task that usually demands high performance,
which, by its turn, results from the real time constraints
inherent to applications such as video capture. Besides
baseband processing, which is responsible for the largest amount of consumed energy [1], internet browsing
and media applications respond for a significant amount
of energy consumption [2], [3], since they perform
many picture/video coding and decoding operations.
Moreover, the use of video compression is mandatory
in current Personal Mobile Devices (PMDs), such as
point-and-shoot cameras, smartphones and tablets. In
those cases, reducing the number of video coding operations helps to prolong battery lifetime. Therefore,
in some applications it might be necessary to sacrifice
quality to meet timing and energy constraints.
In most codecs, each frame of a video sequence
is divided into smaller blocks which are further submitted to Inter and Intra frame prediction techniques to
explore temporal and spatial redundancies, respectively.
Both predictions rely on coding the residue data (i.e.,
48
the differences) between similar blocks, and a few information about its reconstruction, like Motion Vectors
(MV) or intra mode index. The so-called Motion
Estimation (ME) occurs in Inter frame prediction and
corresponds to the most computational intensive task
of the whole compression process [4]. For each block,
ME searches for a candidate block, which minimizes
a similarity metric, to be used as reference for Motion
Compensation (MC) to reconstruct the original block.
The Sum of Absolute Differences (SAD) [5] is
the most widely used similarity metric because it relies
only on basic arithmetic operations (addition, subtraction and module), thereby being fast. Moreover, its
simplicity makes it very appropriate for VLSI (VeryLarge Scale Integration) coder implementations.
Nevertheless, the number of SAD operations required
for video compression increases dramatically when
high and ultra-high definition video formats become
widely adopted. In Fig. 1 it is possible to notice such
increase in the number of pixels/frame, which further
reflects in both the number of pixel blocks to encode
and in the number of candidate blocks. This turns performance and power consumption requirements of
Journal of Integrated Circuits and Systems 2014; v.9 / n.1:48-59
Analysis of Pel Decimation and Technology Choices to Reduce Energy on SAD Calculation
Seidel, Bräscher, Moraes, Monteiro & Güntzel
in Section III. Section IV outlines our experimental
setup and the achieved synthesis results. Conclusions
are drawn in Section V.
II. SAD AND PEL DECIMATION
Figure 1. Number of pixels in a single frame (×10K) according to
frame resolution. Note that ordinates are presented in logarithmic
scale.
VLSI SAD engines even more stringent. A pragmatic
strategy to circumvent this problem is the adoption of
the so-called pel decimation algorithm [6].
In pel decimation, the pixels are sampled over
the search area according to a chosen subsampling ratio. Such subsampling improves the performance of the
encoding, but it lowers the correlation between candidates, resulting in a decrease of the prediction quality. Aside the evident performance improvements and
energy savings achieved in the computation of similarity metric, pel decimation has less impact on quality
when applied to higher definition videos [7] and thus,
it tends to be still more beneficial for the forthcoming
video standards such as HEVC [8] and VP9 [9]. It is
also important to observe that pel decimation does not
dismiss the use of an efficient search algorithm, but
should be used in conjunction with it to achieve more
significant speedups and power savings. Indeed, several
pel decimation-based search strategies are found in the
literature, such as APS [10], GEA [11] and QME [12].
In this paper a SAD VLSI architecture that can
be configured to perform pel decimation is presented
along with a fixed SAD architecture for comparison
purposes. Its cost, performance and energy efficiency
are evaluated for two throughputs (target and maximum) through delay and power estimates obtained after logic synthesis and simulation for 90nm, 65nm and
45nm commercial standard cell libraries. Both target
and maximum frequencies versions of the two SAD
architectures were also synthesized using low supply
voltage and high threshold voltage (Low-Vdd/HighVt) [13] in order to evaluate the impact of such low
power techniques on area, performance and power.
The main contribution of this paper is the analysis of the impacts of pel decimation and Low-Vdd/
High-Vt on SAD calculation. Such impacts encompass
in-software video quality and area, power, throughput
and energy efficiency for all 24 syntheses variants. The
paper is organized as follows. Section II describes the
SAD calculation and its relevance in video coding, introduces pel decimation and discourses about its effect
on quality. The synthesized architectures are described
Journal of Integrated Circuits and Systems 2014; v.9 / n.1:48-59
The Sum of Absolute Differences (SAD) for
a M×N sized pixel block is obtained as expressed in
Equation 1, where Ori is the original block, i.e, the
one being coded, and Can is the candidate block under
evaluation. Due to its simplicity, SAD has been extensively used as similarity metric in search algorithms for
ME implementations.
(1)
Considering the Fullsearch Block Matching
Algorithm (FBMA) [14], which is recognized as the
one providing the best matching results [12], the similarity has to be evaluated for each candidate block within the chosen search area and therefore, the use of a
simple metric such SAD is essential to keep the computational effort as small as possible. To demonstrate how
large is such effort, we chose to evaluate two figures
of merit: execution time and number of computations.
To obtain these figures, we used GNU profiler
version 2.22 (Gprof) [15], which is one of the most
used profiling tools and it is found in almost every
Unix-based operating systems. Gprof measures only
the time spent by each function using a sampled execution histogram, without counting the operating
system time. Therefore, the run-time figures provided
by Gprof are based on sampling process, which means
that they are subject to statistical inaccuracy. On the
other hand, instead of sampling, the number-of-calls
figures are derived by counting, i.e, insertion of a
count instruction in every function call. Hence, such
counting is completely accurate and for a given deterministic program with a defined set of inputs it will
always result in the same count value [16].
The profiling was performed over the H.264/
AVC [17] reference software (JM) version 18.5
[18], coding 50 frames of the video sequence called
“Pedestrian Area”, with resolution of 1920x1080 pixels and frame rate of 25fps [19]. To reduce the statistical inaccuracy of run-time measurement of Gprof
each experimental configuration was run 10 times.
We used search areas (SAs) of (-16,+16], (-36,+36],
(-56,+56], (-92,+92] and (-128,+128] pixels and
also several configurations of search algorithms:
FBMA, Fast FBMA, Unsymmetrical-cross Multihexagon-grid Search (UMHexagonS) [20], Simplified
UMHexagonS (SUMHexagonS) [21] and Enhanced
Predictive Zonal Search (EPZS) [22].
49
Analysis of Pel Decimation and Technology Choices to Reduce Energy on SAD Calculation
Seidel, Bräscher, Moraes, Monteiro & Güntzel
All the 250 experiments were run over Linux
version 3.2.0-4-amd64 #1 SMP Debian 7.0 3.2.39-2
64 bits. The machine configuration was Intel® Xeon®
[email protected] with 12GB of RAM. The EPZS
algorithm with SA (-16,+16] requires the lowest
number of SAD calculations among the experimented search algorithms: ~23 million for each frame in
average. On the other hand, the most intensive search
algorithm was FBMA, requiring an average of ~160
million SAD calculations for each frame with SA
(-16,+16] (~7× more than EPZS).
The absolute values of SAD execution time are
presented in Fig. 2, except the ones of FBMA, which
are too large for a direct comparison with the others.
In general, in Fig. 2, one can notice an increasing SAD
time for SUMHexagonS and UMHexagonS as the SAs
increases, which is also the behavior of FBMA, ranging
from ~38min to ~6.5h. In the case of EPZS the SAD
time is almost constant, which means that such algorithm is almost independent of SA. In the case of Fast
FBMA, the SAD time greatly vary, which is mainly
caused by the rearrangement performed prior to search
as to decrease the total number of candidates (hence
the name of “fast”).
Analyzing the results of percentual execution
time, it was noticed only a small data variation caused
by the search window size, which impacts not only on
the SAD calculation, but also on the overall algorithm
behavior. Therefore, for a given search algorithm, the
percentual time of SAD is almost constant disregarding the search range, as can be seen in Table I, which
shows the arithmetic mean of percentage SAD time,
for each analyzed search algorithm. It also shows their
Figure 2. Average SAD run-time (s) results for all analyzed ME
search algorithms.
Table I. Arithmetic Mean (µ), Standard Deviation (σ) and
Coefficient of Variation (CV) of % Execution Time According to
ME Search Algorithm.
FBMA
Fast FBMA
UMHexagonS
SUMHexagonS
EPZS
µ
74.43
10.447
41.67
56.18
35.67
σ
3.9
9.270
2.34
3.54
0.48
CV
0.052
0.217
0.056
0.063
0.013
50
respective standard deviations and coefficient of variation, the latter being the ratio of the standard deviation
σ to the mean μ (σ/μ) and measures the data variability
related to its mean.
In Table I we can notice that the largest CV
among all ME algorithms are the one of Fast FBMA.
Aside Fast FBMA, all others present very small CV
values, indicating that the SAD relative (%) execution
time strongly depends on the search algorithm. Last
but not least, it is noticeable the large amount of the
total percentage encoding time taken by SAD calculations, even for fast algorithms such as EPZS. A broader analysis that includes SAD results for x264 (H.264/
AVC) [23], HM (HEVC) [24] and libvpx (VP9) [9]
is presented in [25].
Knowing how large is the number of similarity
calculations during ME and its relative execution time
within the whole compression process, it is straightforward to understand the adoption of SAD instead
of more elaborate metrics. In [26], Chen et al. present
a 720p H.264/AVC [17] coder architecture in which
the SAD calculation responds for 33% of gate count.
In [27] Liu and Zaccarin describe a variable block size
ME architecture in which the SAD engine corresponds
to roughly 79% of total gate count. Considering the
intensive use of SAD operations and the pressure for
more energy-efficient coder implementations, the
design of low-power SAD architectures is of utmost
importance for video compression. In [28] and [29]
high performance SAD architectures are presented.
Unfortunately, these works do not take into account
aspects of power and energy efficiency.
A more accurate analysis of SAD architectures
is presented by Walter and collaborators [30]-[32].
Several 4×4 pixel SAD architectures were synthesized
with a variety of parallelism and pipeline configurations. In order to further reduce the energy expended
per SAD calculation the authors also synthesized the
architectures for target frequencies. These target frequencies were chosen aiming a throughput of one million (1 M) macroblocks/s which, according to the authors, is the necessary throughput for coding a 1080p
video with 30fps in real time. They reported the 4×4
pixel (16 input) architecture with higher degree of parallelism and less pipeline stages as the most energy-efficient one. Also according to the authors of [30]-[32]
the pipeline registers are the main contributors to power consumption.
As an attempt to reduce the number of calculations during ME, several works have proposed algorithms that restrict the searching area. Another effective means of reducing this number relies on the use of
Pel Decimation algorithm [6], [12], [27], [33], [34],
which can be used in conjunction with the latter approach. In pel decimation the pixels are taken regularly
over the search area, resulting in a subsampling [6].
Journal of Integrated Circuits and Systems 2014; v.9 / n.1:48-59
Analysis of Pel Decimation and Technology Choices to Reduce Energy on SAD Calculation
Seidel, Bräscher, Moraes, Monteiro & Güntzel
When pel decimation is applied, a decrease in prediction quality may occur, since the correlation of each
pixel in the block is lost.
A. Quality Assessment of Pel Decimation
In [7] a detailed quality evaluation of several pel
decimation patterns and ratios is presented. The authors performed a statistical analysis on the final encoded video quality (expressed both as PSNR [5] and
DSSIM [35]) using analysis of variance (ANOVA).
For the two pel decimation ratios considered in the
present work (2:1 and 4:1), the authors of [7] reported a maximum of 2.5% PSNR and 8.2% DSSIM
loss (in average) for 2:1 patterns with respect to full
sampling and 2.8% PSNR and 14.1% DSSIM loss for
4:1 patterns, also with respect to full sampling. Such
percentages are within a 95% confidence interval and
consider only comparison of videos that have the same
bitrates. Most important, the work in [7] also demonstrates that as video resolution increases the quality
losses resulted from higher pel decimation ratios becomes more negligible.
In [37] the Joint Collaborative Team on Video
Coding (JCT-VC) defines a recommendation of common test conditions. In such recommendation, one
must evaluate the Bjøntegaard Delta PSNR (BDPSNR) or the BD-Rate in six different video sample
classes (A-F). Class A has four WQXGA (2560×1600)
sequences. Two of them, called Nebuta and Steam
Locomotive Train, have 300 frames and bit depth of
10-bit per sample. Such bit depth comes from the requisition in [38], aiming support for the color space
of recommendation BT.2020 [39], to be used in ultra high definition television. The other two samples
(Traffic and People on Street) in this class have only
150 frames and 8-bit per color sample. Class B has
five Full HD (1920×1080 pixels) video samples. Class
C has four 480p samples. Class D has four 416×240
samples. Class E has three 720p video samples, being
all of them at 60fps. The sequences of this class have
a few movements. Class F have four sequences with
different resolutions.
Although the common test conditions [37] define 22, 27, 32 and 37 as the quantization parameter
(QP) values to be used, we have followed the BD-Rate
proposal document [40], which defines the use of 16,
20, 24 and 28 as QP values.
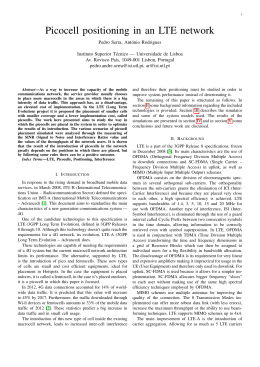
Table II gives the average BD-Rate loss (%) for
each coding class defined in JCTVC-K1100 [37]. Class
A, whose rate-distortion (RD) curves are shown in Fig.
3 for each of its video samples, presents the lowest 2:1
Table II. Average BD-Rate (%) for Each Class in a Given
Subsampling (2:1 or 4:1) with Relation to Full Sampling.
Class
2:1
4:1
A
2.51
6.60
B
5.44
12.33
C
5.23
10.15
D
6.77
12.71
E
9.86
22.47
F
12.80
22.89
Figure 3. Rate-distortion (RD) curves of Class A video samples. Once such curves are all according to recommendation VCEG-AI11 [36],
each vertical line indicates a change of 5.6% in bitrate and each horizon tal line represents a change of 1/4 dB in PSNR.
Journal of Integrated Circuits and Systems 2014; v.9 / n.1:48-59
51
Analysis of Pel Decimation and Technology Choices to Reduce Energy on SAD Calculation
Seidel, Bräscher, Moraes, Monteiro & Güntzel
losses with just 2.51%. This result corroborates the use
of subsampling at high spatial resolution. Belonging to
this class, the Steam Locomotive Train test sequence
showed even coding-efficiency gain of 4.64% (2:1)
and 6.35% (4:1). This can be seen in Fig. 3(d), where
for higher bitrates the PSNR of a subsampled coding
was increased over the result of a full sampling coding.
Certainly it was a rather unexpected result, but Pierre
[41] shows that bit-depth increase provides greater accuracy for prediction processes involved during
video coding, like compensation, intra prediction and
in-loop filtering. These improvements are highest in
shallow textures and low noise. Thus, it explains in part
the difference between Steam Locomotive Train and
Nebuta (Fig. 3(c)), which presented bitrate losses of
only 0.41% (2:1) and 1.38% (4:1). The remaining sequences in class A showed an increase of ~6% (2:1)
and ~14% (4:1) in bitrate.
Classes B and C have the same overall performance with BQTerrace and PartyScene samples showing minimal losses in both subsampling cases. Class
D outliner is RaceHorses with 16.53% and 25.22%.
This result is explained by the high motion content in
this sequence. Other sequences in this class have losses
from 1.31% until 7.15% (2:1) and from 5.72% until
12.93% (4:1). Class F has BasketballDrillText as outliner with 2.01% and 5.94%. The average of this class
increases to 16.39% (2:1) and 28.55% (4:1) without
this outliner.
Although the sampling pattern is not defined in
the pel decimation algorithm, there is a tendency on
using regular ones as those depicted in Fig. 4. Due to
its effectiveness in reducing the number of calculations
and high regularity, pel decimation reveals itself very
appropriate for VLSI implementation.
urable architecture, referred to as fixed, was tailored to
full sampling only. For its design, we employed a fully
combinational datapath as such topology was pointed out by Walter and collaborators as the most energy
efficient one. This way, the fixed architecture’s datapath was tuned to operate with maximum parallelism
considering only full sampling. A similar approach is
presented in [42], where specific fixed architectures are
presented for sampling ratios other than 1:1.
As shown by Walter and collaborators, the most
energy-efficient SAD architectures use less registers
and higher degree of parallelism. Considering a 4×4
pixel block, the best choice in terms of energy efficiency is the fully combinational architecture, which
processes 16 pixels of each block in parallel, as already
adopted for the fixed architecture. But when designing a configurable architecture there are two smaller
block resolutions to take into account in addition to
full sampling: one with eight pixels, for pel decimation 2:1 and another one with only four pixels, for
pel decimation 4:1. In the latter case there are only
four parallel inputs (for each block) to maximize the
energy efficiency (minimize energy consumption per
operation). Having no small resolution cases, the architecture with four parallel inputs became the most
suitable for minimizing the energy consumption when
applying the maximum subsampling. A 12-bit output
register must also be added along with an extra adder
to the combinational SAD tree, as shown in Fig. 5. In
III. SAD CONFIGURABLE ARCHITECTURE
We have designed two architectures for 4x4 pixel
blocks SAD calculation: a configurable and a non-configurable one. The configurable architecture, referred
to as conf, is able to compute the SAD either using all
4×4 input pixels of both blocks (i.e., full sampling)
or by applying one among the three sampling ratios
showed in Fig. 4(a)-4(c). On contrary, the non-config-
Figure 4. Full sampling (1:1) and examples of 2:1, 4:1 and 8:1 pel
decimation common patterns. The filled circles are used for the
SAD calculation. Adapted from [34].
52
Figure 5. SAD datapath view.
Journal of Integrated Circuits and Systems 2014; v.9 / n.1:48-59
Analysis of Pel Decimation and Technology Choices to Reduce Energy on SAD Calculation
Seidel, Bräscher, Moraes, Monteiro & Güntzel
such datapath, the configurability is achieved by stopping the SAD accumulation earlier.
Specific Finite State Machines (FSMs) were
designed to control the datapaths of conf and fixed, as
shown in Fig. 6. Concerning the conf architecture (Fig.
6(a)), each time state
CALC is executed, four pixels of each block
(original and candidate, as in Equation 1) are processed. Thus, when operating in full sampling mode,
the SAD of all 16 pixels requires four executions of
state CALC. Signal zero indicates the fourth execution
of CALC and the FSM then changes to state DONE.
For the fixed architectures (Fig. 6(b)), the CALC state
is always executed only once, and all pixels are processed, according to subsampling ratio of the architecture. Hence, states LOAD (architecture config) and
DONE (both architectures) are synchronization states.
Due to the intensive number of computations,
those architectures require a large number of memory
accesses, which can take too long to be accommodated
within a single clock cycle. And in such cases, for architecture conf, the FSM stays in LOAD state until it
receives a loaded signal, which will enable it to proceed
to CALC state. This is not needed for fixed architectures, once IDLE state have almost equivalent behavior: the next SAD must only begin (init signal) after
all pixels are available at the correct inputs. For both
FSMs, DONE state waits for an acknowledge signal
(ack) from the ME control.
Ideally, the 2:1 and 4:1 pel decimation ratios
could provide 50% and 75% reductions in total execution times, respectively. However, when a single
execution of each of the two synchronization states is
considered, those reductions become 40% and 60%,
respectively. In short, when using pel decimation 2:1
the speedup with respect to full sampling is 40%,
whereas pel decimation 4:1 results in 33% of speedup
with respect to pel decimation 2:1. In comparison to
the full sampling, pel decimation 4:1 results in 60% of
Figure 6. Finite State Machines (FSMs) for configurable and fixed
architectures. The first presents its configurability through the number of executions of states LOAD and CALC. On the other hand,
the fixed architecture obtain the SAD at once during state CALC.
Journal of Integrated Circuits and Systems 2014; v.9 / n.1:48-59
speedup. Those proportions are kept when considering
energy efficiency, as presented in Section IV.
As already mentioned, it is important to consider access times of a coupled memory when designing
low power systems. Most video coding systems use a
memory hierarchy composed by an external DRAM
(to store the video frames) and internal SRAMs
(usually to store the SA) [43], [44]. In [45]-[47] it
is shown that current SRAM memories, even in low
power mode, have access times in the range of 0.4ns
to 3.4ns. Also, their power consumption vary greatly
in accordance with access times. A specialized sample
driver should run at least with double frequency than
SAD tree to maximize energy efficiency. This driver
aggregates data for the SAD calculation in accordance
with a subsampling pattern and ratio. Considering the
3.4ns access time of the slower low power memory,
the recommended frequency for the considered conf
SAD architecture should be smaller than 147 MHz.
For maximum throughput the fastest memory should
be used, and the maximum frequency of the conf SAD
architecture should be less than 1.25 GHz.
IV. SYNTHESIS
The fixed and conf SAD architectures were
described in Verilog and logically synthesized with
Synopsys Design Compiler (DC) [48] for 90nm,
65nm and 45nm TSMC standard cell libraries for two
operation/threshold voltages, nominal (“NN”) and
Low-Vdd/High-Vt (“LH”), and for two operation frequencies, target (“tar”) and maximum (“max”). The
resulting 24 experiments are depicted in Fig. 7, where
each cube is a representation of all synthesis configurations in a given node (90nm, 65nm and 45nm); In
the cubes’ bases are all maximum throughput (max)
configurations, while in the cubes’ upper sides are all
target throughput (tar) configurations; The west sides
of each cube represents the nominal voltage (NN) syntheses, whereas the east sides represents the Low-Vdd/
High-Vt (LH) syntheses; Finally, the frontal faces are
experiments using the fixed architecture, whereas the
cubes’ backs are the experiments using the configurable
architecture (conf). The enumeration of all experiments
Figure 7. Representation of the four dimensional experimental
setup, totalizing 24 syntheses.
53
Analysis of Pel Decimation and Technology Choices to Reduce Energy on SAD Calculation
Seidel, Bräscher, Moraes, Monteiro & Güntzel
(e1 to e24) will be further followed when presenting
the synthesis results.
All syntheses were constrained as follows. The
input and output delays were conservatively limited to
60% of the clock period. The maximum primary input
capacitance was set to 10 times a 2-input AND gate
whereas the maximum primary output capacitance was
set to 30 times a 2-input AND gate. To obtain realistic timing, area and power estimates we have used
Synopsys DC in the so-called Topographical mode,
which, according to its developer manual [49], has
a tight correlation with post-layout timing, area and
power.
The devised target throughput was 1 million
macroblock/s. Such throughput is the same considered
in [30]-[32], claimed as enough to encode a 1080p video with 30fps. The maximum throughput corresponds
to the maximum one an architecture can achieve when
synthesized for a given technology node and a given
operation voltage with no timing violations.
Fig. 8 shows the synthesis and simulation flow.
For each architecture a testbench was also described in
Verilog, having in mind two purposes: validate the architecture and obtain the switching activity file (SAIF)
for each synthesized netlist. To obtain realistic vectors
to simulate with Synopsys VCS [50] we have run the
x264 encoder with full HD sequence “Pedestrian Area”
[19]. Although a total of 651,359,478 4×4 SAD vectors were generated, we applied only 1 million vectors
to limit the simulation runtime. For each architecture
one specific handler was programmed in C to interface
between the vector file and the Verilog testbench.
A. Synthesis Results
Fig. 9 shows the area results for both conf and
fixed SAD architectures. It is possible to observe that,
in all experiments, circuits synthesized for the target
throughput are on average 45.73% smaller than those
synthesized for maximum throughput (type of comparison marked as “A” in Fig. 9). This is because the
target throughput is smaller than any achievable maximum throughput (shown in Tables III and IV) and
thus, the critical delay constraint for target is met by
using slower cells (i.e., cells with lower drive capabilities), which are smaller than their faster counterparts.
Comparing NN and LH (marked as “B” in
Fig. 9) for target throughput, we observed that the
syntheses for LH have led to almost the same area
(~0.2%) for all technologies and architectures, whereas for maximum throughput syntheses, LH resulted in
area increases of 1.82% (e3-4), 0.71% (e7-8), 5.97%
(e11-12), 15.61% (e15-16), 5.62% (e19-20), 3.10%
(e23-24). Broadly speaking, such area increases are due
to the fact that cells in LH are slower than their NN
equivalents and thus, faster LH cells (which are larger)
must be employed to meet the critical delay constraints.
Also, transformations such as logic duplication may
be employed in the synthesis to reduce the fanout of
Figure 9. Area results for both architectures. The results are
organized as pointed in Fig. 7. Three types of comparisons were
made, as illustrated by the arrows for the 90nm technology: A Throughput; B - Supply and Threshold Voltage; C - Architecture.
Table III. Maximum Frequencies (MHz), Throughput (Mblock/s)
and Period Degradation (%) for Fixed Architecture.
NN
LH
degr.(%)
90nm
699.45/14.57
504.93/10.52
27.81
65nm
1174.31/24.46
941.18/19.61
19.85
45nm
1454.55/30.30
1094.02/22.79
24.79
Table IV. Maximum Frequencies (MHz), Throughput (Mblock/s)
and Period Degradation (%) for Configurable Architecture.
Figure 8. Synthesis and simulation flow executed for each
designed architecture.
54
NN
LH
degr.(%)
90nm
867.80/5.42
651.40/4.07
24.94
65nm
1514.79/9.47
1261.08/7.88
16.75
45nm
1882.35/11.76
1414.36/8.84
24.86
Journal of Integrated Circuits and Systems 2014; v.9 / n.1:48-59
Analysis of Pel Decimation and Technology Choices to Reduce Energy on SAD Calculation
Seidel, Bräscher, Moraes, Monteiro & Güntzel
gates. Hence, concerning maximum throughput syntheses, the use of LH resulted in area increase for all
technologies, with the 65nm technology exhibiting the
largest area increase.
The fact that each circuit version has a specific
maximum frequency makes a direct comparison between different technologies very difficult. However,
by carefully analyzing Table IV one can observe that
65nm is the case with the highest maximum frequency improvement with respect to the immediately older
technology (90nm, in this case). This indicates that the
synthesis tool was able to better explore the solution
space due to specific features of the conf architecture
and of the 65nm library and hence, the synthesis for
maximum throughput with LH for 65nm resulted in
the least maximum frequency degradation (16.75%),
calculated by using Equation 2, but at the cost of a
15.61% (e15-16) area increase, the largest among all
LH syntheses.
Figure 10. Total power results.
(2)
On the one hand, considering only the SAD
datapath, it would be expected an area increase of
almost 4x, once the fixed architecture datapath must
process four times as many pixels as the conf datapath. Furthermore, the fixed datapath has longer critical paths demanding greater efforts (and larger logic
gates) in order to achieve the frequency constraints.
On the other hand, the conf architecture needs a counter, a comparison unit and more complex logic in order
to control the execution of the algorithm. Therefore,
the results showed an average increase of 230.75%
(marked as “C” in Fig. 9) in fixed architecture area
with respect to conf, thus showing the impact of extra
control complexity as well as the advantage of reducing the adder tree. It should be remarked that both
architectures presented similar behavior throughout
the synthesis space, where the ratio of fixed area to the
configurable area is limited between 203.28% (e1923) and 257.60% (e11-15), having its standard deviation of 3.71%.
Fig. 10 shows the absolute values of total power for both SAD architectures, whereas Fig. 11 shows
dynamic and static power as percentages of total power. From Fig. 11 one observe that dynamic power is
dominant for all cases and therefore, the total power
is highly correlated with timing constraints. As long
as the frequency of target throughput is at least four
times and ten times smaller than the smallest maximum throughput frequency of conf and fixed architectures, respectively, it is expected that circuits for target
throughput consume significantly less power than circuits for maximum throughput.
Considering the syntheses for target throughJournal of Integrated Circuits and Systems 2014; v.9 / n.1:48-59
Figure 11. Percentual (%) of dynamic and static power within total
power.
put, slight power reductions were observed when LH
was applied. It is important to notice that while dynamic power is dominant, leakage power is not negligible for 65nm and 45nm synthesized circuits with
target throughput. In those specific cases the increase
in Vt successfully reduced leakage po wer thus contributing to the total power reduction.
Considering the conf architecture, from Fig. 10
it becomes clear that the major benefits of LH were
taken by the maximum throughput syntheses, being
27.25% (e7-8), 8.01% (e15-16) and 24.38% (e2314) the total power reductions for 90nm, 65nm and
45nm technologies, respectively. Nevertheless, one
should remind that LH produced a frequency degradation, as presented in Table IV and thus, the circuit
critical delays are shorter for LH synthesis, which also
contributes to reduce dynamic power. Considering the
fixed architecture, both target and maximum throughputs took almost the same advantage of LH synthesis,
resulting in an average of 23.70% power reduction
with 4.55% standard deviation.
To evaluate the benefits of the conf SAD architecture, it is convenient to analyze the energy efficiency when operating with each of the three possible
sampling modes (1:1, 2:1 and 4:1). Fig. 12(a) and
12(b) show the energy required by target and maximum throughput circuits, respectively, to process a
4×4 pixel block. Such energy values were computed
55
Analysis of Pel Decimation and Technology Choices to Reduce Energy on SAD Calculation
Seidel, Bräscher, Moraes, Monteiro & Güntzel
Figure 12. Energy/block according to architecture and sampling ratio.
by using Equation 3, where T is the clock period (derived either from target or from maximum), C is the
number of cycles to process a block and P is the total
power reported by Synopsys DC after proper simulation.
(3)
Concerning the conf architecture, as detailed
in Section III, the smallest number of clock cycles
required to process a 4×4 pixel block with 1:1, 2:1
or 4:1 sampling ratios are 10, 6 or 4, respectively, assuming a single execution of states IDLE, LOAD and
DONE. Therefore, for any given experiment (synthesized for a combination of frequency, technology and
Vdd/Vt) the energy reductions provided by 2:1 and
4:1 subsamplings with respect to 1:1 (full sampling)
are 40% and 60%, respectively. Such reductions are
easily observed in the graphics of Fig. 12(a) and Fig.
12(b). Analyzing Fig. 12(a), it becomes clear that for
all target throughput syntheses the use of LH brought
energy reductions.
By confronting Fig. 12(a) to Fig. 12(b), it is
possible to see that the target throughput syntheses
of conf are more energy efficient than their maximum
throughput counterparts. The main reason for that
is the low frequency of target (at most four times
smaller than any maximum throughput frequency).
Furthermore, since the period is the same for all target frequency versions (T=6.25ns) and the number of
cycles is C={10, 6, 4} for 1:1, 2:1 and 4:1 sampling
patterns, respectively, any energy reduction/increase
must be a direct consequence of a reduction/increase
in the total power (P) and hence, Fig. 12(a) roughly
repeats the information for target frequency presented
in Fig. 10. This explains the imperceptible energy reductions achieved by LH in 65nm and 45nm and the
energy increase in 90nm.
As shown in Fig. 12(b), the maximum throughput syntheses of conf pay a significant price in energy
and consequently, they could take some advantage of
LH. However, for 90nm a slight energy reduction was
56
observed (~3.08%), once both power and frequency
reduced almost by the same factor. On the other hand,
the power reduction for 65nm was smaller than the
frequency degradation, and thus energy has increased
~10.53%. Finally, for 45nm frequency degradation
and power reduction were practically of the same order, resulting in a negligible energy increase of only
~0.69% which stands for an absolute difference of
only 50fJ/block for 1:1 sampling.
For any technology, subsampling was able to
provide energy reductions that are much more significant than those obtainable by synthesizing with
LH. Such tendency is more prominent for the target
throughput versions, where subsampling is also able
to reduce the static power. Although LH may also
be used in conjunction with pel decimation, the area
overhead cannot be disregarded. On the other hand,
for the future high-resolution video formats, the quality reduction arising from pel decimation tends to be
less perceptible, as explained in Section II. Apart from
that, the user/application may choose between video
encoding quality or energy-savings.
By its turn, in its best execution scenario (assuming a single execution of states IDLE and DONE),
the fixed architecture takes only three clock cycles for
each SAD calculation. Once its period and power are
also different of those achieved by the conf architecture, each case must be carefully analyzed.
For target throughput, the conf architecture is
always more energy-efficient than the fixed architecture, but its relative differences are variable according
to synthesis configuration. The higher difference was
for 90nm/NN, where conf consumes 33.52% less energy than fixed, whilst the smallest difference was for
65nm/LH, with conf consuming 16.91% less energy
than fixed architecture. The latter got the better use of
maximum throughput syntheses.
Whilst conf had worse energy for 90nm at maximum throughput than for target, the fixed architecture had its energy reduced 5%. Moreover, in 45nm
syntheses, apart from supply and threshold voltages
slight variable results, the fixed architecture is more
Journal of Integrated Circuits and Systems 2014; v.9 / n.1:48-59
Analysis of Pel Decimation and Technology Choices to Reduce Energy on SAD Calculation
Seidel, Bräscher, Moraes, Monteiro & Güntzel
energy-efficient than conf (2.32% lower energy/
block). However, looking back to target throughput
results, the conf architecture presents the better results
(5.13pJ/block), even in a direct comparison with fixed
architecture synthesized for maximum throughput
(7.30pJ/block). Thus, the conf architecture is capable
of further reducing energy, in this case until 2.05pJ/
block.
B. Comparison With Related Work
Among the existing related works, those of
Walter [30]-[32] present results for SAD architectures
that were synthesized for TSMC 180nm/NN and IBM
65nm/LH. The specific architectural features of those
works were already addressed in Section II. A fair architectural comparison must use the same synthesis
tool and constraints, which was done by using the
so-called fixed architecture, architecture with the best
results in Walter’s work. On the other hand, a more
direct comparison between our works is presented
in Table V, which shows technology information and
synthesis results (frequency, power and energy) of two
Walter’s architecture synthesis, along with one of our
own (65nm/LH). Both chosen Walter’s architectures
are equivalent of our conf architecture, i.e., the 4-input sequential architecture without pipeline. Also, the
comparison is for the same target throughput. Once
the FSM of the conf SAD architecture has two more
states (to LOAD and to wait to proceed) than Walter’s
architecture, our target frequency should be higher to
achieve the same throughput.
One can notice that the conf architecture operating in full sampling mode presents a larger total power
that of [31]. However, it should be also remarked that
our conf architecture is able to further reduce the energy per block through subsampling (pel decimation),
which is not possible in Walter’s architecture. More specifically, while the architecture of [31] requires 6.48pJ/
block for 1:1 (only available sampling), the conf architecture needs 7.07pJ/block for 2:1 subsampling and
just 4.72pJ/block for 4:1 subsampling, being the latter more energy-efficient than Walter’s. Moreover, our
power and energy figures were obtained through simulation, giving a more realistic dynamic power result.
Table V. Synthesis Comparison with Related Work
Tech.(nm)
NN/LH
Freq. (MHz)
Power (µW)
1:1 (pJ/block)
2:1 (pJ/block)
4:1 (pJ/block)
[30]
TSMC 180
NN
66
1276
76.56
–
–
[31]
IBM 65
LH
66
108
6.48
–
–
OUR 65nm
TSMC 65
LH
160
188.65
11.79
7.07
4.72
Journal of Integrated Circuits and Systems 2014; v.9 / n.1:48-59
V. CONCLUSIONS
Despite its simplicity, the SAD (Sum of Absolute
Differences) plays a key role in video coding. Although
several architectures for computing SAD may be devised, only low power ones are of actual interest to be
integrated in Portable Mobile Devices (PMDs). In this
paper we presented a conf SAD architecture that is able
to process 4x4 pixel block in full sampling and in 2:1
and 4:1 pel decimation.
It was shown that by configuring the presented
architecture in 2:1 and 4:1 pel decimation the energy
spent for each block can be reduced by 40% and 60%
with respect to full sampling, respectively. The highest
energy consumption was 30.28pJ/block and occurred
when the fixed architecture was synthesized for 90nm
and nominal supply voltage (NN) aiming the target
throughput. The lowest energy consumption was
2.05pJ/block and corresponded to the target throughput synthesis of conf architecture for 45nm Low-Vdd/
High-Vt operating with 4:1 subsampling. The 90nm/
NN target throughput fixed architecture synthesis
spends nearly 13.65 times more energy per block than
the conf 45nm target throughput synthesis.
Comparing with [31] e presented conf architecture achieved worse energy results for full sampling
due to its FSM. On the other hand, the presented architecture can be configured to execute 2:1 and 4:1 pel
decimation, the latter being responsible for the most
relevant energy savings, with a small bitrate cost. Also,
by simulating our conf architecture, our energy-figures
are more realistic.
Synthesis results also shown that in some cases
the impact of Low-Vdd/High-Vt for such a simple architecture can provide worse energy efficiency results,
besides the increases in area and manufacture costs.
Finally, the most remarkable is that by using pel decimation 2:1 one can achieve better energy efficiency
than using Low-Vdd/High-Vt and by using pel decimation 4:1 one can have better energy than further
advancing to a smaller and thus more expensive technology.
ACKNOWLEDGEMENTS
This work was partially supported by the
Brazilian Federal Agency for the Support and Evaluation
of Graduate Education (CAPES) and by the Brazilian
Council for Scientific and Technological Development
(CNPq) through “Brazil-IP Project”, undergraduate
research grants and PQ grant 309047/2012-9.
57
Analysis of Pel Decimation and Technology Choices to Reduce Energy on SAD Calculation
Seidel, Bräscher, Moraes, Monteiro & Güntzel
REFERENCES
A. Pathak, Y. C. Hu, and M. Zhang, “Where is the energy
spent inside my app?: Fine grained energy accounting on
smartphones with eprof,” in Proceedings of the 7th ACM
European Conference on Computer Systems, ser. EuroSys
’12. New York, NY, USA: ACM, 2012, pp.29–42.
[1] H. Falaki, R. Mahajan, S. Kandula, D. Lymberopoulos, R.
Govindan, and D. Estrin, “Diversity in smartphone usage,” in
Proceedings of the 8th International Conference on Mobile
Systems, Applications, and Services, ser. MobiSys ’10. New
York, NY, USA: ACM, 2010, pp. 179–194.
[2] C. Shepard, A. Rahmati, C. Tossell, L. Zhong, and P. Kortum,
“Livelab: Measuring wireless networks and smartphone users
in the field,” SIGMETRICS Perform. Eval. Rev., vol. 38, no. 3,
pp. 15–20, Jan. 2011.
[3] F. Bossen, B. Bross, K. Suhring, and D. Flynn, “Hevc
complexity and implementation analysis,” IEEE Trans.
Circuits Syst. Video Technol., vol. 22, no. 12, pp. 1685–1696,
2012.
[4] I. E. G. Richardson, H. 264 and MPEG-4 video compression:
video coding for next-generation multimedia. John Wiley &
Sons Inc, 2003.
[5] P. M. Kuhn, “Fast mpeg-4 motion estimation: Processor
based and flexible vlsi implementations,” The Journal of VLSI
Signal Processing, vol. 23, pp. 67–92, 1999.
[6] I. Seidel, B. G. Moraes, E. Wuerges, and J. L. Güntzel, “Quality
assessment of subsampling patterns for pel decimation
targeting high definition video,” in 2013 IEEE International
Conference on Multimedia and Expo (ICME). IEEE, jul 2013.
[18]Xiph.org, “Xiph.org test media repository,” Available at: http://
media.xiph.org/, 2011.
[19]Z. Chen, P. Zhou, and Y. He, “Fast integer pel and fractional
pel motion estimation for jvt,” Joint Video Team (JVT) of ISO/
IEC MPEG & ITUT VCEG (ISO/IEC JTC1/SC29/WG11 and
ITU-T SG16 Q.6), Awaji Island, Japan, Proposal JVT-F017,
Dec. 2002.
[20]X. Yi, J. Zhang, N. Ling, and W. Shang,
and fractional pel motion estimation for
Team (JVT) of ISO/IEC MPEG & ITU-T
JTC1/SC29/WG11 and ITU-T SG16 Q.6),
Proposal JVT-P021, Jul. 2005.
“Fast integer pel
jvt,” Joint Video
VCEG (ISO/IEC
Poznan, Poland,
[21]A. M. Tourapis, “Enhanced predictive zonal search for single
and multiple frame motion estimation,” pp. 1069–1079, 2002.
[22]L. Merritt, J. Garrett-Glaser, S. Walters, A. Mitrofanov, H.
Gramner, and D. Kang, “Projeto x264,” 2004. [Online].
Available: http://developers.videolan.org/x264.html
[23]JCT-VC, “Hevc test model,” 2013. [Online]. Available: http://
hevc.hhi.fraunhofer.de/
[24]M. Monteiro, I. Seidel, and J. L. Güntzel, “Impacts of sad on
execution time for high definition video codecs,” in Proceedings
of the 29th South Symposium on Microelectronics (SIM).
SBC, May 2014.
[25]T. Chen, S. Chien, Y. Huang, C. Tsai, C. Chen, T. Chen, and
L. Chen, “Analysis and architecture design of an HDTV720p
30 frames/sH.264/AVC encoder,” IEEE Trans. on Circuits and
Systems for Video Technology, vol. 16, no. 6, pp. 673– 688,
jun 2006.
[8] “Vp9.” [Online]. Available: http://www.webmproject.org/vp9/
[26]Z. Liu, Y. Song, M. Shao, S. Li, L. Li, S. Goto, and T. Ikenaga,
“32-Parallel SAD tree hardwired engine for variable block
size motion estimation in HDTV1080P Real-Time encoding
application,” in 2007 IEEE Workshop on Signal Processing
Systems. IEEE, oct 2007, pp. 675–680.
[9] H.-K. Jung, C.-P. Hong, J.-S. Choi, and Y.-H. Ha, “A vlsi
architecture for the alternative subsampling-based block
matching algorithm,” IEEE Trans. on Consumer Electronics,
vol. 41, no. 2, pp. 239–247, may 1995.
[27]J. Vanne, E. Aho, T. D. Hamalainen, and K. Kuusilinna, “A
high performance sum of absolute difference implementation
for motion estimation,” IEEE Trans. on Circuits and Systems
for Video Technology, vol. 16, no. 7, pp. 876–883, jul 2006.
[10]Y.-W. Huang, S.-Y. Chien, B.-Y. Hsieh, and L.-G. Chen,
An efficient and low power architecture design for motion
estimation using global elimination algorithm. IEEE, may
2002, vol. 3, pp. III–3120–III–3123.
[28]L. Yufei, F. Xiubo, and W. Qin, “A High-Performance low cost
SAD architecture for video coding,” IEEE Trans. on Consumer
Electronics, vol. 53, no. 2, pp. 535–541, may 2007.
[7] K. Ugur et al., “Low complexity video coding and the emerging
HEVC standard,” in Picture Coding Symposium (PCS). IEEE,
Dec. 2010, pp. 474–477.
[11]K. Lee, H. Chin, H. Hsu, and C. Jen, “QME: an efficient
subsampling based block matching algorithm for motion
estimation,” in Proceedings of the 2004 International
Symposium on Circuits and Systems, 2004. ISCAS ’04, vol.
2. IEEE, May 2004, pp. II– 305–8 Vol.2.
[12]M. Keating, D. Flynn, R. C. Aitken, A. Gibbons, and K. Shi,
Low Power Methodology Manual - for System-on-Chip
Design. Springer, 2007.
[13]M.-J. Chen, L.-G. Chen, and T.-D. Chiueh, “One-dimensional
full search motion estimation algorithm for video coding,”
Circuits and Systems for Video Technology, IEEE Transactions
on, vol. 4, no. 5, pp. 504–509, Oct 1994.
[14]Gprof, “GNU binutils,” 2007. [Online]. Available: http://www.
gnu.org/software/binutils/
[15]J. Osier, “GNU Gprof – manual,” 1993. [Online]. Available:
http://www.cs.utah.edu/dept/old/texinfo/as/gprof.html
[16]ITU-T, “H.264 corrigendum 1,” jan 2009.
[17]JVT, “Jm joint video team reference software v18.5,” 2013.
[Online]. Available: http://iphome.hhi.de/suehring/tml/
58
[29]F. L. Walter, C. M. Diniz, and S. Bampi, “Synthesis and
comparison of low-power high-throughput architectures
for SAD calculation,” in 2011 IEEE Second Latin American
Symposium on Circuits and Systems (LASCAS). IEEE, feb
2011, pp. 1–4.
[30]F. Walter and S. Bampi, “Synthesis and comparison of
low-power architectures for sad calculation,” 26th South
Symposium on Microelectronics, pp. 45 – 48, Abril 2011.
[31]F. Walter, C. Diniz, and S. Bampi, “Synthesis and comparison of
low-power high-throughput architectures for sad calculation,”
Analog Integrated Circuits and Signal Processing, vol. 73, no.
3, pp. 873–884, 2012.
[32]B. Liu and A. Zaccarin, “New fast algorithms for the estimation
of block motion vectors,” IEEE Trans. on Circuits and Systems
for Video Technology, vol. 3, no. 2, pp. 148–157, Apr. 1993.
[33]M. Porto et al., “High throughput hardware architecture for
motion estimation with 4:1 pel subsampling targeting digital
television applications,” in Proceedings of the 2nd Pacific
Rim conference on Advances in image and video technology,
ser. PSIVT’07. Berlin, Heidelberg: Springer-Verlag, 2007, pp.
36–47.
Journal of Integrated Circuits and Systems 2014; v.9 / n.1:48-59
Analysis of Pel Decimation and Technology Choices to Reduce Energy on SAD Calculation
Seidel, Bräscher, Moraes, Monteiro & Güntzel
[34]Z. Wang, A. C. Bovik, H. R. Sheikh, and E. P. Simoncelli,
“Image quality assessment: From error visibility to structural
similarity,” IEEE Trans. on Image Processing vol. 13 no. 4, p.
13, apr 2004.
[42]T.-M. Liu and C.-Y. Lee, “Design of an h.264/avc decoder
with memory hierarchy and line-pixel-lookahead,” Journal of
Signal Processing Systems, vol. 50, no. 1, pp. 69–80, 2008.
[35]G. Bjøntegaard, “Improvements of the bd-psnr model,” Video
Coding Experts Group (VCEG), Berlin, Germany, Document
VCEG-AI11, Jul. 2008.
[43]A. S. B. Lopes, I. S. Silva, and L. V. Agostini, “A memory
hierarchy model based on data reuse for full-search motion
estimation on highdefinition digital videos,” Int. J. Reconfig.
Comput., vol. 2012, pp. 2:2–2:2, Jan. 2012.
[36]F. Bossen, “Common test conditions and software reference
configurations,” Joint Collaborative Team on Video Coding
(JCT-VC) of ITUT SG16 WP3 and ISO/IEC JTC1/SC29/
WG11, Shanghai, Document JCTVC-K1100, Oct. 2012.
[44]K. Zhang et al., “A fully synchronized, pipelined, and reconfigurable 50 mb sram on 90 nm cmos technology for logic
applications,” in Symposium on VLSI Circuits, 2003. Digest of
Technical Papers., june 2003, pp. 253 – 254.
[37]A. D. nas, A. Malamy, B. Olofsson, A. Ichigaya, S. Sakaida,
S. Pejhan, L. Haglund, A. Luthre, P. Andrivon, P. Bordes, T.
Jones, X. Ducloux, P. Gendron, M. Mrak, A. Cofler, J.-M.
Thiesse, A. Rodriguez, P. Sunna, and I. Laksono, “On a 10bit consumer-oriented profile in high efficiency video coding
(hevc),” Joint Collaborative Team on Video Coding (JCTVC) of
ITU-T SG16 WP3 and ISO/IEC JTC1/SC29/WG11, Shanghai,
Document JCTVC-K0109r6, Oct. 2012.
[45]G. Fukano et al., “A 65nm 1Mb SRAM macro with dynamic
voltage scaling in dual power supply scheme for low power
SoCs,” in Non-Volatile Semiconductor Memory Workshop,
2008 and 2008 International Conference on Memory
Technology and Design. NVSMW/ICMTD 2008. Joint, May
2008, pp. 97 –98.
[38]ITU-T, “Parameter values for ultra-high definition television
systems for production and international programme
exchange,” International Telecommunication Union, Geneva,
Recommendation BT.2020, Aug. 2012.
[39]G. Bjøntegaard, “Improvements of the bd-psnr model,”
Video Coding Experts Group (VCEG), Austin, Texas, USA,
Document VCEG-M33, Apr. 2001.
[40]P. Larbier, “Using 10-bit AVC/H.264 encoding with 4:2:2 for
broadcast contribution,” Las Vegas Convention Center, Las
Vegas, Nevada USA, Apr. 2011. [Online]. Available: http://
extranet.ateme.com/download.php?file=1114
[46]M. Qazi, K. Stawiasz, L. Chang, and A. Chandrakasan, “A
512kb 8T SRAM macro operating down to 0.57 V with an
AC-Coupled sense amplifier and embedded data-retentionvoltage sensor in 45 nm SOI CMOS,” IEEE Journal of SolidState Circuits, vol. 46, no. 1, pp. 85–96, Jan. 2011.
[47]Synopsys, “Synopsys design compiler, version F-2011.09SP5-2.” 2011.
[48]——, “Synopsys’s design compiler user guide, version
C-2009.06.” 2009.
[49]——, “Synopsys VCS, version G-2012.09.” 2012.
[41]I. Seidel, A. B. Bräscher, M. Monteiro, and J. L. Güntzel,
“Exploring pel decimation to trade off between energy
and quality in video coding,” in 2014 IEEE Latin American
Symposium on Circuits and Systems (LASCAS). IEEE, fev
2014.
Journal of Integrated Circuits and Systems 2014; v.9 / n.1:48-59
59
Download