Studies in Scientometrics I
Transience and Continuance in Scientific Authorship
Derek de Solla Price
Suha Gürsey
Yale University
ABSTRACT
Investigation of the transience / continuance
phenomenon occurring at a research front. The
annual output of authors in a random sample
derived from seven years data from Science
Citation Index and Who is publishing in Science
was analysed. In the whole period (1964-1970)
there are 281 transient authors and 19 continuant
authors, for a total population of 506 authors. By
deriving a quantitative model for the author flow
pattern analysis, it was shown that there is a birth
rate (annual recruitment) and a death rate
(annual termination) which overlap to give an
infant mortality (transience). By refining the
model, it was possible to define a core of
continuant authors, which amounts to 20% of those
publishing. The transient authors constitute
22% of the annual population and 2/3 of the
newcomers to publication. The other identified
components of a scientific community are the
recruits, terminators, non-core publishing
continuants and non-publishing continuants.
These demographic properties are clearly
associated with the lowest and highest rates of
authors' productivity, the distributions of which
folkw Lotka's and Price's laws with great
regularity. Thus it was possible to derive a
lifetime expectancy at the research front which
will be proportional to the time of active
publication. On one end of the scale there is a
majority of authors with a minimum life expectancy
and a low average productivity (75% of the
authors produce 25% of the papers); at the opposite
extreme there are authors in the permanent
nucleus (20%) with less average mortality and
greater average productivity (more than half of the
papers) All this is a result of the positive
feedback or Mathew Principle in scientific
publication. This situation seems so intrinsic that
it must be regarded at the way in which society
has adjusted its institutional structure to fit
the cloth of scientific productivity and demography.
Ci. Inf., Rio de Janeiro, 4(1):27-40, 1975
Many of the richest areas for research in the
sociology of science depend upon some
understanding of what may be called the actuarial
statistics of the scientific community. One needs
to know the dynamical processes which govern
emergence, survival and disappearance within that
community. These determine the structure of the
group by age, status, productivity, reputation and
professional ties. Such studies have many of the
same strengths and limitations as acturial methods
in demography and life insurance.
Useful calculations may be made about
the population in the large, but the bearing
of the life of any individual remains statistical
rather than causal. The purpose of this
investigation is to uncover the facts and
regularities which will require some theoretical
explanation. Undoubtedly the most important
phenomenon, hitherto not well recognized, is that
at any given time a large number of those working
at the research front are transients_whose_names
have never appeared before and will not appear
again in the record. The point has obvious
application to the natural history of scientific
careers, and it is also of fundamental importance to
the analysis of manpower data in the sciences,
since only part of the research labor force can be
considered as stable.
Previous work in this areas has usually been based
upon hand or machine counts that have been
limited to a single nation, a scientific specialty, or
just one journal or scientific institution. The
results have always been of questionable
generality because of possible strong idiosyncracies
of these special groups and also because of the
large general movement that exists across the
boundaries of such groups as people change jobs
and migrate through fields. We have been
fortunate in having at our disposal data emerging
as a by-product from the machine handling of a
uniquely comprehensive and worldwide coverage of
the literature in all fields of basic and applied
science. For this reason the results are relatively
free of local idiosyncracies and are of general
applicability to the scientific community.
27
DEREK DE SOLLA PRICE & SUHA GÜRSEY
The data bank for this study was based upon
volumes published by the Institute for Scientific
Information, including several years of output of
the Science Citation Index, with its indexes of
Source Authors and Cited Authors, and the annual
volumes of Who is Publishing, in Science which
is derived from the weekly editions of Current
Contents." These indexes cover all the principal
journals. The criterion for inclusion is that of
usage by the scientific community; many known
journals are excluded, particularly local and
domestic periodicals, but only because scientists do
not cite them at all in subsequent research
publication.
To manipulate the entire data bank, derived from
more than 2000 journals and amounting to millions
of citations each year would have been far too
costly and complicated and would Lave excluded
any possibility of hand collations and
editing which is essencial in work of this kind. We
therefore devised the simple technique of
generating a small but random intercomparable
sample of all indexes by taking only those authors
whose names fell into a limited slice of the
alphabetic listing. The range was chosen after
several trials to begin with a person whose work
was known to us and to extend for about 100
names in the first index covered. We were careful
that the selection did not happen to include, so
far as could be detected, any wildly pathological
bias toward authors of any particular national or
linguistic group. It contained no wellknown
family active in science, nor any common surname
that would pick up several different individuals for
a single set of initials. Our final selection was
the slice from Pah A to Palecek M which
corresponds to about 0.22 =/= 0.02 percent of the
entire author index in any of the many lists
searched. By studying in detail a group of about
500 individuais drawn in this way from indexes
dating from the period 1964 — 1970 we were
therefore sampling a total population of a little
more than a million scientific authors in all the
countries of the world. This is a size consistent
with most known estimates of the total world
population of all research scientists and engineers.
The names of every author on each paper are fed
into the Source Indexes, so each annual record
contains a listing of the scientific population, new
and old, whose names are on the bylines of all
papers published during the previous year. The
total number of different names so recorded in
the seven years was 506, and the annual totals
increased in the usual exponential fashion, starting
from 96 in 1964 and almost doubling to 187 in 1970.
It should be noted that this doubling in seven
years (a growth rate of 10% per annum) is only
partly due to actual increase in the scientific
population; probably some 3 or 4% of the
We should like to express our deep gratitude to
Dr. E. Garfield and the officers and staff of I.S.I,
for their very effective long standing cooperation
and technical help in this and related projects.
The investigation was supported under Grant
GS-39830X from the National Science Foundation.
Ci. Inf., Rio de Janeiro, 4(1):27-40, 1975
28
STUDIES IN SCIENTOMETRICS I
TABLE
64
65
66
67
68
69
70
64/65
64/66
64/67
64/68
64/69
64/70
65/66
65/67
65/68
65/69
65/70
66/67
66/68
66/69
66/70
67/68
67/69
67/70
68/69
68/70
69/70
I
25
32
33
41
42
49
59
3
3
2
1
4
2
2
2
1
4
4
2
9
7
7
5
8
4
16
64/65/66
64/65/67
64/65/68
64/65/69
64/65/70
64/66/67
64/66/68
64/66/69
64/66/70
64/67/68
64/67/69
64/67/70
64/68/69
64/68/70
64/69/70
65/66/67
65/66/68
65/66/69
65/66/70
65/67/68
65/67/69
65/67/70
65/68/69
65/68/70
65/69/70
66/67/68
66/67/69
66/67/70
66/68/69
66/68/70
66/69/70
67/68/69
67/68/70
67/69/70
68/69/70
Ci. Inf., Rio de Janeiro, 4(1):27-40, 1975
1
4
2
1
1
1
1
1
3
1
2
2
1
3
2
2
1
1
4
6
1
2
6
64/65/66/67
64/65/66/68
64/65/66/69
64/65/66/70
64/65/67/68
64/65/67/69
64/65/67/70
64/65/68/69
64/65/68/70
64/65/69/70
64/66/67/68
64/66/67/69
64/66/67/70
64/66/68/69
64/66/68/70
64/66/69/70
64/67/68/69
64/67/68/70
64/67/69/70
64/68/69/70
65/66/67/68
65/66/67/69
65/66/67/70
65/66/68/69
65/66/68/70
65/66/69/70
65/67/68/69
65/67/68/70
65/67/69/70
65/68/69/70
66/67/68/69
66/67/68/70
66/67/69/70
66/68/69/70
67/68/69/70
2
1
2
1
1
1
1
2
2
1
64/65/66/67/68
64/65/66/67/69
64/65/66/67/70
64/65/66/68/69
64/65/66/68/70
64/65/66/69/70
64/65/67/68/69
64/65/67/68/70
64/65/67/69/70
64/65/68/69/70
64/66/67/68/69
64/66/67/68/70
64/66/67/69/70
64/66/68/69/70
64/67/68/69/70
65/66/67/68/69
65/66/67/68/70
65/66/67/69/70
65/66/68/69/70
65/67/68/69/70
66/67/68/69/70
3
1
1
1
64/65/66/67/68/69
64/65/66/67/68/70
64/65/66/67/69/70
64/65/66/68/69/70
64/65/67/68/69/70
64/66/67/68/69/70
65/66/67/68/69/70
3
64/65/66/67/68/69/70
3
1
1
1
1
1
2
1
2
1
2
4
2
8
1
1
1
2
2
2
19
1
2
6
29
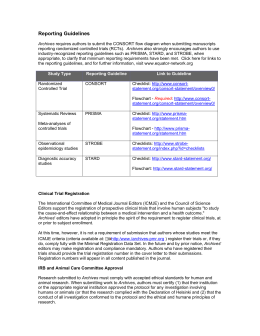
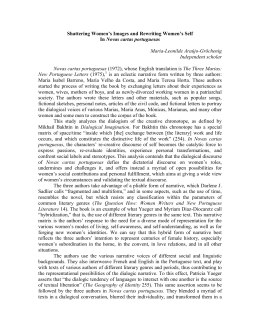
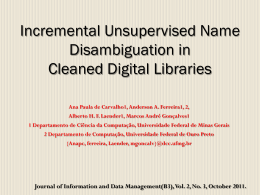
Figure 1.
Flow
of source authors through seven consecutive annual indexes
STUDIES IN SCIENTOMETBICS I
Ci. Inf., Rio de Janeiro, 4(1):27-40, 1975
31
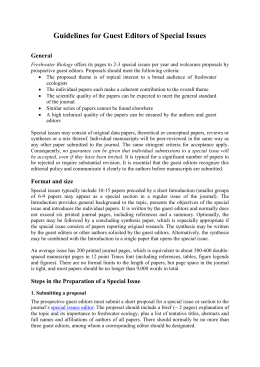
DEREK DE SOLLA PRICE & SUHA GÜRSEY
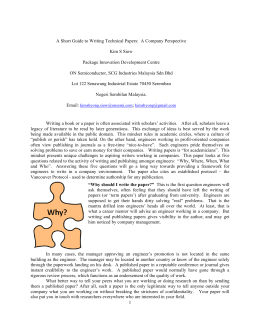
Authors publishing in 1967
Ci. Inf., Rio de Janeiro, 4(1):27-40, 1975
32
DEREK DE SOLLA PRICE & SUHA GÜRSEY
growth is due to increased coverage of the I.S.I.
services as journals were added to the source list.
The raw data emerging from this study are
displayed in Table I which shows the number of
authors who were listed in each of the possible
combinations of years. It can be seen immediately
that there is a certain tendency towards extreme
behavior; authors seem to lean towards either
publishing in only one single, year, or publishing
in all available years. The results can also be
summarized in a diagram which shows for each
year the number of authors publishing in that year,
the contribution to this by authors publishing
before and not before, and the number of authors
who publish subsequently and not subsequently.
Figure I shows this flow, the authors being broken
down into those who publish in adjacent years,
and those who skip a year or more before or after
the year of publication in question. The figure
also shows separately those who fall in the category
of not having been recorded before and not
subsequently.
In each year studied those in this latter category
of authors who have never been heard of before
and never are heard of again amount to about 25%
of those recorded for that year. They are
surprisingly numerous and, of course, the
proportion of them in the total population increases
with the span of years considered because the
rest of the authors' names occur in two or more
years. In the whole period of seven years there
are 281 names that occur in a single source index
out of the 506 authors listed, a fraction of 56% of
the population. We shall call this phenomenon
transience and such authors transients. It is
important to note that these cannot be people who
have migrated to a different field of research, for
the corpus includes all published fields of science
and technology, all institutions and countries.
Ci. Inf., Rio de Janeiro, 4(1):27-40, 1975
The opposite behavior pattern to transience, that of
authors whose names tend to appear year after
year in every index of the record, we shall call
continuance. For the seven year period there are
19 such authors, and though they are but a small
proportion of the total population of authors for
all those years together, they constitute 20% of the
pool of authors recorded at the beginning of the
period in 1964. Such strongly continuing authors
are clearly those who normally publish much more
than a single paper a year so that their chance of
skipping a year is very small. There must be many
more whose continuance is slightly less because
of a somewhat smaller production rate or an
occasional subbatical or period of work on a book
or extensive monograph.
By the same token we shall need to weaken the
definition of transience, for there must be some
otherwise transient publishers whose single research
front production happens to appear in two or even
three papers that fate and publishing time-lags
decree shall come out in journals falling into two
adjacent annual gatherings. The basic fact is
however that nearly half the authors on an annual
index are either strongly transient (25%) or
strongly continuant (20%) so that they will continue
to publish each year for the next six years. The
remaining 55% of the annual author list consists
partly of those who are more weakly transient or
continuant, and partly of those who are newly
recruited or newly terminated from the continuing
community.
To derive a better quantitative analysis of the
author flow pattern it is strategic to base an initial
approximation upon the central year of the series,
1967, for which one has records that can detect
authors whose continuance is so weak that they
reappear after as much as two consecutive years of
skipping publication. The general pattern of flow
33
STUDIES IN SCIENTOMETRICS I
is shown in Figure 2. The transients account for
25% of the population, or to put it into
demographic terms, there is a 25% infant mortality,
over and above a birth rate of 20% and a death
rate of 10%. To put it another way, there is a
total birth rate of 45% and a death rate of 35% which
overlap to give the transients. Just over half the
authors in this year have been previously recorded,
41% in the immediately prior year, another 11%
after skipping one year, and 3% after a skip of two
years, the total being 55% but these 10% terminate
their publishing in this year so that only 45% of the
previously established authors will continue. These
are augmented by 20% of the population who are
new recruits, and the resultant 65% go on to
publish, 46% of them in the next year, 13% after a
gap of one year, and another 6% after a two
year gap.
To emphasize the magnitude of the transience
phenomenon, it may be noted that in this first
approximation they constitute 25% out of a total
birthrate of 45%, a fraction of 0.56 of all births;
similarly they are 0.71 of all the deathrate. These
figures must however be modified a little because
there exist small groups of authors who publish
again after skipping more than two years of index.
The effect of this is that a small amount of those
who were here considered in the total birthrate
must in fact be reckoned as authors reappearing
after skipping three or more years, and
correspondingly part of the assumed
total deathrate is due to authors who will
reappear after a gap of three or more years.
Fortunately, skipping is a relatively uncommon
phenomenon. For the group of authors publishing
in 1967, the data summarized in Table II shows
that 66% had a continuous record of publication, a
further 22% had a single gap, and 10% had two gaps,
leaving only 2% with a gap of three or more
TABLE III
a) Of the 96 authors publishing in 1964
25 do not publish again
48 proceed with no skips to
14 skip 1 year, publish in
5
2 years
2
3 years
1
4 years
1
5 years
26
50
15
5
2
1
1
1965
1966
1967
1968
1969
1970
b) Of the 187 authors publishing in 1970
59 have not published before
90 published with no skips in 1969
13 skiped 1 year, published in 1968
10
2 years
1967
12
3 years
1966
2
4 years
1965
1
5 years
1964
c)
Summary of data %
Not publishing again
Publish next year
1 skip
2
3
4
5
1964
& after
26
50
15
5
2
1
1
Ci. Inf., Rio de Janeiro, 4(1):27-40, 1975
32
48
7
5
6
1
1
1970
& before
32
48
7
5
6
1
1
1967
& before
45
41
11
3
1967
& after
35
46
13
6
34
DEREK DE SOLLA PRICE & SUHA GÜRSEY
years in the entire interval of seven years.
Since in fact a full seven year period was studied
it is possible to get data on larger gaps directly by
starting from the first and the last years in the
series. The results are shown in Table III.
Clearly the frequency of long gap records is so low
that it is heavily influenced by random noise.
Taking the average of the 1964 and 1970 data we
shall assume that gaps of three years occur for
4% of the authors and gaps of four and five or more
years with \% frequency for each. The series
decreases so rapidly that we may safely suppose
gaps of more than five years to be vanishingly
rare; an author who has not published for the last
six years may be considered as terminated. The
TABLE
6% of authors having long gap records must now
be subtracted from the previous estimates of total
birthrate and deathrate, so that we must now
suppose the annual recruitment to be
45 - 6 = 39% and the annual
termination to be 35 - 6 = 29%. The effect of
this correction upon the magnitude of the
overlapping area of transience is not immediately
clear. The newly identified 6% of large gap authors
may be considered as those who were formerly
thought to be transients, those who were
apparently new recruits and terminators amongst
the continuants, or as being equally divided
amongst both classes of either the input or the
output. The results are as follows: —
IV
Assumption
Large gap authors are —
— all transients
— nome transients
— distributed by all births
— distributed by all deaths
a
Recruits
20
14
17
18
For our second approximation we shall take the
mean of these four possibilities which is, in fact,
given by the third line in which transients amount
to 22% of any annual index of authors. They
outnumber perceptibly the new recruits to the
community of continuing authors, and they are
more than double the natural rate of increase
(birth rate minus death rate) for the scientific
community. To put it very roughly, for every
increase of one author in the continuant population
it is necessary that about four new authors come
into being; of these one replaces somebody who
ceases to publish, two represent the infant
mortality of those who arrive and depart from the
research front in the same year, and the fourth
survives for a greater or lesser lifetime of
publication. Though this crude model needs much
refinement and correction, the fact is clear that
recruitment to the relatively stable community of
continuing scientific authors proceeds in two stages.
Reaching the research front and producing ones
first paper — a process institutionalized in the
United States by the Ph. D. — is only a first
step. The large majority of those attaining this
step are destined to proceed elsewhere than further
research front publication in any scientific or
technological field. Only a fraction, perhaps a
quarter, of those reaching the research front cross
the barrier from transience to continuance in
production of scientific papers.
One obvious fact in the above model is that the
Ci. Inf., Rio de Janeiro, 4(1):27-40, 1975
Terminators
(Percentages)
10
4
7
8
Transients
19
25
22
21
10% per annum growth rate in numbers of authors
reflects the growth of the I.S.I, index over and
above that of the population of authors. The
average world rate of production of authors should
almost certainly be nearer to 7% per annum
resulting in a doubling period of about 10 years.
A more serious fault is that we have only rough
empirical values for the incidence of overlapping
and gaps in the sort of year-to-year flow presented
in Table III.
To develop a better model let us first consider the
case in which there exists a fixed and stable
continuant population, C, whose members year
after year have a fixed probability p of publishing
during that year, a corresponding probability 1 —
p of not publishing. The number publishing in
two consecutive years will be Cp2, and the
number publishing after a gap of one or more
years will be Cp( 1-p). Fitting this model to our
empirical data as presented in Figure 2 and
modified by the transfer of 6% from newcomers
to those reappearing after long gaps, we have that
the number coming from the previous year is
41%, and the number reappearing after short and
long gaps is 20%. Hence Cp2 = 41% and
Cp(l-p) = 20% from which p = 0.67 and
C = 91%. We may take the convenient
approximate values of p = 2/3 and 1-p = 1/3
and compute from this that the numbers appearing
after gaps of 1, 2, 3, and 4 years should be
14%, 5%, 2%, 0.5%, all in rather good agreement
35
STUDIES IN SCIENTOMETRICS I
with the empirical data of Table III.c.
Our model therefore requires that in addition to
the 39 newcomers and the 61 continuant publishers
who exist amongst every 100 authors publishing
in a given year, there are another 30 continuants
who did not happen to publish in the year in
question. The total "scientific" population of
possible publishers is therefore 130 or 1.3 times the
number that actually publish in that year, but
39 of these are newcoming transients and recruits,
and of those remaining only 2/3 actually publish
during the year.
Considering next the fact that our model must not
be static, but subject to exponential growth,
we note that by the end of the year in question the
91 publishing and non-publishing continuants
have been augmented by the natural increase of
10 which is the excess of newcomers over
terminators. There will therefore be now 101
continuants of whom 67 publish curing the next
year and 33 do not. Of the 67 there will 45
continuing directly to the subsequent year and 22
who reappear after publishing gaps of one or
more years. Again this is in good agreement with
the right hand side of Figure 2, though as
remarked already the I.S.I, data reflects a rate of
increase that is higher than that of the scientific
population. To improve the model further we
would need data for the real scientific community,
rather than as reflected by I.S.I, so as to replace
the uncertain assumptions displayed in Table IV.
Even if we would have some confidence in setting
the actual excess of recruits over terminators at a
1% rather than 10% level, we would still need an
estimate for the rate of termination. The biological
process of retirement and death of the scientific
population would yield a rate of about 2%, but
almost certainly an equal additional amount must
result from transfer from active publication to
teaching, administrative, and other posts. With
such an assumption (for which we can here adduce
no empirical data) the model would have a
recruitment rate of 11%, a termination rate of 4%,
and a transience rate remaining at ea. 22% which
would imply that 2/3 of all new entrants were
transient, and that only 1/3 of those making their
first appearance ( s ) in publication will enter the
community of continuants. The total newcomers
being 33%, there remains 67% for the publishing
continuants at the beginning of that year, and to
these must be added a supernumery 33% of
continuants not publishing that year. The total
body of continuants at the beginning of the year is
therefore 100% and hence exactly the same size
as the number of authors publishing, and the total
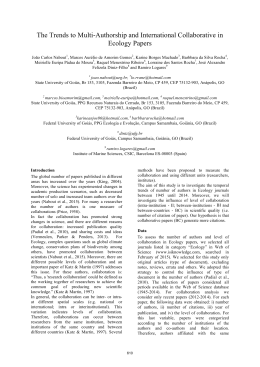
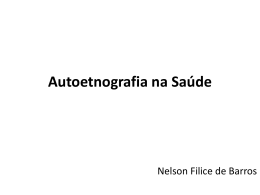
DEREK DE SOLLA PRICE & SUHA GÜRSEY
scientific communnity is 1.33 times that number,
including transients, recruits, publishing
continuants and no-publishing continuants. The
complete flow pattern for this improved model is
shown in Figure 3.
The agreement of this model with the empirical
data is now excellent for the transients, the birth
and death rates, and for the continuants who
continue from one year to the next or have gaps in
their publication records. It is still not quite
adequate for the very strong continuants who
persist for several years together. Of the 96
authors recorded in 1964 there are 19 whose names
occur in all annual indexes through 1970. On the
basis of a publishing probability of p = 0.67 for a
continuant population of 96 there would be only 6
such people for the entire seven year period; to get
•19 would require p = 0.79 for the whole continuant
population. Alternatively one could say that
there were 13 additional authors so strongly
continuant that for them p = 1.0 so they were
certain to publish in all years. From the data base
we find the actual proportion of authors who
persist for at least an n-year run, relative to the
continuants at the beginning of the period to
be as follows:
n
actual
3
4
5
6
7
33
25
21
19
20
expected
33
22
14
9
6
The expected proportions were all calculated on
the basis of p = 2/3. It is apparent that the
random probability model beggings to break down
for runs of more than four years, and the constancy
of the subsequent actual percentages makes it
natural to suppose that there exists a hard core of
highly persistent strong continuers who amount to
about 20% of the continuant population (they must
also be 20% of the annual author list) and who
publish without fail every year during their lifetime
on the list. This core, it should be noted, is a
considerable fraction 0.3 of all the publishing
continuants, and 0.45 of these continuing from the
previous year. No doubt the boundary between
core and non-core continuant publishers is not
completely sharp, but some graduation exists
between those for whom the probability of
publishing in any year is near unity and those for
whom it is near the average value of 2/3; we shall
retain the distinction as an aid to conceptualization.
With this refinement the model now accounts for
all of the empirical evidence from the data bank,
and the components of the scientific community
may now be summarily categorized as follows:
Ci. Inf., Rio de Janeiro, 4(1):27-40, 1975
a) Transients who publish only during a single
year and constitute 22% of those publishing
this year, 2/3 of those newcomers to scientific
publication during the year.
b)
Recruits who begin publishing during the year
and join the continuant population. They
constitute 11% of those publishing, 1/3 of the
newcomers.
c)
Terminators who end their publishing during
the year and thereby leave the continuant
population. We have assumed they constitute
about 4% of those publishing.
d) Core continuants who publish this year and
indeed in every year for a long period. They
amount to 20% of those publishing.
e)
(Non-core) Publishing continuants who publish
this year and have a probability of 2/3 of
publishing in any other year for a long period.
They amount to 47% of those publishing, so
that the total of core and non-core publishing
continuants is
f ) Non-publishing continuants who also have a
probability of 2/3 of publishing in any year
over a long period but do not happen to
publish in the year in question. They amount
to 33% of those publishing, and this implies
that the number of active researchers during
the year is 1.33 times those actually
publishing.
There is clearly a close relationship between the
demographic structure that has now been
elucidated and the distribution of productivity of
scientific authors. Till now the data have been
drawn from the mere appearance of an author's
name in the series of annual indexes and not from
the number of papers that he published in each
year. The approximate average over the entire set
of annual source indexes is that each author has
his name on about two papers per year. Since
however there are on the average also about two
authors on the by-line of each paper it follows that
the total number of authors is equal to the total
number of papers. Thus although there is just one
paper/author/year, there are about two
authorships/author/year. Of these two
authorships, about one is primary (i.e. the first
author mentioned) and the other secondary — it is
important to bear this in mind for citations to
papers are listed to the primary author only.
The demographic properties of transience and
continuance are obviously to be associated with the
lowest and highest rates of productivity
respectively. For transience indeed, the publication
is a one-shot event, and only formally do we
37
STUDIES IN SCIENTOMETBICS I
associate with it an interval of a year. The
training and research leading up to the event may
take a much longer period. In a separate
investigation we considered the publication records
of authors who remained on the indexes for various
spans of years. Those transients with a span of
a single year produced 1.1 authorships during
that year. Those continuants with spans of 2, 3,
and 4 years produced 1.5, 1.73, and 2.0
authorships/year, and the obviously core
continuants staying for 5 years had 3.7
authorships/year. Going even further to a
nine-year span (extending to 1972) for the core we
found 4.3 authorships/year as the average for the
group of 16 such authors. The continuants
therefore have an average rate of production two
authorships/year equal to the average of all the
population, and the core continuants produce at
about twice this average, balancing the transients
with their minimal contribution of 1 authorship/
year. In our small sample the most prolific authors
had 14, 8, 5, 5 and 4 authorship/author/year
respectively. In general the range of productivities
seems remarkably low, running not much more
than a factor of two above and below the
average for everyone but the most prolific couple
of members of the core group. It is wellknown
that the work content of what constitutes a
publishable paper varies quite a lot from field to
field and even perhaps from country to country.
Allowing for this one might reasonably suppose
that each of the three demographic groups have
productivity factors that are not merely average
but also typical. Transients appearing in a single
year tend to produce a single authorship in that
year. Continuants produce about two authorship
( = one paper) and the core group about four
authorship ( = two papers) each year.
From this it follows that in any record extending
over several years the numbers of papers produced
by the various authors will depend more upon their
lengths of stay at the publishing front than upon
their rate of production while there. Unfortunately
there is a basic difficulty in using such a long
record to make deductions about the characteristics
of the authors, The trouble is that at the
beginning of such a record, and in the case of
exponential growth, even more strongly at the end
of the record, one is dealing with authors whose
natural research lifetimes have been artificially cut.
A cross-sectional study taken only over a given
time range must contain a large number of authors
whose careers began during that interval. For
example a 10-year study contains equal numbers of
those beginning publication during the interval
and those already present at the beginning.
Fortunately however there is now a great deal of
evidence to show that such cross-sectional studies
of productivity over reasonably long intervals of
time follow rather simple laws with great
regularity.* A first approximation is given by
Ci. Inf., Rio de Janeiro, 4(1):27-40, 1975
Lotka's Law which states that in any population the
number of authors with exactly n authorship is
proportional to 1/n2, and another form holding also
for larger values of n is Price's Law which states
that the number of authors with at least n
authorship is proportional to l/n(k + n) where k
is a parameter of about 15 authorship/author/
lifetime which marks a boundary between very high
and normal production. The proportion of authors
having a single authorship only may be calculated
from these laws, Lotka's form giving 61% and
Price's 53%. Both values are perceptibly lower than
the present demographic model in which we have
settled on parameters such that 2/3 of all
newcomers are transient, and hence there would be
61% of single authorship authors. The demographic
model could be reconciled with Lotka's Law by
keeping transients at 22% and taking the
non-transient recruitment rate as 14% and which
Price's Law by taking it as 20%. These latter
figures are indeed exactly those of the
second and first lines respectively of Table IV and
are the limits of what could be maintained from
the empirical data of the present study. They were
modified, it will be remembered only because it
seemed excessive to have a 10% rather than a 7% per
annum rate of increase and also excessive to allow
a termination rate larger than 4% per annum. In any
case the changes introduced into the model by such
variations of parameter are slight, they will have to
be resolved in future work with larger samples
of population which can be better specified now
that a conceptual foundation has been laid for the
chief demographic phenomena.
For those authors with more than a single
authorship, the productivity laws seem to imply
that the number of continuants with a given
lifetime decreases with the length of that lifetime.
Furthemore, the changeover in Price's Law at a
parametric value of 15 authorships may well be
identical with the demographic distinction that has
been made between those cortinuants who are in
the core group and those who are not. Clearly it
should be possible to derive a lifetime expectancy
function for paper publishers from the known
productivity law. Just as the first year's
publication record initiates one into authorship,
and the second year's record selects the fraction
who become continuants, so each successive year of
publication reduces the ranks but makes it easier
for those who succeed to continue. The final
hurdle, that from continuant to core must occur
after something like five years of work and the
production of some 15 authorships.
A full account of these laws and reference to the
relevant literature is given in Derek de Solla Price,
Little Science Big Science, New York, 1963. p. 42-50.
38
DEREK DE SOLLA PRICE & SUHA GÜRSEY
We suggest that these demographic stages that have
been diagnosed correspond rather well to the
social and institutional barriers that pervade every
field and country in which there exist scientific
and technological publication into the world corpus
of common knowledge. It has already been
remarked that the first barrier of securing the
ability and permission to publish at all is that
which is institutionalized in the U.S.A. and
U.K. as the Ph.D. degree. In other countries it
may correspond with Candidacy or some other
post-graduate qualification. The second barrier is
probably that of first acceptance into an academic,
governmental or industrial post in which at least
part of the expected output is research front
publication. The final barrier would seem to be
that of the securing of tenure and seniority leading
to a major lifetime commitment to research
output and probably also the collaboration of
junior continuants and transients.
It might at first be thought that the demographic
structure that has been analysed is a direct
consequence of the institutionalization that we now
have. Two factors militate against this
interpretation. In the first place it is quite clear
that the productivity distribution of authors today
is not essentially different from what it was for
the seventeenth century science published in the
early volumes of the Philosophical Transactions of
the Royal Society of London long before the Ph. D.
degree or the career scientists came into being. It
seems therefore the phenomena of transience and
continuance must have occurred first, and the
institutionalization followed. In the second place
the very form of the productivity distribution
implies that behind the phenomenon of demographic
stages separated by barriers, lies a continuous
process of people gradually falling away from
active publication.
It follows from Price's Law that the fraction of
authors proceeding from a total of at least n papers
to the level of 2n papers is 0.5(1-1/(2-k/n))
where, as before k is a parameter of value about
15 authorships. From this it follows that the
transition frequency for authors to double their total
of authorships beings at 47% for the first paper, falls
to 33% at 15 authorships, and then decreases slowly
and assymptomatically to 25% for very prolific
authors. Similarly for a multiplication of output
by 1.5 rather than a doubling, the transition
probability beings at 67%, goes through 53% at 15,
and ultimately decreases to 44%. For very large
outputs this law ultimately breaks down because of
the death of the author.
Another way of looking at the same consequences
of this law is to say that at the beginning an
author has an even chance (p = 1/2) of
Ci. Inf., Rio de Janeiro, 4(1):27-40, 1975
multiplying his output by a factor of 1.89, by the
time he has reached 15 authorships his even
chance is for an extension by a factor of 1.56, and
ultimately the factor is reduced to 1.41. In general
the pattern of the productivity law is such that
what remains rather constant for any author is his
chance of increasing his total output by a given
ratio. Since we know already that authors differ
not so much in rate of production as in duration of
stay in research publication, these results may
be interpreted as probabilities for the extension of
publishing lifetime by the various factors. Again,
what remains approximately constant is the chance
that an author will continue for some multiple
of his present span of years in research publication.
Thus life expectancy at the research front is
proportional to the time already spent there; the
mortality rate falls steadily and hyperbolically
from the very high level it begins with in infancy.
It is this steady force which produces both the
productivity distribution and the demographic
structure. For those beginning a publishing career
the mortality is very high so that a majority of the
publishing population fall in this category. With
a minimal lifetime and a low rate of production
it is easy to see that transients publish only a small
minority of the totality of papers. In fact the
75% of the population who are least prolific account
for only 25% of the output. At the other end of
the scale those authors who are so reinforced by
successful publication that they have the smallest
mortality and appear for a long succession of years
also have a high rate of production and the output
of this small core group. A core group of 20%
of the continuants will probably produce more
than half the total output.
All this is a result of the simple facts that success
in scientific publication is extremely difficult to
achieve and that breeds further success — a good
example of positive feedback or the Matthew
Principle. The consequence of this situation is a
strongly hyperbolic distribution of productivity,
and the consequence of that is that the unit
beginning of the distribution and its long tail
both tend to behave as distinct entities which have
here been identified as the transients and the core
continuants. If this interpretation is correct it
seems so intrinsic that the institutionalization must
be regarded as the way in which society has
adjusted to the built-in pattern. For example the
barrier between first publication and second has
its value by virtue of the difficulty scale of
successive publication rather than because of the
availability of socially useful jobs. With the same
hyperbolic distribution now as in seventeenth
century England, it must be our society that has
cut its various suits of institutional structure to
fit the cloth of scientific productivity and
demography.
39
STUDIES IN SCIENTOMETRICS I
RESUMO
Estuda o fenômeno de transiência/permanência
na frente de pesquisa pela análise do fluxo anual
de autores de uma população amostrada
derivada do banco de dados resultante de sete
anos de publicação de "Science Citation Index" e
"Who is publishing in Science".
Para o período total analisado (1964-1970) foram
encontrados 281 autores transientes e 19 autores
permanentes, numa população total de 506
autores. Derivou-se, a seguir, um modelo para
análise quantitativa do fluxo padrão de autores,
verificando-se que há uma taxa de natalidade
("annual recruitment") e uma taxa de mortalidade
("annual terminatio") de cuja superposição
resulta uma taxa de mortalidade infantil
(transiência). O modelo final permite definir a
existência de um núcleo de autores altamente
permanentes, correspondente a 20% da população.
Os autores transientes constituem 22% da população
anual e 2/3 dos autores novos ("newcomers").
Ci. Inf., Bio de Janeiro, 4(1):27-40, 1975
Foram ainda identificadas outras categorias de
autores na comunidade científica.
Há uma clara correlação entre estas propriedades
demográficas e as taxas (maior e menor) de
produtividade dos autores, cuja distribuição é
consistente com as leis de Lotka e Price. Isto
permite derivar a expectativa de permanência na
frente de pesquisa, que será proporcional ao
tempo ativo de publicação. Temos de um lado da
escala, a maioria dos autores com uma expectativa
de vida mínima e taxa de produtividade baixa
(75% dos autores produzindo 25% dos trabalhos);
no lado oposto estão os autores do núcleo
permanente (20%), com menor taxa de
mortalidade e maior taxa de produtividade (mais
que a metade dos trabalhos). Esta situação é
resultante de um feedback positivo ou efeito
Matthew — e parece ser tão intrínseca que,
tudo leva a crer, nossa sociedade deve atingir de
modo a adaptar sua estrutura institucional à feição
da produtividade e demografia científicas.
40
Download