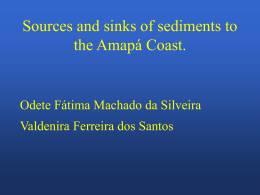
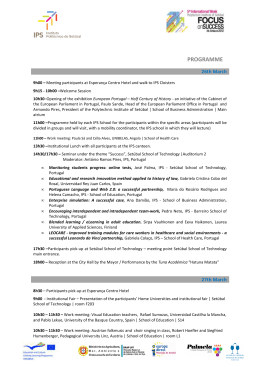
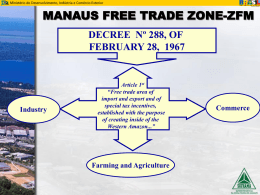
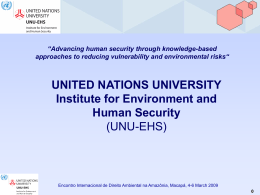
EXECUTIVE SUMMARY
SOCIAL PROGRESS INDEX
FOR THE BRAZILIAN AMAZON
IPS Amazônia 2014
Daniel Santos, Danielle Celentano, Jaime Garcia
Antonio Aranibar e Adalberto Veríssimo
SOCIAL PROGRESS INDEX
FOR THE BRAZILIAN AMAZON
IPS Amazônia 2014
Daniel Santos, Danielle Celentano, Jaime Garcia
Antonio Aranibar e Adalberto Veríssimo
EXECUTIVE SUMMARY
Initiative:
By:
In partnership with:
Support:
© Copyright 2014 by Imazon
Authors
Daniel Santos, Danielle Celentano, Jaime Garcia,
Antonio Aranibar e Adalberto Veríssimo
Editorial Revision
Glaucia Barreto
([email protected])
Translation
Luiz Gustavo Leitão Vieira
Cover and Editorial Design
Luciano Silva
www.rl2design.com.br
INTERNATIONAL DATA FOR CATALOGUING THE PUBLICATION (CIP)
WITH THE NATIONAL BOOK DEPARTMENT
I39
Índice de Progresso Social na Amazônia brasileira: IPS Amazônia 2014
Índice de Progresso Social na Amazônia brasileira: IPS Amazônia 2014 /
Daniel Santos; Danielle Celentano; Jaime Garcia; Antonio Aranibar; Adalberto Veríssimo – Belém, PA: Imazon; Social Progress Imperative, 2014.
16 p.; 21,5 x 28 cm
ISBN 978-85-86212-63-5
1. DESENVOLVIMENTO REGIONAL. 2. AMAZÔNIA. 3. PROGRESSO SOCIAL. I. Santos, Daniel. II. Celentano, Danielle. III. Garcia, Jaime.
IV. Aranibar, Antonio. V. Veríssimo, Adalberto. VI. Instituto do Homem e Meio
Ambiente da Amazônia – IMAZON. VII. Social Progress Imperative.
CDD: 338.9811
The data and opinions expressed in this work are the entire responsibility of the authors and do not necessarily
reflect the opinion of funders of this study.
Rua Dom Romualdo de Seixas, 1698
Edifício Zion • 11º Andar • Umarizal • CEP 66055–028 • Belém – Pará – Brasil
Tel.: (91) 3182-4000 • Fax: (91) 3182-4027
www.imazon.org.br • [email protected]
E XE CUTIV E SUMMARY
The Importa nce of Me as ur ing
Social Progre ss in the Ama zon
The Brazilian Amazon is superlative in
natural resources, harboring one-third of the
world’s tropical forests and the planet’s largest
hydrographic basin. Beneath this region lies one
of Earth’s richest mineral deposits. Moreover,
the Amazon forest retains vast amounts of
carbon and plays a strategic role in the regulation
of regional and global climate.
More than 24 million people also live in
the Amazon. This population has experienced
social conditions worse than the other regions
of Brazil. These conditions are associated
with a development pattern largely driven by
deforestation, extensive use of natural resources,
and social conflicts. The region’s continental
size and lack of infrastructure pose additional
challenges to advancing social and economic
progress.
The region has an almost real-time
deforestation monitoring system through satellite
images, which serve as a reference for the tropical
world. However, measuring its social situation
remains a great challenge. Indeed, the frequency
of data updates is low and there are limitations
[1]
in the geographic scope of some indicators.
Moreover, until recently, the Amazon’s social
performance was assessed only by indexes which
are themselves highly influenced by economic
indicators. With the creation of the Social
Progress Index (SPI) methodology in 2013, it
became possible to evaluate the region’s social
progress by considering only the social and
environmental indicators which are really key for
people’s quality of life.
The Social Progress Index in the Brazilian
Amazon - IPS Amazônia (Índice de Progresso
Social na Amazônia Brasileira - IPS Amazônia)
2014 full report[1], a product of collaboration
fostered by the network #Progresso Social Brasil,
prepared by Imazon in partnership with the Social
Progress Imperative, is available on the websites
www.imazon.org.br and www.progressosocial.org.br.
The report represents the most detailed diagnosis
ever attempted of the social and environmental
progress of the Amazon’s 772 municipalities[2]
and nine States. The data and results broken
down to the municipality scale are available on
the website www.ipsamazonia.org.br.
An English-language version of the full report will be available online later this year.
[2]
Because of data gaps for one municipality, Mojuí dos Campos (Pará), only 772 of the 773 municipalities in the Brazilian
Amazon were included in this study.
• IPS AMA ZÔNIA 2014 •
3
E XE CUTIV E SUMMARY
What is the Social Progress Inde x?
The SPI is an index that measures,
in a holistic and robust way, the social and
environmental performance of nations and
territories, regardless of their economic
development (Social Progress Imperative,
2014). It was created in 2013 by the Social
Progress Imperative, in a process supported by
several world-class scholars and specialists in
public policies. The SPI was devised with the
understanding that development measurements
based only on economic variables are insufficient,
since economic growth without social progress
leads to exclusion, social dissatisfaction, social
conflicts, and environmental degradation (Social
Progress Imperative, 2014). The global SPI 2014
includes 54 social and environmental indicators.
The index incorporates four key design
principles:
Principles of SPI
1. Exclusively social and environmental indicators: it aims to measure
social progress directly, rather than through economic proxies.
2. Outcomes not inputs: it aims to measure outcomes that matter to
the lives of real people, not spending or effort.
3. Actionability: the index intends to be a practical tool, able to help
leaders and practitioners in government, business and civil society to
implement policies and programs that will drive faster social progress.
4. Relevance: it aims to create a framework for the holistic measurement
of social progress that encompasses the health of societies at all levels of
economic development.
4
• IPS AMA ZÔNIA 2014 •
E XE CUTIV E SUMMARY
What is the Social Progress Inde x?
“Social progress” is defined by the Social
Progress Imperative as the capacity of a society to
meet the basic human needs of its citizens, establish the
building blocks that allow citizens and communities to
enhance and sustain the quality of their lives, and create
the conditions for all individuals to reach their full
potential (Social Progress Imperative, 2014). Three
questions, essential for assessing the social progress
of a given location, stem from this definition:
1)Does a country provide for its people’s most
essential needs?
2) Are the building blocks in place for individuals
and communities to enhance and sustain
wellbeing?
3)Is there opportunity for all individuals to
reach their full potential?
These three questions define the three
dimensions of social progress: 1) Basic Human
Needs; 2) Foundations of Wellbeing; and 3)
Opportunity. Each of these dimensions is made
up of four components, and each component is
composed of three to six indicators.
Structure of the Social Progress Index at the component level
Social Progress Index
Basic Human Needs
Foundations of Wellbeing
Opportunity
Nutrition and Basic Medical Care
Access to Basic Knowledge
Personal Rights
Water and Sanitation
Access to Information and Communications
Personal Freedom and Choice
Shelter
Health and Wellness
Tolerance and Inclusion
Personal Safety
Ecosystem Sustainability
Access to Advanced Education
• IPS AMA ZÔNIA 2014 •
5
E XE CUTIV E SUMMARY
Social Progress Inde x in the
Bra zilian Ama zon
The SPI was originally proposed for the
global scale and to measure social progress at the
level of countries. However, since its launch in
2013, several national and sub-national initiatives
have appeared. The IPS Amazônia seeks to answer
the same questions as the global SPI and has the
same statistical method. Nevertheless, some of the
indicators used are different to better represent
the reality of the region. For instance, indicators
such as malaria incidence and deforestation rate
are paramount for the Amazon, even though they
are not so relevant for other areas of the globe. In
order to calculate the IPS Amazônia, 43 indicators,
recent and from reliable sources, have been used[3].
The index ranges from 0 (worst) to 100 (best).
The Brazilian Amazon
Legal Amazon is a socio-geographic division of Brazil that covers 59% of the territory (5 million square kilometers)
and comprises nine states (Acre - AC, Amazonas - AM, Amapá - AP, Maranhão - MA, Mato Grosso - MT, Pará - PA,
Rondônia - RO, Roraima - RR and Tocantins - TO) and 773 municipalities. This region is home to approximately 24
million inhabitants (13% of the national population). Although most (72%) of the population is concentrated in urban
areas, the region safeguards one of the world’s largest ethnic and cultural diversities: over 170 indigenous peoples
with a population estimated at approximately 400,000 people (IBGE, 2010). In spite of its small participation in the
national economy, with only 8% of Brazil’s gross domestic product (GDP), the region’s wealth in natural resources
and environmental services is priceless.
[3]
6
For more information about the methods and the indicators, please read the full report available at www.imazon.org.br.
• IPS AMA ZÔNIA 2014 •
Main results
of IPS Ama zônia
• IPS AMA ZÔNIA 2014 •
7
E XE CUTIV E SUMMARY
Main results of IPS Amazônia
Overall performance
The Amazon has an IPS score[4] (57.31)
under the national average (67.73). In fact,
the region yields results below the Brazilian
average for all three dimensions and almost all
components of the SPI. Although we use, in
the IPS Amazônia 2014 report, the average of
Brazilian municipalities to assess and compare
the performance of the Amazon region, it is
important to point out that social progress as
measured by the global SPI for Brazil is not
favorable either. According to the international
rankings presented by the Social Progress
Imperative in 2014, the country ranks just 46th
of 132 countries, and those in the best positions
(New Zealand, Switzerland, and Iceland) boast
a score of over 88.
The best IPS result for the Amazon is
in dimension 2 (Foundations of Wellbeing)
with an average index score of 64.84, whereas
dimension 1 (Basic Human Needs) shows
intermediate results (58.75) and dimension
3 (Opportunity) has the worst performance
in the region with a score of only 48.33. This
last dimension also displays the greatest
disparity between the region and the rest of
the country (21%), making it clear that there
is a lack of opportunity for the population of
the Amazon.
Results of IPS Amazônia 2014
IPS Amazônia
Dimension 1. Basic Human Needs
Nutrition and Basic Medical Care
Components
Water and Sanitation
Shelter
67.73
57.31
80.01
72.46
71.60
74.87
39.49
Dimension 2. Foundations of Wellbeing
Access to Basic Knowledge
Access to Information and Communications
Health and Wellness
Ecosystem Sustainability
Dimension 3. Opportunity
Personal Rights
Components
Amazon
92.03
Personal Safety
Components
Brazil
Tolerance and Inclusion
Access to Advanced Education
35.35
72.48
54.72
70.42
64.84
63.44
53.36
82.76
74.85
67.13
68.35
60.61
70.57
61.18
48.33
81.99
64.41
33.76
19.10
65.39
Personal Freedom and Choice
58.75
63.59
45.22
64.58
[4]
Unless directly referenced, all scores in this report are from the IPS Amazônia methodology. Any scores from the global
Social Progress Index 2014 are noted as such.
8
• IPS AMA ZÔNIA 2014 •
E XE CUTIV E SUMMARY
Main results of IPS Amazônia
Performance of municipalities
The Amazon municipalities were grouped
in five levels of social progress, according to
their score. The first group includes the 87
municipalities with the best results (dark green
in the map), where the average IPS Amazônia
score is 65.79. These municipalities cover
390,000 square kilometers (approximately 8% of
the territory of the region) and have a population
of 9.4 million inhabitants (39% of the Amazon
population). This group accounts for more than
half (53%) of the region’s GDP. In this group
all capitals are included, except Porto Velho
(Rondônia). Although they boast the best results
of municipalities in the Amazon, most of these
municipalities still perform below the Brazilian
average.
IPS Amazônia at municipality level
• IPS AMA ZÔNIA 2014 •
9
E XE CUTIV E SUMMARY
Main results of IPS Amazônia
Performance of municipalities
The second group has 200 municipalities
and presents an average score of 61.13 (light
green in the map). These municipalities cover
an area of 1 million square kilometers (21% of
the territory), house a population of 4.8 million
inhabitants (20%), and their GDP contributes
23% of the regional GDP. In this group, we
find Rondônia’s capital, Porto Velho, and also
the municipality with the Amazon’s highest per
capita income: Campos de Júlio (MT).
The third group has 194 municipalities
which show an average score of 57.21 (yellow
in the map). This group includes municipalities
with noted differences in the level of economic
development, measured by the per capita income
ranging from USD 1,100 per year in Barreirinha
(AM) to USD 5,800 in Ipiranga do Norte (MT).
It shows that good economic performance does
not necessarily ensure social progress. Other
municipalities in this group are Marabá (PA),
Ariquemes (RO), Paragominas (PA), Alta
Floresta (MT), and Oiapoque (AP).
The fourth group (orange in the map)
gathers the highest number of municipalities
10
(204) and has an average score of only 53.59.
These municipalities cover 29% of the territory,
house 20% of the total population and account
for only 9% of the Amazon’s GDP. In the map, it
is observed that a great part of the municipalities
of this group is concentrated on the same zone
of latitude, moving from East (in Maranhão),
across Pará to the West in Amazonas and
Acre. The municipalities of Coari (AM), Novo
Progresso (PA), Itaituba (PA), and Raposa
(MA) are some of the municipalities in this tier
of social progress.
Finally, 87 municipalities make up the
fifth group (red in the map), which shows the
lowest levels of social progress in the Amazon:
the average score is just 49.00. One million
seven hundred thousand inhabitants (7% of
the region) live in these municipalities which
account for only 3% of the regional GDP.
Thirty-eight percent of these municipalities
are in Maranhão and 26% in Pará. The
municipalities with worst results in the region
are Anapu (PA), Alto Alegre (RR), Brejo de
Areai (MA) and Jordão (AC).
• IPS AMA ZÔNIA 2014 •
E XE CUTIV E SUMMARY
Main results of IPS Amazônia
Performance of municipalities
Weaknesses and strengths of the Amazon municipalities (scorecards).
Social progress, as measured by IPS Amazônia, its three dimensions, 12 components and 43
indicators, can be individually evaluated for all the municipalities of the Amazon region through
scorecards available on the website www.ipsamazonia.org.br. All the municipal results and the position
of each municipality in the regional ranking are shown, and the results are given a green (good result),
yellow (neutral) or red (weak) card, in relation to other municipalities at the same level of income. A
sample of the scorecard system is below.
Índice de Progresso Social:
Renda per capita anual 2010:
Pontuação
Pontuação
Classificação
64,34
R$ 4.908
67
254
Classificação
Santarém
Pontuação
Classificação
Pontuação
Classificação
Necessidades Humanas Básicas
67,84
79
fundamentos para o Bem-estar
67,35
316
Oportunidades
57,82
43
Nutrição e cuidados médicos básicos
82,17
52
Acesso ao conhecimento básico
73,07
22
Direitos individuais
48,61
217
Diversidade partidária
54,17
Subnutrição
5,08
Analfabetismo
Mortalidade por desnutrição
1,00
Acesso ao ensino médio
48,46
Mobilidade urbana
Mortalidade materna
77,05
Qualidade da educação
4,70
Pessoas ameaçadas
Mortalidade infantil até 5 anos
19,23
Acesso ao ensino fundamental
90,47
Acesso à informação e comunicação
39,17
Conexão de voz
98,11
Gravidez na infância e adolescência
Conexão de dados de internet móvel
95,37
Vulnerabilidade familiar
Saúde e bem-estar
71,65
Mortalidade por doenças crônicas
24,78
Tolerância e inclusão
Expectativa de vida ao nascer
73,44
Violência contra a mulher
Mortalidade por doenças infecciosas
8,68
Água e saneamento
51,03
Abastecimento de água
58,29
Esgotamento sanitário
40,29
Saneamento rural
102
0,67
Liberdade individual e de escolha
474
358
Trabalho infantil
Acesso à cultura, esporte e lazer
2,74
0,00
81,30
5,85
19,19
4,00
71,95
82,60
Moradia inadequada
90,94
Obesidade
31,21
Violência contra indígenas
Acesso à energia elétrica
90,97
Mortalidade por doenças respiratórias
57,78
Desigualdade racial na educação
54,86
Acesso à educação superior
29,44
Pessoas com ensino superior
7,23
75,65
Segurança pessoal
55,57
Homicídios
5,00
Mortes por acidente no trânsito
Assassinatos de jovens
Relativamente forte
Relativamente NeUtro
Relativamente frACo
10,35
4,00
Suicídio
322
Sustentabilidade dos ecossistemas
4,68
85,52
108
0,00
1,58
Educação feminina
60,35
Áreas degradadas
0,16
Frequência ao ensino superior
11,16
46,12
Desmatamento acumulado
20,23
Áreas Protegidas
20,17
54
216,04
Desmatamento recente
Desperdício de água
31
9,34
Moradia
Coleta de lixo
230
7,40
64
Grupo de municípios com mesma faixa de renda per capita:
Rio Crespo, Calçoene, Cumaru do Norte, Ferreira Gomes, Bannach, Tesouro, Brejinho de
Nazaré, Tocantinópolis, Colniza, Itapuã do Oeste, Pium, Santa Inês, Miranorte, Brasil Novo,
Amapá, Conceição do Araguaia, Lagoa da Confusão, Marianópolis do Tocantins, Santa
Rita do Tocantins, São José do Povo, Corumbiara, Tupirama, Machadinho D’Oeste, São
Domingos do Araguaia, Jacundá, Taguatinga, Salinópolis.
* Para mais informações sobre o IPS, seu método de cálculo e ver a definição, unidade e fonte dos indicadores utilizados, leia o relatório “Índice de Progresso Social na Amazônia Brasileira - IPS Amazônia 2014”, que está disponível nos sites
www.imazon.org.br e www.progressosocial.org.br.
• IPS AMA ZÔNIA 2014 •
11
E XE CUTIV E SUMMARY
Main results of IPS Amazônia
Social Progress and
Economic Development
One of the objectives of using the SPI
methodology is to better understand the
relationship between social progress and
economic development (Social Progress
Imperative, 2014). Although the IPS Amazônia
has a high, positive correlation with the per
capita income of the Amazon municipalities
(0.62), the data distribution shows that
economic performance alone is not enough to
fully explain social progress outcomes, since
the relation between social progress scores and
per capita income is not linear. There is great
variation of social progress in the municipalities
with the same level of per capita income.
Some municipalities with very low per
capita income show relatively high scores when
compared to other municipalities with the
same level of income. For instance, Magalhães
Barata (PA), Porto Rico do Maranhão (MA),
and Parintins (AM) have scores in the highest
level even though they show very low per capita
income when compared to the capitals. On the
other hand, there are several municipalities with
income above the regional average which show
scores in the lowest levels, among them: Campo
Novo (RO), Bom Jesus do Araguaia (MT),
Cumaru do Norte (PA), and Pedra Branca do
Amaparí (AP). That is, social progress differs
from economic development, though they are
correlated.
Ratio between IPS Amazônia scores and per capita income in the Amazon municipalities
IPS Amazônia
IPS
42.31
100
71.86
95
90
85
80
75
70
65
60
55
50
45
40
35
30
500
1000 1500 2000 2500 3000 3500 4000 4500 5000 5500 6000 6500 7000 7500 8000 8500 9000 9500 10000 10500 11000 11500 12000 12500 13000 13500 14000
Per capita income (R$ in 2010)
12
• IPS AMA ZÔNIA 2014 •
E XE CUTIV E SUMMARY
Main results of IPS Amazônia
The Dimensions of IPS Ama zônia
Dimension 1
(Basic Human Needs)
This dimension of IPS Amazônia shows
whether the population has its most basic
needs ensured, by means of four components:
Nutrition and Basic Medical Care, Water
and Sanitation, Shelter, and Personal Safety.
This dimension is the one which shows the
second worst result in the Amazon (58.75).
All the components and indicators assessed
are concerning, especially the component
Water and Sanitation, with the second worst
result among all (35.35). The disparity between
the Amazon and the rest of Brazil in this
dimension is 18%.
Dimension 1. Basic Human Needs in the Amazon municipalities
• IPS AMA ZÔNIA 2014 •
13
E XE CUTIV E SUMMARY
Main results of IPS Amazônia
The Dimensions of IPS Ama zônia
Dimension 2
(Foundations of Wellbeing)
This dimension of IPS Amazônia shows
whether the Amazon municipalities have the
necessary structure to ensure social wellbeing,
defined by four essential components: Access
to Basic Knowledge, Access to Information and
Communications, Health and Wellness, and
Ecosystem Sustainability. This is the highest
performing dimension for the Amazon, scoring
64.84. However, the index is still 8% below the
Brazilian average.
Dimension 2. Foundations of Wellbeing in the Amazon municipalities
14
• IPS AMA ZÔNIA 2014 •
E XE CUTIV E SUMMARY
Main results of IPS Amazônia
The Dimensions of IPS Ama zônia
Dimension 3
(Opportunity)
This dimension estimates the level
of opportunity existing in the Amazon
municipalities by means of four components:
Personal Rights, Personal Freedom and Choice,
Tolerance and Inclusion, and Access to Advanced
Education. This is the lowest performing
dimension in the Amazon, showing an average
index score of only 48.33, whereas in the rest
of Brazil it is 61.18. The component Access to
Advanced Education is the worst of all the IPS
Amazônia components, with a result of 19.10.
Dimension 3. Opportunity in the Amazon municipalities
• IPS AMA ZÔNIA 2014 •
15
Conclusi on
The Amazon region is recognized
worldwide for its superlative natural resources
and for the environmental services it provides to
Brazil and to the rest of the planet. This wealth
has been used in a predatory manner with high
rates of deforestation and social conflicts. At
the same time, serious social problems persist
in the region and opportunities for social
progress for the majority of the population are
missing. Social progress, as it is measured by IPS
Amazônia, reveals that the region is below the
Brazilian average, which is incompatible with
the region’s environmental importance. The next
general elections (president, governors and state
and federal legislation), in October 2014, offer
an outstanding moment to discuss social and
environmental issues of the region and propose
solutions to improve the social progress of over
24 million inhabitants of the Amazon. The full
report Índice de Progresso Social na Amazônia
Brasileira - IPS Amazônia 2014 (“Social Progress
Index in the Brazilian Amazon - IPS Amazônia
2014”) may be used as a compass to guide the
management and the public policies in the region.
To learn more:
For more details about IPS Amazônia (including complete results, methods and indicators
adopted and municipal ranking) read the full report Índice de Progresso Social na Amazônia Brasileira IPS Amazônia 2014 (“Social Progress Index in the Brazilian Amazon - IPS Amazônia 2014”), by Daniel
Santos, Danielle Celentano, Jaime Garcia, Antonio Aranibar, and Adalberto Veríssimo, available on
www.imazon.org.br and www.progressosocial.org.br
Municipal results and scorecards are available on the websites www.ipsamazonia.org.br and
www.progressosocial.org.br.
Sources
IBGE. Instituto Brasileiro de Geografia e Estatística (Brazilian Institute of Geography and Statistics).
2010. Data from demographic census 2010. Available on: <http://www.sidra.ibge.gov.br/>.
Social Progress Imperative. 2014. Social Progress Index: Report. Ed.: Porter, M. E.;
Stern, S.; Green, M. Washington, DC: Social Progress Imperative. 116 p. Available on:
<http://www.socialprogressimperative.org/>.
16
• IPS AMA ZÔNIA 2014 •
Initiative:
www.progressosocial.org.br
By:
www.imazon.org.br
In partnership with:
Support:
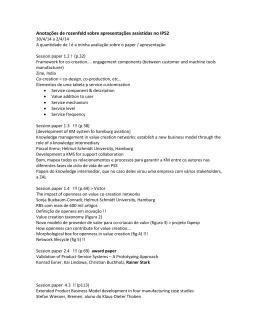
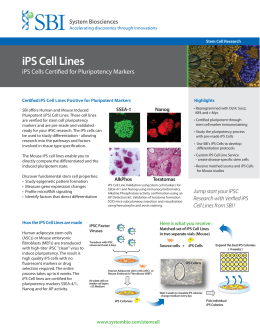
Download