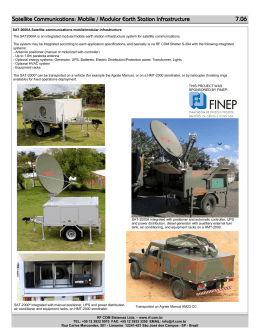
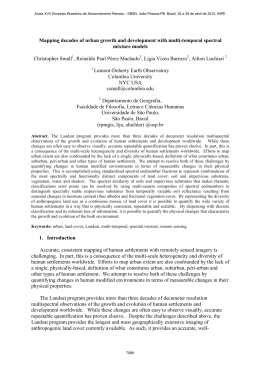
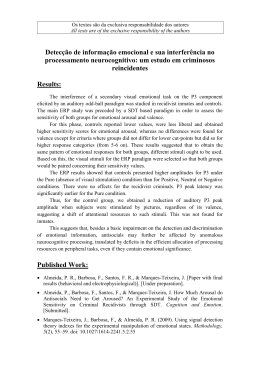
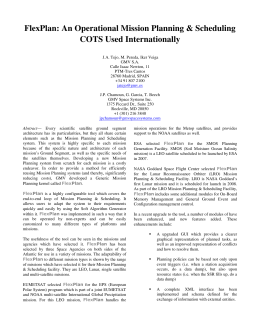
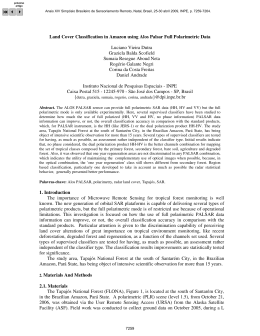
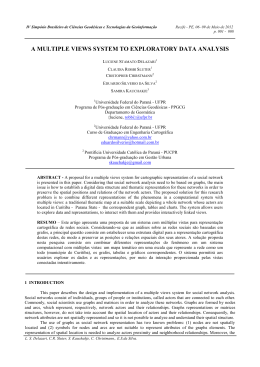
Anais XVII Simpósio Brasileiro de Sensoriamento Remoto - SBSR, João Pessoa-PB, Brasil, 25 a 29 de abril de 2015, INPE
An application for real-time weather information for the Brazilian World Cup host
cities
Humberto Alves Barbosa 1,2
Leandro Rodrigo Macedo da Silva 2
Anselmo Manoel dos Santos 2
Edson Matias dos Santos 2
Luiz Eduardo dos Santos Costa 2
1
Universidade de Federal de Alagoas – UFAL/LAPIS
BR 104 Norte, Tabuleiro do Martins, 57072-970 Maceió, AL – Brasil
[email protected]
2
Universidade de Federal de Alagoas – UFAL/LAPIS
BR 104 Norte, Tabuleiro do Martins, 57072-970 Maceió, AL – Brasil
{macedo.leandror, anselmo.icat.ufal, edsonmtss}@gmail.com, [email protected]
Abstract. Based on the EUMETSAT/EUMETcast develop research on services, a real-time application to
visualize the weather information during the Brazilian World Cup is presented. This application illustrates the
potential of using multimedia systems integrated to Global Earth Observation (GEO) satellite data. EUMETCast
is EUMETSAT’s primary dissemination mechanism for the near real-time delivery of satellite data and products.
Data, products and services are made available via EUMETCast, direct dissemination/readout, the Global
Telecommunication System (GTS) and FTP over the internet.The proposed study shows a Web application that
uses satellite data from the Meteosat Second Generation (MSG) received by LAPIS EUMETCast station to offer
to users a wide visualization of climate data from the host cities of the World Cup held in Brazil. Moreover the
developed software can be seen as a visualization layer capable to exhibit satellite images, meteograms, online
weather forecast, wind maps, flight radar, monitoring local camera and localization maps. Open source codes are
also used for processing, geolocation and geographical information systems, written for the transformation of
MSG gross data into input files in images with weather information. These features have demonstrated a great
flexibility and ease of use providing various information in one place and making the coverage of the entire
Brazilian territory during the event. The study open up an avenue for other applications that can use this kind of
data, as digital television, web and mobile applications, where the user will have this information as an aid to the
activities of everyday life.
Keywords: Hypermedia, METEOSAT-10 Data, Data Visualization.
1. Introduction
The information provided by geostationary (GEO) satellites is very important for the
Earth and its atmosphere. In fact, the satellite sensors receive radiation from the Earth and its
atmosphere in several visible (VIS) and infrared (IR) spectral bands, from which several Earth
and atmospheric parameters are retrieved such as cloud top temperature, water vapour
absorption. GEO satellite data need to be properly evaluated in order for them be useful for
operational use and climate change adaptation plans.
Several variational data visualization tools or systems are available nowadays but they are
implemented in centres where large computational resources are available and are generally
used for global analysis. These sophisticated technologies for visualization are essential for
bridging the gap between such systems and users. A typical visualization tasks cover visual
exploration, visual analysis and presentation. In other words, visualization is concern to
generate static images that can represent GEO satellite data. Furthermore, going beyond the
visualization analysis, complex data manipulation requires solutions "out-of-core" including
hardware and software techniques, Barbosa et al (2014).
6127
Anais XVII Simpósio Brasileiro de Sensoriamento Remoto - SBSR, João Pessoa-PB, Brasil, 25 a 29 de abril de 2015, INPE
The evolution of visualization techniques enables us to go further than graphical user
interfaces or pixels on bit-mapped displays. For Nelli (2014) immersive environments, natural
interaction user interfaces and interactive multimedia systems are example of approaches to
supporting collaborative design and simulation to support a variety of spatial applications. In
the field of multimedia systems, they offer an easy way to combine different views of data in
a unique user interface that could be accessed by browser or mobile devices. Adding the real
time features, we can distribute information whenever and wherever we intend to. This kind
of solution fits with the world trend of information anytime, anywhere and anyplace.
According with Tavares and Barbosa (2014) new tools allow the weather forecaster to
combine data types into single user interfaces. So, why not put together real time multimedia
systems and weather information visualization, Tavares and Barbosa (2014).
The 2014 FIFA World Cup held in Brazil was an opportunity to explore the potential of
real-time multimedia systems with the need to visualize meteorological information. In this
scenario an application has been developed by the Laboratory of Analysis and Processing of
Satellite Images (LAPIS) in order to monitor of the forecasts of the World Cup host cities.
The service offered by the developed application is called World Cup Live. This initiative
uses a station to receive weather information in real time, installed in LAPIS lab. The
laboratory has the cooperation of several national and international bodies of satellite
meteorology. Also the presented solution uses a dedicated telecommunication system, in
operation in recent years, which uses EUMETCast service. EUMETCast is a low cost system
for transmitting information by satellite in real time. This system was designed to distribute
images Meteosat Meteorological Satellite Second Generation (MSG) and products and
services of the Global Programme Earth Observation System of Systems (GEOSS).
In this paper, we present a real-time application that explores the potential of visualization
of GEO satellite data through the following products: satellite image, meteograms, online
weather forecast, wind maps and online video. The proposed application was developed and
used as a service during the FIFA World Cup held in Brazil. The study shows the use of
Meteosat Second Generation (MSG) data as a real time provider of weather information.
Moreover the software developed for the visualization layer integrates several kinds of media,
such as, images, animation, spatial data and video. Open source codes are also used for
geolocation and geographical information systems, written for the transformation of MSG
data into input files. This feature have demonstrated a great flexibility and ease of use. The
study open up an avenue for other applications that can use this kind of data, as digital
television, web and mobile applications.
2. Material and Methods
How should climate data be visualized to match real-time global audience needs? During
the FIFA World Cup held in a wide country as Brazil with several climate zones, how the big
audience could better understand the climate conditions in the host cities? This is the main
motivation of the presented application.
Nowadays computer capacities and processing time are no longer an issue and storage
capacity for large volumes of satellite data is also no problem, not even so much from a
financial point of view. So, a challenge for climate data visualization is how to put this large
amount of data available for users. Fig.01 illustrates the potential of applying visualization
techniques to better understand climate data. Using just one dimension, numbers and
characters are used to represent and present the data. If the colors are added, we have another
dimension and it's easier to highlight some kind of specific information. Maps give us another
kind of information where we can also add colors, numbers or characters. 3D surfaces are
very common when we need to give extra information to maps, also they can show vegetation
and other ground features.
6128
Anais XVII Simpósio Brasileiro de Sensoriamento Remoto - SBSR, João Pessoa-PB, Brasil, 25 a 29 de abril de 2015, INPE
Figure 1. Visualization Techniques applied to Climate Data.
In this work, some products were used as satellite image, meteograms, online weather
forecast, wind maps and online video.
The satellite image is a file obtained by remote sensing technique, where the instruments
is used onboard satellite sensors that capture electromagnetic energy reflected by the Earth's
surface. The file contains physical information of the atmosphere and land surface that can
identify targets through the spectral response detected by satellite sensors. These files are
processed by software decoders of data generated and transformed in clouds temperature
information and classified by colors that determine the maximum and minimum thresholds
found.
The meteogram information is generated by models from observational data of
meteorological variables such as temperature, humidity, wind, pressure, precipitation and
others. With this information the models are able to perform a simulation of the behavior of
these variables for a particular period may vary in hours or even days. Therefore, soon after it
generated a combination of all the variables separated throughout the simulation period and
the end user receives a past, current and forecasted weather situation.
The online weather forecast is the simplified version of a meteorological analysis, made
for a user who does not have the technical knowledge to understand the information provided.
A weather forecast is a situation analysis of the past and present time, allowing a description
of the future. These analyzes are based on observations of several techniques that utilize
information like weather models, satellite images, and other complementary observational
data. Thus the predictions are generated for a future period, this may be very short-term (for a
period of hours), short term (to a maximum three days) or long term (maximum 7 days).
Prognostic with larger periods than 7 days can contain many errors due to the atmosphere is a
dynamic system where changes that may lead to a completely different situation may occur
analyzed.
Earth Wind Map is a web application, or rather an interactive map, developed by
Cameron Beccario at the beginning of 2014. The way it works is very similar to Google
Earth, even in the way it presents itself, after loading the page it shows the terrestrial globe in
the foreground. Through the use of animation, the propagation direction of the flows of the
wind is clearly expressed in a visual way. The floating effect of the lines propagating on the
surface of the earth, gives a perfect idea of the path that the winds are currently taking. At the
same time, the intensity of the winds is expressed through a gradient of color: light breezes
will have a blue-green color, to change to a yellow color for twenty medium power, until you
get to the more intense red colors for high winds and strong winds, Nelli (2014).
6129
Anais XVII Simpósio Brasileiro de Sensoriamento Remoto - SBSR, João Pessoa-PB, Brasil, 25 a 29 de abril de 2015, INPE
The online video is acquired by video cams that are used to monitor transit system. These
streams afforded a real time visualization view of the actual situation in specific points in host
cities. This kind of information is complementary to other information such as satellite
images, meteograms, forecasts and winds. This service allowed to users to visualize the
weather conditions in the vicinity of the World Cup stadiums.
According with Barbosa (2013) The EUMETCast system is destined to the retransmission
to users in various points on the planet, of codified data and products originating from
meteorological, oceanographic, and environmental satellites, via telecommunication
commercial geostationary satellites in different frequencies.
At LAPIS they are archived in compressed form on external drives linked to the
LAPIS network, and accessible through ordinary PCs. The PC system has a built in DVB-S
card that is connected to the dish and besides the EUMETCast Key Unit (EKU), which
hold the key for encrypting the received data, Barbosa et al (2013).
The system-configuration provides a low cost alternative to the “non-traditional
meteorological” user community in Brazil applying the MSG data to a multitude of
important environmental science related applications. The MSG capabilities and current
favorable data distribution policy-license agreement of EUMETSAT, for Research and
Education Institutes like the Federal University of Alagoas (UFAL), have recently
opened the way for new initiatives, Barbosa et al (2014).
Figure 02. Overview of the broadcasting ground reception and processing system at the
University of Alagoas (UFAL) in Brazil.
The application outline is shown in Fig. 03. The satellite images were generated by
LAPIS, through a system of reception of data from Meteosat-10. These data are sent through
the internal network to a processing server, where every 15 minutes an algorithm, written in C
language and shell script programming, is executed by performing the decompression process,
calibration (calculation of the physical parameters obtained by satellite) classification and
image customization. Each processing resulting in an image that is stored in a database image
on the web server LAPIS.
For animation of the images we used a algorithm written in PHP, where he accessed the
database server, selected the 10 latest images, which enabled the user to have the notion of
two hours and 30 minutes last time
6130
Anais XVII Simpósio Brasileiro de Sensoriamento Remoto - SBSR, João Pessoa-PB, Brasil, 25 a 29 de abril de 2015, INPE
Figure 03. Application Outline.
The wind map, meteograms, aircraft monitoring, cameras and location were obtained by
external servers that provide this information through the web to serve society. The wind map
were obtained from the Global Forecast System server (National Climatic Data Center,
NOAA); the meteograms were provided by Norwegian Meteorological Institute and its
international partner institutions such as European Centre for Medium-Range Weather
Forecasts (ECMWF) and European Organisation for the Exploitation of Meteorological
Satellites (EUMETSAT); the aircraft monitoring was provide by Flightradar24 is an internetbased service that shows real-time aircraft flight information on a map; the cameras
monitoring were provided by the monitoring service Veja ao vivo; and the location service
was provide of the google maps.
To frame assembly language features of HTML and Java script programming such as
tables, links, drop downs, iframes, email service, among other hits counter were used. In the
Home menu a drop down was used for the selection of cities Cup. Some items on this page
were dynamic depending on the chosen city as cameras, maps and meteograms, others did not
need because its scope was all over Brazil. For maps of winds, satellites, aircraft tracking and
location of cameras, the iframe resource was used. In the e-mail service and number of
accesses, the junction of HTML and Java script were used.
3. Results and Discuss
Throughout the period of the Cup games looking for weather information was intense, as
if dealing with a rainy season and where the highest concentration of the games were in the
South and Southeast, which generally rainfall are affected by weather systems such as cold
fronts. So, the LAPIS Lab has the application “LAPIS na Copa” shown in Fig. 03.
In this sense the satellite images and the behavior of the winds were of great importance,
due to its applicability in terms of scale, because these two pieces of information were
available on a broad vision for the whole Brazil. Moving to a smaller scale, meteograms
exercised a function to provide local information on the behavior of winds, temperature,
precipitation and a short-term forecast of the weather conditions of the headquarters Cup
cities. However the user already had two scales to check the weather and still had cameras
that proved all other information available on the site.
6131
Anais XVII Simpósio Brasileiro de Sensoriamento Remoto - SBSR, João Pessoa-PB, Brasil, 25 a 29 de abril de 2015, INPE
Figure 03. Application: “LAPIS na COPA.
On 13 to June 16, a weather system affected the city of Natal, RN, Fig. 04, which left the
city headquarters in calamity causing the cancellation of events like the Fifa Fan Fest, after
flooding of streets that are in surrounding the location of the party, and among other
inconvenience caused.
Figure 04. Visualization by “LAPIS na COPA” for Natal.
The Lapis service made in the canopy coverage during this period and was where had the
highest number of hits shown in Fig.05.
6132
Anais XVII Simpósio Brasileiro de Sensoriamento Remoto - SBSR, João Pessoa-PB, Brasil, 25 a 29 de abril de 2015, INPE
1400
Access Number
1200
1000
800
600
400
200
0
12/jun 13/jun 14/jun 15/jun 16/jun
Period (days)
Figure 05. “Number of hits "LAPIS in COPA" during the 12th at 16th June.
4. Conclusion
The Space based technological platforms ,instrumentation, sensors and tools, ground and
ocean based sensing buoys, stations and networks needs to be developed generally for: 1-To
assist decision makers to identify, visualize and assess alternatives or options for adaptation in
environmentally protected areas; 2- For ground-based surveys, to assess the vulnerability of
ecosystems and the services they provide; 3- For applications to contribute to the
measurement or quantification of the services provided by natural forests; 4- To assess the
vulnerability of communities and their livelihoods; agriculture; and urban and rural
communities; the potential loss and damage due to sea-level rise, increased and more
frequent droughts, storms, and landslides and floods triggered by such storms; 5- To assist
decision makers staffs, mainly from the oil and gas off-shore companys, to identify, visualize
and assess alternatives or options for adaptation in their ocean bay and coastal areas exposed
to such hydrometeorological phenomena.
Develop a EUMETSAT/EUMETcast Program prospective study in joint collaboration
with the focal point in Brazil LAPIS/UFAL, to provide support for the second and third
generation EUMETSAT/EUMETcast pilot platform provisioning in Brazil.
Acknowledgment
The EUMETSAT by support in the satellite images and LAPIS team by effort and dedication.
References
Barbosa, H. A. Sistema EUMETCast: Uma abordagem aplicada dos Meteosat Segunda Geração.
1ed.Maceió: EDUFAL, v.2, 186p. 2013.
Barbosa, H., Ertük, A.G., and Silva, L. R. M. Using the meteosat-9 images to the detection of deep Convective
systems in brazil. Journal of Hyperspectral Remote Sensing. V. 12, 069-082. 2012.
Barbosa, H., Silva, L. R. M., Santos, A. M., Neto, C. P. S. A step beyond visualization: how to ingest Meteosat
Second Generation satellite data and products into McDAS-V, ILWIS and Terra MA2. Journal of
Hyperspectral Remote Sensing. V. 4 n.1, 01-15. 2014.
Nelli, F. 2014. Earth Wind Map: la web application per i dati atmosferici. Accessed: 05.aug.2014. Avaliable:
<http://www.meccanismocomplesso.org/earth-wind-map/>.
Tavares, Tatiana A., and Humberto A. Barbosa. "A Step Beyond Visualization: Applying User Interface
Techniques to Improve Satellite Data Interaction." Human Interface and the Management of Information.
Information and Knowledge Design and Evaluation. Springer International Publishing, 98-107. 2014.
6133
Download