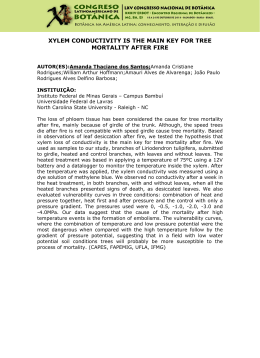
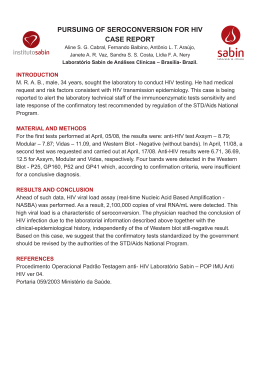
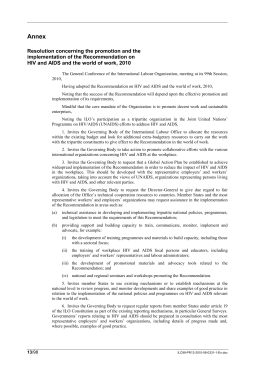
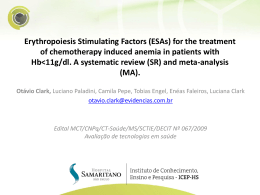
Research Declining child mortality in northern Malawi despite high rates of infection with HIV A Jahn,a S Floyd,a AC Crampin,a H Mvula,b V Mwinuka,b E Mwaiyeghele,b N McGrath,a B Zaba,a PEM Finea & JR Glynna Objective To determine whether routine surveys, such as the Demographic and Health Surveys (DHS), have underestimated child mortality in Malawi. Methods Rates and causes of child mortality were obtained from a continuous-registration demographic surveillance system (DSS) in Malawi for a population of 32 000. After initial census, births and deaths were reported by village informants and updated monthly by project enumerators. Cause of death was established by verbal autopsy whenever possible. The likely impact of human immunodeficiency virus (HIV) infection on child mortality was also estimated from antenatal clinic surveillance data. Overall and age-specific mortality rates were compared with those from the 2004 Malawi DHS. Findings Between August 2002 and February 2006, 38 617 person–years of observation were recorded for 20 388 children aged < 15 years. There were 342 deaths. Re-census data, follow-up visits at 12 months of age and the ratio of stillbirths to neonatal deaths suggested that death registration by the DSS was nearly complete. Infant mortality was 52.7 per 1000 live births, under-5 mortality was 84.8 per 1000 and under-15 mortality was 99.1 per 1000. One-fifth of deaths by age 15 were attributable to HIV infection. Child mortality rates estimated with the DSS were approximately 30% lower than those from national estimates as determined by routine surveys. Conclusion The fact that child mortality rates based on the DSS were relatively low in the study population is encouraging and suggests that the low mortality rates estimated nationally are an accurate reflection of decreasing rates. Une traduction en français de ce résumé figure à la fin de l’article. Al final del artículo se facilita una traducción al español. .الرتجمة العربية لهذه الخالصة يف نهاية النص الكامل لهذه املقالة Introduction Global child mortality rates declined by 2.5% annually between 1960 and 1990, but the decline was slowest in sub-Saharan Africa.1 The fourth United Nations Millennium Development Goal (MDG4) is to reduce child mortality by two-thirds by 2015.2 Although some countries have made dramatic gains in child survival, more improvement is needed, especially in the sub-Saharan region. Malawi had the second highest under-5 mortality rate in southern and eastern Africa in 1990. In contrast to Kenya, Zambia and Zimbabwe, where rates have stabilized or increased, Malawi saw a substantial, steady decline,3 from 221 per 1000 live births in 1990 to 120 per 1000 by 2006.4–6 However, to achieve MDG4 an increase in the annual rate of decline from 3.5% to 5.4% is needed.7 Estimating child mortality levels and trends is difficult.8 In the absence of vital registration systems in most developing countries, mortality is estimated indirectly, from censuses and surveys,6,9 particularly Demographic and Health Surveys (DHS) and World Fertility Surveys. These estimates are subject to several errors, including omission of births and deaths, misreporting of age and omission of maternal orphans (since mothers are the source of information).1 In Malawi under-5 mortality has decreased, but estimates have shown considerable variation,4–6 so the actual rate, and therefore the likely future trajectory, are not clear.10 Many of the problems in estimation occur because data are collected retrospectively. These problems can be overcome by using demographic surveillance data. In generalized epidemics of human immunodeficiency virus (HIV) infection, paediatric acquired immunodeficiency syndrome (AIDS) and orphanhood have started to erode recent gains in child survival.1,11,12 The relative impact of HIV infection on child mortality depends on the background level of mortality from other causes.13 A model based on national HIV infection prevalence in pregnant women, average risk of mother-to-child transmission and survival probabilities in infected children, with adjustment for competing causes of death, predicted a mean rate of under-5 mortality attributable to HIV infection for Malawi in 1999 of 20.9 per 1000 births (plausible range 12.8–31.0).14 To help validate national estimates based on routine surveys, we used data from Malawi’s only demographic surveillance system to determine child mortality rates between 2002 and 2006 and to estimate the effect of HIV infection on these rates. Methods Demographic surveillance We set up a continuous-registration demographic surveillance system (DSS), covering a population of 32 000, in Karonga district (northern Malawi) in 2002. 15 An initial house-tohouse census (baseline census) recorded personal identifiers and sociodemographic data for all individuals, and economic data and physical location for every household. Demographic surveillance was started in 230 geographically-defined clusters, each containing 15–60 households, immediately after completion of the baseline census in a given cluster. Within each cluster, one village informant was trained to record births, deaths and Infectious Disease Epidemiology Unit, London School of Hygiene and Tropical Medicine, Keppel Street, London, WC1E 7HT, England. Karonga Prevention Study, Chilumba, Malawi. Correspondence to Judith Glynn (e-mail: [email protected]). (Submitted: 10 December 2009 – Revised version received: 1 March 2010 – Accepted: 1 March 2010 – Published online: 10 May 2010 ) a b 746 Bull World Health Organ 2010;88:746–753 | doi:10.2471/BLT.09.075085 Research Declining child mortality in Malawi despite HIV A Jahn et al. migrations. Project field staff followed up and recorded births and deaths monthly and migrations annually. To check completeness of infant death registration, all babies whose birth was recorded in the DSS and who were not known to have died or migrated out of the area were visited at 12 months of age. This follow-up visit detected only one extra infant death among 662 eligible babies. The total DSS population was re-censused after 2 years. This showed that the monthly and annual reporting system had registered 99% of deaths, 97% of births and 92% of migrations.15 This report includes data from the beginning of the DSS in August 2002 until February 2006. Although the initial protocol was limited to live births, fetal deaths were also reported. To encourage reporting of early infant deaths, from March 2003 village informants were asked to report fetal deaths routinely, including miscarriages (fetal death before 7 months of gestation) and stillbirths (babies born dead after 7 months of gestation). Causes of death Verbal autopsy interviews were conducted, if consent was given, by a medical assistant in the local language (Chitumbuka) with the most immediate caregiver who could be traced. Interviewers used standard semistructured questionnaires developed for neonatal deaths (ages 0–28 days) or child deaths (ages 29 days–14 years). Both instruments were similar to the INDEPTH verbal autopsy tool,16 an adaptation of the World Health Organization (WHO) verbal autopsy questionnaire.17 Additionally, whenever available, patient-held health documents were reviewed together with any hospital records for children for whom the cause of death was unclear from other information. Three individuals (physicians or experienced clinical officers) independently reviewed each verbal autopsy to assign the likely underlying cause of death. Any information on maternal HIV infection status from other research studies was made available to the reviewers. In accordance with WHO verbal autopsy standards,18 HIV/AIDS was assigned as a cause of death if symptoms suggested immunosuppression in the absence of other obvious causes, taking into account any available information on maternal HIV infection or AIDS death and any prior diagnoses of suspected HIV infection. Discrepantlycoded cases were discussed and resolved if possible, or coded as “nonspecifiable” if consensus could not be reached. HIV exposure HIV status was not routinely determined during the study. We estimated the number of children born to HIV-infected mothers in the study population and applied the probabilities of death in this group found in other studies without antiretroviral therapy (ART) or cotrimoxazole.19–22 Unlinked anonymous HIV serosurveillance was done at two antenatal care clinics within the DSS area.23–25 Birth registration in the DSS included information on antenatal clinic attendance; this information allowed us to estimate the proportion of mothers who attended these two clinics. Antenatal clinic registers showed that the rates of attendance varied little with time, so we assumed the pattern of antenatal clinic access was the same before the start of demographic surveillance. Maternal HIV infection rates were estimated from the age-specific HIV infection prevalence at the two antenatal clinics, applied to the mother’s age group at the time of giving birth. Maternal HIV prevalence was approximately 11% at the larger clinic and approximately 7% at the smaller, more rural clinic. Prophylaxis to prevent mother-tochild transmission was not generally available during the study period, but 44 HIV+ women identified at one of the antenatal clinics in another study received the maternal and paediatric dose of nevirapine. The free national ART programme started in June 2004, with the first clinic opening in Karonga district in June 2005, 80 km from the study area. At that time children were only treated at specialized facilities. No pregnant women were started on ART during this period, making it unlikely that vertical transmission and HIV-related infant mortality were reduced by ART roll-out. Cotrimoxazole prophylaxis became available in ART clinics in late 2005, but it is unlikely that any children in the study population had received this by February 2006. Statistical analysis Overall and cause-specific mortality rates were calculated. Observation time for each child began when the child was first seen in the baseline census, at birth or at the time of migration into the area after the baseline census. Observation time ended at the time of death (if the child Bull World Health Organ 2010;88:746–753 | doi:10.2471/BLT.09.075085 was still a member in a household in the area at the time of death) or at the time of migration out of the surveillance area. Multiple episodes of observation and gaps were allowed if the child moved out of the surveillance area and later returned. All analyses were done with Stata 10.0 software (Stata Corporation, College Station, United States of America). To estimate AIDS mortality, the failure event was death from AIDS or “tuberculosis or AIDS”. Deaths from all other known or unknown causes were censored. To estimate non-AIDS mortality, the failure event was death from causes other than AIDS or “tuberculosis or AIDS”. Deaths from AIDS or from “tuberculosis or AIDS” were censored, along with deaths from unknown causes. Standard child mortality indicators were calculated from the Kaplan–Meier function as the cumulative risks of death at the age of 28 days, 12 months, 24 months, 5 years and 15 years. The probability of dying between ages x and [x + n] (known as nqx) was calculated from the Kaplan–Meier survival function as 1− proportion surviving at age [ x + n] proportion surviving at age x This yielded the risk of death before the age of [x + n], conditional on having survived to age x. The completeness of ascertainment of deaths was assessed from the distribution of age at death. Stillbirths were included, since stillbirths and early infant deaths were more likely to be missed than deaths of older children 26–29 and the number of stillbirths was expected to exceed the number of neonatal deaths in the population.29 Overall and age-specific mortality rates were compared with those estimated by the 2004 Malawi DHS.30 Results Between August 2002 and February 2006, 20 388 children under 15 years of age were observed in the study population, and a total of 38 617 person–years of observation were obtained. Of these children, 13 450 (66.0%) were seen in the baseline census, 3251 (16.0%) migrated into the study area and 3687 (18.1%) were born during the observation period. The 747 Research A Jahn et al. Declining child mortality in Malawi despite HIV Table 1. Kaplan–Meier mortality risk by age group, per 1000 live births, in Karonga district, Malawi, 2002–2006 Age group Neonatal Postneonatal Infant 24-mo Child 1–4 yr Under 5 yr Child 5–14 yr Child < 15 yr Death between ages 0–28 d 29 days–12 mo 0–12 mo 0–24 mo 1–5 yr 0–5 yr 5–15 yr 0–15 yr Boys and girls, all causesa Boys and girls, AIDSa Boys and girls, non-AIDSa Deaths Risk 95% CI Deaths Risk 95% CI Deaths Risk 95% CI 83 112 195 256 109 304 38 342 22.4 31.0 52.7 70.0 34.0 84.8 15.5 99.1 18.1–27.7 28.4–33.6 46.0–60.4 62.2–78.7 31.7–36.4 76.2–94.6 14.4–16.7 89.5–109.7 0 22 22 39 28 50 13 63 0 6.2 6.2 11.3 8.9 15.0 5.4 20.3 4.1–9.4 4.1–9.4 8.3–15.4 7.3–10.4 11.4–19.7 4.5–6.3 15.8–25.9 80 87 167 210 76 243 25 268 21.6 24.1 45.2 57.5 23.8 67.9 10.2 77.4 17.4–26.9 22.0–26.2 39.0–52.4 50.4–65.6 22.0–25.6 60.1–76.7 9.4–11.2 68.9–87.0 AIDS, acquired immunodeficiency syndrome; CI, confidence interval. a Eleven deaths from unknown causes were censored, so non-AIDS and AIDS-specific mortality risks do not total the all-cause mortality risk. Verbal autopsies Of 342 verbal autopsy interviews, 174 (50.9%) were conducted within 30 days of death and 274 (80.1%) within 60 days. The informant was a parent in 259 (75.7%) and a grandparent in 78 (22.8%) cases. In 320 (93.6%) cases the informant had cared for the child on the day of death or for most of the terminal illness. The availability of patient-held documents that might help to assign cause of death was analysed for the 149 verbal 748 autopsies obtained between February 2005 and February 2006. Documents were available for 48 (32.2%) cases. In other cases documents were missing because they had never been issued (46, 30.9%), had been destroyed after the death (29, 19.5%) or had been misplaced (26, 17.4%). Recent information on maternal HIV status was available for 67 (19.5%) of the 342 child deaths. In 24 cases the mother was known to have HIV infection, although AIDS was not automatically assigned as a cause of death. In 43 cases there was a negative test result from within 2 years of the child’s death. Table 1 shows child mortality rates by age group. The infant and under-5 mortality rates were 52.7 and 84.8 per 1000 live births, respectively. The cumulative risk of death by age 15 years was 99.1 (95% confidence interval, CI: 89.5–109.7) per 1000 births. Postneonatal mortality was 31.0 (28.4–33.6) per 1000 infants surviving the first month of life and mortality in children 1 to 4 years of age was 34.0 (31.7–36.4) per 1000 children who survived the first year of life. Fig. 1 shows the age- and sex-specific mortality rates from all causes. During infancy mortality was relatively high. Mortality was lower for girls than boys in the postneonatal period (relative risk, RR: 0.68; 95% CI: 0.46–0.99) and between the ages of 5 and 14 years (RR: 0.51; 95% CI: 0.26–0.99). After the change in March 2003 to include routine reporting of miscarriages and stillbirths, a total of 68 miscarriages All-cause mortality Of the 304 deaths in children aged less than 5 years, 83 (27.3%) occurred in the neonatal period (45 in the first week), 112 (36.8%) in the postneonatal period and 109 (35.9%) in children aged 1–4 years. Fig. 1.Age- and sex-specific all-cause mortality among children according to the demographic surveillance system,a Malawi, 2002–2006 Boys Girls 60 Deaths, all causes (per 1000 PYO) median observation time was 2.0 years (range: 1 day to 3.5 years). By the end of February 2006, 15 591 (76.5%) children under 15 years were alive in the study area, 1764 (8.7%) had reached their 15th birthday, 2691 (13.2%) had migrated out and 342 (1.7%) had died. Of those who died, 197 were born during the observation period, 124 had been seen in the baseline census and 21 were in-migrants. There were 197 deaths among boys and 145 among girls. Death occurred at a health centre or hospital in 192 (56.1%) children, at home in 107 (31.3%), at a relative’s household in 11 (3.2%) and at the household of a traditional healer or traditional birth attendant in 10 (2.9%); 22 (6.4%) children died in other places. Precise dates were available for all births and deaths that occurred during the observation period. Of the 10 414 children who were under 5 years old at enrolment, 8357 (80.2%) had a precise date of birth. The day of birth was missing for 1007 (9.7%), and only the year of birth was known for 1050 (10.1%). Of the 9974 children aged 5–14 years at enrolment, the exact date of birth was known for 1672 (16.8%); the day was missing for 2374 (23.8%) and only the year was known for 5928 (59.4%). 50 40 30 20 10 0 0 1 2 3 4 5 6 7 8 9 10 11 12 13 14 Age (years) PYO, person–years of observation for children < 15 years of age. a 342 deaths in 38 617 person–years of observation. Bull World Health Organ 2010;88:746–753 | doi:10.2471/BLT.09.075085 Research Declining child mortality in Malawi despite HIV A Jahn et al. Fig. 2.Proportiona of stillbirths and deaths in children under 2 years of age according to the demographic surveillance system (DSS), 2002–2006, and the 2004 Malawi Demographic and Health Survey (MDHS),b Malawi 30 Proportion (%) DSS 2002–2006 (86 stillbirths, 256 deaths) MDHS 2004 (168 stillbirths, 823 deaths) 20 10 Stillbirths 0 a 0 1 2 3 4 5 6 7 8 9 10 11 12 13 14 15 16 17 18 19 20 21 22 23 Age at death (months) Proportions are shown using all stillbirths and deaths in children under 2 years of age as the denominator. For the period 0–4 years before the demographic surveillance survey. b and 86 stillbirths were recorded, as well as 3678 live births and 83 neonatal deaths. The resulting ratio of stillbirths to neonatal deaths was 1.04 and the stillbirth rate was 22.8 per 1000 deliveries. Fig. 2 compares the distribution of stillbirths and ages at death estimated with the DSS and the 2004 Malawi DHS30. Causes of death Table 2 shows causes of death by age and sex. The greater infant mortality among boys was attributed to both communicable (77 boys, 52 girls) and noncommunicable diseases (33 boys, 21 girls). “Likely AIDS” (AIDS and “tuberculosis or AIDS”) was the single most common cause, accounting for 50 of 304 (16.4%) deaths in children under 5 and for 63 of 342 (18.4%) deaths in children under 15. The proportion of deaths occurring at hospitals or health centres was similar for likely AIDS deaths (52.4%) and nonAIDS deaths (58.2%). In the neonatal period, 23 (28.4%) of 81 deaths were attributed to prematurity or low birth weight, 20 (24.7%) to neonatal sepsis and 15 (18.5%) to asphyxia or birth injury. In the postneonatal period, 25 (21.9%) of 114 deaths were attributed to pneumonia, 22 (19.3%) to AIDS, 22 (19.3%) to diarrhoea, 15 (13.2%) to non-specifiable acute febrile illness and 9 (7.9%) to malaria. In children aged 1–4 years, 28 of 109 deaths (25.7%) were attributed to AIDS, and in those aged 5–14 years, 12 of 38 deaths (31.6%) were attributed to AIDS. Table 1 shows the cumulative mortality risks from AIDS and non-AIDS causes. The infant risk of death from non-AIDS causes was 7.3-fold higher than the risk of death from AIDS. The mortality risk ratio (non-AIDS versus AIDS) was 2.7 for children aged 1–4 years and 1.9 for children aged 5–14 years. Assuming unchanged mortality and infection rates, the cumulative probability of death from AIDS was 15.0 per 1000 by age 5 years and 20.3 per 1000 by age 15 years. The probability of death from nonAIDS causes was 67.9 per 1000 by age 5 years and 77.4 per 1000 by age 15 years. HIV exposure and mortality Information on antenatal clinic attendance was available for all but one of the 3687 births registered in the DSS. Among these mothers, 3638 (98.7%) reported having attended an antenatal clinic during pregnancy, and 80.8% of them attended one of the two clinics that recorded HIV serosurveillance data. This allowed us to estimate that 298 (10.7%) of 2786 children whose mothers attended these two clinics were exposed to HIV infection. If we assume that the nevirapine prophylaxis given to the 44 mothers and infants reduced HIV transmission by half, then approximately 10% of babies in the DSS were exposed to HIV. And if we assume a cumulative risk of HIV infection of 30% by 24 months of age19 and an excess risk of death of approximately 50% in infants with HIV infection by this age,19–22 the Bull World Health Organ 2010;88:746–753 | doi:10.2471/BLT.09.075085 estimated risk of HIV-related death by 24 months is 15 per 1000 births, compared with 11 per 1000 estimated by verbal autopsy. Discussion Infant and under-5 mortality in Malawi during the period from 2002 to 2006 were 53 and 85 per 1000 births, respectively, in the study population covered by the DSS. Such figures are considerably lower than estimates from the 2004 DHS (76 per 1000 and 133 per 1000, respectively)30 or from World health statistics for 2006 (76 per 1000 and 120 per 1000 respectively).3 Separate estimates for Karonga district were not available for 2004, but in the 2000 DHS, this district had the lowest child mortality rates in the country: infant mortality and under-5 mortality were 13% and 28% below the national average, respectively.31 If we assume that the relative survival by district was the same in 2000 as in 2004 infant mortality would be 66 per 1000 and under-5 mortality would be 96 per 1000. In addition, based on whole population survey data from the 1980s, the mortality rates in the southern part of Karonga district, where the DSS area was located, were 23% lower than in the northern part of the district.32 In the 1980s the district-wide estimate of infant mortality was 120 per 1000, and under-5 mortality was 190 per 1000,32 which were also lower than contemporary national estimates. The 2004 DHS estimates were probably influenced by misclassification. Some stillbirths were probably reported as neonatal deaths, since the ratio of stillbirths to neonatal deaths was 37% and there was evidence of inaccurate age reporting, with “heaping” at 12 months (Fig. 2).30 When child mortality rates decline, period averages derived from birth histories are known to conceal the pattern and degree of change,33 leading to overestimation of child mortality from the DHS. For example, in the United Republic of Tanzania the 2005 DHS estimate for under-5 mortality was 112 per 1000 for the period from 2000 to 2004, whereas the recalculated estimate for the year 2004 was 83 per 1000.33 HIV infection had a considerable impact on child mortality, with approximately 11, 15 and 20 out of every 1000 children born dying from AIDS (according to verbal autopsies) by age 2, 5 and 15 years. The sensitivity of child verbal autopsies for HIV infection and AIDS 749 750 8.6 3.4 – – – 6.0 28.4 10 4 0 0 0 7 33 1 0 1 5 116 External causes Accidental Unknown intent Subtotal Unknown Total 4 0 4 4 56 0 1 0 0 0 6 7 0 3 41 8 4 0 4 7 5 0 10 7.1 – 7.1 7.1 100 – 1.8 – – – 10.7 12.5 – 5.4 73.2 14.3 7.1 – 7.1 12.5 8.9 – 17.9 Boys 4 1 5 0 25 0 2 0 0 0 2 4 0 3 16 8 0 0 2 1 0 0 2 No. 16.0 4.0 2 – 100 – 8.0 – – – 8.0 16.0 – 12.0 64.0 32.0 – – 8.0 4.0 – – 8.0 % 5–14 yr AIDS, acquired immunodeficiency syndrome; HIV, human immunodeficiency virus. 0.9 – 0.9 4.3 100 10.3 2.6 66.4 3 77 12 10.3 – 0.9 12.9 6.0 13.8 10.3 9.5 12 0 1 15 7 16 12 11 % No. No. % 1– 4 yr 0–11 mo Noncommunicable diseases Prematurity/low birth weight Asphyxia/birth injury Congenital disorders Cardiovascular Respiratory Cancer Other Subtotal HIV/AIDS Tuberculosis or HIV/AIDS Tuberculosis Pneumonia Malaria Diarrhoea Neonatal sepsis Acute febrile disease, nonspecific Other Subtotal Communicable diseases Probable cause of death 9 1 10 9 197 10 7 0 0 0 15 44 12 9 134 28 4 1 21 15 21 12 23 No. 4.6 0.5 5.1 4.6 100 5.1 3.6 – – – 7.6 22.3 6.1 4.6 68.0 14.2 2.0 0.5 10.7 7.6 10.7 6.1 11.7 % Total 1 1 2 4 79 8 1 0 0 0 1 21 11 1 52 8 2 0 17 3 6 8 7 No. 1.3 1.3 2.5 5.1 100 10.1 1.3 – – – 1.3 26.6 13.9 1.3 65.8 10.1 2.5 – 21.5 3.8 7.6 10.1 8.9 % 0–11 mo 6 0 6 1 53 0 1 0 1 1 3 6 0 1 40 15 1 0 3 8 4 0 8 No. 11.3 – 11.3 1.9 100 – 1.9 – 1.9 1.9 5.7 11.3 – 1.9 75.5 28.3 1.9 – 5.7 15.1 7.5 – 15.1 % 1– 4 yr Girls 2 0 2 0 13 0 0 1 0 0 2 3 0 0 8 4 1 0 1 0 0 0 2 No. 15.4 – 15.4 – 100 – – 7.7 – – 15.4 23.1 – – 61.5 30.8 7.7 – 7.7 – – – 15.4 % 5–14 yr 9 1 10 5 145 8 2 1 1 1 6 30 11 2 100 27 4 0 21 11 10 8 17 No. 6.2 0.7 6.9 3.4 100 5.5 1.4 0.7 0.7 0.7 4.1 20.7 7.6 1.4 69.0 18.6 2.8 – 14.5 7.6 6.9 5.5 11.7 % Total 2 1 3 9 195 18 5 0 0 0 8 54 23 4 129 20 2 1 32 10 22 20 18 No. 1.0 0.5 1.5 4.6 100 9.2 2.6 – – – 4.1 27.7 11.8 2.1 66.2 10.3 1.0 0.5 16.4 5.1 11.3 10.3 9.2 % 0–11 mo 10 0 10 5 109 0 2 0 1 1 9 13 0 4 81 23 5 0 7 15 9 0 18 No. 9.2 – 9.2 4.6 100 0.9 0.9 8.3 11.9 – 1.8 – 3.7 74.3 21.1 4.6 – 6.4 13.8 8.3 – 16.5 % 1– 4 yr 6 1 7 0 38 0 2 1 0 0 4 7 0 3 24 12 1 0 3 1 0 0 4 No. 15.8 2.6 18.4 – 100 – 5.3 2.6 – – 10.5 18.4 – 7.9 63.2 – 10.5 31.6 2.6 – 7.9 2.6 % 5–14 yr Boys and girls Table 2. Probable causes of death in 342 children under 15 years of age in Karonga district, Malawi, according to the demographic surveillance system, 2002–2006 18 2 20 14 342 18 9 1 1 1 21 74 23 11 234 55 8 1 42 26 31 20 40 No. 5.3 0.6 5.8 4.1 100 5.3 2.6 0.3 0.3 0.3 6.1 21.6 6.7 3.2 68.4 16.1 2.3 0.3 12.3 7.6 9.1 5.8 11.7 % Total Research Declining child mortality in Malawi despite HIV A Jahn et al. Bull World Health Organ 2010;88:746–753 | doi:10.2471/BLT.09.075085 Research Declining child mortality in Malawi despite HIV A Jahn et al. is estimated to range from 37% to 60%, and their specificity is estimated to range from 69% to 87%,34,35 but short follow-up intervals, as are used in the DSS, improve the accuracy of verbal autopsy diagnoses,36 and maternal HIV status was known for 20% of child deaths. Triangulation of the verbal autopsy results with expected HIVrelated mortality based on the estimated prevalence of maternal HIV infection suggested that about 73% of the expected AIDS deaths among children under 2 years of age were identified through verbal autopsy. In eight other African countries, HIV infection was estimated to have caused a recent net increase in all-cause child mortality.37 Given the high stable prevalence of HIV infection since the late 1990s in Malawi, the sustained decrease in mortality can only be explained by an accelerated decline in mortality from other causes. Is that plausible? Vaccination documents of children under 5 years old during the baseline census showed delayed vaccination but high eventual coverage,38 and no cases of measles or acute flaccid paralysis had been recorded in the district for several years.38 In the study population almost 80% of children had access to safe water sources (bore holes or piped water). Between the early 1980s and the time of the DSS in 2002, the proportion of the population in the area who lived in burnt brick houses had increased from 25% to 64%, and the proportion of adults with some secondary education had increased from 6% to 24% (Karonga Prevention Study, unpublished data, 2009). Malawi has implemented an integrated management of childhood illness programme, and in the study area we have run a small paediatric clinic at the rural hospital since 2002. The relatively low mortality rates measured in the DSS are likely to be accurate: re-census and follow-up checks at 12 months revealed very few missed deaths (and these were included), and the ratio of stillbirths to neonatal deaths was greater than 1. Dates were known with reasonable accuracy, and most verbal autopsies were conducted soon after death, with close relatives and often with documented information. The finding that the mortality rates based on the DSS were lower than the national estimates may be largely explained by regional differences. The decreases are encouraging and support a real, dramatic improvement in child mortality rates despite the epidemic of HIV infection. However, when 1980s data are used as the baseline, it becomes clear that this area of Malawi still needs to achieve further reductions in child mortality to meet its MDG4 target. ■ Acknowledgements We thank the Government of Malawi for its interest in and support of the Karonga Prevention Study and the National Health Sciences Research Committee of Malawi for permission to publish the paper. Funding: The Karonga Prevention Study is funded by the Wellcome Trust, with contributions from The British Leprosy Relief Association (LEPRA). Competing interests: None declared. ملخص انحسار وفيات األطفال يف شامل ماالوي بالرغم من املعدالت املرتفعة للعدوى بفريوس العوز املناعي البرشي ود ّلت معطيات. وفاة342 ووقعت بينهم. سنة15 من الفئة العمرية دون ونسبة اإلمالص،ً شهرا12 وزيارات املتابعة لألطفال يف عمر،إعادة اإلحصاء لوفيات الولدان عىل أن تسجيل الوفيات يف نظام الرتصد الدميوغرايف كان شبه ّ وكان معدل وفيات.مكتمل وبلغ معدل، لكل ألف مولود حي52.7 الرضع ومعدل الوفيات لألطفال، لكل ألف84.8 سنوات5 وفيات األطفال دون 15 و ُيعزى خمس وفيات األطفال يف عمر. لكل ألف99.1 سنة15 دون وكانت معدالت وفيات.سنة إىل العدوى بفريوس العوز املناعي البرشي ً تقريبا30% األطفال التقديرية حسب نظام الرتصد الدميوغرايف أقل بنسبة .من املعدالت التقديرية الوطنية املستقاة من املسوحات الروتينية االستنتاج الحقيقة يف أن معدالت وفيات األطفال وفقاً لنظام الرتصد الدميوغرايف كانت قليلة نسبياً بني السكان الذين أجريت عليهم الدراسة وهي معدالت تثري التشجيع وتدل عىل أن انخفاض معدالت الوفيات التقديرية .الوطنية يعكس بدقة انحسار هذه املعدالت مثل املسوح الدميوغرافية،الغرض تحديد ما إذا كان تقييم املسوح الروتينية . قد قلل من القدر الفعيل ملعدالت وفيات األطفال يف ماالوي،والصحية الطريقة قام الباحثون بجمع معدالت وأسباب وفيات األطفال عن طريق نظام التسجيل املستمر للرتصد الدميوغرايف يف ماالوي ملجموعة من السكان قام جامعو املعلومات، وبعد اإلحصاء األويل. ألف نسمة32 بلغ تعدادهم يف القرية بتسجيل الوالدات والوفيات التي كان يجري تحديثها شهرياً من أسباب الوفيات، بقدر املستطاع،وح ِددَت ُ .قبل القامئني باإلحصاء يف املرشوع ُ كام أج � ِري تقييم لتأثري العدوى بفريوس.عن طريق الترشيح ال�سردي العوز املناعي البرشي عىل وفيات األطفال من معطيات الرتصد يف عيادات وقورنت معدالت الوفيات اإلجاملية ومعدالت.الرعاية السابقة للوالدة الوفيات الخاصة بأعامر معينة مع نفس املعدالت املتحصل عليها من املسح .2004 الدميوغرايف الصحي يف ماالوي لعام ،2006 فرباير/ حتى شباط2002 أغسطس/املوجودات يف الفرتة من آب 20388 شخصاً يف هذه السنوات ألطفال عددهم38617 ُس ِج َل مشاهدة Résumé Baisse de la mortalité infantile dans le Nord du Malawi malgré les taux élevés d’infection par le VIH Objectif Déterminer si les études de routine, telles que les Études démographiques et sanitaires (Demographic and Health Surveys, DHS), ont sous-estimé la mortalité infantile au Malawi. Méthodes Au Malawi, les taux et les causes de mortalité infantile ont été obtenus par un système de surveillance démographique (SSD) à enregistrement continu, sur une population de 32 000 habitants. Après un recensement initial, les naissances et les décès étaient notifiés par les informateurs des villages, puis mis à jour chaque mois par les agents recenseurs. La cause du décès était établie par autopsie verbale aussi Bull World Health Organ 2010;88:746–753 | doi:10.2471/BLT.09.075085 souvent que possible. L’effet probable de l’infection par le virus de l’immunodéficience humaine (VIH) sur la mortalité infantile était également estimé à partir des données de surveillance provenant des cliniques prénatales. Les taux de mortalité globale et par âge et étaient comparés avec ceux de la DHS du Malawi de l’année 2004. Résultats Entre août 2002 et février 2006, 38 617 personnesannées d’observation ont été enregistrées pour 20 388 enfants de moins de 15 ans. On a compté 342 décès. Les données du nouveau recensement, les visites de suivi à 12 mois et le rapport de la mortinatalité 751 Research Declining child mortality in Malawi despite HIV au décès néonatal indiquent que l’enregistrement des décès par le SSD était presque complet. La mortalité infantile était de 52,7 pour 1 000 naissances vivantes, la mortalité chez les enfants de moins de 5 ans était de 84,8 pour 1 000 et la mortalité chez les enfants de moins de 15 ans était de 99,1 pour 1 000. Un cinquième des décès avant 15 ans était imputable à l’infection par le VIH. Les taux de mortalité A Jahn et al. infantile estimés par le SSD étaient environ 30% inférieurs à ceux des estimations nationales, telles que déterminées par les études de routine. Conclusion Le fait que les taux de mortalité infantile basés sur le SSD étaient relativement faibles au sein de la population à l’étude est encourageant et suggère que les faibles taux de mortalité infantile estimés au niveau national sont une représentation juste de la baisse des taux. Resumen Reducción de las tasas de mortalidad en el Norte de Malawi a pesar de las elevadas tasas de infección por VIH Objetivo Determinar si las encuestas habituales, tales como las encuestas demográficas y de la salud (EDS), han infravalorado la mortalidad infantil en Malawi. censo, las visitas de seguimiento a los 12 meses de edad y la relación Métodos Se obtuvieron las tasas y las causas de mortalidad infantil a partir entre nacidos muertos y muertes neonatales sugerían que el registro de de un sistema de vigilancia demográfica (SVD) con un registro continuo fallecimientos por el SVD era casi completo. La mortalidad infantil fue de en Malawi para una población de 32 000 habitantes. Tras el censo inicial, 52,7 por cada 1000 nacidos vivos; la mortalidad de los niños menores de los informadores locales comunicaron los nacimientos y las defunciones 5 años fue de 84,8 por cada 1000; y la mortalidad de niños menores de y los enumeradores del proyecto actualizaron mensualmente los datos. 15 años fue de 99,1 por cada 1000. Una quinta parte de las defunciones Siempre que fue posible, la causa de la muerte se determinó mediante hasta los 15 años podían atribuirse a una infección por VIH. Las tasas de autopsia oral. Se estimó también el impacto probable de la infección mortalidad infantil estimadas con el SVD fueron aproximadamente un 30% por el virus de la inmunodeficiencia humana (VIH) sobre la mortalidad inferiores a las procedentes de las estimaciones nacionales determinadas infantil, a partir de los datos de vigilancia clínica prenatal. Las tasas de con las encuestas habituales. mortalidad global y por edad se compararon con las tasas obtenidas de Conclusión El hecho de que las tasas de mortalidad infantil basadas en el las EDS de Malawi de 2004. SVD fueran relativamente bajas en la población del estudio es alentador y Resultados Entre agosto de 2002 y febrero de 2006 se registraron sugiere que las bajas tasas de mortalidad estimadas a nivel nacional son 38 617 años-persona de observación correspondientes a 20 388 niños un reflejo exacto de la reducción gradual de dichas tasas. < 15 años. Se produjeron 342 muertes. Los datos de actualización del References 1. Ahmad OB, Lopez AD, Inoue M. The decline in child mortality: a reappraisal. Bull World Health Organ 2000;78:1175–91. PMID:11100613 2. United Nations. United Nations Millennium Declaration (United Nations General Assembly Resolution 55/2). New York: UN; 2000. 3. World Health Organization. World health statistics 2008. Part 2: Global health indicators. Geneva: WHO; 2008. 4. Black RE, Morris SS, Bryce J. Where and why are 10 million children dying every year? Lancet 2003;361:2226–34. doi:10.1016/S01406736(03)13779-8 PMID:12842379 5. United Nations Children’s Fund. The state of the world’s children 2007. New York: UNICEF; 2006. 6. United Nations Children’s Fund, World Health Organization, The World Bank, United Nations Population Division. Levels and trends in child mortality in 2006: estimates developed by the Inter-agency Group for Mortality Estimation. New York: UNICEF, WHO, WB, UNPD; 2007. 7. Bryce J, Daelmans B, Dwivedi A, Fauveau V, Lawn JE, Mason E et al.; Countdown Coverage Writing Group; Countdown to 2015 Core Group. Countdown to 2015 for maternal, newborn, and child survival: the 2008 report on tracking coverage of interventions. Lancet 2008;371:1247–58. doi:10.1016/S0140-6736(07)61694-8 PMID:18406859 8. Child Mortality Coordination Group. Tracking progress towards the Millennium Development Goals: reaching consensus on child mortality levels and trends. Bull World Health Organ 2006;84:225–32. PMID:16583082 9. Brass W, Coale AJ. Methods of analysis and estimation. In: Brass W, Coale AJ, Demeny P, Heisel DF, Lorimer F, Romaniuk A et al., eds. The demography of tropical Africa. Princeton: Princeton University Press; 1968. pp. 88-139. 10. Murray CJ, Laakso T, Shibuya K, Hill K, Lopez AD. Can we achieve Millennium Development Goal 4? New analysis of country trends and forecasts of under-5 mortality to 2015. Lancet 2007;370:1040–54. doi:10.1016/S01406736(07)61478-0 PMID:17889243 11. Garrib A, Jaffar S, Knight S, Bradshaw D, Bennish ML. Rates and causes of child mortality in an area of high HIV prevalence in rural South Africa. Trop Med Int Health 2006;11:1841–8. doi:10.1111/j.1365-3156.2006.01738.x PMID:17176349 752 12. Zaba B, Whiteside A, Boerma JT. Demographic and socioeconomic impact of AIDS: taking stock of the empirical evidence. AIDS 2004;18(Suppl 2):S1–7. doi:10.1097/00002030-200406002-00001 PMID:15319738 13. Marston M, Zaba B, Salomon JA, Brahmbhatt H, Bagenda D. Estimating the net effect of HIV on child mortality in African populations affected by generalized HIV epidemics. J Acquir Immune Defic Syndr 2005;38:219–27. doi:10.1097/00126334-200502010-00015 PMID:15671809 14. Walker N, Schwartländer B, Bryce J. Meeting international goals in child survival and HIV/AIDS. Lancet 2002;360:284–9. doi:10.1016/S01406736(02)09550-8 PMID:12147371 15. Jahn A, Crampin AC, Glynn JR, Mwinuka V, Mwaiyeghele E et al. Evaluation of a village-informant driven demographic surveillance system in Karonga, Northern Malawi. Demogr Res 2007;16:219–48. doi:10.4054/ DemRes.2007.16.8 16. INDEPTH Network. INDEPTH Standardized Verbal Autopsy questionnaire (revised August 2003). Accra: INDEPTH; 2003. Available from: http://www. indepth-network.org/index.php?option=com_content&task=view&id=96&Ite mid=184 [accessed 27 March 2010]. 17. Anker M, Black RE, Christopher C, Kalter HD, Quigley MA, Ross D, et al. A standard verbal autopsy method for investigating causes of death in infants and children. Geneva: World Health Organization; 1999. 18. World Health Organization. Verbal autopsy standards: ascertaining and attributing cause of death. Geneva: WHO; 2007. 19. Marinda E, Humphrey JH, Iliff PJ, Mutasa K, Nathoo KJ, Piwoz EG et al.; ZVITAMBO Study Group. Child mortality according to maternal and infant HIV status in Zimbabwe. Pediatr Infect Dis J 2007;26:519–26. doi:10.1097/01. inf.0000264527.69954.4c PMID:17529870 20. Newell ML, Coovadia H, Cortina-Borja M, Rollins N, Gaillard P, Dabis F; Ghent International AIDS Society (IAS) Working Group on HIV Infection in Women and Children. Mortality of infected and uninfected infants born to HIVinfected mothers in Africa: a pooled analysis. Lancet 2004;364:1236–43. doi:10.1016/S0140-6736(04)17140-7 PMID:15464184 Bull World Health Organ 2010;88:746–753 | doi:10.2471/BLT.09.075085 Research A Jahn et al. 21. Zaba B, Marston M, Crampin AC, Isingo R, Biraro S, Bärnighausen T et al. Age-specific mortality patterns in HIV-infected individuals: a comparative analysis of African community study data. AIDS 2007;21(Suppl 6):S87–96. doi:10.1097/01.aids.0000299415.67646.26 PMID:18032944 22. Zaba B, Whitworth J, Marston M, Nakiyingi J, Ruberantwari A, Urassa M et al. HIV and mortality of mothers and children: evidence from cohort studies in Uganda, Tanzania, and Malawi. Epidemiology 2005;16:275–80. doi:10.1097/01.ede.0000155507.47884.43 PMID:15824540 23. Crampin AC, Glynn JR, Ngwira BM, Mwaungulu FD, Pönnighaus JM, Warndorff DK et al. Trends and measurement of HIV prevalence in northern Malawi. AIDS 2003;17:1817–25. doi:10.1097/00002030-20030815000011 PMID:12891068 24. Crampin AC, Jahn A, Kondowe M, Ngwira BM, Hemmings J, Glynn JR et al. Use of antenatal clinic surveillance to assess the effect of sexual behavior on HIV prevalence in young women in Karonga district, Malawi. J Acquir Immune Defic Syndr 2008;48:196–202. doi:10.1097/QAI.0b013e31817236c4 PMID:18520678 25. White RG, Vynnycky E, Glynn JR, Crampin AC, Jahn A, Mwaungulu F et al. HIV epidemic trend and antiretroviral treatment need in Karonga District, Malawi. Epidemiol Infect 2007;135:922–32. doi:10.1017/S0950268806007680 PMID:17217548 26. Jewkes R, Wood K. Competing discourses of vital registration and personhood: perspectives from rural South Africa. Soc Sci Med 1998;46:1043–56. doi:10.1016/S0277-9536(97)10036-3 PMID:9579756 27. Lumbiganon P, Panamonta M, Laopaiboon M, Pothinam S, Patithat N. Why are Thai official perinatal and infant mortality rates so low? Int J Epidemiol 1990;19:997–1000. doi:10.1093/ije/19.4.997 PMID:2084034 28. Mathers CD, Fat DM, Inoue M, Rao C, Lopez AD. Counting the dead and what they died from: an assessment of the global status of cause of death data. Bull World Health Organ 2005;83:171–7. PMID:15798840 29. Stanton C, Lawn JE, Rahman H, Wilczynska-Ketende K, Hill K. Stillbirth rates: delivering estimates in 190 countries. Lancet 2006;367:1487–94. doi:10.1016/S0140-6736(06)68586-3 PMID:16679161 Bull World Health Organ 2010;88:746–753 | doi:10.2471/BLT.09.075085 Declining child mortality in Malawi despite HIV 30. Mwale MW. Infant and child mortality. In: National Statistics Office [Malawi], ORC Macro, eds. Malawi Demographic and Health Survey 2004. Zomba and Calverton: NSO and ORC Macro; 2005. pp. 123–32. 31. Ndawala JS. Infant and child mortality. In: National Statistics Office [Malawi], ORC Macro, eds. Malawi Demographic and Health Survey 2000. Zomba and Calverton: NSO and ORC Macro; 2001:97–104. 32. Chirwa T, Zaba B, Floyd S, Malema S, Ponnighaus J, Fine PEM. Demographic analysis of the population of Karonga District, northern Malawi, in the early years of the HIV epidemic (1980-90). Southern Afr J Demography 2005;10:1–24. doi:10.1080/03768350500044065 33. Masanja H, de Savigny D, Smithson P, Schellenberg J, John T, Mbuya C et al. Child survival gains in Tanzania: analysis of data from demographic and health surveys. Lancet 2008;371:1276–83. doi:10.1016/S01406736(08)60562-0 PMID:18406862 34. Dowell SF, Davis HL, Holt EA, Ruff AJ, Kissinger PJ, Bijoux J et al. The utility of verbal autopsies for identifying HIV-1-related deaths in Haitian children. AIDS 1993;7:1255–9. doi:10.1097/00002030-199309000-00016 PMID:8216984 35. Nykanen M, Tamaona W, Cullinan T, Van Oosterzee V, Ashorn P. Verbal autopsy as a technique to establish causes of infant and child mortality. East Afr Med J 1995;72:731–4. PMID:8904066 36. Kamali A, Wagner HU, Nakiyingi J, Sabiiti I, Kengeya-Kayondo JF, Mulder DW. Verbal autopsy as a tool for diagnosing HIV-related adult deaths in rural Uganda. Int J Epidemiol 1996;25:679–84. doi:10.1093/ije/25.3.679 PMID:8671573 37. Garenne M, Gakusi E. Health transitions in sub-Saharan Africa: overview of mortality trends in children under 5 years old (1950–2000). Bull World Health Organ 2006;84:470–8. doi:10.2471/BLT.05.029231 PMID:16799731 38. Jahn A, Floyd S, Mwinuka V, Mwafilaso J, Mwagomba D, Mkisi RE et al. Ascertainment of childhood vaccination histories in northern Malawi. Trop Med Int Health 2008;13:129–38. doi:10.1111/j.1365-3156.2007.01982.x PMID:18291011 753
Download