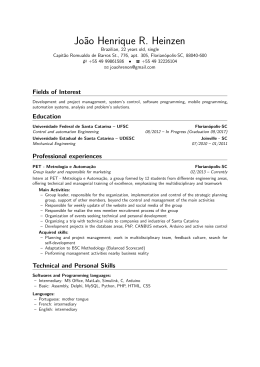
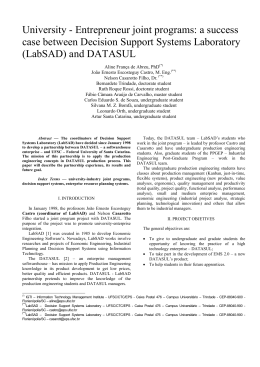
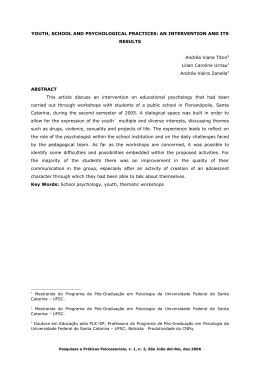
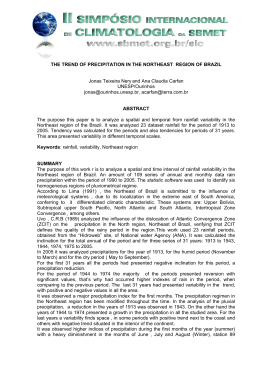
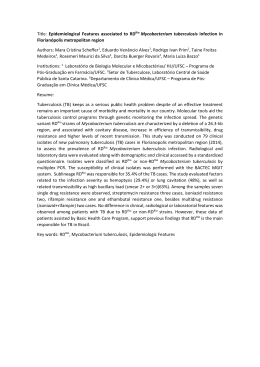
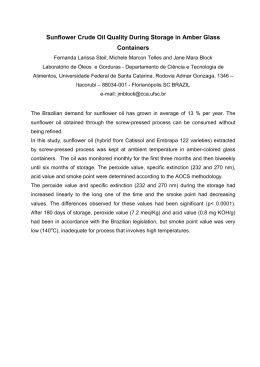
TIME OF CONCENTRATION IN THE UFSC CAMPUS CATCHMENT,
FLORIANÓPOLIS-SC (BRAZIL), CALCULATED WITH MORFOMETRIC AND
HYDROLOGICAL METHODS
KOBIYAMA, M.1
1. Department of Sanitary and Environmental Engineering/UFSC, Caixa Postal 476, Florianópolis-SC, CEP
88040-900, Brazil, [email protected]
GRISON, F.2
2. Undergraduate course of Sanitary and Environmental Engineering of UFSC, Caixa Postal 476,
Florianópolis-SC, CEP 88040-900, Brazil, [email protected]
LINO, J.F.L.3
3. Master course of Environmental Engineering of UFSC, Caixa Postal 476, Florianópolis-SC, CEP 88040900, Brazil, [email protected]
SILVA, R.V.4
4. Doctor course of Environmental Engineering of UFSC, Caixa Postal 476, Florianópolis-SC, CEP 88040900, Brazil, [email protected]
ABSTRACT
The Federal University of Santa Catarina (UFSC) campus catchment (BC) with area of 4.078 km2 is a typical
urban catchment and is a part of the Itacorubi catchment which is the second largest one in the Santa Catarina
Island, Brazil. Due to an intensified and disordered urbanization, the BC has been frequently suffering from
floods. For reducing floods damages, the UFSC initiated the Hydrology Project (PHC) in the campus. With
an installation of a meteorological station and a gauge, the PHC has been automatically executing the
hydrological monitoring. Using the data obtained with this monitoring, the morphometric and hydrological
calculation of the time of concentration (Tc) in the BC was carried out. For the former method, the formulas
of Kirpich, Dooge, Carter, Federal Aviation Agency, and McCuen were used. While the mean Tc value
among them was 31.8 min, the value obtained with the Formula of Dooge was larger than the others. For the
hydrological method, only six precipitation events that occurred during the period of January to May, 2006,
were analyzed. The mean Tc value with this method was 34 min. By treating these six events, the relations of
Tc with the total precipitation, the maximum precipitation intensity, the precipitation duration, the mean
precipitation intensity, and the mean discharge were analyzed. Just only with six events, the negative
correlation with the mean precipitation intensity and the positive one with the duration were obtained.
Though Tc varies with the precipitation intensity, its commonest value may be approximately between 30
min and 35 min. Then, if the Index of Efficiency of Operation is used, it can be said that the BC normally has
flash floods. It implies a necessity of the establishment of the rapid alert system in the BC. The present study
analyzed only six precipitation events. Furthermore, none of them had high precipitation intensity. To gain a
better estimation of Tc in the BC, it will be necessary to analyze more events with high intensity for the
future study of the PHC.
Key-words: Time of concentration; catchment morphometry; hydrological monitoring.
INTRODUCTION
Floods have been influencing on the human history. By analyzing the available data
of the EM-DAT (Emergency Disasters Date Base), Goerl and Kobiyama (2005) showed
the significant increase of the number of occurrences and the number of affected people in
the world for the last decades. This increase may be caused strongly by the human
activities (for examples, the intensified and disordered urbanization, hazard areas
1
occupation and deforestation). Plate (2002) affirmed that the pressure exerted by the
population growth results in the exclusion of the poor people. These people have begun to
live on flood plains. This type of problem is commonly observed in urban areas. Costa and
Teuber (2001), with case study of the Rio de Janeiro state, mentioned that the floods are
not inevitable but that the damages can be reduced.
According to Kobiyama et al. (2004) that analyzed the natural disasters database on
Brazil for the period of 1948 to 2004, floods are the natural disasters that provoke human
losses more in Brazil. The current situation of the Florianópolis city whose major part is
the Santa Catarina Island is not an exception. The second largest catchment in this island,
i.e., the Itacorubi catchment (approximately 25 km2) is still more anxious because of
disordered and accelerated urbanization (Bez et al., 1999).
The Federal University of Santa Catarina (UFSC) is locates at the central region of
the Itacorubi catchment. Because of both the scientific interest and the socialenvironmental responsibility, the UFSC initiated the Hydrology Project (PHC) in its
campus in 1981. Various hydrological studies have been carried out since 1981.
In 2004, a gauge and a meteorological station were installed inside the campus,
which makes the short-interval hydrological monitoring possible (Grison, 2005). Thus, an
experimental catchment was established and called the campus catchment (BC) of UFSC.
With this hydrological monitoring activity, the Hydrology Laboratory (LABHIDRO) of
UFSC was created. To advance hydrological study in the BC, the visualization of the data
obtained with the automatic hydrological monitoring at the above-mentioned stations and
its data-liberalization on the site of the LABHIDRO (www.labhidro.ufsc.br) have been
performed (Kobiyama, 2005). These works have significantly contributed to the scientific
researches as well as the university education.
As the main objective of the PHC is to reduce natural disasters caused by floods, it
is still necessary to realize various studies. That is why the objective of the present study
that is a part of the PHC was to morphometricly and hydrologically calculate the time of
concentration (Tc) of the BC. According to Singh (1976), Mulvany (1850) was the first
publication that mentioned the Tc concept. By relating with the maximum discharge,
Mulvany (1850) defined Tc as the time necessary for rain that falls at the longest place
from the catchment mouth, to flow out at the mouth. Singh (1976) showed that the spatial
and temporal characteristics of precipitation as well as the morphometric (or geometric)
characteristics of the catchment influence on the Tc value, and mentioned that the
precipitation duration possesses an definite influence on it.
2
Time parameters are very important in water resources management, in terms of the
structural and non- structural measures. Among them, Tc is most frequently used (McCuen
et al., 1984). Because of such importance of this parameter, a lot of formulas to estimate it
have been proposed. Silveira (2005) evaluated the performance of 23 formulas for rural
and urban catchments and showed that the performance of these formulas for rural
catchments is better than that for urban ones. It implies the larger difficulty to estimate Tc
for urban catchments than rural ones. Then, the present study applied various formulas to
verify the Tc value in the BC and discussed influences of some precipitation characteristics
on Tc.
STUDY AREA
The UFSC Campus catchment - BC (approximately 4 km2) is a part of the Itacorubi
catchment (Figure 1). Its main stream channel is situated from its head (332 m) to the
mouth (3 m), being tributary to the Três Córregos River that reaches a bay. In the UFSC
campus, this channel is called the Meio river. The BC consists of two geological units: the
crystalline complex represented by granites and granodiorites and the Quaternary
sedimentary deposits (Sierra and Ledo, 1998). Though most of the vegetation is at the
secondary stage, the remainings of the Tropical Ombrophilous Forest at the primary
condition can be encountered at various locations. Because of the actual land-uses, this
catchment is considered an urban one.
METEOROLOGICAL
STATION
GAUGE
GANGE
STATION
Brazil
SC
0m
500 m
1000 m
Santa Catarina Island
UFSC Campus
catchment
Figure 1 – Locality of the UFSC Campus Catchment
3
The mean monthly air humidity is about 82%. The mean annual isolation is 2026
hours which are 46% of the total potential. The mean potential evapotranpiration is 1019
mm/year, varying between months (107 mm in December and 65 mm in June) (Sierra and
Ledo, 1998).
Recently a meteorological station and a gauge were installed in front of the UFSC
Central Library, and at the left edge of the Meio River in front of the Health Sciences
Center (CCS/UFSC), respectively. Some hydrological parameters are monitored every
minute and transmitted to a computer at the LABHIDRO. The data are available in the
internet and renewed every 5 minutes in its site.
METHODS
Morphometric characterization of the catchment
By using a map (1:10.000 scale), the area (A) in km2, the river length (L) in km, the
catchment relief (H) in km and the slope (S = H/L) were measured.
Estimation of time of concentration
The formulas of Kirpich, Dooge, Carter, Federal Aviation Agency, and McCuen
were used to calculate Tc (Table 1). The first three ones require only morphometric
parameters for its calculation. In the Federal Aviation Agency formula, C is the surface
runoff coefficient of the Rational Method. According to Silveira (2005), C is 0.9 for the
urban catchments. In the McCuen formula, i is the maximum precipitation intensity in
mm/h for the return period of 2 years.
Table 1 - Formulas to estimate the Tc in minutes.
Name
Kirpich
Dooge
Carter
Federal Aviation Agency
McCuen
Formula
0.77
L
S 0.385
A0.41
Tc = 21.88 ⋅ 0.17
S
L0.6
Tc = 5.862 ⋅ 0.3
S
Tc = 3.989 ⋅
Tc = 22.73 ⋅ (1.1 − C )
L0.5
S 0.33
135 L0.5552
Tc = 0.7164 ⋅ 0.2070
i
S
Source
Kirpich (1940)
Porto (1995)
Carter (1961)
Federal Aviation Agency (1970)
McCuen et al. (1984)
4
Although the Tc concept was defined initially by Mulvany (1850), it can be defined
in other ways. For example, Tc is the time difference between the end of the effective
precipitation and the end of the direct runoff (McCuen et al., 1984; Silveira, 2005). Since it
is difficult to determine the effective precipitation, the present study used the end of the
precipitation event. The end of the direct runoff was determined with use of the semilogarithm graph of the total discharge against the time. In this graph, two discontinuous
straight lines were drawn through visual observation of the curve trend. Their intersection
point determined the end of the direct runoff. Here this procedure is called a hydrological
method with use of hyetograph and hydrograph.
RESULTS AND DISCUSSION
With the catchment morphometric analysis, it was obtained that A = 4.078 km2, L =
3.55 km, H = 0.329 km, and S = 0.0927. These values were used to calculate the Tc value
with the five formulas shown in Table 1.
With use of the Formulas of Kirpich, Dooge, the Carter, Federal Aviation Agency, and
McCuen, the values of Tc are of 26.4 min, 58.3 min, 25.6 min, 18.8 min, and 29.6 min,
respectively. For the McCuen formula, the adopted value of i was 44.2 mm/h. This is the
largest value observed at the meteorological station during the last two years, and was
registered on January 31st, 2006 at night. The mean Tc value among the five formulas is
31.8 min. The value gained with the Dooge formula, which is the unique formula that uses
a area, is largest among all. If the Dooge formula is not used, the mean Tc value becomes
25.1 min.
Figure 2 shows an example of the visual determination of the end of the direct runoff at
the mouth on March 2nd, 2006. After this determination, Tc was calculated on a graph of
the set of hyetograph and hydrograph (Figure 3).
5
0.70
0.70
Q(m3/s)
Log Q(m3/s)
0.60
0.60
0.50
0.50
0.40
0.40
0.30
0.30
0.20
0.20
0.10
0.10
0:56
0:59
0:59
0:53
0:50
0:50
0:47
0:47
0:44
0:44
0:41
0:41
0:38
0:35
0:32
0:29
0:26
0:26
0:23
0:23
0:20
0:20
0:14
0:17
0:17
0:11
0:08
0:05
0:02
0:02
23:59
23:59
23:56
23:53
0.00
0.00
Time
(min)
Tempo
(min)
Final time of direct runoff
Figure 2 - Visual determination of the end of the direct runoff for the precipitation event on March 2nd, 2006.
TC
0.00
Vazão (m3/s)
Discharge
(m3/s)
0.20
4.00
0.40
0.60
3.00
0.80
1.00
2.00
1.20
1.40
1.00
)
Precipitação
Precipitation (mm
(mm/min)
5.00
1.60
1.80
0.00
Tempo
Initial
inicial
time
Tempo
Final
final
time
2:10
2:02
1:54
1:46
1:38
1:30
1:22
1:14
1:06
0:58
0:50
0:42
0:26
0:34
0:18
0:10
0:02
23:54
23:46
23:38
23:29
23:21
23:13
23:05
2.00
Tempo(min)
Time(min)
Figure 3 – Hydrological estimation of Tc for the precipitation event on March 2nd, 2006.
Table 2 shows the results obtained with the hydrological method. Here, the mean
discharge (Qmean) is defined as an arithmetic mean value between the discharge at the
hydrograph peak and that at the end of the direct runoff. The mean Tc value obtained with
the hydrological method is 34 min.
Table 2 - Time of concentration (Tc) obtained with the hydrological method, total
precipitation (Pt), maximum precipitation intensity (Imax), precipitation duration (D),
mean intensity (Pt/D), and mean discharge (Qmean) for six precipitation events.
Evento (data)
D (min)
Pt/D
Tc
Pt
Imax
Qmean
(min)
(mm)
(mm/min)
(mm/min)
(m3/s)
Jan 24, 2006
35
7.4
1.4
74
0.1
2.805
Jan 25, 2006
34
11.6
0.8
62
0.19
3.740
Mar 2, 2006
36
13.0
1.0
47
0.28
3.505
Mar 4, 2006
32
14.8
2.2
15
0.99
5.135
Apr 7, 2006
31
9.8
1.2
17
0.58
3.695
May 8, 2006
36
11.6
1.6
40
0.29
2.995
6
Through the correlation analysis, McCuen et al. (1984) showed that the most and
the least important parameters for determining Tc were i and S, respectively, and that the
larger intensity, the smaller Tc. When a steady state occurs at the equilibrium time (Te), Tc
is equal to Te (Saghafian and Julien, 1995). The same authors theoretically demonstrated
that Te is inversely proportional to the high precipitation intensity raised to the power 0.4.
Though Table 2 shows the tendency in which Tc decreased with the increase of the
maximum precipitation intensity (Imax), a very low correlation between Tc and Imax was
obtained in the present study. With only six precipitation events, it is very difficult to
conclude if the correlation between them exists or not. The correlation between Tc and the
total precipitation (Pt) was very low, too.
Figure 4 shows that there is the correction between Tc and the mean intensity
(Pt/D). In this case, the value of potential is of – 0.0521.
Time of concentration (min)
37
y = 31.935x -0.0521
R2 = 0.4546
36
35
34
33
32
31
30
0
0.5
1
1.5
Mean intensity of precipitation (mm/min)
Figure 4 – Relation between the time of concentration and the mean precipitation intensity.
The simple theory indicates that Tc is inversely proportional to the flow velocity,
consequently to the discharge. It can be confirmed with Figure 5. Figure 6 shows a positive
correlation between the Tc and the precipitation duration (D), affirming the theoretical
manifestation by Singh (1976), i.e., the D possesses a definite influence on Tc.
Time of concentration (min)
37
y = -1.6423x + 39.988
2
R = 0.4143
36
35
34
33
32
31
30
0
2
4
6
Mean discharge (m3/s)
Figure 5 - Relation between the time of concentration and the mean discharge
7
Time of concentration (min)
44
y = 0.0595x + 31.47
2
R = 0.4519
42
40
38
36
34
32
30
0
20
40
60
80
Duration (min)
Figure 6 – Relation between the time of concentration and the duration of the precipitation
Thus, the mean values of Tc obtained with the morphometric and hydrological methods
are 31.8 min and 34 min, respectively. This result where the latter method estimated Tc a
few more could occur because of the fact that the events analyzed in the present study did
not have strong precipitation intensity. According to Silva et al. (2005), the maximum
intensity registered in Florianópolis city during the period of 1995 to 2001 was 73.6 mm/h
which occurred on December 24th, 1995. This precipitation event generated one of the
biggest natural disasters in the city. If the value of 73.6 mm/h is used for i of the McCuen
formula, Tc is 20.5 min. It implies that the future study with the hydrological methods will
probably produce the smaller value of Tc. However, on this moment it can be said that,
even though the Tc values vary with the precipitation intensity, the commonest value may
be between 30 and 35 minutes in the BC.
To differentiate floods and flash floods, Kobiyama et al. (2006) proposed the Operation
Efficiency Index (E) that is the ratio of Tc on the operational time for the institutioncommunity system to respond against flood disasters. The same authors mentioned that
when the E value is inferior to one, flash flood occurs. It is quite difficult to have the
operational time for the institution-community system to respond against floods, shorter
than one hour in Florianópolis. Then, in case of the UFSC campus catchment, E is
normally inferior to one, which implies that flash floods occur in this catchment.
Therefore, the communities in this catchment must require monitoring centers, weather
forecasting and alert system.
8
CONCLUSIONS
The UFSC campus catchment (BC) with area of 4.078 km2 is a typical urban catchment
and is a part of the Itacorubi catchment which is the second largest one in the Santa
Catarina Island. Due to an intensified and disordered urbanization, the BC has been
suffering from floods. In order to reduce floods damages, the UFSC initiated the
Hydrology Project (PHC) in the BC. With an installation of a meteorological station and a
gauge, the PHC recently initiated the automatic hydrological monitoring.
Using the data obtained with this monitoring, the present study calculated the time of
concentration (Tc) of the BC with the morphometric and hydrological methods. In the
former method, the Formulas of Kirpich, Dooge, Carter, Federal Aviation Agency, and
McCuen were used. While the mean value of Tc among them was 31.8 min, the value
obtained with the Formula of Dooge was larger than the others.
For the hydrological estimation, only six precipitation events that occurred during the
period of January to May, 2006, were analyzed. The mean Tc value with this method was
34 min. Using these six events, the relations of Tc with the total precipitation, the
maximum precipitation intensity, the precipitation, the mean precipitation intensity, and
the mean discharge were analyzed. Though only six events were treated, the negative
correlation with the mean precipitation intensity and the positive one with the duration
were obtained. Though Tc varies with the precipitation intensity, its commonest value can
be approximately between 30 min and 35 min.
Then, if the Index of Efficiency of Operation is used, it can be said that the BC
possesses flash floods. It implies a necessity of the establishment of the rapid alert system.
The present study analyzed only six precipitation events. This is a very small number
for events analysis, and none of them had high precipitation intensity. To gain a better
calculation of Tc in the BC, it will be necessary to analyze more events with high
precipitation intensity for the future study of the PHC.
RERERENCES
BEZ, A.; LISBOA, H.M.; CARDOSO, A.; MELO, E.; NASCIMENTO, G.A.;
UMEZAWA, P.K. JORDEN, V. Subsídios para o plano diretor de drenagem da bacia
do Itacorubi. UNICOBI, Florianópolis, 1999. 27p.
CARTER, R.W. Magnitude and frequency of floods in suburban areas. USGS
Professional Paper 424-B, p.9-11, 1961.
COSTA, H.; TEUBER, W. Enchentes no Estado do Rio de Janeiro – Uma Abordagem
Geral. SEMADS, Rio de Janeiro-RJ, 2001. 160p.
9
FEDERAL AVIATION AGENCY Dept of Trans. Advisory Circular on Airport
Drainage. FAA, Washington, 1970. (Rep. A/C 150-5320-5B)
GOERL, R.F.; KOBIYAMA, M. Considerações a respeito das inundações no Brasil. In:
XVI Simpósio Brasileiro de Recursos Hídricos, João Pessoa, 2005, Proceedings, 2005.
CD-rom.
GRISON, F. (2005). Monitoramento e modelagem hidrológica na bacia do campus da
UFSC. UFSC Florianópolis, 30p. (Report PIBIC-CNPq/BIP – UFSC – 2004/2005).
KIRPICH, Z.P. Time of concentration of small agricultural watersheds. Civil
Engineering v.10, n.6, p.362, 1940.
KOBIYAMA, M. Visualização do banco de dados obtidos pelo monitoramento
hidrológico automático em bacias hidrográficas em Florianópolis e Alfredo Wagner.
UFSC/LABHIDRO Florianópolis, 2005. 10p. (Final report for the Project
FUNGRAD/UFSC 2005)
KOBIYAMA, M.; CHECCHIA, T.; SILVA, R.V.; SCHRÖDER, P.H.; GRANDO, Â.;
REGINATTO, G.M.P. (2004). Papel da comunidade e da universidade no gerenciamento
de desastres naturais. In I Simpósio Brasileiro de Desastres Naturais, Florianópolis, 2004,
1, Proceedings, 2004. p.834–846.
KOBIYAMA, M.; GOERL, R.F.; SILVA, R.V. Redução de desastres naturais relacionados
às inundações: Problemas e soluções. In: Mendiondo, E.M. (org.) Águas Urbanas. FINEP,
Rio de Janeiro – RJ, 2006. (in press).
LABDREN – Laboratório de Drenagem Urbana. Departamento de Engenharia SanitáriaAmbiental. Disponível em <http://www.labdren.ufsc.br/pesquisa/Itacorubi> Acesso em 18
de maio de 2004.
McCUEN, R.H.; WONG, S.L.; RAWLS, W.J. Estimating urban time of concentration.
Journal of Hydraulic Engineering, v.110, n.7, p.887-904, 1984.
MULVANY, T.J. On the use of self registering rain and flood gouges. Proc. Inst. Civ.
Eng. (Irel.), v.4, n.2, p.1-8, 1850.
PLATE, E.J. Flood risk and flood management. Journal of Hydrology, v.267, p.2-11,
2002.
PORTO, R.L.L. Escoamento superficial direto. In: TUCCI, C.E.M.; PORTO, R.L.L.;
BARROS, M.T. (orgs.) Drenagem Urbana. ABRH, ed. UFRGS, Porto Alegre – RS,
1995. p.107–165.
SAGHAFIAN, B.; JULIEN, P.Y. Time to equilibrium for spatially variable watersheds.
Journal of Hydrology, v.172, p.231-245, 1995.
SIERRA, E.S.; LEDO, B.S. Ecologia e Gerenciamento do Manguezal do Itacorubí.
NEMAR, CCB, UFSC, Florianópolis, 1998. 408p.
SILVA, R.V.; KOBIYAMA, M .; SCHARF, D.D.; GRISON, F.; HAAS, R. Caracterização
preliminar da precipitação na bacia do campus da UFSC, Florianópolis-SC. In: XVI
Simpósio Brasileiro de Recursos Hídricos, João Pessoa, 2005, 1, Proceedings, 2005. CDrom.
SILVEIRA, A.L.L. Desempenho de fórmulas de tempo de concentração em bacias urbanas
e rurais. Revista Brasileira de Recursos Hídricos, v.10, p.5-23, 2005.
10
SINGH, V.P. Derivation of time of concentration. Journal of Hydrology, v.30, p.147-165,
1976.
11
Download