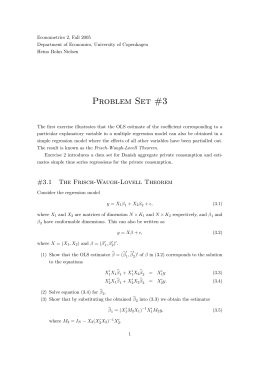
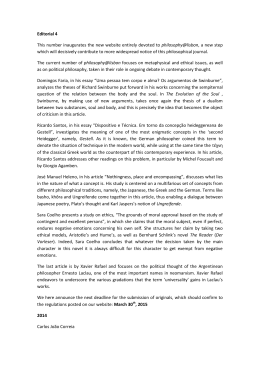
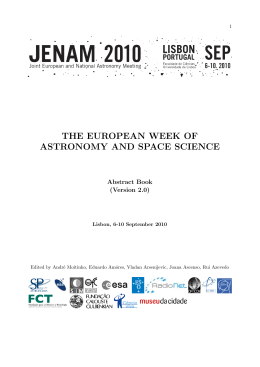
Spectral Fitting of SDSS Passive Galaxies with alphaenhanced Single Stellar Populations Authors: Jean Michel Gomes (1) & Paula Coelho (2) Affiliations: (1) Centro de Astrofísica da Universidade do Porto (2) Núcleo de Astrofísica Teórica, Universidade Cruzeiro do Sul ABSTRACT: The power of population synthesis as a mean to estimate the star-formation and chemical histories of galaxies has been well established in the last decade. The major developments were due to huge avalanche of methods, codes (STARLIGHT, ULySS, VESPA, among others) and high-quality galaxy data sets, such as the 2dF, 6dF and SDSS surveys. The spectral synthesis codes use an "inverse approach" based on the decomposition of an observed galaxy spectrum in terms of linear combinations of base elements, i. e. Single Stellar Populations (SSP) of different ages and metallicities, which are usually computed from evolutionary synthesis codes (BPASS, GALEV, GALAXEV, MILES, PÉGASE, etc...) and contain distinct ingredients like: stellar library, evolutionary tracks, metallicities, evolutionary tracks and Initial Mass Functions (IMFs). In general, they have solar-scaled relative abundances, but this is about to change with the unfolding of new alpha-enhanced SSP models (Coelho et al. 2007). We know that Passive galaxies have some spectral features corresponding to “enhanced-ratios” ([E/Fe]), like O, Ne, Si, S, Mg, Na, C and N over Fe that are not well modeled using solarscaled SSPs (Trager et al. 2000). It was also shown that the residuals between observed and modeled spectral indices increase with velocity dispersion (σ ). The potential wells of Passive galaxies are coupled with their velocity dispersion, therefore the total stellar mass correlates with σ . As the main conclusion, massive galaxies have larger [E/Fe] mismatch than less massive ones. This result can be interpreted as an indication for distinct star-formation efficiencies, leading to different ratios of type Ia and II Supernovas for massive and less massive galaxies. These stars have different progenitor masses and evolutionary time scales and consequently they synthesize different elements, explaining the observed trends in Passive galaxies. We have applied the STARLIGHT spectral synthesis code (Cid Fernandes et al. 2005) to a sample of ∼ 1000 Passive (line-less) galaxies from the SDSS-DR7 with a S/N continuum criterion greater than or equal to 20 to investigate the effects of the enhancement ratios [Ε/Fe] mismatch. Three sets of SSP based on Coelho et al. 2007 theoretical models and Walcher et al. 2009 prescriptions were computed using α-enrichment abundance ratios of [α/Fe]=0.0, [α/Fe]=0.2 and [α/Fe]=0.4. Our aim is to determine: (1) the quality of the fits, (2) the mean stellar age and metallicity distributions and (3) the star-formation history of Passives. For the spectral fits using [α/Fe]=0.0 SSPs, we find the strongest residuals in the CN (4142.1254177.125 Å), Na D (5876.875-5909.375 Å) and Mg (5069.125-5196.625 Å) bands. When we use [α/Fe]=0.2 and [α/Fe]=0.4 models, they tend to produce better fits for the Mg feature compared to the solar-scaled SSP, decreasing these residuals by 1.77 Å and 2.92 Å, respectively. However, they tend to produce worse fits for CN and Na D compared to [α/Fe]=0.0, increasing these residuals between modeled and observed equivalent widths by 2.08 and 4.20 Å ([α/Fe]=0.2) and 2.28 and 7.94 Å ([α/Fe]=0.4), respectively. We obtain non-negligible biases in both of mean stellar age and metallicity estimates when we compare the solar-scaled SSPs with α-enhanced ones, which tend to be by 0.12 dex ([α/Fe]=0.2) and 0.14 dex ([α/Fe]=0.4) higher for the mean stellar age and by 0.10 dex ([α/Fe]=0.2) and 0.20 dex ([α /Fe]=0.4) lower for a given mean stellar metallicity. Figure 1. Spectral fit to the SDSS passive galaxy J100329.97+372734.6 using three different sets of SSPs with the following α-enhancement ratios: CO01 ([α/Fe]=0.0), CO02 ([α/Fe]=0.2) and CO03 ([α/Fe]=0.4), spanning 10 distinct ages from 3 to 12 Gyr and 4 different metallicities ([Fe/H]=-0.50, -0.25, +0.00 & +0.20). Left panels: Observed (black) and modeled (red) spectrum with the corresponding residuals (bottom) for CO01, CO02 and CO03 from top to bottom, respectively. The fits are equally good in terms of their reduced χ2. The Middle panels: show the corresponding Star Formation Histories (SFHs) obtained using the three sets of SSPs. Right: comparison between the smoothed SFHs by 0.2 dex. There is a clear tendency for the Starlight code to choose higher ages while using higher [α/Fe] SSPs. Figure 2. Comparison between the CO01 , CO02 & CO03 bases, Figure 3. Age vs Metallicty degeneracy diagram. We show following the same color coding as the difference in mean stellar in Fig. 1. In the top-left panel we age and mean stellar metallicity show the difference between the for reduced χ2 of [CO02/CO03] and CO02 CO03 [α/Fe=0.2] (blue)/ [α/Fe=0.3] (red) [CO01] as a function of [CO01] χ2. compared to CO01 [α/Fe=]. The CO02 and cO03 yield fits of lower hexagons correspond to the quality than CO01. CO02 has better median values: green for fits than CO03. The other panels CO02-CO01 show the residuals with respect to CO03-CO01 . We can see that CN, Mg & Na using distinct [α/Fe] with increasing α-enhancement SSPs. Only for Mg we obtain a the mean stellar age gets better agreement using α-enhanced higher and the mean stellar bases. CO03 has less residuals than metallicity gets lower. and magenta for Co02 and Co02 has less residuals than CO01. For CN & Na, we see the References: opposite trend because [E/Fe] is 1- Cid et al. 2005, MNRAS, 358, 363 different from [α/Fe], i.e. Na, C & N, are NOT α-elements, therefore, to have better fits for these regions we should use [E/Fe] bases (Lee et al. 2009). 2– Coelho et al. 2007, MNRAS, 382, 498 3- Lee et al. 2009, AJ, 138, 1442 4- Trager et al. 2000, AJ, 120, 165 5- Walcher et al. 2009, MNRAS, 398, 44 * Acknowledgement: J. M. Gomes is supported by FCT/MCTES (Portugal) and POPH/FSE (EC) grant
Download