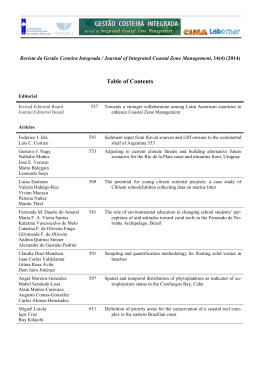
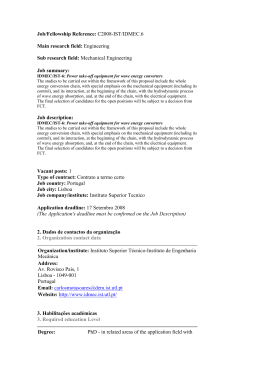
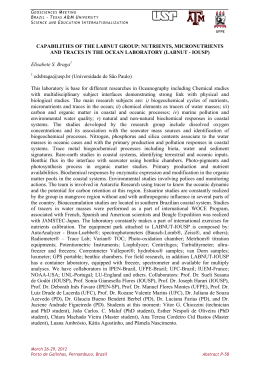
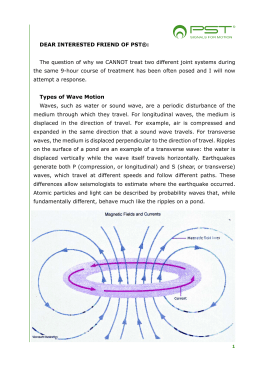
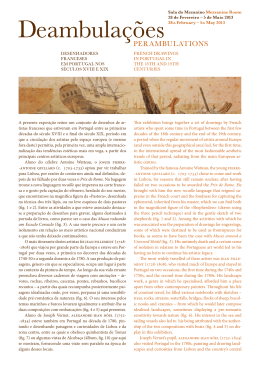
Versão online: http://www.lneg.pt/iedt/unidades/16/paginas/26/30/185
Comunicações Geológicas (2014) 101, Especial II, 621-624
IX CNG/2º CoGePLiP, Porto 2014
ISSN: 0873-948X; e-ISSN: 1647-581X
Prediction of overwash in alongshore variable barrier
islands
Previsão da ocorrência de galgamentos em ilhas barreira
com variabilidade longilitoral
A. Matias1*, A. R. Carrasco1, C. Loureiro1, S. Almeida1, Ó. Ferreira1
Artigo Curto
Short Article
© 2014 LNEG – Laboratório Nacional de Geologia e Energia IP
Abstract: Overwash prediction is very important for coastal zone
management. This work intends to identify alongshore variations in
storm impact and evaluate the role of sub-aerial and submerged
morphologies in overwash occurrence. For this study, 24 cross-shore
topo-bathymetric profiles were set on Barreta Island (Ria Formosa
barrier island system, Portugal). Pre- and post-overwash surveys were
made between August 2012 and April 2013. During overwash events,
tidal levels and wave parameters at breaking were obtained. Overwash
occurred under storm and non-storm conditions, the latter coincident
with spring high-tide. Beach morphology was spatially variable, and
changeable from one overwash episode to the next. Predictions of
overwash occurrence were made using the Overwash Potential, defined
as the difference between runup and barrier elevation. Several runup
equations were tested, and the results compared to the actual
observations. The selected predictor provided an accuracy of 88% for
the identification of the locations where overwash occurred. This study
proves that nearshore and foreshore morphologies have a major impact
on the longshore distribution of overwash.
Keywords: SWAN, Runup, Storm, Coastal hazards.
Resumo: A previsão da ocorrência de galgamentos é muito
importante para a gestão da zona costeira. Este trabalho pretende
identificar as variações longitudinais do impacto de tempestades e
avaliar o papel das variações morfológicas sub-aéreas e submersas na
ocorrência do galgamento. Para este estudo foram definidos 24 perfis
topo-batimétricos na Ilha da Barreta (sistema de ilhas barreira da Ria
Formosa, Portugal). Foram efetuados levantamentos pré- e pósgalgamento entre Agosto de 2012 e Abril de 2013. Durante os
eventos de galgamento, foram obtidos os níveis de maré e os
parâmetros de onda na rebentação. Os galgamentos ocorreram quer
em condições de tempestade, quer em condições de não-tempestade,
as últimas coincidentes com preia-mar de águas vivas. A morfologia
de praia foi espacialmente variável e diferente nos vários eventos de
galgamento. As previsões da ocorrência de galgamento foram
efetuadas através do cálculo do Potencial de Galgamento, definido
como a diferença entre a elevação do runup e da barreira. Foram
testadas várias equações de runup e os resultados foram comparados
com as observações reais. A equação selecionada proporciona um
rigor de 88% na previsão dos locais onde ocorreram processos de
galgamento. Este estudo demonstra que as morfologias emersas e
submersas exercem um grande impacto na distribuição longilitoral do
galgamento.
Palavras-chave: Programa SWAN, Elevação de espraio,
Tempestade, Riscos costeiros.
1
CIMA, Universidade do Algarve, Campus de Gambelas, 8005-139 Faro.
*Corresponding author / Autor correspondente: [email protected]
1. Introduction
Overwash associated with major storms may seem
catastrophic, however, in the longer perspective
(hundreds of years), overwash can be considered as a
nearly continuous process, shaping and reshaping coastal
barriers (Leatherman, 1988). Where overwash processes
are allowed to occur, the net volume of sand is often
maintained, with the morphology translating shoreward
(Dolan & Godfrey, 1973). Accurate prediction of
overwash is of obvious importance for coastal flood risk
assessment and management. Sallenger (2000) developed
a conceptual model for predicting storm responses,
including an overwash regime. In this model, overwash
occurrence depends on the relation between the
maximum elevation of runup on the beach and dune crest
level. However a detailed analysis of the influence of
other foreshore factors and alongshore variability is still
needed. The objectives of the current work are to identify
and describe longshore variations in storm impacts along
a barrier island; and to evaluate the role of sub-aerial and
submerged morphological variations in overwash
occurrence.
2. Study area
The study area is located on the western section of Barreta
Island, which is part of the Ria Formosa barrier island
system, in southern Portugal. The western part of Barreta
Island starts downdrift of Ancão Inlet. This inlet was
artificially relocated in June 1997 (Vila-Concejo et al.,
2003) and has been migrating eastward towards the study
area. The typical barrier sedimentary environments in the
study area are: a reflective beach face on the seaward side
of the barrier, and a an extensive washover terrace until the
lagoon.
Tides are semi-diurnal and mesotidal, with a mean tidal
range of about 2 m that can reach up to 3.5 m during
spring tides. The offshore wave climate is dominated by
west-southwest waves (71% of occurrences, Costa et al.,
2001). Average annual significant offshore wave height
(Hs) is 1.0 m and average peak period (Tp) is of 8.2
622
A. Matias et al. / Comunicações Geológicas (2014) 101, Especial II, 621-624
seconds (Costa et al., 2001). Storm events in the region
(defined as Hs≥3.0 m) correspond to 1% of the offshore
wave climate (Costa, 1994). Western Barreta has a
northwest-southeast orientation such that it is directly
exposed to dominant W-SW waves.
3. Methods
To study longshore variations in overwash, 24 cross-shore
topo-bathymetric profiles were set on Barreta Island.
Surveys were performed from August 2012 until April
2013 (11 surveys), in order to measure pre-overwash and
post-overwash conditions. Profile measurements were
made using a Real-Time Kinematic Differential Global
Positioning System (RTK-GPS), over a total extent of
1600 m. Bathymetric surveys followed the orientation of
topographic profiles until a depth of about -12 m MSL.
They were made using an RTK-GPS, coupled with an ecosounder, with data-syncronization and navigation assured
by the software Hypack. This method has an estimated
average error of 0.030 m (Horta, J. & Pacheco, A., oral
communication).
Predicted tidal levels from the Instituto Hidrográfico de
Portugal were used, and storm surge evaluated by the
comparison between predicted levels and the observations
from a tidal gaude located in Huelva, Spain (60 Km to the
East). Offshore wave data were recorded by the Instituto
Hidrográfico de Portugal using a directional wave-rider
buoy offshore Cape Santa Maria (Costa, 1994). Numerical
wave modelling with SWAN (Simulating Waves
Nearshore; Booij et al., 1999) was used to explore
nearshore wave conditions during overwash. A nested
scheme composed of three regular grids was used; with
grid resolutions of 50 m x 50 m for the regional grid, 18 m
x 18 m for the background grid (larger map of Fig. 1) and
5 m x 5 m for each of the detailed grids (smaller map of
Fig. 1, as an example). Breaking wave heights were
obtained for several positions alongshore.
The likelihood of overwash occurrence was estimated
using the overwash potential, OP (described in Matias et
al., 2012):
OP = R2 + η − hc
Fig. 1. Topo-bathymetric maps of the study area, including the extensive
background survey (until -22 m) and a detailed survey from 2nd and 3rd of
October 2012. Ancão Inlet is visible in the background survey, at NW of
the study area. The stars on the top map represent the location of the
barrier crest in each of the 24 profiles.
Fig. 1. Mapas topo-batimétricos da área de estudo, incluindo o
levantamento de referência maior (até aos -22 m) e o levantamento de
detalhe efetuado a 2 e 3 de outubro de 2012. A Barra do Ancão é visível
no levantamento de referência, a NW da área de estudo. Os símbolos em
estrela no mapa do topo representam a localização da crista da barreira
em cada um dos 24 perfis.
4. Results and discussion
Throughout all surveys of the monitoring period the barrier
profile was variable alongshore. The barrier was generally
narrower in the middle section (around profile P10, Fig. 2)
where the barrier width reached only 70 m at MSL. The
wider barrier was permanently located on the northwestern
end of the study area (profiles P1-P5, Fig. 2), where the
barrier is 150 m wide.
(1)
where R2 is the 2% exceedance level for vertical runup,
including setup and swash, hc is the barrier crest elevation,
and η is sea level. When OP is positive, overwash occurs
because the predicted runup elevation is higher than the
barrier crest, and vice-versa. The results from one of the
events were used to investigate the applicability of a
number of wave runup predictors (R2), similarly to what
was done with data from overwash laboratory experiments
BARDEX (Matias et al., 2012) and BARDEX II (Matias
et al., 2013). The tested runup equations were developed
by Hunt (1959), Guza & Thornton (1982), Holman (1986),
Mase (1989), Powell (1990), Nielsen & Hanslow (1991),
van der Meer & Stam (1992), Komar (1998), Ruggiero et
al. (2001), Lorang (2002), Hughes (2004) and Stockdon et
al. (2006). The description of each equation can be found
in Matias et al. (2012).
Fig. 2. Topo-bathymetric profiles extracted from the survey undertaken
on the 2nd and 3rd of October 2012. Represented profiles are from
locations P2 (at NW), P5, P10 and P15, as examples of different barrier
sub-aerial and submerged morphologies.
Fig. 2. Perfis topo-batimétricos extraídos do levantamento efetuado em 2
e 3 de Outubro de 2012. Os perfis representados estão localizados em P2
(a NW), P5, P10 e P15, como exemplos de diferentes morfologias de
barreira quer subaéreas, quer submersas.
The overall shoreline alignment was not rectilinear;
rather it exhibited prominent and reentrant areas, visible in
figure 1 (barrier crest represented by stars). The
irregularities were not rhythmic and display variable
Prediction of overwash in barrier islands
623
locations from one survey to the next. The beach face was
generally steep (Fig. 2), with average beach slope of 0.1.
The beach face occasionally exhibited beach cusps with
variable wave-length and changing location but that rarely
extended throughout the entire study area. In the nearshore,
between -3.5 m to -4 m MSL, sand bars were observed
(around profiles P9-P11 of Fig. 1). These morphologies,
often related to rip-bar systems, are not rhythmic
topography sensu stricto as a wavelength could not be
attributed. There was no systematic alongshore repetition of
features with similar characteristics; rather there were sand
bars with different dimensions along the nearshore of the
barrier (Fig. 1). Nevertheless, the most striking
morphological feature of the nearshore was the ebb tidal
delta and swash bars of Ancão Inlet (profile P2 of Fig. 2),
that limits the study area to the northwest (Fig. 1).
The effects of six overwash events were measured
during the study period. Overwash occurred twice under
storm conditions and four times under non-storm conditions,
but coinciding with spring high-tides. Overwash occurrence
of November 2012 was related to a storm event, over which
Hs reached maximum values of 3.8 m, with a tidal level of
1.4 m MSL. Non-storm overwash was, on the other hand,
promoted by significantly lower waves (Hs = 0.8 m)
recorded on March 12, 2013, but coincident with equinoctial
spring tides, which reached a level of about 1.5 m above
MSL. However, for this last event overwash did not occur in
many of the profiles.
To investigate the differences in overwash
characteristics along the study area, the overwash episode
that generated the most variable barrier response was
selected as case study. This was a non-storm overwash
measured on the 2nd of October 2012, promoted by waves
with offshore Hs = 0.89 m, Tp = 9.1 s and a tide level of
1.35 m above MSL. Storm surge level for that day was
negligible. Results of SWAN model for breaking conditions
in the nearshore showed that Hsb varied from 0.80 m to 1.25
m (Fig. 3), with the highest waves breaking on top of the
ebb delta of Ancão Inlet.
OP was computed using the 12 equations mentioned
above for the computation of the runup. Alongshore variable
Hsb was used for the computation of runup. All equations,
except one failed to accurately predict the majority of
swash/overwash cases. The most accurate OP (88%
accuracy) was obtained with Mase (1989) equation, which
correctly predicted the storm impact for 21 profiles (Fig. 4).
Such predictions are given by:
(2)
where ξ is the Irribaren Number (Battjes, 1974) given by:
(3)
where tanβ is beach slope and Lo is the deep-water wave
length. OP inaccurate predictions were located closer to
Ancão Inlet (P1 and P2) and at P8 (Fig. 4). For profiles P1
and P2, overwash was predicted but it did not occur. The
swash bars that form part of the ebb delta of Ancão Inlet
induced higher breaking waves (Fig. 3), but also breaking
positions seaward than in other parts of the barrier. The
dissipation of energy at such seaward locations frequently
caused wave reformation and a second wave breaker. This
induced a runup excursion that did not reach the barrier
crest. For profile P8 was the reverse; no overwash was
predicted (OP = -0.22 cm, Fig. 4) because of a
combination of the lowest Hsb (0.8 m, Fig. 3) with a flatter
beach face slope (0.11).
Fig. 3. Distribution of significant wave height (Hs) on the study area
during the overwash event of October 2012. The profile location is also
represented.
Fig. 3. Distribuição da altura significativa de onda (Hs) na área de estudo
durante o evento de galgamento de outubro de 2012. A localização dos
perfis também está representada.
Fig. 4. Upper panel: Barrier crest elevation (in black and connected dots)
along the study area, from Northwest (to the left) to Southeast (to the
right) and computed runup elevation (in red) for the same locations, for
October 2012 event. Overwash is expected when the red line is above the
black line. Lower panel: Overwash Potential computed for all profiles.
Positive values of Overwash Potential in the lower panel are indicative of
overwash.
Fig. 4. Painel superior: Elevação da crista de barreira (a preto e com
círculos) ao longo da área de estudo, de Noroeste (à esquerda) para
Sudeste (à direita) e elevação do runup calculado (a vermelho) para as
mesmas localizações, para o evento de outubro de 2012. Prevê-se a
ocorrência de galgamento quando a linha vermelha se encontra acima da
linha preta. Painel inferior: Potencial de Galgamento calculado para todos
os perfis. Os valores positivos do Potencial de Galgamento no painel
inferior são indicativos de galgamento.
624
5. Conclusions
During the study period, the barrier exhibited significant
alongshore variations, including variations in barrier
width, beach slope, beach cusps and swash bars.
Irregularities in the nearshore that influenced breaking
waves, were mostly related to sand bars that were moving
downdrift from Ancão Inlet or were remnants of ebb delta
sediments from previous Ancão Inlet positions.
Overwash occurrence was predicted using OP, which
was tested using several runup predictors. Mase (1989)
equation was the most accurate, with 88% of correct
prediction of swash/overwash. Shortcomings in the
application of OP as presented here may arise from not
including important spatial variables such as the distance
between the barrier crest and breaker positions, or beach
berm positions. The incorporation of these morphological
variables is a crucial step towards more accurate
predictions.
Acknowledgements
Data were collected within RUSH project, PTDC/CTEGIX/116814/2010 financed by FCT. A. Matias was
supported by Programme Investigator FCT. A.R. Carrasco
and C. Loureiro were supported by the FCT, grant
references
SFRH/BPD/88385/2012
and
SFRH/BPD/85335/2012, respectively. We would like to
thank RUSH collaborators for their contributions during
fieldwork: André Pacheco, Isabel Mendes, Mara Nunes,
Margarida Ramires.
References
Battjes, J.A., 1974. Runup distributions of waves breaking on slopes.
Journal of Waterway, Port, Coastal, and Ocean Engineering,
97(WW1), 91-114.
Booij, N., Ris, R.C., Holthuijsen, L.H., 1999. A third-generation wave
model for coastal regions – 1. Model description and validation.
Journal of Geophysical Research, 104(C4), 7649-7666.
Costa, C., 1994. Final Report of Sub-Project A. Wind Wave
A. Matias et al. / Comunicações Geológicas (2014) 101, Especial II, 621-624
Climatology of the Portuguese Coast. IH/LNEC, Portugal, Report
PO-WAVES 6/94-A, 80 p.
Costa, C., Silva, R., Vitorino, J., 2001. Contribuição para o estudo do
clima de agitação marítima na costa portuguesa. Proc. 2as Jornadas
Portuguesas de Engenharia Portuária, Sines, Portugal, PIANC.
Dolan, R., Godfrey, P., 1973. Effects of Hurricane Ginger on the
barrier islands of North Carolina. Geological Society of America
Bulletin, 84, 1329-1334.
Guza, R.T., Thornton, E.B., 1982. Swash oscillations on a natural
beach. Journal of Geophysical Research, 87(C1), 483-491.
Holman, R.A., 1986. Extreme value statistics for wave run-up on a
natural beach. Coastal Engineering, 9, 527-544.
Hughes, S.A., 2004. Estimation of wave run-up on smooth,
impermeable slopes using the wave momentum flux parameter.
Coastal Engineering, 51, 1085-1104.
Hunt, I.A., 1959. Design of seawalls and breakwaters. Journal of
Waterway, Harbors, Division 85(WW3), 123-152.
Komar, P.D., 1998. Beach processes and sedimentation. Prentice Hall,
New Jersey, 544 p.
Leatherman, S.P., 1988. Barrier island handbook. Coastal Publications
Series, Laboratory for Coastal Research, University of Maryland, 92 p.
Mase, H., 1989. Random wave runup height on gentle slope. Journal of
Waterway, Port, Coastal, and Ocean Engineering, 115, 649-661.
Matias, A., Masselink, G., Kroon, A., Blenkinsopp, C., Turner, I.L.,
2013. Overwash experiment on a sandy barrier. Journal of Coastal
Research, SI 65, 778-783.
Matias, A., Williams, J., Masselink, G., Ferreira, Ó., 2012. Overwash
threshold for gravel barriers. Coastal Engineering, 63, 48-61.
Nielsen, P., Hanslow, D.J., 1991. Wave runup distributions on natural
beaches. Journal of Coastal Research, 7(4), 1139-1152.
Ruggiero, P., Komar, P.D., McDougal, W.G., Marra, J.J., Beach, R.A.,
2001. Wave runup, extreme water levels and the erosion of
properties backing beaches. Journal of Coastal Research, 17(2),
407-419.
Sallenger, A.H., 2000. Storm impact scale for barrier islands. Journal
of Coastal Research, 16(3), 890-895.
Stockdon, H.F., Holman, R.A., Howd, P.A., Sallenger, A.H., 2006.
Empirical parameterization of setup, swash, and runup. Coastal
Engineering, 53, 573-588.
van der Meer, J.W., Stam, C.M., 1992. Wave runup on smooth and
rock slopes of coastal structures. Journal of Waterway, Port,
Coastal, and Ocean Engineering, 118, 534-550.
Vila-Concejo, A., Ferreira, Ó., Matias, A., Dias, J.A., 2003. The first
two years of an inlet: sedimentary dynamics. Continental Shelf
Research, 23, 1425-1445.
Download