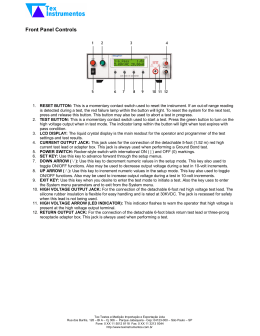
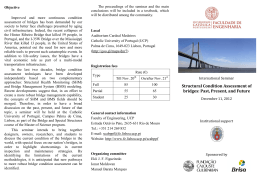
A New Approach for Calibrating High-voltage Capacitance and Dissipation Factor Bridges Gregory A. Kyriazis Instituto Nacional de Metrologia. Normalização e Qualidade Industrial Duque de Caxias - RJ - Brazil Email: [email protected] Abstract: A new approach for calibrating automated highvoltage current-comparator-based capacitance and dissipation factor bridges is presented. The approach is slightly different from another published previously. It leads to larger uncertainties, but is slightly easier to implement, since the digitizers need not be synchronized to the signal generators. It is possible to simulate capacitance ratios from 1:1 to 100:1 with relative standard uncertainties of less than 2.5⋅10−5 and dissipation factors from 0 to 0.1 with standard uncertainties of less than 1⋅10−5. Keywords: calibration, sampling methods, capacitance, dissipation factor, ac bridge. 1. INTRODUCTION Commercial automated high-voltage current-comparatorbased capacitance and dissipation factor bridges [1][2] have been used extensively for calibrating high-voltage standard capacitors, shunt reactors and power transformers and for assessing the dielectric properties of power apparatus insulation with respect to safety, quality and service life. Such bridges have been calibrated with gas-dielectric standard capacitors and dissipation factor standards [3] (see section 3 for constructive details of dissipation factor standards). Some shortcomings of this method are: (a) a high-voltage apparatus is required, (b) the number of test points is restricted to the number and values of the standards available, and (c) the dissipation factor uncertainty increases with the actual dissipation factor being measured, thus limiting the accuracy of loss measurements reported by bridge manufacturers. A more flexible and accurate calibration procedure has been proposed in [4]. Neither high-voltage capacitors and dissipation factor standards nor a high-voltage source are required. The calibration of the bridge is carried out at low voltage. These bridges measure the ratio of their input currents. For the calibration, two sinusoidal currents are synthesized with the aid of a digital, programmable twochannel ac voltage source and two resistors. The complex VIII Semetro. João Pessoa, PB, Brazil, June 17 – 19, 2009 ratio of these synthesized input currents is calculated from an ac voltage ratio determined by a sampling method, together with the impedance ratio of the resistors. The system uses a synchronous sampling technique, which requires the timing of the digital source to be obtained from the time base of the digitizer used to sample the voltage signals [5]. This allows the sampling interval to be selected according to the time base resolution of the digitizer so that each acquisition can cover one or more signal periods with high accuracy. In [4], the voltage drops across the resistors are measured. It is not easy to measure such voltage drops with digital sampling voltmeters. A complex buffer arrangement is required to unload the digitizer inputs. Wagner balancing is also required to reduce the potential differences between the LOW terminals of the impedances and earth so that their influence on the impedance ratio can be negligible. In addition, the approach requires the digitizer to be synchronized to the signal generator. A new approach for calibrating automated high-voltage current-comparator-based bridges is presented here. It leads to larger uncertainties, but is slightly easier to implement. For the calibration, two sinusoidal currents are synthesized with two synchronized signal generators and two resistors, and injected into the bridge inputs. Again, the capacitance ratio and dissipation factor simulated by these currents are calculated from an ac voltage ratio estimated from the digitized data, together with the impedance ratio of the resistors. In contrast with [4], synchronization circuits are not required between the digitizers and the generators as the algorithm in [6] is used to design the experiment and estimate accurately the signal parameters. In addition, buffer amplifiers to unload the digitizer inputs are not needed as the digitizers are used to sample directly the output voltages of the signal generators. However, techniques to offset the dependence of the injected currents on the impedance of the leads and the current-comparator ratio windings are required. The paper is organized as follows. The calibration of high-voltage standard capacitors with capacitance and dissipation factor standards and bridges is briefly reviewed in section 2. The construction of dissipation factor standards is discussed in section 3. The operating principle of the calibration system proposed here is presented in section 4. The measurement procedure is detailed in section 5. The characteristics and the construction of the error-current injection amplifiers are discussed in section 6. The measurement uncertainties are reported in section 7. Experimental results are discussed in section 8. The conclusions are drawn in section 9. A two-page summary of this paper was published in [7]. An extended version of that paper was accepted for publication in [8]. The paper here addresses further developments performed after the submittal of the paper in [8]. 2. THEORY A high-voltage source, a standard capacitor with known capacitance CS and dissipation factor tan δS, and a capacitance and dissipation factor bridge are required to measure the unknown capacitance CX and dissipation factor tan δX of a test capacitor at power frequencies ω (Fig. 1). and the corresponding phases are arg I S = δ U + π 2 − δ S arg I X = δ U + π 2 − δ X (2) From these currents, the bridge evaluates the amplitude ratio and the phase displacement IX IS = CX 1 + tan 2 δ S ⋅ CS 1 + tan 2 δ X (3) arg I X − arg I S = δ S − δ X Assuming a nondissipative standard capacitor (tan δS = 0), the dissipation factor tan δX and the capacitance CX of the test capacitor can be calculated directly from the ratio and the phase displacement of the input currents, that is tan δ X = − tan (arg I X − arg I S ) CX = IX IS ⋅ CS ⋅ 1 + tan 2 δ X (4) 3. DISSIPATION FACTOR STANDARDS Dissipation factor standards can also be used to calibrate the dissipation factor function of high voltage capacitance bridges. One needs a known standard capacitor CS with negligible dissipation factor (tan δS = 0) and a dissipation factor standard with known capacitance CX and known dissipation factor tan δX. Fig. 1. Measurement system at high voltage. On the high-voltage side, the standard capacitor and the test capacitor are connected to the high voltage UHV (with amplitude UHV and phase δU) and the low-voltage terminals are connected to the inputs ES and EX of the bridge (which are nearly at ground potential). The bridge measures the complex ratio of the input currents IS and IX. Assuming that lossy capacitors are modeled as a series circuit of reactance 1/ωC and loss resistance R, where the dissipation factor (loss tangent) tan δ = D = ωCR, the amplitudes of the input currents are IS = IX = ωCS U HV 1 + tan 2 δ S ωC X U HV 1 + tan 2 δ X VIII Semetro. João Pessoa, PB, Brazil, June 17 – 19, 2009 (1) Fig. 2. Dissipation factor standard. Such standards consist of a series-connected (parallel arrangements can also used but are not studied here) threeterminal standard gas capacitor and a three-terminal conductance, shown schematically in Fig. 2, where C12 is the direct capacitance of the shielded reference capacitor, G23 is the conductance between the terminals of the shielded conductance box, and C14, C34 and C24 are stray capacitances to ground. Note that C24 comprises the sum of two parallel ground capacitances, C24’ and C24”, of the component boxes and coupling connector. The design is similar to that described in [3]. It is straightforward to show that the dissipation factor of the network is [3] tan δ X = ω (C12 + C 24 ) G23 (5) Also the effective parallel conductance G13 of the network is ( C13 = C12 1 + tan δ X2 ( capacitance ) G13 = ωC12 tan δ X 1 + tan δ X2 ) C13 and (6) The equivalent capacitance C13 is the original threeterminal capacitance C12 reduced by a factor of (1+tanδX2)−1. The dissipation factor tanδX, as seen from (5), is directly influenced by the presence of the combined stray junction capacitance to ground C24 and therefore a very stable and reproducible value for this capacitance is necessary after reassembling the standard or changing the series conductance box. It is desirable to keep the combined stray junction capacitance C24 as small as possible relative to C12. The dissipation factor standards should have stable values of dissipation factor tanδX and capacitance C13 as defined by (5) and (6), respectively. A highly stable capacitance C12 should be used. A gas dielectric, hermetically sealed, threeterminal standard capacitor with nominal value of 1000 pF was chosen. This capacitor has GR874 connectors. The direct capacitance C12 of the standard capacitor was determined at 400 Hz, 800 Hz, 1 kHz and 1.6 kHz with an accurate coaxial capacitance bridge [9]. The value at 60 Hz was predicted to be (999.992 ± 0.002) pF using regression techniques [10]. The resistors should be stable with a temperature dependence of less than 10−5/°C, and have negligible time constant at 50-60 Hz (time constant less than 10−7 s). The resistance values should be selected to match the measured capacitance values C12 and C24, and produce the desired tanδX from (5). Five conductance boxes were built. Four of them contain hermetically-sealed, H-type Vishay precision resistors with the nominal values: 100 Ω, 500 Ω, 5 kΩ and 50 kΩ. One box contains a 294 kΩ metal-film resistor. Each nickel-plated conductance box has dimensions: 35 x 35 x 75 mm. The box has an N-type input connector and a BNC-type output connector. The standard capacitor and the conductance box were connected with N-type coaxial connector and adapters to ensure a very stable and reproducible value for the stray capacitance C24. Two adapters were in fact needed: a GR874-N adapter and an N-N adapter. The combined stray VIII Semetro. João Pessoa, PB, Brazil, June 17 – 19, 2009 ground capacitance value C24, which includes both the internal ground capacitance of the standard capacitor C24’ (= 66.4 pF) and that for the conductance box C24” (= 11.7 pF) was determined with a commercial low-frequency impedance analyzer to be (78 ± 4) pF. Table I lists the standard uncertainties associated with the dissipation factor that can be obtained with this method. As stated in the introduction, this method has some shortcomings: a high-voltage apparatus is required, the number of test points is restricted to the number and values of the standards available, and the dissipation factor uncertainty increases with the actual dissipation factor being measured (this is due to the uncertainty contribution associated with the measurement of the combined stray junction capacitance to ground C24). TABLE I DISSIPATION FACTOR1 Nominal u(DX) Dissip.Factor (k = 1) 5⋅10−5 0.000003 2⋅10−4 0.000003 2⋅10−3 0.000005 2⋅10−2 0.000043 1⋅10−1 0.00025 (1) CX/CS = 1:1. The operating principle of a new approach designed to overcome those problems is detailed in the next section. 4. OPERATING PRINCIPLE The new measurement system for the calibration of highvoltage capacitance and dissipation factor bridges is depicted in Fig. 3. The output voltages of two synchronized, programmable signal generators (GEN1 and GEN2) [11] are applied to the inputs ES and EX of the bridge under test via two calibrated resistors with impedances Z1 and Z2 (with ac resistances Z1 and Z2, and phase angles arg Z1 and arg Z2, respectively). Two high-resolution, integrating digital sampling voltmeters in a master-slave configuration [12] (DVM1 – master and DVM2 – slave) are used to measure the voltages V1 and V2 (with amplitudes V1 and V2, and phases arg V1 and arg V2, respectively) applied to both the resistors and the current-comparator ratio windings (N1 and N2). The errors caused by the impedances of N1 and N2 (and interconnecting leads) are automatically corrected with amplifier circuits (A1 and A2, respectively) that provide the error currents (see section 6 for construction details). The two DVMs, controlled by the algorithm in [6], can measure the amplitude ratio V2/V1 and the phase displacement arg V2 − arg V1 of the two output voltage signals with an uncertainty of a few parts in 106 and a few microradians, respectively. The amplitude ratio and the phase displacement of the input currents are therefore IX IS = V2 V1 ⋅ Z1 Z2 arg I X − arg I S = argV 2 − argV 1 + arg Z 1 − arg Z 2 (7) Well-defined resistors with high stability and low residual reactances are available in metallic film units and resistors of this type are used. Their impedance ratio should preferably be evaluated. However, the resistance ratio at power frequencies can be estimated from the dc resistance ratio R2/R1 within a few parts in 106. In addition, by symmetrical construction the phase angles of the resistors may be assumed equal within a few microradians. With these simplifying assumptions, IX IS = V2 R ⋅ 1 V 1 R2 (8) arg I X − arg I S = argV 2 − argV 1 Assuming a nondissipative standard capacitor, i.e., tan δS = 0, the reference values of dissipation factor and capacitance ratio for an unknown capacitor are, from (4) and (8), tan δ X ref = − tan (arg V 2 − argV 1 ) CX CS V R = 2 ⋅ 1 1 + tan 2 δ X ref ref V 1 R2 (9) The fundamental frequency f0 can be known from the number of null-crossings of the signal applied to DVM1. The sampling parameters are evaluated as in [13] (see Table II). A total of n acquisitions of N samples at times ti = itsamp, i = 0, 1, …, N−1, are taken. The internal level trigger of DVM1 is used to start each k-th acquisition (k = 0, …, n−1) delayed by ktD from a signal null crossing, where tD approaches 1/nf0. The corresponding acquisitions of DVM2 are delayed by ktD+d from those signal null-crossings, where d is the delay between the two time series due to the external trigger delay and the DVM phase responses. The A/D converter aperture times of both DVMs are selected to prevent trigger-too-fast errors (taper = tsamp − 0.00003 s) [13]. TABLE II SAMPLING PARAMETERS Parameter 50 Hz 60 Hz n 12 12 N 1127 1144 tsamp 0.001118 s 0.001049 s taper 0.001088 s 0.001019 s f0 49.998997 Hz 59.998814 Hz 2π f0d 155.10 µrad 186.13 µrad It is assumed that each acquisition can be fitted with a truncated Fourier series with three harmonics (this is reasonable as low-distortion signal sources are being used to generate the sinusoidal signals). The model assumes that the data set has a zero mean value (any nonzero average value has been subtracted from the data). In matrix notation, y pk = Wpk x p , (10) where the subscript p = 1 for DVM1 and p = 2 for DVM2, ypk is the N-data vector at the k-th acquisition for each DVM, W1k is the known N × 6 matrix with (i, j)-th element cos[2πjf0(ti+ktD)] for j = 1, 2, 3 and sin[2π(j−3)f0(ti+ktD)] for j = 4, 5, 6, W2k is the known N × 6 matrix with (i, j)-th element cos[2πjf0(ti+ktD+d)] for j = 1, 2, 3 and sin[2π(j−3)f0(ti+ktD+d)] for j = 4, 5, 6, and xp is the 6-vector of fitting parameters for each DVM, uncorrected for the systematic effects. The vector xp is estimated from the average of the discrete Fourier transforms over all acquisitions [14][15] xp = Fig. 3. Calibration system. 5. MEASUREMENT PROCEDURE DVM1 (master) assumes the role of establishing the timing for the whole sampling process. DVM2 (slave) is configured for external triggering; it samples its input signal only when DVM1 sends (through an output connector of the instrument) a digital signal to the trigger input of DVM2 indicating when a reading is being carried out. Therefore, the digital circuits of the two converters are linked through a fixed delay. VIII Semetro. João Pessoa, PB, Brazil, June 17 – 19, 2009 2 nN n −1 ∑ W′ y pk pk (11) k =0 where the prime (′) means transpose. Denoting by xp(j) the j-th element of xp, the fundamental voltage amplitude ratio and phase displacement are V2 V1 = x 22 (1) + x 22 (4 ) k DC1 ⋅ k DC2 x12 (1) + x12 (4 ) x (4 ) x (4 ) arg V 2 − arg V 1 = tan −1 − 2 − tan −1 − 1 x 2 (1) x1 (1) (12) where kDC1/kDC2 is the ratio of the corrections for the dc voltage mode error of each DVM. The above equations require knowledge of the delay d and the ratio kDC1/kDC2. In order to evaluate them, an initial voltage measurement is done with GEN1 output signal applied to both DVMs (GEN2 output is now left disconnected). In this case, the reported voltage amplitude ratio and phase displacement should ideally be unity and null degree, respectively. The algorithm measures the uncorrected values (assuming d = 0 and kDC1/kDC2 = 1) and evaluates the delay d and the ratio kDC1/kDC2 so that the readings 1.000000 and 0.0000o are reported for the amplitude ratio and phase displacement, respectively. The corrections are very stable [6][12] and are used in the subsequent measurements. of about 1 Ω and negligible leakage inductance, the error current is 0.04 µA or two parts in 104 of the test current (0.2 mA). Therefore, precision resistors with 0.1% tolerance are required in the amplifier to provide the error current within a few parts in 107. The precision requirement is less stringent for R1 = 50 kΩ, where the error current is 0.4 nA or two parts in 105 of the test current (0.02 mA). The lower the resistor values are the more precise they should be. The two DVMs are then connected as described in Fig. 3 to measure the amplitude ratio V2/V1 and the phase displacement arg V2 − arg V1 of the two output voltage signals. The measured values are then inserted in (9) to obtain the reference values of capacitance ratio and dissipation factor for an unknown capacitor. The calibration system can simulate any capacitance ratio from 1:1 to 10:1 (other capacitance ratios can be simulated by using resistors of different values) and any dissipation factor from 0 to 1 (or more) at power frequencies. For standardization purposes, the control software allows the user to simulate (a) integer capacitance ratios from 1:1 to 10:1 at a dissipation factor of 1⋅10−6 or (b) decadic dissipation factors from 1⋅10−6 to 1 at 1:1 capacitance ratio. The corresponding amplitude ratio and phase displacement of the two voltage signals are then set and measured automatically. The fine adjustment of the signal generators however may require user intervention. The reference values of capacitance ratio and dissipation factor are then reported. Several repetitions are made to evaluate the experimental standard deviation of the reference values due to the stability of the generators. The average of the reference values over all those repetitions is finally reported. The whole measuring process takes about two minutes for each test point. The electronic bridge is set to the specific test point and its readings are compared with the simulated reference values reported by the calibration system. Fig. 4. Amplifier circuit A1. The resistor and amplifier boxes have a coaxial design (Fig. 5). Both are nickel-coated to reduce the contact resistances. The output voltages of the signal generators are sampled by the digital voltmeters through the connectors on top of the resistor boxes. This is done to avoid the voltage drops in the output leads of the signal generators. 6. CONSTRUCTION OF THE AMPLIFIERS Battery-operated amplifier circuits are needed to offset the dependence of the injected currents on the impedance of the leads and the current-comparator ratio windings. They inject the error currents. Such amplifiers have been used extensively in current-comparator-based bridges [16][17]. The basic circuit of the amplifier A1 is shown in Fig. 4 (the circuit of the amplifier A2 is similar). Assuming a voltage drop ξ1 across the current comparator ratio winding N1 (and interconnecting leads), the voltage drop across the impedance Z1 in Fig. 3 is V1 − ξ1 and the error current is then ξ1/Z1. The amplifier outputs a voltage 2ξ1 so that the current ξ1/Z1′ is injected. This current is nearly equivalent to the error current since Z1′ and Z1 are equal in magnitude to R1. For instance, assuming that V1 = 1 V, R1 = 5 kΩ and that the current comparator ratio winding N1 has a resistance VIII Semetro. João Pessoa, PB, Brazil, June 17 – 19, 2009 Fig. 5 Amplifier boxes (left) and resistor boxes (right). We have recently verified that sometimes the bridge under calibration became damaged immediately after conducting the test. An investigation has been made to solve the problem. It was found that the cause was an unbalance in the outputs of the +VCC and the −VCC voltage regulators that feed the operational amplifier. The solution was to insert a parallel RC circuit between those outputs as illustrated in Fig. 6. The scheme also shows the means used to switch off the circuit and to allow the batteries to be loaded. We chose the operational amplifier OP07 for its accuracy and stability combined with its freedom from external offset nulling. The stability of offsets and gain with time and variations in temperature of such amplifier is excellent. 7. MEASUREMENT UNCERTAINTY Commercial electronic bridges based on [1][2] have been calibrated at |IS| = 0.2 mA (and |IS| = 0.02 mA) with the system described above using R1 = R2 = 5 kΩ (and R1 = R2 = 50 kΩ). More recently, such bridges have also been calibrated with R1 = 50 kΩ and R2 = 5 kΩ for capacitance ratios from 10:1 to 100:1. The standard uncertainties associated with the simulated reference values of capacitance ratio and dissipation factor at |IS| = 0.2 mA are listed in Table III and Table IV, respectively. In addition, the standard uncertainties at |IS| = 0.02 mA are listed in Table V and Table VI. The standard uncertainties for capacitance ratios from 10:1 to 100:1 are listed in Table VII. They were evaluated from (9) by applying the GUM rules [18]. The figures include the contribution associated with the stability of the generators. TABLE V CAPACITANCE RATIO1 Nominal u((CX/CS)ref) Cap. Ratio (k = 1) 1:1 0,000017 2:1 0,000029 3:1 0,000058 4:1 0,000055 5:1 0,00012 6:1 0,00014 7:1 0,00015 8:1 0,00011 9:1 0,00012 10:1 0,00023 (1) DX = 1⋅10−6 and |IS| = 0.02 mA. TABLE VI DISSIPATION FACTOR1 Nominal u(DXref) Dissip.Factor (k = 1) 1⋅10−6 0,000005 1⋅10−5 0,000005 1⋅10−4 0,000005 1⋅10−3 0,000005 1⋅10−2 0,000004 1⋅10−1 0,000006 (1) CX/CS = 1:1 and |IS| = 0.02 mA. Fig. 6. Amplifier circuit A1. TABLE III CAPACITANCE RATIO1 Nominal u((CX/CS)ref) Cap. Ratio (k = 1) 1:1 0,000009 2:1 0,000014 3:1 0,000036 4:1 0,000033 5:1 0,000050 6:1 0,00011 7:1 0,00012 8:1 0,00012 9:1 0,00020 10:1 0,00021 (1) DX = 1⋅10−6 and |IS| = 0.2 mA. TABLE IV DISSIPATION FACTOR1 Nominal u(DXref) (k = 1) Dissip.Factor 1⋅10−6 0,000006 1⋅10−5 0,000006 1⋅10−4 0,000006 1⋅10−3 0,000008 1⋅10−2 0,000006 1⋅10−1 0,000012 (1) CX/CS = 1:1 and |IS| = 0.2 mA. VIII Semetro. João Pessoa, PB, Brazil, June 17 – 19, 2009 TABLE VII CAPACITANCE RATIO1 Nominal u((CX/CS)ref) Cap. Ratio (k = 1) 10:1 0,000084 20:1 0,00015 30:1 0,00026 40:1 0,00054 50:1 0,00045 60:1 0,00085 70:1 0,00054 80:1 0,00097 90:1 0,0015 100:1 0,0021 (1) DX = 1⋅10−6 and |IS| = 0.02 mA. 8. EXPERIMENTAL RESULTS Examples of simulated reference values of capacitance ratio and dissipation factor at |IS| = 0.2 mA and the corresponding average readings of the bridge based on [1] are listed in Table VIII and Table IX, respectively. Tables X and XI list the figures obtained for the bridge based on [2] which has a resolution of 1⋅10−6 for both capacitance ratio and dissipation factor measurements. Table XII shows the results obtained for capacitance ratios from 10:1 to 100:1 for the bridge based on [2]. The tables also list the expanded uncertainties (k = 2) associated with the reference values. The differences between the reference values and the average readings are in general well within those expanded uncertainties. The differences for high values of dissipation factor actually exceed the expanded uncertainties, but the manufacturers do recognize this by suitably decreasing the accuracy claims for such values in their product specifications. TABLE VIII CAPACITANCE RATIO1 (CX/CS)ref U((CX/CS)ref) Reading of (k = 2) bridge [1] 1.000257 0.000084 1.0003 1.999725 0.000086 1.9997 3.00145 0.00016 3.0014 4.00039 0.00013 4.0004 5.00078 0.00019 5.0008 6.00040 0.00017 6.0003 6.99893 0.00019 6.9989 8.00187 0.00030 8.0019 9.00287 0.00041 9.0029 9.99803 0.00031 9.9980 (1) DX = 1⋅10−6 and |IS| = 0.2 mA. TABLE IX DISSIPATION FACTOR1 DXref U((DXref) Reading of (k = 2) bridge [1] 0.000004 0.000014 0.00001 0.000022 0.000014 0.00004 0.000105 0.000016 0.00012 0.000998 0.000016 0.00100 0.010002 0.000021 0.00995 0.099992 0.000029 0.09943 1.00008 0.00085 0.99779 (1) CX/CS = 1:1 and |IS| = 0.2 mA. TABLE X CAPACITANCE RATIO1 (CX/CS)ref U((CX/CS)ref) Reading of (k = 2) bridge [2] 1.000277 0.000025 1.000274 1.999839 0.000032 1.999854 2.99979 0.00010 2.999801 4.000175 0.000070 4.000179 5.00033 0.00013 5.000291 6.00002 0.00029 5.999980 6.99892 0.00026 6.998971 7.99731 0.00038 7.997351 8.99325 0.00041 8.993379 9.99735 0.00048 9.997315 (1) DX = 1⋅10−6 and |IS| = 0.2 mA. TABLE XI DISSIPATION FACTOR1 DXref U((DXref) Reading of (k = 2) bridge [2] -0.000009 0.000012 -0.000009 0.000010 0.000012 0.000012 0.000098 0.000012 0.000096 0.000987 0.000016 0.000984 0.009994 0.000012 0.009958 0.100020 0.000024 0.099679 1 ( ) CX/CS = 1:1 and |IS| = 0.2 mA. VIII Semetro. João Pessoa, PB, Brazil, June 17 – 19, 2009 TABLE XII CAPACITANCE RATIO1 (CX/CS)ref U((CX/CS)ref) Reading of (k = 2) bridge [2] 10,00130 0,00021 10,00135 20,00303 0,00032 20,00314 29,99826 0,00055 29,99858 40,0026 0,0015 40,00319 49,99751 0,00090 49,99814 60,0201 0,0026 60,02179 69,9993 0,0013 70,00066 79,9896 0,0027 79,99240 89,9988 0,0054 90,00114 100,0554 0,0042 100,0581 (1) DX = 1⋅10−6 and |IS| = 0.2 mA. 9. CONCLUSION A new approach for calibrating automated high-voltage current-comparator-based capacitance and dissipation factor bridges has been presented. Input currents from tens of µA to a few mA at power frequencies are synthesized as required for the calibration of such bridges. The ratio and phase displacement of the input currents are estimated from the digitized data using an optimized algorithm for nonsynchronous sampling. The estimates are used to calculate the reference values of capacitance ratio and dissipation factor. The calibration system uses commercially available equipment. It is possible to simulate capacitance ratios from 1:1 to 100:1 with relative standard uncertainties of less than 2.5⋅10−5 and dissipation factors from 0 to 0.1 with standard uncertainties of less than 1⋅10−5. The method has been applied to the calibration of commercial electronic bridges. It is a refinement of an approach described earlier. It leads to larger uncertainties, but is slightly easier to implement, since the digitizers need not be synchronized to the signal generators. AKNOWLEDGMENTS Prof. Endre Tóth (in memoriam) constructed at Inmetro the dissipation factor standards discussed in section 3 that had been used in an old calibration system. Renata Teixeira de Barros Vasconcellos helped me with the operation of the old system after he passed away. Renata also participated in an early stage of this new development and helped me with the initial tests. I thank her for that. I thank also Flavio Senna Acon and Dimas Barbosa Teixeira for building the amplifiers. They did a great job. I am also very grateful to Alexandre Etchebehere for suggesting and implementing the solution (illustrated in Fig. 6) to the amplifier problem reported. Ronaldo Miloski Pessurno was also very instrumental in providing resources for this work. I thank also Flavia Noêmia Cerqueira Leite Geraldo for helping me with recent calibration tests for customers. Finally, I wish to thank Luiz Macoto Ogino for providing the resources for this work. REFERENCES [1] P. Osvath and S. Widmer, “High-voltage high-precision selfbalancing capacitance and dissipation factor bridge for industrial measurements”, 4th Int. Symp. High Voltage Engineering Conf. Dig., Athens, Greece, Sep. 5-9, 1983, pp. 64.01-03. [2] E. So, “A microprocessor-controlled high-voltage currentcomparator-based capacitance bridge”, IEEE Trans. Pow. Deliv., 5, no. 2, pp. 533-537, Apr. 1990. [3] R. D. Simmon, G. J. FitzPatrick and O. Petersons, “Calibration of dissipation factor standards”, IEEE Trans. Instrum. Meas., 48, no. 2, pp. 450-452, Apr. 1999. [4] G. Ramm and H. Moser, “Calibration of electronic capacitance and dissipation factor bridges”, IEEE Trans. Instrum. Meas., 52, n. 2, pp. 396-399, Apr. 2003. [5] G. Ramm, H. Moser and A. Braun, “A new scheme for generating and measuring active, reactive, and apparent power at power frequencies with uncertainties of 2.5 x 10⁻⁶”, IEEE Trans. Instrum. Meas., 48, no. 2, pp. 422-426, Apr. 1999. [6] G. A. Kyriazis and M. L. R. Campos, “An algorithm for accurately estimating the harmonic magnitudes and phase shifts of periodic signals with asynchronous sampling”, IEEE Trans. Instrum. Meas., 54, no. 2, pp. 496-499, Apr. 2005. [7] G. A. Kyriazis, “Calibration of high-voltage currentcomparator-based bridges using nonsynchronous digital sampling, CPEM Digest, Broomfield, USA, Jun. 2008, pp. 198-199. [8] G. A. Kyriazis, “Calibration of high-voltage currentcomparator-based bridges using nonsynchronous digital sampling, IEEE Trans. Instrum. Meas., 58, no. 2, Apr. 2009, in publication. [9] G. A. Kyriazis, R. T. B. Vasconcellos, L. M. Ogino et al., “Design and construction of a two terminal-pair coaxial capacitance bridge”, in Proc. of the VI SEMETRO, pp. 57-62, Rio de Janeiro, Sep. 21-23, 2005. [10] G. M. Rocha and G. A. Kyriazis, “A software for the evaluation of the stability of measuring standards using Bayesian statistics”, in Proc. 13th IMEKO International Symposium on Measurements for Research and Industry Applications, v. 1, pp. 386-391, Athens, Sep.29-Oct.1, 2004. [11] Agilent 33250A, 80 MHz Function/Arbitrary Waveform Generator – User’s Guide, Ed. 2, Aug. 2002. [12] U. Pogliano, “Use of integrative analog-to-digital converters for high-precision measurement of electrical power”, IEEE Trans. Instrum. Meas., 50, no. 5, pp. 1315-1318, Oct. 2001. [13] R. L. Swerlein, “A 10 ppm accurate digital ac measurement algorithm”, Proc. NCSL Workshop and Symposium, Albuquerque, Aug. 1991, pp. 17-36. Available: http://www.agilent.com. [14] G. A. Kyriazis and M. L. R. Campos, “Bayesian inference of linear sine-fitting parameters from integrating digital voltmeter data”, Meas. Sci. Tech., 15, pp. 337-346, Feb. 2004. Erratum: pp. 1047. [15] G. A. Kyriazis, “An orthogonal design of experiments for accurately estimating harmonics of low frequency periodic signals”, IEEE Latin America Transactions, 6, no. 1, pp. 1-8, Jan. 2008. In Portuguese. [16] W. J. M. Moore and K. Ayukawa, “A current comparator bridge for power measurement”, IEEE Trans. Instrum. Meas., 25, pp. 550-553, Dec. 1976. [17] G. A. Kyriazis, N. M. Oldham and M. Werneck, “A currentcomparator-based bridge for calibrating power and energy standards at 50/60 Hz”, CPEM Digest, Ottawa, Canada, Jun. 2002, pp. 256-257. [18] BIPM, IEC, IFCC, ISO, IUPAC, IUPAP and OIML 1995 Guide to the expression of uncertainty in measurement (Geneva, Switzerland: International Organization for Standardization). VIII Semetro. João Pessoa, PB, Brazil, June 17 – 19, 2009
Download