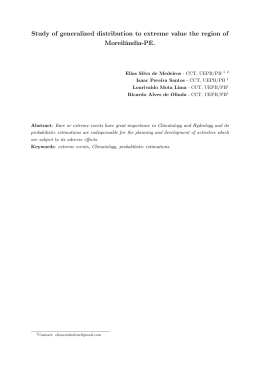
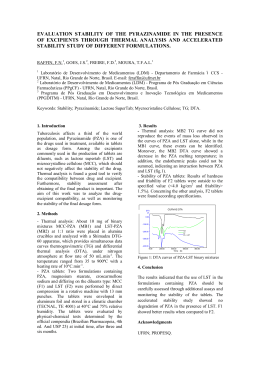
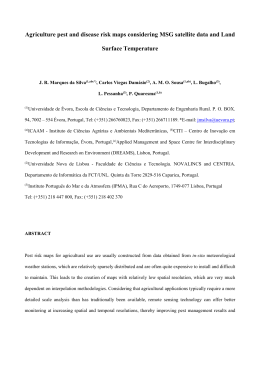
November
Water
Vapour
Sensitivity
of
the
(A)ATSR
LST
Algorithm
NILU, PO Box 100, Kjeller, 2027 Norway Email: [email protected] Water vapour affects all of the infrared channels of the (A)ATSR, causing greater absorption at the shorter wavelength channel (11 µm) than at the longer wavelength channel (12 µm). This differential water vapour absorption effect is exploited in the (A)ATSR LST algorithm by assuming it is almost linear, and assigning a certain amount of the observed brightness temperature difference (T11‐T12) due to water vapour absorption and another amount (of varying sign) to effects of the surface. Acknowledging that the water vapour effect is not always linear, a weak direct water vapour parametrization was introduced into the algorithm. The form of the parametrization is such that there is a dependence on the precipitable water amount (integrated total column) and the viewing angle. In this study we investigate the sensitivity of the parametrization to precipitable water using climatological values based on the NVAP climatology, and consider what improvements might be made by using different ancillary PW data‐sets from NCEP re‐analyses, and from ECMWF water vapour fields. Satellite‐based water vapour measurements are also considered. Fred
Prata
Norwegian
Institute
for
Air
Research
PO
Box
100
Kjeller
2027
Norway
11
Table
of
Contents
1
Background..........................................................................................................3 2
The
water
vapour
correction................................................................................4 2.1 Term 1. ............................................................................................................................................................ 5 2.2 Term 2. ............................................................................................................................................................ 6 3
Alternate
PW
Data‐sets......................................................................................12 3.1 Better temporal resolution………………………………………………………………………………….18 3.2 Better spatial resolution....................................................................................................................... 18 3.3 Consequences of using ERA40 rather than NVAP………………………………………………….18 4
Recommendations .............................................................................................21 5
References.........................................................................................................22
Appendix:
The
ERA‐40
5‐year
PW
climatology……………………………….…………………….23
2 1
Background
The theoretical basis for nearly all satellite‐based infrared land surface temperature (LST) algorithms relies on the assumption that the observed top‐
of‐the‐atmosphere brightness temperature difference, DT, between the T11 (11 µm channel) and T12 (12 µm channel) varies in an almost linear manner with water vapour amount (Prata, 1994). The Clausius‐Clapeyron relation states that the water vapour pressure (e) will vary with the thermodynamic air temperature as, ΔH ⎛ 1 1 ⎞
e = e0 exp{−
−
} R ⎜⎝ T T0 ⎟⎠
where DH is the enthalpy change, R is the gas constant and T is temperature; e0 and T0 are reference values. A plot of e vs T is almost quadratic for most atmospheric conditions. However, for a small amounts of water vapour absorption; that is, when the water vapour concentration is small and the path length is also small, and for air and surface temperatures that are close, the nonlinearity is small. McMillan and Crosby (1984) have shown theoretically, through linearization of the radiative transfer problem and by simulation that water vapour effects can be corrected by assuming that DT varies linearly with water vapour amount. While later studies have shown that by including a non‐
linear term it is possible to improve the atmospheric correction for sea surface temperatures (e.g. Walton, 1988). Since satellites don’t measure thermodynamic temperature, a further approximation must be made that essentially relies on the surface and air temperatures being “not too different”. Given that there may be many circumstances when these assumptions breakdown, the approximation of linearity may be suspect. Nevertheless, it has proved very successful over the oceans, where the air and surface temperatures are seldom very different and large water vapour amounts rare. At high viewing angles the water vapour path amount (the product of the water vapour concentration and the pathlength) can be and nonlinear effects have been noticed. Over the land surface there is a further complication because DT is also affected by the emissivity difference at T11 and T12, which is non‐zero. Thus, although it would seem reasonable to include a second order correction term of the form DT2 for the atmospheric effect (water vapour), this may not be advisable, or more accurate for the surface effect (emissivity). Some researchers have tried to overcome this problem by separating the atmospheric effects from the surface effects using various arguments and mathematical devices. It is straightforward to show that there is always a basic assumption in these types of algorithms that apportions some part of the correction to the atmosphere and some part to the surface. Thus the 3 assumptions must be analysed very carefully, but at a fundamental level it is simply not possible to separate out these effects without some extra independent information, e.g. a direct measurement of the water vapour effect or independent measurements of the spectral emissivities. In the approach adopted for the (A)ATSR and proposed (but improved) for the SLSTR, no separation of the atmospheric and surface effects is made and the problem of nonlinearity of the water vapour effect is treated by adding a correction term that depends on precipitable water, chosen because it is often measured and available. The effect was incorporated through a dependence on the pathlength, that is, through a parametrisation involving the viewing angle. Bothe the parametrisation and the ancillary data (the precipitable water information) can be questioned, and indeed some research suggest that the correction may be too weak. The quality of the precipitable water data is obviously an important and relevant question. Ideally, accurate, timely and spatially collocation PW data should be used. In the event that such data are not available, accurate, validated climatological PW fields might be used. The current (A)ATSR algorithm makes use of the NVAP PW climatology at 0.5x0.5 degree spatial resolution and monthly temporal resolution. This study investigates two questions: 1. How large is the water vapour correction due to the nonlinear effect? 2. How important is the ancillary PW field and what external data set should be utilized for this? 2
The
water
vapour
correction
It is instructive to briefly review the way water vapour effects enter the LST algorithm. The form of the (A)ATSR algorithm currently is (Prata, 2002): LST=a(f,i,pw)+b(f,i)(T11‐T12)n+[b(f,i)+c(f,i)]T12, where, n=cos(θ/m), θ is the satellite zenith view angle, i corresponds to vegetation type, and pw corresponds to precipitable water (in cm). a(f,i,pw)=d [sec(θ)‐1] pw +f a(v,i)+(1‐f) a(s,i), b(f,i)=f b(v,i)+(1‐f) b(s,i), c(f,i)=f c(v,i)+(1‐f) c(s,i), 0 ≤ f ≤ 1. The parameters d and m are free parameters, which will initially take the values, 4 d=0.4, and m=5. These values were determined using simulation data‐sets. Our interest in this study is purely on the water vapour effect so in what follows we make the sweeping assumption that as the water vapour varies all other effects due to the surface are unchanged. This is clearly incorrect, as an atmosphere heavily laden with water vapour would ensure a larger downward infrared radiation flux and some of this larger amount of radiation would be reflected back towards the satellite by a non‐black, non‐grey surface. The terms that are water vapour dependent are: Term 1. (T11‐T12)n, n=cos(θ/m), m=5, θ=view angle. Term 2. d [sec(θ)‐1] pw, pw=precipitable water amount (cm). 2.1 Term 1. Figure 1a shows the variation of n with θ. The variation is very weak, especially considering that the (A)ATSR view angle does not exceed 25 degrees. Figure 1b shows the size of the ‘extra’ atmospheric correction varies with the exponent, n. The ‘extra’ correction is the additional amount of temperature correction obtained compared to that when n=1. Figure 1 (a) Variation of exponent n with viewing angle. (b) Variation of exponent with size of the temperature correction for two values of DT. Even for quite high values of the viewing angle and DT, the atmospheric effect, the size of the variation is less than 0. 1 K. Essentially the algorithm is operating with almost linear dependence and n=1. However, the intention of introducing this into the algorithm was to allow some tuning of the term, since the algorithm was developed using simulations and validated on just a very small subset of all possible scenarios. Allowing m to take smaller values permits much greater variation. Figure 2 shows the variation of the temperature correction with viewing angle for DT=2 K and for two values of m: m=0.5 and m=0.25. Notice 5 that as m becomes smaller the temperature correction flattens out with greater pathlength, which is a desirable behaviour. Figure 2. Variation of temperature correction with view angle for two different values of the parameter m, when DT=2 K. As implemented with m=5, the algorithm is in all likelihood not accounting for the nonlinear effect of large water vapour pathlengths. However, it is a very simple matter to adjust this parameter, perhaps using values for m that are both spatially and temporally variable. Values for m could be determined through a radiative transfer simulation exercise and validated using data for dry and moist atmospheres. Finally, one ugly aspect of the algorithm is that when DT<0, the correction is undefined for some values of n (e.g. n<1). This was considered in the implementation of the algorithm, as it is possible for DT <0. Since these conditions are observed it demonstrates that there is an interaction between the surface and atmosphere. 2.2 Term 2. This term was deliberately introduced into the algorithm to allow for some ‘extra’ water vapour absorption, not directly connected with the mixed atmosphere/surface effects within DT. The recommended value for the parameter d in this term was: d=0.4. As we have noted, q does not have a very large range for the (A)ATSR, and hence sec(q) varies from 1.07 to about 1.10. PW may vary from 0 to 8 cm and so the maximum range of Term 2 is from ~0 K to ~0.3 K, with very little variation across the scan. 6 In order to assess the size and variation of this correction with the variation in PW, a simulation was conducted by using a monthly mean LST field based on the well‐known formulation for surface insolation, which is the main driver for LST variation. The form of this forcing function is: η = cos −1 {cosθ cos φ + sin θ sin φ }
⎛ 2π dn ⎞
φ = ς sin ⎜
⎝ 365.25 ⎟⎠
dn = day
Ts = T0 + A0 cos η
where, h=solar zenith angle, z=earth inclination angle, q=latitude, dn=day of year T0=273.15 K and A0=30 K. Reasonable looking global LST fields were obtained with this function. The intention here is not to simulate the LST, but rather investigate the sensitivity of the LST to Term 2, which depends on two factors: the view angle and the PW amount. Global monthly PW fields are prescribed from the NVAP climatology currently in use in the operational algorithm. The results are presented as differences between the LST obtained when Term 2=0 and with a fully implemented algorithm with full variation of all parameters. Simulations were run for all months and for view angles varying from 10 to 40 degrees, however we show results for January and August and for view angles of 10 and 40 degrees to cover the main variation. Each plot shown has three panels: top panel: the LST field, middle panel: PW field, bottom pane: temperature difference between LST with Term 2 and without Term 2 (this was achieved by setting PW=0 and re‐running the processor). 7 Figure 3. Top panel: LST (K) for January with view angle set to 0 degrees. Middle panel: Precipitable water for January from NVAP climatology. Bottom panel: Temperature difference between LST with Term 2 incorporated and Term 2 set to 0. 8 Figure 4. Top panel: LST (K) for January with view angle set to 30 degrees. Middle panel: Precipitable water for January from NVAP climatology. Bottom panel: Temperature difference between LST with Term 2 incorporated and Term 2 set to 0. 9 Figure 5. Top panel: LST (K) for August with view angle set to 0 degrees. Middle panel: Precipitable water for August from NVAP climatology. Bottom panel: Temperature difference between LST with Term 2 incorporated and Term 2 set to 0. 10 Figure 6. Top panel: LST (K) for August with view angle set to 30 degrees. Middle panel: Precipitable water for August from NVAP climatology. Bottom panel: Temperature difference between LST with Term 2 incorporated and Term 2 set to 0. 11 For the cases with q=10 degrees the temperature difference is zero. With q=30 degrees differences are positive everywhere and follow the trend in PW, as expected. The size of the correction is of the order +0.3 K and since the correction follows the variation with PW it is easy to diagnose regions and times where and when it has impact. Perhaps, the size of the correction is to small, but it is stressed once again that the form of the correction was designed to allow local tuning in an algorithm that is expected to perform well globally. Thus the parameter d can be set to a suitably larger (or smaller) value and can vary spatially and in time. 3
Alternate
PW
Data‐sets
The NVAP precipitable water climatology is a well‐studied, validated data‐set on a grid scale suitable for use with the (A)ATSR LST algorithm. The time span of the climatology is 8 years, which although cannot really be claimed to represent “climatology” is sufficiently long as to be representative. The PW enters the LST algorithm only weakly; the water vapour effect is supposed to be accounted for in the DT term. The PW is used on a monthly mean basis. If it is determined that the LST algorithm’s sensitivity to water vapour is too weak, and the free parameters m and d are to be used to enhance the water vapour sensitivity, then a relevant question to ask is whether the external water vapour data‐set can be improved. There are two immediate improvements that can be anticipated: 1. Better accuracy. 2. Better resolution (time and space). The first question in some ways is related to the second, as it seems likely that only marginal improvement might be obtained if the monthly time resolution and 0.5 degree x 0.5 degree spatial resolution are retained. Thus we suggest that the first question this is moot or at least academic and probably not worth expending effort on. The second question, which is much more important, requires more detailed analysis. 3.1 Better temporal resolution. Table 1 explores the differences in temporal resolution of various potential water vapour data‐sets. Data Temporal Spatial Vertical Reference ‐set resolution resolution resoluti
(degrees) on NVAP Monthly 0.5 x 0.5 Column Randel et al. (1996) NCEP‐ 4‐times Spectral Profile http://www.esrl.noaa.gov/ 2 per day (192x94) psd/data/gridded/data.ncep.reanalysis
2 x 2 2.html ECMW 4‐times 1 x 1 Column http://www.ecmwf.int/ F per day 2.5 x 2.5 products/data/archive/descriptions/e4
ERA‐
/index.html 40 Table 1. Some sources for climatological precipitable water data. 12 Currently the NVAP data set is used in the AATSR operational algorithm. To investigate the effects of improvements in temporal resolution, the ERA‐40 data‐
set (Haseler, 2004) was selected for further analysis. These data span a time range of 40 years, but for use as a climatology for the AATSR only five years are utilised. The last complete year is 2001, so the climatology was developed for 1997–2001. The data were composited into monthly means at all four synoptic times: 00UT, 06UT, 12UT and 18UT. Initially the data were retained in their respective years in order to reveal any trends. Figure 7 shows the complete 5 years of data as zonally averaged monthly means for one synoptic time. Figure 7. Zonally averaged monthly mean precipitable water from the ERA‐40 data‐set. No significant trends are noticeable in these data; 1998 appears to be a little anomalous in the equatorial regions with a PW enhancement. Monthly mean, January and July PW at 06UT and 18UT for all 5 years are shown in Figures 8–11. 13 Figure 8. Monthly mean PW (January) for each year of the 5‐year ERA‐40 climatology at 06 UT. 14 Figure 9. Monthly mean PW (January) for each year of the 5‐year ERA‐40 climatology at 18 UT. 15 Figure 10. Monthly mean PW (July) for each year of the 5‐year ERA‐40 climatology at 06 UT. 16 Figure 11. Monthly mean PW (July) for each year of the 5‐year ERA‐40 climatology at 18 UT. 17 Based on these results, the ERA‐40 data‐set of precipitable water would make a good improvement in the temporal resolution over the current NVAP data set. The NVAP data set is also an older climatology extending from 1988–1995, so none of the years overlap with the AATSR archive. The Appendix provides some IDL code for reading the new 5‐year ERA‐40 climatology. 3.2 Better spatial resolution It is anticpated that the land type ancillary data‐set will be increased from its current spatial resolution of 0.5 x 0.5 degrees to about 1 x 1 km2. Ideally, all ancillary data should be supplied at this resolution or better. However, in some cases there may not be much better improvement by going to higher spatial resolution. For data‐sets pertaining to the land surface, it is desirable to capture the main scale of heterogeneity that is also apparent in the observation data‐set. This is 1 x 1 km2 for the (A)ATSR. For data‐sets pertaining to the atmosphere, measurements at 1 x 1 km2 (clear‐sky) over‐sample the scale of heterogeneity, at least for processes that affect infrared clear‐sky satellite meausurements. Thus it is not obvious that a water vapout data‐set at 1 x 1 km2 is needed for the LST algorithm. Moreover, as we have seen the expicit water vapour dependence is an “extra” term, and its impact is quite weak. If this extra correction is to be made stronger, through the m and d parameters, then it is appropriate to consider what spatial scale to utilise. 3.3
Consequences
of
using
ERA40
rather
than
NVAP
Table 1 suggests that it is possible to use data with better coincidence with the satellite measurement, but the spatial scale would be reduced from its present value of 0.5 x 0.5 degrees to perhaps 2.5 x 2.5 degrees (for one version of the ERA‐40 data). Analysis of the NVAP data suggests that decreasing the spatial resolution causes only a small impact. Since the years spanned by each of these data‐sets is different, it is not posible to do a direct inter‐comparison. Table 2 shows the global, NH and SH means for each of the data‐sets. The values are different, perhaps reflecting some change in the climatological vlaues, but the differences are withing the inter‐annually varibilty, shown in the Table as the standard deviation of th 5‐year means. SH Mean Std. Dev. NH Mean Std. Dev. Global Std. Dev. Mean NVAP 23.32 3.20 25.74 5.19 24.53 4.20 ERA40 25.64 5.84 25.05 3.71 25.34 4.78 Table 2. Comparison of 8‐year means for the NVAP and 5‐year means for the ERA40 precipitable water vapour data sets in units of kgm‐2. The NVAP data span the years 1988–1992, while the ERA40 data span the years 1997–2001. 18 The ERA‐40 data better coincide with the ATSR‐2 and AATSR data and hence are probabaly a better climatology. The seasonal variations from year to year for each of the data sets are shown in Figures 12 and 13 for NVAP and ERA‐40, respectively. (a) Global mean
36
1988
34
Precipitable water (kgm-2)
1989
1990
32
1991
1992
30
1993
1994
28
1995
26
24
22
20
18
Jan
Feb
Mar
Apr
May
Jun
Jul
Time (months)
Aug
Sep
Oct
Nov
Dec
Sep
Oct
Nov
Dec
Sep
Oct
Nov
Dec
(b) Southern hemisphere
36
Precipitable water (kgm-2)
34
32
30
28
26
24
22
20
18
Jan
Feb
Mar
Apr
May
Jun
Jul
Time (months)
Aug
(c) Northern hemisphere
36
Precipitable water (kgm-2)
34
32
30
28
26
24
22
20
18
Jan
Feb
Mar
Apr
May
Jun
Jul
Time (months)
Aug
Figure 12. NVAP seasonal, and inter‐annual variation of precipitable water for (a) the Globe, (b) the Southern Hemisphere and (c) the Northern Hemisphere. 19 (a) Global mean
36
1997
34
Precipitable water (kgm-2)
1998
1999
32
2000
2001
30
28
26
24
22
20
18
Jan
Feb
Mar
Apr
May
Jun
Jul
Time (months)
Aug
Sep
Oct
Nov
Dec
Sep
Oct
Nov
Dec
Sep
Oct
Nov
Dec
(b) Southern hemisphere
36
Precipitable water (kgm-2)
34
32
30
28
26
24
22
20
18
Jan
Feb
Mar
Apr
May
Jun
Jul
Time (months)
Aug
(c) Northern hemisphere
36
Precipitable water (kgm-2)
34
32
30
28
26
24
22
20
18
Jan
Feb
Mar
Apr
May
Jun
Jul
Time (months)
Aug
Figure 13. ERA40 seasonal, and inter‐annual variation of precipitable water for (a) the Globe, (b) the Southern Hemisphere and (c) the Northern Hemisphere. The consequence of degrading the spatial resolution of the precipiatbel water data‐set from 1°x1° to 2°x2° and then to 4°x4° is illustrated in Table 3. It can be 20 seen that there are differences of a few % between the global, NH and SH means, and the impact is therefore not significant for our application. NVAP SH Mean Std. Dev. NH Mean Std. Dev. Global Std. Dev. Mean 1°x1° 23.32 3.20 25.74 5.19 24.53 4.20 2°x2° 23.03 3.21 26.00 5.13 24.51 4.17 4°x4° 23.17 3.17 27.11 4.78 25.14 3.97 ERA 25.64 5.84 25.05 3.71 25.34 4.78 Table 3. Effect of degrading the spatil resolution of the precipitable water data‐
set on global, NH and SH means. The last row shows the values for the ERA‐40 data‐set. Note that the years analysed for NVAP and ERA‐40 are different, so a dierct comparison cannot be made. It is concluded that the extra value of having near coincident data outweighs the loss due to reducing spatial resolution. 4
Recommendations
Based on the results of this short study the following recommendations have been developed: 1. The current algorithm has sufficient free parameters that suitable local tuning of the coefficients for additional water vapour correction is possible. 2. Radiative transfer simulations will be needed to confirm that the form of the tuning is sufficient to cover the majority of atmospheric situations. 3. The explicit water vapour dependence in the current LST algorithm can be made stronger and locally tuned by developing new values for the parameters m and d. These parameters control the corrections terms that depend on DT (T11‐T12) and an off‐set term that has a view angle dependence. 4. The time and space scales for these parameters must be the same as the PW data set, yet to be selected, but currently monthly and 0.5 x 0.5 degrees. 5. The method of determination of the parameters should be through radiative transfer simulations. 6. The spatial scale of the PW data set is less important than the time scale. If it is possible to use PW data obtained close to the satellite overpass then this should be used. 1 x 1 degree spatial resolution is acceptable. 7. A base climatological PW data‐set should be maintained. This has been developed from the ERA‐40 re‐analysis data supplied by ECMWF. A global data‐set, 4‐times daily at 2.5 x 2.5 degree resolution has been derived and supplied with this Report. 8. The interaction between surface effects and atmospheric effects needs further study, once the new tuning parameters have been implemented. 21 5
References
Haseler, J., ERA‐40: ECMWF 45‐year reanalysis of the global atmosphere and surface conditions 1957–2002, ECMWF Newsletter, No. 101, 2–30, 2004. McMillin, L. M., and Crosby, D. S., Theory and validation of the multiple window sea surface temperature technique, J. Geophys. Res., 89, 3655–3661, 1984. Prata, A.J., Land surface temperature measurement from space: AATSR algorithm theoretical basis document. Contract report to ESA, CSIRO Atmospheric Research, Aspendale, Victoria, Australia, 27pp, 2002. Prata, A. J., Surface temperatures derived from the advanced very high resolution radiometer and the along track scanning radiometer. 1. Theory, J. Geophys. Res., 98(D9), 16,689–16,702, 1994. Randel et al., A New Global Water Vapor Dataset. Bull. Amer. Meteorol. Soc., 77(6), 1233–1246, 1996. Walton, C. C., Nonlinear multichannel algorithms for estimating sea surface temperature with AVHRR satellite data, Journal of Applied Meteorology, 27, 115‐27, 1988. 22 Appendix:
The
ERA‐40
5‐year
PW
climatology
Data‐set: ERA‐40 Time‐span: January 1997–December 2001. Resolution: Monthly, 2.5 degrees x 2.5 degrees, 4 synoptic times (00,06,12,18UT) URL: Dimensions: REAL*4 PW(144,72,12,4) UNITS: kg m‐2 144 Longitudes from 0° to 357.5° 73 Latitudes from +90° to ‐90° 12 months from January to December 4 times, 00,06,12,18UT Data‐set name: ERA40PWmonthly.dat File type: Binary (flat) Example IDL code reader: function read_ERA40 ;‐‐‐‐‐‐‐‐‐‐‐‐‐‐‐‐‐‐‐‐‐‐‐‐‐‐‐‐‐‐‐‐‐‐‐‐‐‐‐‐‐‐‐‐‐‐‐‐‐‐‐‐‐‐‐‐‐‐‐‐‐‐‐‐‐‐‐‐‐‐‐‐‐‐‐‐‐; ; Name: read_ERA40.pro ; ; ; ; Purpose: Reads the ERA40 PW data‐set for use with the ; ; AATSR algorithm. ; ; ; ; Inputs: None ; ; Outputs: Data, FLTARR(144,73,12,4) ; ; 1st dimension 144 longitudes ; ; [0, 357.5] in steps of 2.5° ; ; 2nd dimension 73 latitudes ; ; [90, ‐90] in steps of 2.5° ; ; 3rd dimension 12 months ; ; [Jan, Feb, …, Dec] ; ; 4th dimension 4 times ; ; [00, 06, 12, 18] UT ; ; Auxilliary: ERA40PWMonthly.data ; ; ; ; Programmer: Fred Prata ; ; Date: 19.11.2009 ; ; Version: 1.0 ; ; ‐‐‐‐‐‐‐‐‐‐‐‐‐‐‐‐‐‐‐‐‐‐‐‐‐‐‐‐‐‐‐‐‐‐‐‐‐‐‐‐‐‐‐‐‐‐‐‐‐‐‐‐‐‐‐‐‐‐‐‐‐‐‐‐‐‐‐‐‐‐‐‐‐‐‐‐‐; data=fltarr(144,73,12,4) ; format is longitudes, latitudes, months, times openu,1,'ERA40PWMonthly.dat' readu,1,data close,1 return,data end 23
Download