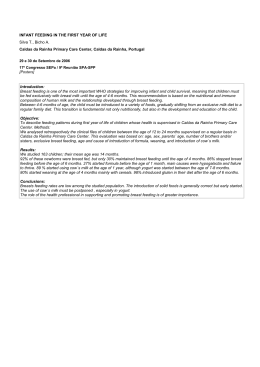
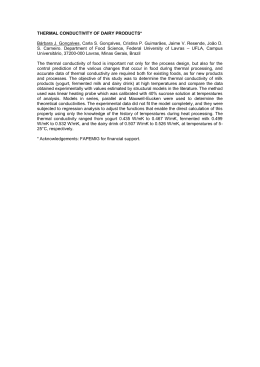
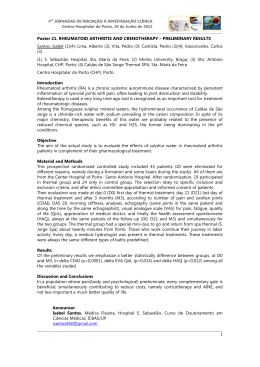
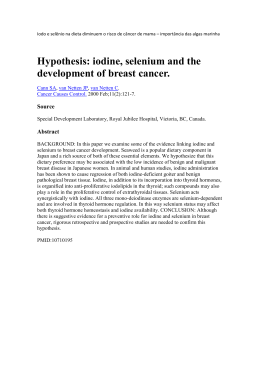
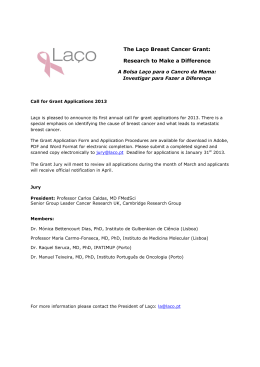
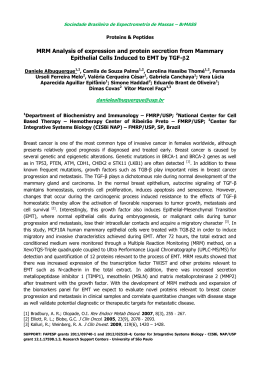
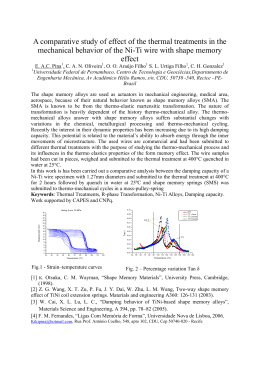
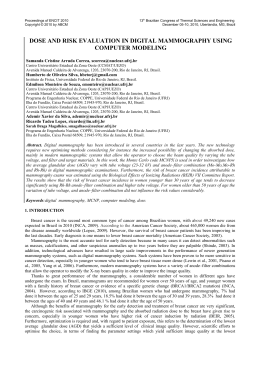
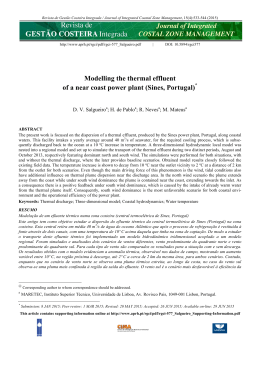
Using a new method in thermal images to diagnose early breast
diseases
Rodrigo Carvalho Serrano, Leonardo Motta, Mônica Batista, Aura Conci
Computer Institute - Federal Fluminense University
images were acquired as part of a project of a thermal
image data base.
Abstract
This paper presents a study for diagnosis of breast
diseases in early stages (tumors, fibroadenomas, cyst)
using thermal images. Initially the thermal image is
segmented in two new images. These images will be
used at the new method proposed. The original
contributions of this work are the use of thermal image
on diagnosis of breast disease and an approach that
classifies images.
Keywords:
Processing
Thermography
of
medical
images,
1. Introduction
It is very important the early detection of breast cancer.
Some studies have shown that, if detected early, the
patient with cancer has 85% chance of cure, whereas if
detected late, only 10% [1]. Currently, it has been used
mammography and ultrasound to diagnose early breast
cancer. The most used method is mammography. The
disadvantage of the mammography is that it is invasive
and experts believe that electromagnetic radiation can
also be a triggering factor for cancerous growth. In
contrast, the diagnosis of breast diseases through the
use of thermal imaging is a noninvasive method that
makes use of infrared radiation from the body. The use
of thermal image in medical and biological
applications is very important due to the fact of not
using ionizing radiation, intravenous contrast injection
or breast compression as the other types of exams.
Thus represents a physiological test, while other forms
of diagnosis such as mammography and ultrasound, are
anatomical tests [2]. In the cancerous cells, due to
angiogenesis and high metabolic rates, are at a higher
temperature than the normal cells around it. Malignant
tumors always cause a change in the temperature of the
breast [3]. In addition, thermal image is early detection
of any problem in the breast [4]. The results of
thermography can be correct 8-10 years before
mammography can detect a mass in the patient's body
[5].
Figure 1: The left image corresponds to the thermal
image of a patient with malign tumor and the right
image corresponds to the thermal image of a patient
with normal breast.
3. Pre-processing
The preprocessing stage, intends to separate the left
and the right breast image using five steps. The first
step aims to identify the upper limit of the region of
interest (ROI). The second step’s goal is to find the
ROI’s bottom limit. The objective of the third step is to
discover and erase disconnected pixels from the ROI.
In the fourth step, the lateral limits are detected and
after that, the ROI is separated in two (left and right
breast).
The Figure 2 is going to be used to exemplify each of
these steps.
2. Thermal Images
Each pixel of a thermal image represents a temperature
at the acquired scene (figure 1). The simplest way to
represent thermal imaging is through of shades of gray.
So, a change in temperature is related to the variation
in gray tone of the image. In this paper, we use nine
thermal images (five images of patients with breast
disease and four images of healthy patients). Such
Figure 2: Preprocessing steps.
In order to detect the ROI’s upper limit that
corresponds to the first step, a top-bottom scan is
utilized to find the vertical coordinate of the first pixel
that belongs to the background. The Figure 2a shows
that this pixel is easily identified, because smaller tons
represent lowers temperatures. After that, to find the
breast’s lower’s curve (second step), a threshold based
on the higher temperatures is done as can be notice in
Figure 2b. The bottom limit is set as the lower pixel of
this curve, completing the second step (Figure 2c). In
the third step the goal is to eliminate pixels that do not
belong to the ROI’s area. Using neighborhood four,
pixels are grouped and the area of each group is
calculated. Then, only the group with the biggest area
remains (Figure 2d). Taking the image obtained at the
third step, it is easy to determine the lateral limits
utilizing a left-right scan and where columns are
searched until the first pixel from the ROI’s boundary
is found. The horizontal coordinate of this pixel is set
as the left limit. The same process is repeated from the
right to the left, obtaining the right limit, completing
the fourth step. The last step is accomplish taking the
mean distance of the lateral limits and set it as a central
coordinate in order to divide the image in two equal
parts as showing at the Figure 2e. Finally, one of these
parts is taking as the left breast and the other is taking
as the right breast (Figure 2f).
In the next stage, the extraction of characteristics of
these segmented thermal images is done, using the
method proposed in this paper.
generating an “Image C” with tones of the pixels
between 0 and 1. We calculate the average of the tones
of the pixels of the image C, generating the result
SERR.
5. Results
TABLE 1 - Results found for SERR
Image
2889
SERR Diagnosis
0.1386 Abnormal
3416
3434
0.1394 Abnormal
0.1603 Abnormal
3740
3924
0.1791 Abnormal
0.1532 Abnormal
5077
0.1106
Normal
5462
0.1247
Normal
5528
0.1049
Normal
5855
0.1032
Normal
6. Conclusion
4. Diseases Identification
The proposed method showed good results. In future
work aims to use a larger amount of thermal images
and using fractal geometry and new techniques.
The diagram in figure 3 summarizes the steps of
proposed method.
References
[1] E. Y. K. Ng and N. M. Sudarshan. Numerical
computation as a tool to aid thermo-graphic
interpretation. Journal of Medical Engineering and
Technology, March/April 2001.
[2] Love, T.J., Analysis and application of
thermography in medical diagnosis, in Shitzer, A.;
Eberhart, R. C.: Heat transfer in medicine and biology,
vol. 2, pp. 333-352. New York: Plenum Publishing
Corporation, 1985.
[3] Yahara, T., Koga, T., Yoshida, S. Nakagawa, S.,
Deguchi, H., Shirouzo, K., Relationship between micro
vessel density and thermo graphic hot areas in breast
cancer, Surgery Today, 33 (4), pp. 243-248, 2003
Figure 3: The steps of proposed method.
Initially, a pixel to pixel subtraction on a vertical axis
of symmetry with the two images generated by the
segmentation is done. So, as a result of the subtraction
pixel to pixel will have a “Image R”. Then, it made a
rescheduling of the tones of the pixels in “Image R”,
[4] Ng, E.Y.K., Sudharsan, N.M., Effect of blood flow,
tumor and cold stress in a female breast: A novel timeaccurate computer simulation, Proceedings of the
Institution of Mechanical Engineering in Medicine, 215
(4), pp.392-404, 2001
[5] M. Gautherie. Atlas of breast thermography with
specific guidelines for examination and interpretation
(Milan, Italy:PAPUSA). 1989.
Download