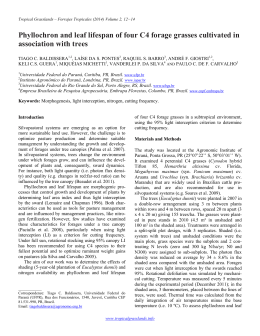
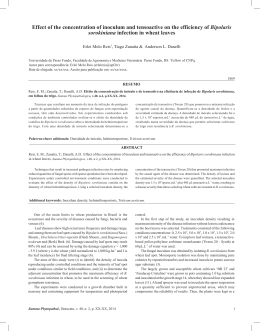
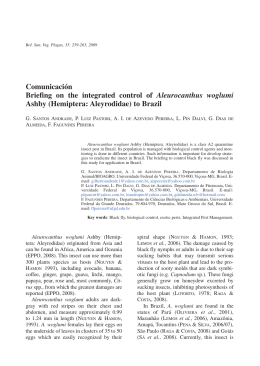
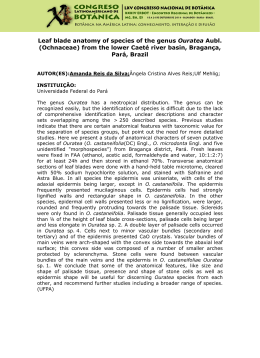
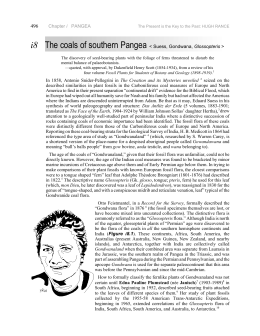
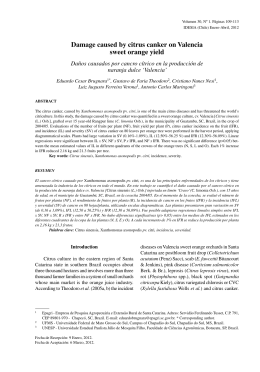
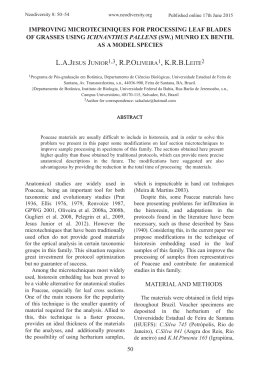
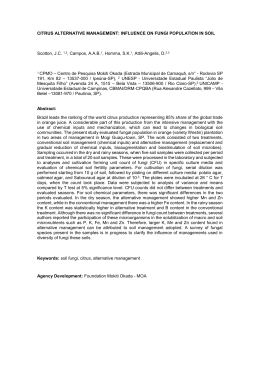
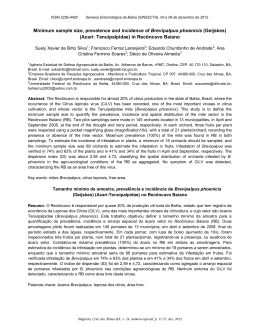
378 Rev. Bras. Agrometeorologia, v. 13, n.2, p.353-368, 2005 RIBEIRO, R. V., et al. - Leaf temperature in sweet orange plants under field condition: influence of meteorological elements Recebido para publicação em 14/07/05. Aprovado em 10/11/05. ISSN 0104-1347 Leaf temperature in sweet orange plants under field condition: influence of meteorological elements Temperatura foliar de laranjeiras em condição de campo: influência de elementos meteorológicos Rafael Vasconcelos Ribeiro1, Eduardo Caruso Machado2, Mauro Guida dos Santos3 Abstract: This study had as objective the evaluation of daily and seasonal changes of leaf temperature in relation to the variation of meteorological elements [global radiation (Qg), air temperature (TAIR) and air vapor pressure deficit (VPD)] in field-grown citrus plants. These environmental variables were monitored inside citrus orchard, with NorthSouth orientation. Leaf temperature (TLEAF) was measured with infrared thermometers (IR) and thermocouples (TC) in both the East and West canopy positions, as also done for micrometeorological monitoring. From these measurements, the difference between leaf and air temperatures (DT) was calculated. The highest leaf temperatures were found in days with high radiation loading (summer), reaching values about 35.5 (IR) and 39ºC (TC). Accordingly, the highest DT values were also noticed in summer, being about 3 (IR) and 8ºC (TC). This discrepancy is due to the light exposure of leaves, i.e. TC measurements evaluated exposed leaves, whereas IR technique measured the temperature of both exposed and non-exposed leaves. In fact, DT varied between 3 and -3ºC during most of day for IR-based measurements. Leaf temperatures measured with TC were always higher than those measured with IR in both canopy positions. The response of leaf temperature to increasing Qg tended to stabilize at values higher than 600 W m-2, whereas the responses to VPD and TAIR had an increase trend. Considering these last variables, leaf temperature and DT were lower in the East position in relation to the West one at values higher than 1.5 kPa and 30ºC. This fact is probably related to differential leaf transpiration when considered the canopy positions, being a question for further studies. Concluding, the highest TLEAF values were found during afternoon and in summer season, which is related to the daily and seasonal pattern of available radiation loading. In studies involving the evaluation of TLEAF in citrus plants, it is important to consider the level of light exposure in leaves. In exposed leaves, changes in TLEAF are directly related to the variation of TAIR, Qg and VPD, showing more or less data scattering depending on environmental variable considered. In relation to the evaluation of TLEAF considering both exposed and non-exposed leaves (given by IR technique), it is shown that TLEAF is directly affected by TAIR. However, changes in TLEAF are more accentuate under low Qg and VPD values, occurring a tendency of TLEAF saturation only for Qg. Some physiological implications of increased leaf temperature are discussed. Key words: canopy, Citrus sinensis, infrared thermometry, micrometeorology. Resumo: Este estudo objetivou a avaliação das variações diárias e sazonais da temperatura foliar em relação à variação dos elementos meteorológicos [radiação global (Qg), temperatura do ar (TAR) e déficit de saturação de vapor do ar (DPV)] em laranjeiras em condição campo. Essas variáveis ambientais foram monitoradas no interior do pomar de citros, com orientação Norte-Sul. A temperatura foliar (TFOLIAR) foi medida com termômetros a infra-vermelho (IV) e termopares (TP) nas posições Leste e Oeste da copa das plantas, como também realizado no monitoramento micrometeorológico. A partir dessas medidas, foi calculada a diferença de temperatura entre folha e ar (DT). As maiores 1 2 3 Agronomist, MSc., Centro de Pesquisa e Desenvolvimento de Ecofisiologia e Biofísica, Instituto Agronômico, IAC APTA/SAA. Avenida Barão de Itapura, 1481, CP 28, 13001-970, Campinas - SP, Brasil. Corresponding author: [email protected] Agronomist, DSc., Centro de Pesquisa e Desenvolvimento de Ecofisiologia e Biofísica, Instituto Agronômico, IAC APTA/SAA. Agronomist, DSc., Departamento de Botânica, Universidade Federal de Pernambuco, UFPE. 50670-901, Recife - PE, Brasil. 379 Rev. Bras. Agrometeorologia, v. 13, n.3, p.378-388, 2005 temperaturas foliares foram verificadas em dias com alta carga radiante (verão), alcançando valores ao redor de 35,5 (IV) e 39ºC (TP). Valores elevados de DT foram também observados no verão, chegando a 3 (IV) e 8ºC (TP). Essa discrepância é devida à exposição luminosa das folhas, i.e. medidas de TP avaliaram folhas expostas, ao passo que a técnica de IV mediu a temperatura tanto de folhas expostas como não-expostas. De fato, DT variou entre 3 e -3ºC durante a maior parte do dia para as medidas baseadas em IV. A temperatura foliar medida com o método de TP foi sempre maior do que a medida com a técnica de IV em ambas posições da copa das plantas. A resposta da temperatura foliar ao aumento de Qg tendeu a estabilizar em valores superiores a 600 W m-2, enquanto que as respostas ao DPV e TAR apresentaram tendência crescente. Considerando essas últimas variáveis, a temperatura foliar e DT foram menores na posição Leste em relação à posição Oeste em valores superiores a 1.5 kPa e 30ºC. Esse fato está possivelmente relacionado à transpiração foliar diferencial quando consideradas as posições na copa, sendo essa uma questão para futuros estudos. Concluindo, os maiores valores de TFOLIAR são observados durante a tarde e na estação de verão, o que é relacionado ao padrão diário e sazonal de energia radiante disponível. Em estudos envolvendo a avaliação de TFOLIAR em citros, torna-se importante considerar o nível de exposição das folhas à luz. Em folhas expostas, as mudanças de TFOLIAR são diretamente relacionadas à variação de TAR, Qg e DPV, mostrando maior ou menor dispersão dos dados, dependendo da variável ambiental considerada. Em relação à variação de TFOLIAR considerando ambas folhas expostas e não expostas (dada pela técnica IV), é mostrado que TFOLIAR é diretamente afetada por TAR. Entretanto, as mudanças em TFOLIAR são mais acentuadas em baixos valores de Qg e DPV, havendo tendência de saturação de TFOLIAR apenas para Qg. Algumas implicações fisiológicas da elevação da temperatura foliar são discutidas. Palavras-chave: Citrus sinensis, copa, micrometeorologia, termometria a infra-vermelho. Introduction The fluctuation of meteorological elements affects citrus growth, productivity (REUTHER, 1977; ORTOLANI et al., 1991; PAULINO & VOLPE, 2001) and fruit quality (ALBRIGO, 1992; VOLPE et al., 2000), being citrus plants subjected to both seasonal and diurnal variation of environmental variables. Under tropical or subtropical conditions, high air temperature is normally found during summer season, whereas low temperatures are verified during winter season. This seasonal pattern is mostly caused by energy availability (ANGELOCCI, 2002; PEREIRA et al., 2002), i.e. incoming solar radiation. As evapotranspiration and rain are also regulated by available energy and atmospheric movements, air relative humidity is another meteorological element with seasonal and diurnal variation that affects citrus physiology (KHAIRI & HALL, 1976a). As there are large changes of environmental elements throughout the year, physiological responses are expected in order to maintain plant temperature around an optimum range. Considering the energy dissipation by physiological mechanisms, the main process involved in the maintenance of leaf or canopy temperature is the transpiration (NOBEL, 1999). Under well-irrigated conditions, most of available energy will be used in evapotranspiration (70-80% of net solar radiation). However, this does not take place under low soil water availability, being the energy used in heating of air, plant and soil (PEREIRA et al., 2002). Obviously, the plant heating above determined temperature threshold has physiological consequences such as reduced photosynthetic activity and probably impaired plant growth and production (KHAIRI & HALL, 1976b; ALBRIGO, 1992), depending on the exposure time (VU, 1999), growth temperature regime (RIBEIRO et al., 2004) and phenological stage in which it happens (REUTHER, 1977; ORTOLANI et al., 1991). In addition, plant heating is affected by the leaf morphology and sky nebulosity (ANGELOCCI, 2002). Two additional aspects that should be considered when studying perennial tree species are the canopy portion exposed to solar radiation as well as the differences of temperature between exposed leaves and overall plant canopy. Among the various practical applications of knowing the leaf temperature variation throughout a year and during a day, it may be pointed out the modeling of plant growth and development (ACOCK & ACOCK, 1991) and studies involving the crop water stress index for citrus plants based on plant temperature (SEPASKHAH & KASHEFIPOUR, 1994). 380 RIBEIRO, R. V., et al. - Leaf temperature in sweet orange plants under field condition: influence of meteorological elements Hence, the objective of this study was to characterize the daily changes of leaf temperature considering the seasonality of environmental elements and measurements of temperature in individual leaves and plant canopy. In addition, some physiological consequences of increased leaf temperature are discussed in the clarity of plant growth and related processes. Material and Methods The experiment was conducted in a citrus orchard located at the Centro APTA Citros Sylvio Moreira, Cordeirópolis, SP, Brazil (22°32S; 47°27W; alt. 639 m). The climate is subtropical with an average annual rainfall of 1366 mm and mean monthly air temperature varying between 23.8ºC (maximum in summer) and 17.8ºC (minimum in winter). The citrus orchard was 15-year old, being constituted by sweet orange plants (Citrus sinensis L. Osb.) var. Valência grafted on mandarin Cleopatra (Citrus reticulata Blanco) rootstocks and planted with spacing of 8x5 m in the North-South orientation. Mineral nutrition (macro and micronutrients) was practiced periodically, and pest and disease control was done when necessary to prevent/reduce any undesirable interference on measurements. Plants were under natural environmental conditions, i.e. they were non-irrigated and exposed to natural variations of solar radiation, air temperature and humidity, and rain. Diurnal measurements of leaf temperature (T L E A F , ºC) were taken with two infrared thermometers (IR) model IRT 4000-4GL (Everest Interscience, Tucson, AZ, USA) positioned at 0.2 m from a plant canopy in both the East and the West positions at a height of 2 m (middle of plant canopy). The temperature data sampled by the IR sensors in intervals of 1 s were averaged in each 15 min and recorded in a datalogger model CR7 (Campbell Scientific, Logan, UT, USA). In addition, leaf temperature was also measured with a Ni-CrNi thermocouple (TC) built in a leaf clip holder (2030-B, Walz, Effeltrich, Germany) of a portable fluorometer model PAM-2000 (Walz). Measurements were taken in the abaxial leaf surface of five plants throughout the daylight period in intervals of approximately 1 h. It is important to note that TC measurements were conducted in fully expanded, mature and exposed leaves. Meteorological elements were also recorded in both East and West sides of plant canopy at the same position in which IR measurements were taken. The environmental variables monitored were: global radiation (Qg, W m -2), air temperature (TAIR, ºC), and air vapor pressure deficit (VPD, kPa). Qg was assessed by using a pyranometer model LI-200 (LICOR, Lincoln NE, USA), whereas TAIR and VPD were monitored with an aspired psycrometer (cooper-constantan thermocouples) built according to MARIN et al. (2001). The temperature difference between leaf and air (DT, ºC) was calculated using both IR and TC measurements. The above measurements were taken in different times throughout the year, permitting the evaluation of TLEAF in days with discrepant energy availability. The meteorological conditions of evaluation times are shown in Table 1, being the data recorded in an automatic weather station (Centro Integrado de Informações Agrometeorológicas, CIIAGRO IAC/APTA/SAA) located 500 m far from the experimental area. From those data, it was possible to compare the meteorological conditions in the interior of citrus orchard with the external environment. Results and Discussion Meteorological conditions Days with different energy availability were chosen for evaluating leaf temperature changes. Daily global radiation varied from 31.4 (summer) to 11.93 MJ m-2 d-1 (autumn), affecting directly the air temperature (Table 1). In fact, maximum air temperatures were higher than 30ºC between December-04 and March-05, whereas the minimum temperatures were found in 16-Sep-04. In Southeast Brazil, the winter season (from June to September) is characterized by low relative humidity and low energy availability as well. The lower air temperature during the winter is induced by less energy availability, which is about 40% lower when 381 Rev. Bras. Agrometeorologia, v. 13, n.3, p.378-388, 2005 comparing June and February, in the State of São Paulo (PEREIRA et al., 2002). The transition between summer and winter (i.e. autumn and spring seasons) had intermediate levels of energy and humidity, as observed in evaluation dates of October, November, March, and April. As expected, the summer season (from December to March) had the highest evaporative demand, when ETo was higher than 5 mm d-1. This is in accordance to the highest energy availability during summer in the South hemisphere. Non substantial changes were verified in daily mean wind velocity among evaluation dates, with u2 varying between 0.79 and 1.86 m s-1 (Table 1), which could induce a significant and differential plant response in a citrus orchard. However, the influence of wind velocity is well apparent in ETo values (Table 1). Based on differences in meteorological conditions, we decided to show the daily variations of environmental elements inside the studied citrus orchard in the following dates: JD 296, 349, 48 and 119 (Figure 1). These days had different temporal variations of nebulosity and different available energy, determining the diurnal course of TAIR and VPD as consequences (Figure 1). High incoming radiation during the morning is expected to occur in the East position, whereas the West position receives solar energy predominantly during evenings. This is true when there is low or none nebulosity, as observed in JD 349 and 48 (Figure 1D,G). In fact, the instantaneous solar energy (Qg) in summer season (JD 349 and 48) was about the maximum possible value in tropical regions, i.e. 1100 W m-2 (Figure 1D,G). On the other hand, the high nebulosity did not cause significant differences in available energy between canopy positions (Figure 1A,J). When comparing canopy positions, differences in TAIR and VPD were observed only in JD 349 and 48. It is important to consider that these small discrepancies between the East and the West positions in those variables may not represent differential responses in citrus plants (Machado et al., 2005), mainly under field condition. Higher TAIR at the East position in relation to the West one was only verified during the morning in JD 349, which caused increase of VPD until the early evening (Figure 1E,F). Regarding the meteorological conditions in the citrus orchard and in the weather station, we observed that TAIR and Qg values are similar during most of daytime (Figure 2A,B). Some data scattering Table 1. Meteorological conditions* of the evaluation dates in Cordeirópolis, SP, Brazil. Date JD Qg (MJ m-2 d-1) Tm Tmax (oC) Tmin RH (%) ETo** (mm d-1) u2 (m s-1) 16-Sep-04 260 14.17 18.84 26.02 11.66 63.77 2.90 1.120 22-Oct-04 296 17.42 21.52 28.74 14.29 79.89 3.50 1.522 19-Nov-04 324 16.08 22.46 27.20 17.71 83.11 3.47 1.419 14-Dec-04 349 31.41 22.96 30.13 15.79 67.50 6.63 1.864 17-Feb-05 48 25.52 24.61 34.63 14.58 76.68 5.46 1.265 29-Mar-05 88 21.71 22.17 30.01 14.33 76.31 4.19 1.208 29-Apr-05 119 11.93 20.09 26.27 13.91 83.36 2.22 0.793 02-Jun-05 153 13.29 20.05 26.55 13.55 81.22 2.42 1.143 * Data recorded by an automatic weather station located 500 m far from the experimental area. JD = Julian day; Qg = global radiation; Tm, Tmax, Tmin = daily mean, maximum and minimum air temperature, respectively; RH = daily mean relative humidity; u2 = daily mean wind velocity at 2 m of height. ** ETo = reference evapotranspiration by the Penman-Monteith method (ALLEN et al., 1998). 382 RIBEIRO, R. V., et al. - Leaf temperature in sweet orange plants under field condition: influence of meteorological elements 1200 P 1000 : J 800 4 QLR 600 WLD GD 400 UOD EOR 200 * 36 & 33 7 30 UHX 27 WD 24 UH S 21 HP WLU 18 $ 15 East West $ ' * - % ( + . & ) , / East West 5 , $ WL LFI HG H UX VV HU SU RS DY U L$ East West 2.5 D3 N' 39 2.0 1.5 1.0 0.5 0.0 6 8 10 12 14 16 18 6 8 10 12 14 16 18 6 8 10 12 14 16 18 6 8 10 12 14 16 18 'D\WLPHK Figure 1. Daily course of meteorological elements inside a citrus orchard. Data shown represent measurements of global radiation (A,D,G,J), air temperature (B,E,H,K) and air vapor pressure deficit (C,F,I,L) taken at the East (open circle) and the West (closed circle) canopy positions (2-m height) in the following dates: 22-Oct-04 (Julian day 296, AC); 14-Dec-04 (Julian day 349, D-F); 17-Feb-05 (Julian day 48, G-I); and 29-Apr-05 (Julian day 119, J-L). Citrus orchard is oriented in the North-South direction (Cordeirópolis, SP, Brazil). 1200 P : ' 900 36 1:1 East y=0.824x n=298 R=0.907 (P<0.0001) West y=0.869x n=298 R=0.882 (P<0.0001) & ' 32 28 East y=1.027x n=551 R=0.971 (P<0.0001) West y=1.030x n=551 R=0.973 (P<0.0001) 1:1 2.5 D 3N 2.0 '5 1.5 +$& 52 $5+ 24 &5 2B 20 ,5$ 600 5$ &+ 52 300 J 4 7 $ 0 0 300 4J 600 900 1200 :P :($7+(567$7,21 3.0 East y=0.802x n=527 R=0.917 (P<0.0001) West y=0.827x n=527 R=0.965 (P<0.0001) 1:1 1.0 '3 9 0.5 16 % 12 12 16 20 24 28 32 36 7 & $,5B:($7+(567$7,21 & 0.0 0.0 0.5 1.0 1.5 2.0 2.5 3.0 93' N3D :($7+(567$7,21 Figure 2. Relationship between meteorological elements measured inside a citrus orchard and in an automatic weather station located 500 m far from the experimental area. Data shown represent measurements of global radiation (Qg, A), air temperature (TAIR, B) and air vapor pressure deficit (VPD, C) taken at the East (open circle) and the West (closed circle) canopy positions (2 m height). Citrus orchard is oriented in the North-South direction (Cordeirópolis, SP, Brazil). shown in Figure 2A is due to the attenuation of solar energy caused by parallel planting rows (NorthSouth orientation) of citrus orchard. So, Qg values in the weather station were higher than those ones observed inside citrus orchard, which happened during early morning and late evening. In addition, vapor pressure deficit was lower inside citrus orchard than values found in the weather station in about 19.8-17.3%, depending on the canopy position (Figure 2C). This fact suggests a wetter atmosphere inside citrus orchard than in the weather station, which is probably related to citrus transpiration. 383 Rev. Bras. Agrometeorologia, v. 13, n.3, p.378-388, 2005 Diurnal course of leaf temperature High TLEAF values were verified in days with high radiation loading (i.e. JD 349 and 48), when leaf temperatures measured with IR and TC techniques reached values about 35.5 and 39oC, respectively (Figure 3). Despite measurement technique, the maximum temperatures were observed during afternoon in the West position in days with low or none nebulosity, whereas the East position showed higher TLEAF during morning. In cloudy days (JD 296 and 119), non-significant differences in leaf temperature between canopy positions were detected. The differences between TLEAF taken with IR and TC techniques were probably induced by the leaf exposure. As IR method gives an average temperature of plant canopy, evaluating both exposed and non-exposed leaves, the recorded values are normally lower than those ones taken with the TC method, which evaluated only exposed leaves. It is reasonable to assume that the highest TLEAF values will be found in those leaves, which represent less than 20% of total leaf area in a crosssection of an orange tree canopy (COHEN & FUCHS, 1987). As exposed leaves reached TLEAF values higher than 39ºC, impairment of physiological activity related to CO2 fixation is expected to occur (RIBEIRO et al., 2004). The optimum temperature for citrus growth is between 25 and 31ºC, occurring growth impairment at temperatures below 13ºC and above 36ºC (REUTHER, 1973), whereas the highest leaf photosynthesis is observed around 25ºC under normal air CO2 concentration (RIBEIRO et al., 2004). Under increasing temperature, photosynthesis is initially affected by reduction of stomatal conductance (due to high leaf-to-air vapor pressure difference); and afterwards (>35ºC) by decrease of both leaf mesophyll CO2 conductance (VU, 1999) and carboxylation efficiency (RIBEIRO et al., 2004). Therefore, one should take care when considering the photosynthetic contribution of exposed leaves to crop growth and production. Probably, these leaves are the first ones to show reductions in photosynthetic rates under constraint conditions (e.g. drought, excessive radiation energy, extreme high or low temperatures). Accordingly, MEDINA et al. (2002) reported a large reduction in photoinhibition of photosynthesis in exposed citrus leaves by decreasing the incident solar energy during summer. Differences in measurements of TLEAF taken with IR and TC techniques were higher in conditions of high energy availability (Figure 3C,E). Although JD 119 had shown low available energy (Table 1), there were no clouds causing decrease of the incoming solar energy between 11 and 14 h, when the highest TLEAF values were measured in exposed leaves (Figure 3G). This caused a large discrepancy between IR and TC measurements. The difference between TLEAF and TAIR is a meaningful tool to evaluate the heat dissipative capacity in plants as well as their physiological adaptation under certain environmental conditions (SOUZA et al., 2004; SOUZA & RIBEIRO, 2005). However, a clear discernment should be done when studying plant species with large canopies, where leaves have different light exposure. In TC measurements (exposed leaves), DT (TLEAF-TAIR) reached 8ºC during the early evening of JD 349 (Figure 3D), whereas the maximum DT measured with IR technique was about 3ºC during the early morning of JD 48 (Figure 3F). During most of daylight period, DT varied between 3 and -3ºC when considering the IR technique (Figure 3B,D,F,H). Nevertheless, DT estimated from TC measurements were positive during most of daylight period, indicating leaf heating of exposed leaves. SYVERTSEN & LLOYD (1994) pointed out that DT in citrus plants can vary about 8-10ºC in warmsubtropical climates. We believe that these values are probable referring to exposed leaves, as observed in this study (Figure 3). High DT values were found during morning at the East position and during afternoon at the West position. Both DT estimated with IR and TC measurements showed the same pattern when there was high available energy (Figure 3D,F). However, non-significant differences between canopy positions were verified in a cloudy day (Figure 3B), when DT and TLEAF measured with TC and IR techniques were less discrepant (Figure 3A,B). Interestingly, the East position showed higher DT than the West one, in a day with high concentration of water vapor (fog) during the early morning (Figure 1L), regardless of the measurement technique (Figure 3H). 384 RIBEIRO, R. V., et al. - Leaf temperature in sweet orange plants under field condition: influence of meteorological elements 40 & ) 36 ($ / IREAST TCEAST IRWEST TCWEST 32 7 H 28 UX WD UH 24 S P HW 20 ID 16 H/ & $ 8 6 & 4 5 , $ 2 7) 0 ($ / 7 -2 -4 7 ' -6 -8 ∆T_IREAST ∆T_TCEAST ∆T_IRWEST ∆T_TCWEST % 6 8 10 12 14 16 18 8 10 12 14 16 18 + ) ' 6 * ( 6 8 10 12 14 16 18 6 8 10 12 14 16 18 'D\WLPHK Figure 3. Diurnal course of leaf temperature (A,C,E,G) and difference between leaf and air temperatures (B,D,F,H) measured with infrared thermometers (IR, circles) and thermocouple (TC, triangles) in citrus plants under field condition. Data shown represent measurements taken at the East (open symbols) and the West (closed symbols) canopy positions (2-m height) in the following dates: 22-Oct-04 (Julian day 296, A-B); 14-Dec-04 (Julian day 349, C-D); 17-Feb-05 (Julian day 48, E-F); and 29-Apr-05 (Julian day 119, G-H). Citrus orchard is oriented in the North-South direction (Cordeirópolis, SP, Brazil). Each point represents one replication in IR measurements and the mean value of five replications ± SE in TC measurements. IR thermometers were positioned 0.2 m from plant canopy. Probably, low transpiration rates caused high DT values found during early morning in the East position (Figure 3D,F), being this physiological process the main heat dissipative strategy adopted by plants (NOBEL, 1999; SOUZA et al., 2004; SOUZA & RIBEIRO, 2005). After the onset of plant transpiration due to the increase of evaporative demand (Figure 2F,I), plant cooling was induced and DT values remained negative during the hottest hours of day (Figure 3D,F). On the other hand, high DT values during evening were noticed in the West position, remaining between 0 and 1ºC (Figure 3D,F) or even negative (Figure 3B,H) depending on the available energy. This fact indicates the great cooling capacity of citrus plants, suggesting that leaf transpiration is an important process leading to a high energetic efficiency and avoiding constraint temperatures (TLEAF above 35ºC). It is important to consider that such process is dependent of adequate soil water levels to be effective against leaf heating. On the relationship between infra-red and thermocouple measurements The measurement of TLEAF using TC technique was always equal or higher than those measurements with IR technique (Figure 3). When comparing these methods, TC tended to overestimate TLEAF in both canopy positions (Figure 4). In fact, this overestimation was higher in the East position. The difference between IR and TC measurements were in part due to the light exposure of evaluated leaves, i.e., TC measurements evaluated exposed leaves, where as IR techniques measured the temperature of both exposed and non-exposed leaves. Influence of meteorological elements on leaf temperature Both T LEAF measured with IR and TC techniques showed similar responses to increasing Qg (Figure 5A,C). There was a tendency of TLEAF 385 Rev. Bras. Agrometeorologia, v. 13, n.3, p.378-388, 2005 East TC=0.89*IR+3.38 36 R=0.93, N=81, P<0.0001 40 & & 32 HU7 XW 28 UDH 24 S P WHI 20 DH 16 / R West TC=0.98*IR+1.49 R=0.93, N=81, P<0.0001 12 12 16 20 24 28 32 36 R /HDIWHPSHUDWXUH,5 & 40 Figure 4. Relationship between leaf temperature measured with infrared thermometers (IR) and thermocouple (TC) in citrus plants under field condition. Measurements were taken at the East (open circle) and the West (closed circle) canopy positions (2-m height). Citrus orchard is oriented in the North-South direction (Cordeirópolis, SP, Brazil). stability at Qg values higher than 600 W m-2 when considered IR measurements (Figure 5A), presenting reduction in data scattering. Besides showing high TLEAF, exposed leaves had an increasing response to Qg increase, not showing a defined ceiling even at 1100 W m-2 (Figure 5C). Stomatal aperture is probably saturated at Qg values of about 300 W m-2 (» photosynthetic photon flux density of 600 mmol m-2 s-1), which could be sufficient to permit adequate transpiration rates (SYVERTSEN & LLOYD, 1994; MACHADO et al., 2005) and plant cooling as consequence, i.e. maintenance or decrease of TLEAF. However, TAIR and VPD vary simultaneously to Qg, causing a synergetic effect on stomatal physiology. At high evaporative demand, decreases in stomatal conductance of acid lime plants have been ascribed to the interaction of above environmental variables (ANGELOCCI et al., 2004). In relation to the effects of VPD on TLEAF, similar response patterns were also verified in IR and TC measurements (Figure 5E,G). A rapid increase was noticed when VPD changed from 0 to 0.5 kPa, showing a positive linear relation between 0.5 and 2.3 kPa (Figure 5E). It is known that the main effect of high VPD on gas exchange of citrus plants is via stomatal mechanism (HALL et al., 1975; SINCLAIR & ALLEN Jr., 1982; ANGELOCCI et al., 2004). Reduction in stomatal conductance is verified at VPD values higher than 1.5 kPa, being this response an adaptive response to prevent plant dehydration (SINCLAIR & ALLEN Jr., 1982; MACHADO et al., 2002, 2005). Stomatal closure also causes plant heating due to decreases of transpiration, leading to increase of TLEAF, as evidenced by the linear increase of TLEAF at VPD values higher than 1.0 kPa (Figure 5E). This fact is probably more pronounced in exposed leaves (Figure 5G), where the VPD threshold for stomatal closure may be different. It is reasonable to assume that any plant physiological response to changes in environmental conditions happens in order to maintain the plant growth and development. This physiological plasticity was reported in citrus plants, in which changes in quantum efficiency of exposed leaves happened in order to maintain high values of apparent electron transport rate and adequate level of heat dissipation by non-photochemical processes (RIBEIRO et al., 2005). The maintenance of canopy temperature, given by IR measurements, close to TAIR (Figure 5I) is an indication of TLEAF regulation by plants themselves. Even in exposed leaves (Figure 5K), a close relationship between TAIR and TLEAF was maintained. In spite of environmental elements, higher DT values were observed in exposed leaves, ranging from -2.5 to 8ºC (Figure 5D,H,L) and being positive most of daylight period. Non-significant differences were found between canopy positions when considered TC measurements. The smaller DT amplitude in IR-based estimations (Figure 5B,F,J) is in accordance to the assumption that exposed and non-exposed leaves were evaluated. At high values of Qg, VPD and TAIR, the DT values in the East position were lower than ones in the West side (Figure 5B,F,J). This suggests that the East position has higher heat dissipative capacity than the West one during the warmest hours of day (11 to 15 h), when there are the highest Qg, VPD and TAIR values (Figure 1). Together with photosynthesis, transpiration is an essential factor determining citrus orchard productivity, being its spatial distribution in canopy an important aspect to be considered 386 RIBEIRO, R. V., et al. - Leaf temperature in sweet orange plants under field condition: influence of meteorological elements 40 East West & 35 HU 30 XW DU 25 HS 20 P WHI DH 15 / $ ( , % ) - & * . ' + / 5 , 10 6 & 3 7 0 5 , $ 5 , ) $ ( / 7 -3 7 ' -6 40 & 35 HU 30 XW UDH 25 S 20 P HW ID 15 H/ & 7 10 & 7 5 , $ & 7 ) $ ( / 6 3 0 7 -3 7 ' -6 0 200 400 600 800 1000 1200 0.0 *OREDOUDGLDWLRQ:P 0.5 1.0 1.5 2.0 2.5 $LUYDSRUSUHVVXUHGHILFLWN3D 3.0 15 20 25 30 35 40 $LUWHPSHUDWXUH& Figure 5. Leaf temperature (A,E,I,C,G,K) and difference between leaf and air temperatures (B,F,J,D,H,L) measured with infrared thermometers (A,E,I,B,F,J) and thermocouple (C,G,K,D,H,L) as functions of instantaneous global radiation (A-D), air vapor pressure deficit (E-H) and air temperature (I-L) in citrus plants under field condition. Data shown represent measurements taken at the East (open circles) and the West (closed circles) canopy positions (2-m height). Citrus orchard is oriented in the NorthSouth direction (Cordeirópolis, SP, Brazil). Each point represents one replication in IR measurements and the mean value of five replications ± SE in TC measurements. IR thermometers were positioned 0.2 m from plant canopy. (COHEN & FUCHS, 1987; COHEN et al., 1987). As plant cooling is directly related to transpiration, we can argue that the East side probably had higher transpiration rate than the West position. However, further studies for evaluating this hypothesis should be done. Conclusions The highest TLEAF values are found during afternoon and in summer season, which is related to the daily and seasonal pattern of available radiation loading. In studies involving the evaluation of TLEAF in citrus plants, it is important to consider the level of solar radiation exposure in leaves due to the high heterogeneity of citrus canopy in relation to leaf age and position. In exposed leaves, changes in TLEAF are directly related to the variation of TAIR, Qg and VPD, showing more or less data scattering depending on environmental variable considered. In relation to the evaluation of TLEAF considering both exposed and non-exposed leaves (given by the infrared technique), it is shown that TLEAF is directly affected by TAIR. However, changes in TLEAF are more 387 Rev. Bras. Agrometeorologia, v. 13, n.3, p.378-388, 2005 accentuate under low Qg and VPD values, occurring a tendency of TLEAF saturation only for Qg. Acknowledgements The authors are grateful to Drs. Ricardo F. Oliveira and Luiz R. Angelocci (ESALQ/USP, Brazil) for helpful discussions during the experimental planning. Thanks to Drs. Marcos A. Machado and Orivaldo Brunini (IAC/APTA/SAA, Brazil) for research facilities; and José Zanetti Jr. for the excellent field assistance. This work was supported by grants from the Fundação de Amparo à Pesquisa do Estado de São Paulo FAPESP (R.V.R.), Conselho Nacional de Desenvolvimento Científico e Tecnológico CNPq (E.C.M.), and Coordenadoria de Aperfeiçoamento de Pessoal de Nível Superior CAPES (M.G.S.). References ALBRIGO, G. Influências ambientais no desenvolvimento dos frutos cítricos. In: DONADIO, L.C. Anais do segundo seminário internacional de citros. Fisiologia. Bebedouro, 1992. Campinas: Fundação Cargill, 1992. p.100-106. ACOCK, B.; ACOCK, M.C. Potential for using long-term field research data to develop and validate crop simulators. Agronomy Journal, Madison, v. 83, n. 1, p. 56-61, 1991. ALLEN, R.G. et al. Crop evapotranspiration: guidelines for computing crop water requeriments. Rome: FAO, 1998. 300p. (Irrigation and drainage, Paper 56) ANGELOCCI, L.R. Água na planta e trocas gasosas/energéticas com a atmosfera: introdução ao tratamento biofísico. Piracicaba: L.R. Angelocci, 2002. Cap. 8: Fluxos de energia entre a planta e a atmosfera. p. 191-228. ANGELOCCI, L.R. et al. Transpiration, leaf diffusive conductance, and atmosphere water demand relationship in an irrigated acid lime orchard. Brazilian Journal of Plant Physiology, Londrina, v. 16, n. 1, p. 53-64, 2004. COHEN, S.; FUCHS, M. The distribution of leaf area, radiation, photosynthesis and transpiration in a Shamouti orange hedgerow orchard. Part I. Leaf area and radiation. Agricultural and Forest Meteorology, Amsterdam, v. 40, n. 2, p. 123-144, 1987. COHEN, S. et al. The distribution of leaf area, radiation, photosynthesis and transpiration in a Shamouti orange hedgerow orchard. Part II. Photosynthesis, transpiration, and the effect of row shape and direction. Agricultural and Forest Meteorology, Amsterdam, v. 40, n. 2, p. 145-162, 1987. HALL, A.E.; CAMACHO-B, S.E.; KAUFMANN, M.R. Regulation of water loss by citrus leaves. Physiologia Plantarum, Copenhagen, v. 33, n. 1, p. 62-65, 1975. KHAIRI, M.M.A.; HALL, A.E. Temperature and humidity effects on net photosynthesis and transpiration of citrus. Physiologia Plantarum, Copenhagen, v. 36, n. 1, p. 29-34, 1976a. KHAIRI, M.M.A.; HALL, A.E. Effects of air and soil temperatures on vegetative growth of citrus. Journal of the American Society for Horticultural Science, Geneva, v. 101, n. 4, p. 337-341, 1976b. MACHADO, E.C. et al. Variação sazonal da fotossíntese, condutância estomática e potencial de água na folha de laranjeira Valência. Scientia Agricola, Piracicaba, v. 59, n. 1, p. 53-58, 2002. MACHADO, E.C. et al. Respostas da fotossíntese de três espécies de citros aos fatores ambientais. Pesquisa Agropecuária Brasileira, v.40, n.12, p. 1161-1170. Brasília, 2005. MEDINA, C.L. et al. Photosynthetic response of citrus grown under reflective aluminized polypropylene shading nets. Scientia Horticulturae, Amsterdam, v. 96, n. 1-4, p. 115125, 2002. MARIN, F.R. et al. Construção e avaliação de psicrômetro aspirado de termopar. Scientia Agricola, Piracicaba, v. 58, n. 4, p. 839-844, 2001. NOBEL, P.S. Physicochemical and environmental plant physiology. San Diego: Academic Press, 1999. 474 p. 388 RIBEIRO, R. V., et al. - Leaf temperature in sweet orange plants under field condition: influence of meteorological elements ORTOLANI, A.A.; PEDRO Jr., M.J.; ALFONSI, R.R. Agroclimatologia e o cultivo dos citros. In: RODRIGUEZ, O.; VIÉGAS, F.; POMPEU Jr, J.; AMARO, A.A. Citricultura Brasileira. Campinas: Fundação Cargill, 1991. vol. 1, p. 153-195. SEPASKHAH, A.R.; KASHEFIPOUR, S.M. Relationships between leaf water potential, CWSI, yield and fruit quality of sweet lime under drip irrigation. Agricultural Water Management, Amsterdam, v. 25, n. 1, p. 13-22, 1994. PAULINO, S.E.P.; VOLPE, C.A. Relações entre a produção de laranjeira-Pêra e algumas variáveis meteorológicas, em Limeira, SP. Revista Brasileira de Fruticultura, Jaboticabal, v. 23, n. 1, p. 130133, 2001. SINCLAIR, T.R.; ALLEN Jr., L.H. Carbon dioxide and water vapour exchange of leaves on field-grown citrus trees. Journal of Experimental Botany, Oxford, v. 33, n. 137, p. 1166-1175, 1982. PEREIRA, A.R.; ANGELOCCI, L.R.; SENTELHAS, P.C. Agrometeorologia: fundamentos e aplicações práticas. Guaíba: Agropecuária, 2002. 478 p. REUTHER, W. Climate and citrus behavior. In: REUTHER, W.; BATCHELOR, L.D.; WEBBER, H.J. The citrus industry. Berkeley: Div. Agric. Sci. University of California, 1973. vol. 3, p. 280-377. REUTHER, W. Citrus. In: ALVIM, P.T.; KOZLOWSKI, T.T. Ecophysiology of tropical crops. London: Academic Press, 1977. Cap. 15, p. 409-439. RIBEIRO, R.V.; MACHADO, E.C.; OLIVEIRA, R.F. Growth- and leaf-temperature effects on photosynthesis of sweet orange seedlings infected with Xylella fastidiosa. Plant Pathology, Oxford, v. 53, n. 3, p. 334-340, 2004. RIBEIRO, R.V. et al. Avaliação da eficiência quântica de folhas de laranjeira Valência pela fluorescência da clorofila. In: CONGRESSO BRASILEIRO DE AGROMETEOROLOGIA, 14., 2005, Campinas, SP. Resumos..., Campinas: SBA/ UNICAMP/ IAC, 2005 (in press). SOUZA, G.M.; RIBEIRO, R.V. Respostas fisiológicas às variações ambientais de espécies tropicais arbóreas de diferentes classes sucessionais: alterações na fluorescência da clorofila, trocas gasosas e dissipação térmica. In: LARCHER, W. Ecofisiologia vegetal. São Carlos: RIMA, 2006 (in press). SOUZA, G.M. et al. Functional groups of forest succession as dissipative structures: an applied study. Brazilian Journal of Biology, São Carlos, v. 64, n. 3B, p. 707-718, 2004. SYVERTSEN, J.P.; LLOYD, J.J. Citrus. In: SCHAFFER, B.; ANDERSEN, P.C. Handbook of environmental physiology of fruit crops. II. Subtropical and tropical crops. Boca Raton: CRC Press, 1994. Cap. 4, p. 65-99. VOLPE, C.A.; SCHÖFFEL, E.R.; BARBOSA, J.C. Influência de algumas variáveis meteorológicas sobre a qualidade dos frutos de laranjeira Valência e Natal. Revista Brasileira de Agrometeorologia, Santa Maria, v. 8, n. 1, p. 85-94, 2000. VU, J.C.V. Photosynthetic responses of citrus to environmental changes. In: PESSARAKLI, M. Handbook of plant and crop stress. New York: M. Dekker, 1999. Cap. 45, p. 947-961.
Download