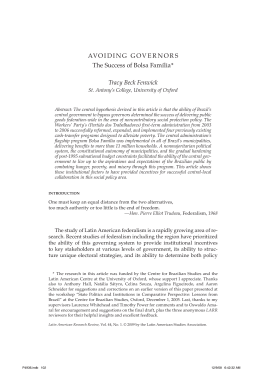
Población, Pobreza en Brazil:
Desafios de Política
Reunión de Expertos sobre Poblacíon y
Pobreza en América Latina y el Caribe
CEPAL, Santiago, Chile – 15/11/2006
Eduardo L.G. Rios-Neto
CEDEPLAR
PURPOSE
• To discuss the link between population and social
policy, particularly in light of intergenerational
conflict and the demographic dividend.
• To contextualize the discussion moving from the
case of classical social policy (contributory social
security versus education) to non contributory
social cash transfer policies such as non
contibutory pensions (aposentadoria rural and
BPC) and conditional cash transfer programs
(Bolsa Escola and Bolsa Família).
CEDEPLAR
The Puzzle in Brazilian
Classical Social Policy: Social
Security ahead of Education
• In most countries Educational Revolution
took place BEFORE social expenditure in
social security. Efficiency Hypothesis.
• In Brazil, social security came first and
surplus budget during expansion helped to
finance infrastructure building. “Industrial
Bias” exclusionary hypothesis.
CEDEPLAR
Eli Iôla Gurgel Andrade (1999) and (2003):
Presents the Historical Evolution of Social
Security in Brazil.
• 1923: Eloi Chaves Law
• 1933: Creation of IAPs – Retirement Institutes.
• 1936: Mixed Regime – Capitalization and Pay-as-you-Go
components.
• 1945: ISSB Project.
• 1960: Organic Law of Social Security.
• 1966: Creation of INPS.
• 1977: Creation of SINPAS.
• 1981: Figueiredo’s Package.
• 1988: Constitution – Generous Reform Implemented in the
1990s
• 1999: Social Security Factor Reform
CEDEPLAR
Brazil: Social Security x Education (and
Health)
• Historical data shows data expenditure on social
security was always lower than revenues (surplus),
from the Lei Eloi Chaves in the 1920s until the
1970s. A capitalization exercise of this surplus
during the 1945-1980 period, on a hypothetical
fund, shows an impressive amount (Andrade,
1999).
• The social security was a system in expansion,
though dualistic, so that political arrangements
seemed to converge for
the industrial bias.
CEDEPLAR
120,0
1923
1924
1925
1926
1927
1928
1929
1930
1931
1932
1933
1934
1935
1936
1937
1938
1939
1940
1941
1942
1943
1944
1945
1946
1947
1948
1949
1950
1951
1952
1953
1954
1955
1956
1957
1958
1959
1960
1961
1962
1963
1964
1965
1966
1967
1968
1969
1970
1971
1972
1973
1974
1975
1976
1977
1978
1979
1980
1981
1982
1983
1984
1985
1986
1987
1988
1989
1990
1991
1992
1993
1994
1995
1996
1997
1998
1999
2000
2001
2002
Proporção
Andrade (1999): Share of Social Security
Revenue covering Social Security Expenditure.
Desempenho Econômico-financeiro da Previdência Social
Brasileira
Proporção Anual Despesa / Receita (%)
Série Completa
Período: 1923 a 2002
100,0
80,0
60,0
40,0
20,0
0,0
Ano
Despesa Completa
CEDEPLAR
Receita Completa
Brazil: Social Security x Education
(and Health)
• Education is nationally regulated ever since the
republic in the XIXth century, but its funding and
provision have been local (Draibe, ).
• The first four years of primary education is
mandatory in the 1946 Constitution. In 1971, school
attendance became mandatory until the 8th grade. In
1983, funds were tied to educational expenditures by
law. Only in 1996 the law dealing with the funding
of education (FUNDEF) was undertaken.
CEDEPLAR
Queiroz e Turra (2005) – Powerpoint Presentation:
Social Expenditures in Brazil (%GNP)
9%
8%
7%
Social Security
6%
5%
4%
Health
3%
Education
2%
1%
0%
1990
1989
1988
1987
1986
1985
1984
1983
1982
1981
1980
CEDEPLAR
Turra (2001): Intergenerational Accounting and
Economic Consequences of Aging in Brazil, IUSSP
Conference, Salvador. Based on Brazilian Living
Standard Measurement Survey (PPV – 1996) and
Budgetary Totals for that year.
CEDEPLAR
What was new in the
nineties?
• FUNDEF – Huge coverage impact in the
nineties – not to forget the role of
demographic dividend. Impact in
decentralization and the role of municipios.
• New school and administrative practices:
election of school principles, establishment
of school councils. Everyday financial
control. MG, ES, PA, MS were pioneers.
CEDEPLAR
Average Schooling by Quintile of
Household Income
8.0
Anos de Estudo
7.0
6.0
5.0
4.0
3.0
2.0
1.0
1º
Fonte: PNAD/IBGE
3º
CEDEPLAR
5º
2002
99
2001
Pnad
98
97
96
95
93
92
90
89
88
87
86
85
84
83
82
81
0.0
School Attendance Rate by Age –
Brazil, 1970/2000
10 0,00
94,50
9 0,00
8 0,00
7 9,43
77,71
67,1 7
7 0,00
63 ,4 6
61,36
6 0,00
5 5,16
5 0,00
4 8,64
4 0,00
4 2,30
3 0,00
24 ,96
2 0,00
1 0,21
15 ,1 9
19 70
19 80
1 0,00
0,00
19 91
An os
4 a 6 a nos
7 a 14 an os
CEDEPLAR
1 5 a 17 a nos
2 000
Lykke Andersen (2001) created a Social
Mobility Index using household surveys in
the mid-nineties – Brazil’s rank is poor
CEDEPLAR
Fernando Filgueira and the Latin
American Social State
•
Major Issues to be considered in the Analysis of the
evolution of the Social States:
1.
2.
3.
4.
•
Expenditure
Coverage
Stratification
Quality of Social Services
Causal forces driving this evolution:
1.
2.
3.
Depth and shape of the ISI model.
Political regimes and actors administering these models.
Organizational and political characteristics of non-elite sectors
(middle classes, formal working classes, urban informal
workers, rural workers, etc.).
CEDEPLAR
Fernando Filgueira and the Latin
American Social State
•
•
Filgueira (2005, quote to be authorized) argues
that Latin America does not have a welfare state.
The system of social policies and social
protection is referred as Social States.
Four key areas express the expansion of the
Latin American Social State:
1. Education
2. Health Care
3. Pension and Transfers
4. Price Controls and Subsides
CEDEPLAR
Filgueira and Latin American
Social State
•
Filgueira’s Typology of Social States in Latin
America:
1. Stratified Universalistic
2. Dual
3. Exclusionary
•
These three states developed until the 1970s, as
the crisis evolved from then until the early
1990s, two variants of social state appear:
1.
2.
Neo-liberal
Egalitarian exclusionary basic protection social
state (social democratic Latin American State)
CEDEPLAR
Filgueira and Latin American
Social State
• Filgueira’s Typology:
1.Stratified Universalism (Uruguay, Argentina
and Chile. Costa Rica as universalism).
2.Dual Regimes based on elites statecraft and
cooptation and repression of popular sectors
(Brazil and Mexico).
3.Exclusionary Regimes based on Predatory
elites (Guatemala, Honduras, El Salvador,
Nicaragua and Bolivia).
CEDEPLAR
Filgueira: Brazil and Mexico: Why Dual
Regime?
•
•
•
Brazil and Mexico are included together because they have
some common characteristics:
1. Territorial Heterogeneity – Some regions with formal
development of market and social protection (until the
1970s) and other exclusionary.
2. Based on ISI.
3. Populist model of development and political
administration.
4. Brazil, the role of modern working and middle classes.
Unlike the stratified universalism, the social state moderates
the social segmentation only in those sectors that are
incorporated in modern formats of protection.
The protection systems accentuate social differences
between urban advanced sectors and the non-protected rural
traditional and urban informal sectors.
CEDEPLAR
Filgueira’s Table comparing Brazil
and Mexico around 1970
CEDEPLAR
Main Reason for Differences in the
Indicators
• Not social spending, Brazil spent more in social budget than
Mexico.
• More entrenched inequality in Brazil than in Mexico. Rural
Mexico less unequal than rural Brazil (land reform).
• Social spend in Mexico concentrated on Health and
Education while in Brazil concentrated on the Pension
System.
• Rural population in Mexico was part of the political system,
while Brazil had a higher urban bias. Draibe (apud Filgueira):
“Brazil was quintessential industrially biased developmental
social state”.
• “Industrial bias” helps partially to explain why the emphasis
on social security, rather on education and health care
(Draibe).
CEDEPLAR
From the ISI Crisis in the
1970s to the 1990s –
The Brazilian Route
•
Filgueira treats two ways out of the crisis:
1.
2.
•
The Chilean market oriented case
The reform of social expenditure.
The Brazilian case is reviewed as one of averting the
market utopia and possibly in the road from a dual
regime to basic inclusionary universalism.
–
–
–
–
–
–
The role of FUNRURAL in the sixties and seventies (citizenship
without formal wages).
Health reforms culminating with SUS.
The citizenship rights in the 1988 Constitution.
The Organic Law of Social Assistance (LOAS).
The Cash Transfer (CT) and Conditional Cash Transfer
Programs (CCT), from Bolsa Escola to Bolsa Familia.
The “unfunded” rural pension system and BPC.
CEDEPLAR
Moving from Classic to
Unfunded Social Policy
• Limits of Classic Social Policy: Case of
Education - Due to stratification and coverage
problems, demographic dividend worked
unintentionally leading to almost universalization
of basic school attendance, but grade promotion
and proficiency problems (school quality)
remained.
• Demographic Dividend worked because the
decline in dependency rate leads to higher
coverage even with a fixed budget.
CEDEPLAR
Moving from Classic to
Unfunded Social Policy
• Unfunded Cash Transfers to the Elderly:
– Aposentadoria Rural
– BPC
• Conditional Cash Transfer:
– Bolsa Escola
– Bolsa Família
CEDEPLAR
The Brazilian Route on Welfare: The
Non-Contributory Pensions (Rural
and BPC) – Rural Benefits (WerneckVianna, 2004)
CEDEPLAR
Remark by Paes de Barros
(2005):
CEDEPLAR
Paes de Barros (2005) on Rural
Poverty
CEDEPLAR
Paes de Barros (2005) on
Rural Poverty
CEDEPLAR
The Non-Contributory
Pension: BPC
•
The program pays one minimum wage per month (R$ 300,00 which is
around US$ 130)) for the elderly aged 65 or more or for people with
disability to work, aimed for people without social coverage and with
per capita income below one fourth of the minimum wage.
•
2001: 1,3 million beneficiaries
2002: 1,6 million beneficiaries
2003: 1,7 million beneficiaries
2004: 2,1 million beneficiaries
2005: 2,7 million beneficiaries
(more than doubled 2001)
CEDEPLAR
THE CONDITIONAL CASH TRANSFER
PROGRAM IN BRAZIL – FROM BOLSA
ESCOLA TO BOLSA FAMILIA – The Table
Below shows the situation in September 2003 –
Just Before the Creation of Bolsa Familia
Valores Nominais
Programas
BPC
Cartão Alimentação
PETI
Bolsa Escola
Bolsa Alimentação
Auxílio Gás
*Indivíduos
Famílias
1.660.447*
774.764
809.148*
5.056.245
1.669.554
9.707.829
Valor (R$)
Valor médio
(R$)
401.645.884,00 1 Salário Mínimo
38.885.405,00
50,19
37.117.645,00
45,87
125.367.292,00
24,79
35.215.386,00
21,09
146.170.780,00
15,06
CEDEPLAR
The Caseload of Some Non
Contributory Social Programs in Brazil
Evolução da Oferta de Programas Sociais de Out/2003 a Jun/2006 - Brasil
12,000,000
Bolsa Família
Cartão
alimentaçao
10,000,000
Bolsa Escola
Bolsa
Alimentação
Auxílio Gás
6,000,000
Linear (Bolsa
Família)
Linear (Bolsa
Escola)
4,000,000
Linear (Bolsa
Alimentação)
2,000,000
Linear (Auxílio
Gás)
Linear (Cartão
alimentaçao)
0
O
U
T.
20
03
D
EZ
.2
00
3
FE
V.
20
04
AB
R.
20
04
JU
N
.2
00
4
AG
O
.2
00
4
O
U
T.
20
04
D
EZ
.2
00
4
FE
V.
20
05
AB
R.
20
05
JU
N
.2
00
5
AG
O
.2
00
5
O
U
T.
20
05
D
EZ
.2
00
5
FE
V.
20
06
AB
R.
20
06
JU
N
.2
00
6
Famílias atendidas
8,000,000
Mês
CEDEPLAR
From Migration of
Caseloads to New
Caseloads in Bolsa Família
Número Mínimo Estimado de Novos Beneficios
Concedidos para o Bolsa Família
BENEFÍCIOS
ESTOQUE INICIAL*- JAN/2004
7890719
NOVOS BENEFÍCIOS/2004
1885331
NOVOS BENEFÍCIOS/2005
816013
NOVOS BENEFÍCIOS/O6/2006
900775
NOVOS ENTRE 2004 e 2006
3602119
TOTAL JUNHO DE 2006
11492838
Fonte: MDS e Tabela 1*
* Benefícios: BF+CA+BE+CA
CEDEPLAR
Targeting Performance
•Exclusion Error: U1= Fp,e/Fp
•Inclusion Error (leakage): L1= Fnp,i/Fi
•Inclusion Targeting: TI1 = Fp,i/Fp
•Exclusion Targeting: TU1 = Fnp,e/Fe
TABLE 1 – RATES
Poor Families (Fp)
Non Poor Families (Fnp)
Total
U1=Fp,e/Fp
TU1=Fnp,e/Fe
Fe
TI1 = Fp,i/Fp
L1= Fnp,i/Fi
Fi
Fp
Fnp
Excluded Families (Fe)
Included Families (Fi)
Total
Source: Coady, Grosh e Hoddinott (2004).
CEDEPLAR
Targeting Permormance :
Bolsas Família + Escola
Table 2: Targeting BF e BE – Families by household per capita consumption until R$50,00
Poor Families
Non Poor Families
Total
1.395.424
40.158.439
41.553.863
4.106.487
6.300.587
10.407.074
5.501.911
46.459.026
51.960.937
Excluded Families
Included Families
U1= Exclusion Error = 25%
L1= Inclusion Error = 61%
TI1=Inclusion Targeting= 75%
TU1=Exclusion Targeting= 86%
Total
Fonte: AIBF, 2005.
CEDEPLAR
Targeting Permormance :
Bolsas Família + Escola
Table 3: Targeting BF e BE – Families by household per capita consumption until R$100,00
Poor Families
Non Poor Families
Total
5.027.664
36.526.199
41.553.863
6.273.875
4.133.199
10.407.074
Excluded Families
Included Families
U2= Exclusion Error = 44%
L2= Inclusion Error = 40%
TI2= Inclusion Targeting = 56%
TU2= Exclusion Targeting= 90%
51.960.937
Total
Fonte: AIBF, 2005.
11.301.539
CEDEPLAR
40.659.398
TARGETING PERFOMANCE
INDICATOR – USING HOUSEHOLD
PER CAPITA CONSUMPTION
QUADRO 2: Razão= X/Y= % Benefícios/ Percentil da Renda
1) 20% do percentil inferior da distribuição da renda: 70,9/20 = 3,5
2) 30% do percentil inferior da distribuição da renda: 79,6/30= 2,6
3) 40% do percentil inferior da distribuição da renda: 85,5/40= 2,1
4) 50% do percentil inferior da distribuição da renda: 90,5/50= 1,8
CEDEPLAR
Poverty Rate – Poverty Line is R$
150.00 (1/2 minimum wage) with
Anne Caroline Costa Resende
• WITH B. FAMILIA
– Headcount ratio %
34.92
– Poverty gap ratio %
16.24
– Index FGT(2.0) *100
10.67
• WITHOUT B. FAMILIA
– Headcount ratio %
38.59 (10.5% higher)
– Poverty gap ratio %
20.29
– Index FGT(2.0) *100
14.10
CEDEPLAR
Comparative Basis with
Ricardo Paes de Barros
In d ic a d o re s d e p o b re za e e x tre m a p o b re za n o B ra s il
In d ic a d o re s
E x tre m a p o b re za
P o b re za
P o rc e n ta g e m d e p o b re s (P 0 )
1 3 .4
3 4 .1
N ú m e ro d e p e s s o a s p o b re s (e m m ilh õ e s )
2 2 .7
5 7 .9
L in h a d e p o b re za (e m R $ p o r m ê s )
73
146
V o lu m e a n u a l d e re c u rs o s n e c e s s á rio s p a ra a liv ia r
a p o b re za (e m b ilh õ e s d e R $ )
8 .4
4 5 .7
R e c u rs o s n e c e s s á rio s p a ra a liv ia r a p o b re za c o m o
p o rc e n ta g e m d a re n d a d a s fa m ília s (% )
1 .1
5 .3
CEDEPLAR
INCOME INEQUALITY with
Anne Caroline Costa Resende
• WITH B. FAMILIA
– Coefficient Variation |
1.70619
– Gini coefficient |
0.59145
– Theil index |
0.71427
• WITHOUT B. FAMILIA
– Coefficient of variation |
1.75540
– Gini coefficient |
0.61235 (3.53 higher)
– Theil index |
0.75979
CEDEPLAR
Comparative Basis with estimations
from Ricardo Paes de Barros
Evolução das medidas de desigualdade da distribuição de renda Brasil (1995-2004)
Indicadores
2003
1995
1996
1997
1998
1999
2001
2002
Razão entre a renda apropriada pelos
10% mais ricos e pelos 40% mais
pobres
21.7
24.1
24.6
24.5
24.1
23.2
23.5
22.4
Razão entre a renda apropriada pelos
20% mais ricos e pelos 20% mais
pobres
25.3
28.0
29.8
29.2
28.2
26.9
27.9
25.6
Índice de Theil-T
0.69
0.73
0.73
0.74
0.74
0.72
0.73
0.71
Coeficiente de Gini
0.58
0.60
0.60
0.60
0.60
0.60
0.60
0.59
CEDEPLAR
FINAL REMARKS
• Non-Contributory Cash Transfer (Aposentadoria Rural and
BPC) and Conditional Cash Transfer (Bolsa Familia)
Programs are important REDISTRIBUTIVE policies.
• CHALLENGES FOR POLICY:
– To combine the DEMAND side (human Capital
investments favored by income effect and conditionalities)
with SUPPLY side PROVISION OF SERVICES on
education, health, and nutrition.
– To incorporate a LIFE CYCLE perspective on SOCIAL
POLICY, stressing crucial life cylce transitions.
– Keep in mind the duration of the DEMOGRAPHIC
DIVIDEND and the importance of making a revolution
during a small TIME SPAN.
CEDEPLAR
Download