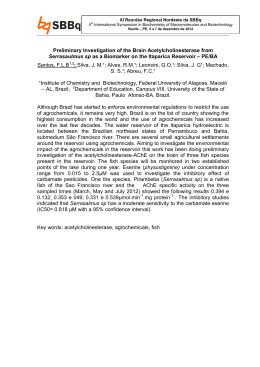
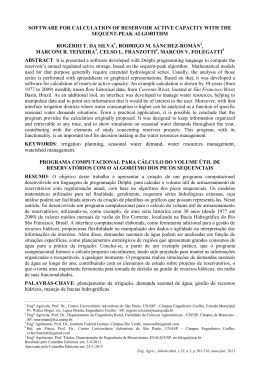
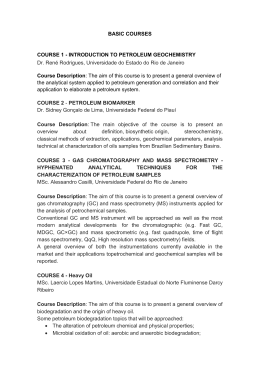
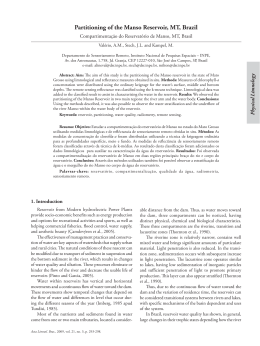
Anais XV Simpósio Brasileiro de Sensoriamento Remoto - SBSR, Curitiba, PR, Brasil, 30 de abril a 05 de maio de 2011, INPE p.5247
Satellite-based monitoring of reservoir eutrophication in the Brazil Semi-arid region
Jean-Michel Martinez12,
Dhalton Ventura2,
Maurrem Ramon Vieira2,
José Luiz Attayde3,
Anna Paola Bubel2,
Marcia Regina Coimbra2,
Eurides de Oliveira2
1
Institut de Recherche pour le Développement (IRD - Brasilia)
CP 7091 - Lago Sul 71635-971 - Brasilia (DF) Brasil.
[email protected]
2
Agência Nacional de Águas, SGH, SOF, SUM
Setor Policial Sul, Área 5, Quadra 3, Bloco L, Brasilia (DF), Brasil. {dhalton.ventura, anna,marciac, maurrem,[email protected]}
3
Universidade Federal do Rio Grande do Norte, CB, Departamento de Ecologia,
CEP: 59072-970, Natal, RN, Brasil.
[email protected]
Abstract. The eutrophication processes in four large reservoirs of the Nordeste region (Brazil) are studied
using long time-series of MODIS images. Reservoirs considered are located in Rio Grande Do Norte and Ceará
state and their catchments are included in the Project for Integration of the São Francisco River. Sixteen field
campaigns were realized in 2009 during wet and dry seasons in two of the reservoirs considered, for
measurements of various water quality parameters including pigment and nutrient concentration at different
depths in the water column. Analysis of the field hyperspectral radiometric measurements collected in that area
supports the idea that combination of MODIS green and red spectral bands may be efficient to monitor the
chlorophyll-a minimum absorption peak near 560 nm but also the presence of inorganic suspended matter. We
processed 833 MODIS 8-day composites images from Terra and Aqua on-board sensors to analyze the temporal
variation of the green and red band combination. Satellite index is clearly correlated with phytoplanktonic
blooms and a fine correlation is found with ground measurements. Using a trophic state index, we investigate the
general status of those reservoirs since year 2000. Even though all the reservoir present common features, such
as the annual eutrophication process from wet to dry season, we detect specific behaviors for each of them when
the inter-annual dynamic is considered.
1. Introduction
In the north-eastern region of Brazil (Nordeste region), there’s a large area of semiarid
climate, referred to as the “Drought Polygon”. Surface reservoirs (açudes) constitute the main
policy for water supply in that region for more than a century. Nowadays, it exists about
100.000 reservoirs, of which 30.000 are located in the Ceará state (Vieira 2002). Although the
açudes are of extreme importance in the regional strategy for the managing of water
resources, those reservoirs often experiment severe water quality problems linked to
eutrophication processes (e.g. Bouvy et al. (1998); Sales et al. (2007); Carvalho et al. (2008);
Freitas (2008); Mosca (2008); Pereira et al. (2008)). A recent report realized over 126
reservoirs in Ceará by the state water company COGERH (2008), reveals that 61 % were
eutrophic and 10% were supereutrophic.
Eutrophication is the process of water body enrichment by nutrients such as nitrogen and
phosphorus. In the case of the açudes, the enrichment is induced by anthropogenic nutrients
coming from domestic waste and diffuse sources. This process leads to uncontrolled growth
5247
Anais XV Simpósio Brasileiro de Sensoriamento Remoto - SBSR, Curitiba, PR, Brasil, 30 de abril a 05 de maio de 2011, INPE p.5248
of alga (mostly cyanobacteria) that results in a decreasing of oxygen content of the water, and
a diffusion of toxins. Those processes raise the cost for water treatment, cause fish mortality
and increase disease prevalence in the local population.
The Project for Integration of the São Francisco River (PISF) aims at reducing the effects of
the recurrent droughts in the Nordeste area. However, definition of optimal water routing
from São Francisco River requires knowledge of past & present water availability and water
quality in rivers/reservoirs. The Brazilian National Water Agency is implementing a network
of hydrologic stations aiming at providing data on a set of rivers and reservoirs from the area.
In this framework, the use of satellite data is tested to provide monitoring of reservoir
eutrophication.
The objective of this work is to assess the eutrophic status of four large reservoirs of the
Nordeste region using long time series of MODIS spaceborne sensors acquired in the past
decade (2000-2010). In the paper, we will address several issues such as calibration of
satellite image using field data, retrieval of spatial and temporal dynamics and the link
between eutrophication and climatology.
2. Data and methods
2.1 Test sites
Figure 1. Location of the four reservoirs studied in this poster : Armando Ribeiro (AM) in the
Rio Grande Do Norte state, Castanhão (CA), Orós (OR) and Banabuiú (BA) in the Ceará
state.
We selected four large reservoirs in this work based on their large area and on the fact that
their watersheds are included in the PISF project. The Armando Ribeiro reservoir (AM) is
located in the Rio Grande Do Norte (RN) state. It is operating since 1983, presenting an
average volume of 2.4 km³, and an average flow of 30 m³/s. The Castanhão reservoir (CA) is
the most recent and the biggest reservoir considered in this study. It is operating since 2004,
stores of about 6.7 km³ covering nearly 35.000 ha, and delivers a mean discharge of 30 m³/s.
The Orós reservoir (OR) is located in the Jaguaribe catchment just as the CA reservoir but is
located upstream. The OR reservoir is the oldest considered in this study, operating since
1961 and storing of about 2.1 km³. Finally, the Banabuiú reservoir (BA) is located in the
Jaguaribe catchment but on a different tributary and downstream OR and CA reservoirs. It
operates since 1966 and stores of about 1.7 km³. All the CA, OR and BA reservoirs are
located in the Ceará state. All the reservoirs considered in this study are subject to multiple
uses of water: domestic water, irrigation, aquaculture and flood control. The whole region is
5248
Anais XV Simpósio Brasileiro de Sensoriamento Remoto - SBSR, Curitiba, PR, Brasil, 30 de abril a 05 de maio de 2011, INPE p.5249
considered as semi-arid but experiments significant interannual rainfall variability. During the
period considered in this study, the annual rainfall (ANA data) in the Jaguaribe catchment
varied from 400 mm (2005) up to 1000 mm (2004).
2.2 Field measurements of water quality
Water quality measurements were acquired in 2009 during 16 campaigns in AM & CA
reservoirs. Measurements were including nutrients and chlorophyll data, collected at the water
surface and at different depths and were processed by the ITEP laboratory (Instituto
Tecnológico do Estado de Pernambuco) under contract with ANA. Field sampling campaigns
were realized during both wet (8 campaigns) and dry (8 campaigns) seasons.
2.3 Field measurements of water quality
Spectral reflectance measurements were carried out using TriOs spectroradiometers during a field
campaign in the AM reservoir realized in November 2008. Technical specifications of the TriOSRAMSES sensors can be found on www.trios.de. Measurements were performed with three
hyperspectral spectroradiometers, two measuring radiance and one measuring downwelling
irradiance. The instruments were mounted on a steel frame that was fixed to the prow of the ship,
facing forward to minimize ship shadow and reflection. A cosine irradiance sensor detected the
incident daylight while a radiance sensor detected the reflected light from the upper water column
at a nadir angle of 35° and another measured the diffuse radiance originating fom the region of
sky that reflects into the seaviewing radiance sensor. The results are given as the remote sensing
reflectance which is the ratio of reflected light from the upper water column (upwelling radiance)
to incident light from the sky (downwelling solar irradiance).
Figure 2. Remote sensing reflectance measured in the AM reservoir. Spectral profiles were
measured using TriOs spectroradiometers. 500-meter MODIS radiometric bands available in
the green and red part of the visible domain are displayed on the figure.
Figure 2 shows the marked contrast between sediment-loaded waters and greenish waters
marked by phytoplanktonic blooms. Green water sample, was collected in the middle of the
lake, and shows chlorophyll-a content of 75 μg/l and near-zero inorganic suspended matter.
Sediment-loaded water sample shows a chlorophyll-a content of 20 μg/l and inorganic
suspended matter concentration of about 17 mg/l. Measurement were realized at the UFRN/
Department of Ecology laboratory. Greenish waters spectrum is marked by various features
typical of pigment absorption. Near 440 nm, we note a reflectance minimum that is caused by
chlorophyll-a maximum absorption. The prominent peak of reflectance at 560 nm in the green
range represents the minimal absorption of all algal pigments. In that region scattering by
non-organic suspended matter and phytoplankton cell walls drives the magnitude of the peak.
In the range of 620-630 nm, a marked decline of reflectance is noticed caused by the
5249
Anais XV Simpósio Brasileiro de Sensoriamento Remoto - SBSR, Curitiba, PR, Brasil, 30 de abril a 05 de maio de 2011, INPE p.5250
absorption of the cyanobacteria phycobillins (Dekker (1993); Gitelson et al. (1995)). The
depth of this feature is likely to vary in accordance with cyanobacter abundance. The trough
near 670 nm is due to maximum absorbance by chlorophyll-a in the red range of the spectrum.
The sediment-loaded brownish water spectral profile was acquired in the Piranhas River
mouth entering the AM reservoir. The river water profile shows some spectral features
induced by pigments but the whole level of reflectance is mainly driven by the suspended
sediment concentration. Based on this observation, it is clear that MODIS green and red bands
may allow to detect the presence of both organic and inorganic suspended matter.
2.4 Satellite images
The Collection 5 atmospherically-corrected surface reflectance products from the Terra and Aqua
MODIS spaceborne sensors are utilized in this study. The MODIS data product MOD09A1
(Terra on-board sensor) and MYD09A1 (Aqua on-board sensor) provides calibrated reflectance
for seven radiometric bands measured at a 500 m pixel resolution while offering near-daily time
coverage over tropical areas (http://modis.gsfc.nasa.gov). Spectral analysis of water is limited to
the visible / near InfraRed region, turning useful only the first four band of MODIS : Band 1
centered at 645 nm (red), band 2 at 858.5 nm (infrared), band 3 at 470 nm(blue) and band 4
centered at 555 nm (green). MODIS surface reflectance 8-day composite data were acquired
between March 2000 and June 2010 from the NASA Earth Observing System (EOS) data
gateway, representing 833 images. We chose composite images because i) the 8-day composite is
compatible with the 10-day field measurement sampling frequency; ii) it reduces the amount of
data to be analyzed as a large number of daily images cannot be used in view of the persistent
cloud cover and iii) it significantly reduces the directional reflectance effects and atmospheric
artifacts. For each date, the composites from Terra and Aqua are automatically scanned and the
image with the lowest cloud coverage is selected. When both composites exhibit low cloud
coverage, the composite acquired with the lowest satellite viewing angle is preferred.
Retrieval of river stream reflectance using MODIS data is hampered by the low spatial
resolution that may result in few pure (non-mixed) water pixels, depending on the river width
and image acquisition geometry. Spectral mixing has been described extensively in the
literature and occurs when different materials are present in a same pixel. In the context of
this study, spectral mixing may occur between water, riverine vegetation or sand banks.
Accordingly, specific algorithm has been developed allowing to derive the water endmember
reflectance in each image. Firstly, river pixels are partitioned into homogeneous clusters using
the K-means algorithm (Martinez et al., Submitted; Martinez et al. (2009)). Then, the fraction
of each endmember in each cluster is obtained by applying a least squares technique to
minimize the unmodeled residual. The set of linear equations is then solved by testing every
cluster as a possible “pure” water endmember. The cluster leading to the lowest residual is
retained as the water endmember (Martinez et al., Submitted).
3. Analysis
3.1 Reflectance time series
Photosynthetic pigments present different spectral features in the visible part of the spectrum
that can be detected using satellite images. Most important spectral feature is the minimum
absorption of chlorophyll-a pigment in the green region leading to a significant increase of
reflectance as a function of pigment concentration. We analyzed the variation of the
reflectance in the green band of MODIS, normalized by the red band in order to reduce bidirectionnal reflectance effects. We created a Satellite Index (SI) defined as :
5250
Anais XV Simpósio Brasileiro de Sensoriamento Remoto - SBSR, Curitiba, PR, Brasil, 30 de abril a 05 de maio de 2011, INPE p.5251
SI = Rgreen – Rred
(1)
Positive values of SI reveal greenish water linked to the presence of green algae while
negative values may occur for brownish sediment-loaded originating from the run-off waters
at rainy season. Figure 3 shows the variation of SI as a function of time in the AM reservoir
and of the water level registered by the DNOCS from 2007 to 2010. The reservoir water level
(red line) shows sharp increase during the wet season (February to June) and can reach the
maximum level of operation at 55 meters. During the dry season (July to January) the water
shows a regular decrease depending on the intensity and the duration of the drought. We
observe that the satellite index shows opposite trend with a sharp decrease at the beginning of
the wet season when the reservoir fills up. On the contrary, the SI shows irregular but
consistent increase during the dry season each year.
Figure 3. MODIS-derived index as a function of time compared with Armando Ribeiro
reservoir water level over the period 2007-2010. During rainy season (February to May), the
reservoir fills up and the satellite index stays low. During the dry season, the water level
decreases while the index increases. MODIS data were derived from 8-day MOD/MYD09A1
image composites.
Figure 4 shows the variation of SI as a function of time in the four reservoirs. The satellite
reflectance time-series over the CA reservoir begins in 2004 since this reservoir filled up for
the first time during the rainy season of that year. Each reservoir appear to behave differently
over the years. The AM reservoir shows significant interannual variability with elevated SI
values all the year during the dry years such as 2002, 2003, 2005 and 2007. On the contrary,
during the most rainy years, the SI index show large oscillation from negative values up to
values of about 400 in 2004, 2008 and 2009. The OR reservoir show distinct behaviors before
and after 2004, the most rainy year in the decade. From 2000 to 2004, the SI index shows
steady and elevated values from 200 to 400. After 2004, SI shows much lower values with
sharp increases at the end of almost each year. The BA reservoir shows some similar features
with the two previous reservoirs including the SI increase from the wet season to the dry
season in 2009. The CA reservoir shows distinct behavior with very low values from 2004 to
the middle of 2008 when the SI started to increase during the dry season.
The temporal variability of the SI index which is correlated with the green color of the water
is coherent with previous studies that points out that droughts induce a high water column
stability, a longer water retention time (meaning lack of water renewal), a nutrient
concentration in excellent conditions of temperature and irradiation (Bouvy et al. (2000)).
Thus, increase of the SI as a function of the decrease of water level is consistent with the
apparition of phytoplanktonic bloom at the beginning of the dry season when the suspended
sediment brought by the floods begin to settle down increasing the water transparency. The
5251
Anais XV Simpósio Brasileiro de Sensoriamento Remoto - SBSR, Curitiba, PR, Brasil, 30 de abril a 05 de maio de 2011, INPE p.5252
differential dynamic of the SI between the different reservoirs may reflect different nutrient
inputs by the local watersheds. The case of the CA reservoir is interesting as the the SI shows
very low values during the first four years of operation, when the nutrient concentration was
probably too low to generate cyabacteria blooms. More discussion on the temporal dynamic
of each reservoir will be presented in the next section.
Figure 4. MODIS-derived index as a function of time over Armando Ribeiro (AM), Banabuiú
(BA), Castanhão (CA) and Orós (OR) reservoirs. MODIS data were derived from 8-day
MOD/MYD09A1 image composites from 2000 to 2010. Satellite Index shows negative values
for rainy seasons when the reservoir waters are dominated by sediment loaded run-off waters.
3.2 Calibration with field measurements
Match-ups between satellite data and field campaign measurements makes possible to
calibrate a relationship between satellite index and Chlorophyll-a water content. We selected
the MODIS image composites closest to the field sampling campaigns and computed a mean
chlorophyll-a concentration retrieved from 3 to 5 sampling points at the water surface
respectively in CA and AM reservoirs. Figure 5 shows the variation of the SI index as a
function of Clorophyll-a concentration. Accuracy of the matchups between in situ and satellite
data may be hampered by the time delay between field measurements and image acquisition
as well as the spatial scale difference. However, the SI is well correlated to the Chl-a samples
making possible to retrieve broad classes of pigment concentration (see next section).
Figure 5. Match-ups between satellite data and chlorophyll-a water content data acquired in
2009 in Armando Ribeiro and Castanhão (CA) reservoirs.
4. Results
We used the Trophic State Index modified for reservoirs (Lamparelli 2004, CETESB) based
on Clorophyll-a content as mapped by MODIS images. Four classes were defined standing for
increasing trophic status : Oligotrophic (Chl-a < 3 mg/m³) , Mesotrophic (3 < Chl-a < 10
mg/m³) , Eutrophic (10 < Chl-a < 30 mg/m³) , Supereutrophic (30 < Chl-a < 70 mg/m³). All
the MODIS archive was processed making possible to analyze the variation of the trophic
5252
Anais XV Simpósio Brasileiro de Sensoriamento Remoto - SBSR, Curitiba, PR, Brasil, 30 de abril a 05 de maio de 2011, INPE p.5253
state in all the reservoirs for 10 years. Figure 6 shows the relative frequency of occurrence of
each trophic state by year for the AM and OR reservoirs. Over the past decade (2000-2009),
AM reservoir was eutrophic/supereutrophic, 84% of the time. Year 2004 shows atypical
behavior consecutive to the strong floods that occurred that year. Before the strong flood of
2004, the reservoir spent 93% of the time in that state. During 2004, the reservoir spent almost
half the year in oligotrophic / mesotrophic states which are the conditions authorized by the
Brazilian legislation. OR reservoir was eutrophic/supereutrophic 97 % of the time before
2004, but only 24 % after. Most recent reservoir (CA) was mesotrophic from its filling (2004)
to 2008. In 2009 and 2010 it’s started being eutrophic.
Figure 6. Relative frequency of occurrence of trophic state by year for the AM reservoir (left)
and the Orós reservoir (right) assessed by MODIS data. Trophic state is determined using the
Trophic State Index modified for reservoirs (Lamparelli 2004, CETESB) based on
Clorophyll-a content as mapped by MODIS images.
The use of MODIS allows to assess the temporal dynamic of eutrophication at different time
scales and points out the variety of conditions among the reservoirs in the Nordeste region.
We identify 3 key time scales in the eutrophication process in this study : 1) Intraannual
variability with a marked variation from wet to dry season for all the 4 reservoirs but not
necessarily each year; 2) Interannual variability in relation to the intensity of the rainfall over
the year; 3) Larger time scales in relation to extreme events introducing non-linear effects on
a mid-term basis: for example the strong flood of 2004 altered the eutrophication pattern for
several consecutive years. Comparison between OR and AM reservoirs is interesting provided
that they exhibit similar behavior before 2004 but show opposite trends after 2004 with a
lower eutrophication in OR. Although Nordeste reservoirs are naturally exposed to
eutrophication processes, the strength of those processes may depends on different factors
such as variation in nutrients inputs from the local catchments, climatology, reservoir
hydraulic or structure of the food webs. Our study puts into evidence the variability of these
processes showing that each catchment may be considered differently. Figure 7 shows the
variation of the relative frequency of occurrence of eutrophic/supereutrophic states each year
as a function of annual rainfall between 2001 and 2009 on AM reservoir. Years 2000 and
2010 were not considered for this graphic because MODIS archive is not complete for that
years. Fine correlation is found showing the control of the euthrophication process by local
climatology. However, such relationship is not found in other such as OR and CA reservoirs.
5. Conclusions
MODIS images were used to monitor eutrophication processes in four large reservoirs of the
Nordeste region. Field radiometric measurements demonstrate that MODIS spectral bands
may be adequate for monitoring of eutrophication through the quantification of chlorophyll-a
absorption minimum near 560 nm. Calibration of MODIS images using field sampling
5253
Anais XV Simpósio Brasileiro de Sensoriamento Remoto - SBSR, Curitiba, PR, Brasil, 30 de abril a 05 de maio de 2011, INPE p.5254
Figure 7. Relative frequency of eutrophic/supereutrophic states as a function of annual
rainfall computed each year from 2001 to 2009 at the Armando Ribeiro reservoir.
measurements made possible to discriminate four classes of chlorophyll-a content. Reliability
and availability of MODIS data makes possible to process the whole archive to study the
eutrophication processes. Comparisons between the reservoirs shows similar features such as the
eutrophication process from wet to dry season, but we detect specific behaviors for each reservoir
when the inter-annual dynamic is considered. Future works may include the monitoring of
suspended sediment in relation to reservoir siltation and nutrient input quantification.
6. Acknowledgments
This study is supported by the following projects and/or funding programs : Monitoramento de
Grande Bacias por Hidrologia Espacial na Amazonia e no Semi Arido between ANA and IRD under
ABC agreement, SAMSAT project funded by the French National Space Agency (CNES) and INSU.
7. Bibliography
• Bouvy, M.; Barros-Franca, L. M.; Carmouze, J. P. Compartimento microbiano no meio pelágico de sete
açudes do estado de Pernambuco. Acta Limnologica Brasiliensia v. 10, n. 1, p. 93-101, 1998.
• Bouvy M., Falcão D., Marinho M., Pagano M., Ariadne Moura. Occurrence of Cylindrospermopsis
(Cyanobacteria) in 39 Brazilian tropical reservoirs during the 1998 drought. Aquatic microbial ecology. Vol. 23:
13–27, 20.
• Carvalho, A. de P. et al. Aspectos qualitativos da água do açude de Bodocongó em Campina Grande –
PB. Engenharia Ambiental, Espírito Santo do Pinhal, v. 5, n. 2, p. 094-109, mai/ago. 2008.
• COGERH. Rede de monitoramento da qualidade da água: boletim informativo. Companhia de
Gestão dos Recursos Hídricos – Cogerh, 2008.
• Dekker. A. (1993): Detection of the optical water quality parameters for eutrophic waters by high
resolution remote sensing. Ph.D. Thesis, Free University, Amsterdam, The Netherlands, 212 p.
• Freitas, F. R. S. Eutrofização do reservatório Cruzeta na bacia representativa do rio Seridó - RN. Natal:
UFRN, 2008. 48 f. Dissertação (Mestrado em Engenharia Sanitária) – Programa de Pós-Graduação em
Engenharia Sanitária, Universidade Federal do Rio Grande do Norte, Natal, 2008.
• Gitelson, A., Laorawat, S., Keydan, G.P., and Vonshak, A. (1995): Optical properties of dense algal
cultures outdoors and its application to remote estimation of biomass and pigment concentration in Spirulina
platensis. J. Phycology, Vol. 31, No. 5, pp. 828-834.
• Lamparelli, MC. 2004. Graus de trofia em corpos d'água do Estado de São Paulo: avaliação dos
métodos de monitoramento. São Paulo: Instituto de Biociências da Universidade de São Paulo, USP. 235 p.
• Martinez J.M., Guyot J.L., N. Filizola, F. Sondag. Increase in suspended sediment yield of the Amazon
River assessed by monitoring network and satellite data. Catena, 79, (2009), pp. 257-264.
• Martinez, J.M. et al., Submitted. Surface water quality monitoring of rivers with MODIS data - Application
to the Amazon River. Remote Sensing of Environment.
• Mosca, V. P. Eutrofização do reservatório Engenheiro Armando Ribeiro Gonçalves, no Rio Grande do
Norte. Natal: UFRN, 2008. 73 f. Dissertação (Mestrado em Bioecologia Aquática) – Programa de Pós-Graduação
em Bioecologia Aquática, Universidade Federal do Rio Grande do Norte, Natal, 2008.
• Pereira, M. O. et al. Avaliação qualitativa e quantitativa de cianobactérias no açude Cedro, município de
Quixadá – CE, no período de janeiro/2006 a dezembro/2007... 2008. Trabalho apresentado no XII Congresso
Brasileiro de Ficologia, Pirenópolis (GO), 2008.
• Sales, M. do V.; Bernardo, L. di; Pádua, V. L. de; Avelino, F. F. Remoção de cianobactérias no
tratamento de água eutrofizada utilizando dupla filtração e oxidação. Revista AIDIS, v. 1, n. 3, 2007.
• Vieira, V. P. P. B. Sustentabilidade do semi-árido brasileiro: desafios e perspectivas. Revista Brasileira
de Recursos Hídricos, v. 7, n. 4, p. 105-112, dez. 2002.
5254
Download