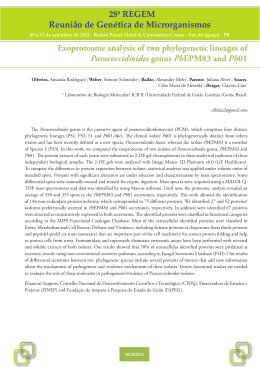
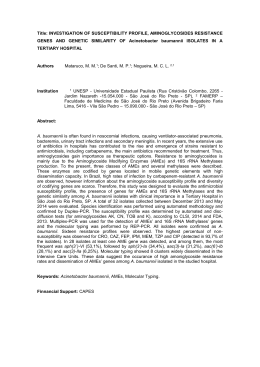
Brazilian Journal of Medical and Biological Research (2000) 33: 19-26
Characterization of Acanthamoeba by RAPD
ISSN 0100-879X
19
Random amplified polymorphic
DNA profiles as a tool for the
characterization of Brazilian keratitis
isolates of the genus Acanthamoeba
J.M.P. Alves1, C.X. Gusmão1,
M.M.G. Teixeira1,
D. Freitas2, A.S. Foronda1
and H.T. Affonso1
1Departamento
de Parasitologia, Instituto de Ciências Biomédicas,
Universidade de São Paulo, São Paulo, SP, Brasil
2Departamento de Oftalmologia, Escola Paulista de Medicina,
Universidade Federal de São Paulo, São Paulo, SP, Brasil
Abstract
Correspondence
H.T. Affonso
Av. Prof. Lineu Prestes, 1374
05508-900 São Paulo, SP
Brasil
Fax: +55-11-818-7417
E-mail: [email protected]
Research supported by FAPESP and
CNPq. J.M.P. Alves and C.X. Gusmão
are recipients of FAPESP fellowships.
Received December 17, 1998
Accepted November 4, 1999
The genus Acanthamoeba comprises free-living amebae identified as
opportunistic pathogens of humans and other animal species. Morphological, biochemical and molecular approaches have shown wide
genetic diversity within the genus. In an attempt to determine the
genetic relatedness among isolates of Acanthamoeba we analyzed
randomly amplified polymorphic DNA (RAPD) profiles of 11 Brazilian isolates from cases of human keratitis and 8 American type culture
collection (ATCC) reference strains. We found that ATCC strains
belonging to the same species present polymorphic RAPD profiles
whereas strains of different species show very similar profiles. Although most Brazilian isolates could not be assigned with certainty to
any of the reference species, they could be clustered according to
pattern similarities. The results show that RAPD analysis is a useful
tool for the rapid characterization of new isolates and the assessment
of genetic relatedness of Acanthamoeba spp. A comparison between
RAPD analyses and morphological characteristics of cyst stages is
also discussed.
Introduction
Free-living amebae of the genus Acanthamoeba are opportunistic pathogens of humans and other animal species and have
been isolated from a wide variety of natural
and man-made environments (1,2). In humans, some species have been implicated in
different pathologies, including granulomatous amebic encephalitis (GAE), which occurs in immunologically depressed individu-
Key words
·
·
·
·
Acanthamoeba
Keratitis
RAPD typing
Genetic variation
als, and keratitis, a severe and painful corneal infection mainly associated with the use
of contact lenses (3,4).
The identification of Acanthamoeba spp
at the genus level is relatively easy since the
trophozoite and cyst stages show some features, especially the double-walled cyst shape,
that are unique to the genus. Since a wide
variability of cyst sizes and shapes can be
detected among different isolates, 18 different species were described and assigned to
Braz J Med Biol Res 33(1) 2000
20
J.M.P. Alves et al.
three distinct morphological groups (I, II and
III) based primarily on endo- and ectocyst
features (5). However, since the shape of
cyst walls can be altered by growth conditions (6), various studies have shown that
division of Acanthamoeba sp isolates into
different groups and/or species is often inconsistent with the classical group designations mentioned above (7-9). Morphological
parameters alone are thus not suitable for an
accurate identification at the species level.
Among the molecular approaches that
have been employed to discriminate species
within the genus are isoenzyme patterns
(8,10), restriction analysis of mitochondrial
DNA (7,11), whole-cell DNA (12) or ribosomal DNA small subunit (SSU rDNA) (13).
Based on SSU rDNA sequences, at least 12
different sequence types (T1-T12) were detected (14). Despite the demonstration of a
high genetic variability within the genus,
and nonetheless contributing to the classification of Acanthamoeba sp, most of these
methods require large amounts of DNA, relatively complex procedures and even sequencing of the target DNA. On the other hand, the
randomly amplified polymorphic DNA
(RAPD) method does not require large amounts of DNA, time-consuming procedures
or any a priori knowledge about the target
sequences (15,16). This method has been
extensively used to evaluate genetic differences between related organisms (17-20).
In the present study we investigated by
RAPD analysis the genetic relatedness among 19 Acanthamoeba spp, including 8
reference species from the American type
culture collection (ATCC) and 11 not yet
characterized Brazilian keratitis isolates. The
results were used to construct data matrices
and phenograms. RAPD profiles showed
highly polymorphic patterns among most of
the isolates studied but revealed some groups
of more related organisms. The results of
RAPD analysis were compared with those of
morphological and morphometric analysis
of cysts from the different isolates.
Braz J Med Biol Res 33(1) 2000
Material and Methods
Organisms, growth conditions and DNA
extraction
The origin and characteristics of the organisms used are listed in Table 1. For cloning purposes, isolates were grown on 2%soy extract agar plates previously seeded
with heat-killed, plasmidless Escherichia
coli. Two to 5 trophozoites were picked from
each isolate and grown on fresh soy agar
plates. After growing and encystment, one
cyst of each isolate was cultured, unless
otherwise specified. For large axenic cultures, cysts or trophozoites were inoculated
in Neff medium (21) containing ampicillin
(100 µg/ml) and/or gentamicin (40 µg/ml)
and incubated at 28oC with shaking. DNA
was purified from late-log-phase cultured
cells by SDS lysis, phenol-chloroform extraction, and isopropanol precipitation, basically by the method of Kilvington et al. (22).
Determination of cyst features
To determine their size and structural
features, a total of 50 cysts of each corneal
scraping isolate and ATCC reference strains
were photographed under the phase microscope and the main diameters were measured. The images were scanned and digitally
processed to enhance quality. The average
measurements of each isolate are presented
in Table 1.
RAPD reactions and product analyses
A total of 35 decameric oligonucleotides
of arbitrary sequence were used in a previous screening of some Acanthamoeba spp
isolates. According to the number and intensity of the resulting bands, the reproducibility and discriminating potential of the amplified products, three oligonucleotides were
selected for further analyses: 606 (5'CGGTCGGCCA-3'), 688 (5'-GCAGGAGC
21
Characterization of Acanthamoeba by RAPD
GT-3') and 694 (5'-GGTTTGGAGG-3').
Several of the remaining oligonucleotidederived patterns, while still useful to confirm the results of genetic similarity estimates, were not used in the computer analyses.
The DNA amplification reactions were
performed in 50 µl volumes containing 100
ng of template DNA, 250 µM of dNTPs, 100
pmol of a single primer, 2 units of Taq DNA
polymerase (Gibco BRL, Gaithersburg, MD,
USA), and 1.5 mM MgCl2, in a Progene
thermocycler (Techne, Cambridge, UK). The
cycling conditions used were: initial denaturing phase of 94oC for 3 min and 35 repetitions at 94oC for 1 min, 37oC for 2 min and
72oC for 2 min. The primer extension phase
was prolonged for 10 min at 72oC in the last
cycle. Amplification products were fractionated by 2% agarose gel electrophoresis, stained with ethidium bromide and photographed
under ultraviolet light with an Eagle Eye II
(Stratagene, La Jolla, CA, USA) image processor. The molecular marker used for fragment sizing was a 100-bp DNA ladder
(Pharmacia Biotech, Uppsala, Sweden). For
data analysis, amplification products obtained
with each primer from each Acanthamoeba
spp isolate were fractionated in the same gel.
Computer-assisted analysis
The digitized gel images were analyzed
with the use of the RFLPscan Plus software
(version 3.0, Scanalytics CSP Inc., Billerica,
MA, USA) in order to size and compare the
DNA fragments amplified from the various
strains. The discrete character matrix (absence or presence of bands) was analyzed by
the RAPDistance software version 1.03 (23)
for the calculation of genetic distances between all compared isolates, using the Jaccard
index (A/A + B + C, where A is the number of
shared bands among two organisms x and y,
and B and C are the number of bands present
only in organism x or y, respectively). To
graphically represent the inferred groups, a
phenogram was constructed by the UPGMA
method using the PHYLIP 3.5 Neighbor program (24). In order to assess the robustness
of the branching, a hundred bootstrap replicates were constructed and only branches
presenting bootstrap values of at least 50
were considered as supported clusters.
Results and Discussion
A total of 11 Brazilian keratitis isolates
and 8 ATCC reference strains, the latter
belonging to 4 different species representative of the three known morphological groups
of Acanthamoeba (Table 1), were characterized based on cyst morphology and RAPD
analysis.
The classification of the isolates within
the genus Acanthamoeba was based on morphological criteria (5). Figure 1 shows the
highly characteristic double-walled morphology of cyst stages of Brazilian keratitis isolates and some representative ATCC referTable 1 - Characteristics of Acanthamoeba isolates.
ATCC: American type culture collection; A. poly.: Acanthamoeba polyphaga; A. cast.:
A. castellanii; HAK: human Acanthamoeba keratitis; CLW: contact lenses wearer;
NCLW: noncontact lenses wearer; HCC: human choriocarcinoma cells; U/E: USP/EPM;
U/HC; USP/HC; aaverage measurements of 50 cysts; btwo morphologically distinct
clones isolated from the same corneal sample; cisolated from the right (R) and left (L)
eye of the same patient.
Isolate
ATCC
Source
A. astronyxis
A. poly. #1
A. poly. #2
A. poly. #3
A. poly. #4
A. cast. #1
A. cast. #2
A. royreba
U/E 1
U/E 2
U/E 3
U/E 4
U/E 5
U/E 6
U/E 7.1b
U/E 7.2b
U/E 8Rc
U/E 8Lc
U/HC1
30901
30873
30461
30871
30872
30011
30868
30884
water
HAK
HAK
water
water
yeast culture
HAK
HCC
HAK-CLW
HAK-CLW
HAK-CLW
HAK-NCLW
HAK-NCLW
HAK-CLW
HAK-CLW
HAK-CLW
HAK-CLW
Cyst diameter (µm ± SD)a
19.7
16.4
16.6
16.3
16.4
17.4
15.4
17.2
17.0
14.9
16.7
18.3
14.2
14.8
14.0
18.8
16.5
18.8
10.8
±
±
±
±
±
±
±
±
±
±
±
±
±
±
±
±
±
±
±
1.6
1.5
2.2
2.7
1.5
1.6
1.6
2.4
2.2
1.4
1.8
1.6
1.8
1.9
1.5
2.0
2.3
1.4
1.4
Braz J Med Biol Res 33(1) 2000
22
Figure 1 - Representative cysts
of Acanthamoeba isolates photographed by phase microscopy
and digitally processed. A,
ATCC reference isolates - 1: A.
astronyxis; 2: A. cast. #1; 3: A.
poly. #3; 4: A. cast. #2; 5: A.
royreba, and 6: A. poly. #4. B,
Brazilian keratitis isolates - 1: U/
HC 1; 2: U/E 1; 3: U/E 3; 4: U/E
4; 5: U/E 5; 6: U/E 6; 7: U/7.1; 8:
U/E 7.2; 9: U/E 8R; 10: U/E 8L,
and 11: U/E 2. Bar = 12.0 µm.
For abbreviations, see legend
to Table 1.
J.M.P. Alves et al.
A
B
ence strains. Except for A. astronyxis, which
presents large cysts with a smooth ectocyst
and a stellate endocyst typical of group I, and
A. royreba, typical of group III, the shape
features of cysts were closely similar among
the different isolates (Figure 1). On the other
hand, average cyst sizes obtained from our
keratitis isolates showed wide variability,
ranging from 10.8 to 18.8 µm (Table 1). In
spite of this high variability, the morphological criteria allowed us to classify keratitis
isolates in the genus Acanthamoeba, although
they proved insufficient to distinguish among most of them. Based on these criteria,
they could be included in morphological
group II which comprises the majority of
species (25).
To determine the genetic relatedness of
the isolates, DNA fingerprints were determined by RAPD analysis. Each reaction was
repeated at least three times, and 100 stable
bands were considered and computed in the
matrices. In most cases, RAPD profiles alBraz J Med Biol Res 33(1) 2000
lowed detection of extensive polymorphism
among isolates. Similar results were obtained
with the three primers and an illustrative
profile is shown in Figure 2.
Results from the RAPD analyses with the
three primers were combined and used to
calculate a matrix of pairwise similarities
(Figure 3). This matrix was used to construct
a phenogram, after determination of bootstrap values for 100 replicates (Figure 4). As
expected from the RAPD profiles, some genetically more related Brazilian keratitis isolates could be detected. However, as a result
of the high genetic variability, no major
groups could be assigned. Moreover, none
of our keratitis isolates could be surely
grouped with any ATCC reference strains.
Although minor differences in RAPD profiles were detected, four clusters of Brazilian
keratitis isolates could be identified: a) U/E
1 and 3, b) U/E 4, 5 and 6, c) U/E 7.1 and 7.2,
and d) U/E 8R and 8L. Isolates U/E 2 and U/
HC 1 could not be assigned to any cluster
23
bp
1500 800 -
U/E 7-2
U/E 7-1
U/E 5
U/E 4
U/E 6
U/HC 1
U/E 2
A. poly. #2
A. cast. #1
U/E 3
U/E 1
A. poly. #3
A. poly. #4
U/E 8L
U/E 8R
A. cast. #2
A. royr.
A. poly. #1
A. astr.
Characterization of Acanthamoeba by RAPD
Figure 2 - RAPD profiles of 19
Acanthamoeba isolates obtained
with primer 688 (5'-GCAGGA
GCGT-3'). The PCR products
were resolved by electrophoresis on 2% agarose gel. Designations of isolates are indicated on
the top: A. astr.: A. astronyxis,
A. poly.: A. polyphaga, A. cast.:
A. castellanii, A. royr.: A. royreba,
U/E: USP/EPM, U/HC: USP/HC.
Molecular size markers (100-bp
DNA ladder - Gibco BRL) are
shown on the left.
-
200 -
Figure 3 - Matrix showing pairwise similarities calculated for
RAPD profiles obtained with
primers 606, 688 and 694. For
abbreviations, see legend to Figure 2.
Braz J Med Biol Res 33(1) 2000
24
J.M.P. Alves et al.
Figure 4 - Unrooted UPGMA
phenogram based on RAPD profiles of 19 Acanthamoeba isolates obtained with primers 606,
688 and 694. For abbreviations,
see legend to Figure 2. The numbers at the nodes represent
bootstrap values for a hundred
replicates.
77
50
87
66
100
100
98
0.1
A. astr.
U/E 2
A. poly. #4
A. cast. #1
A. cast. #2
A. poly. #1
A. royr.
A. poly. #2
U/E 6
U/E 4
U/E 5
U/E 7-1
U/E 7-2
U/E 8R
U/E 8L
U/E 1
U/E 3
A. poly. #3
U/HC 1
since they showed high genetic variability
when compared to the others. Based on the
analysis of the resulting clusters, we found
both agreements and disagreements between
RAPD profiles and morphological cyst features. In the clusters harboring U/E 1 and 3,
and U/E 5 and 6, the isolates showed very
similar cyst sizes (Table 1, Figure 1) and
RAPD patterns (Figure 2), despite the fact
that they were isolated from different patients. In contrast, the clusters to which U/E
4 and 5, U/E 7.1 and 7.2, and U/E 8R and 8L
were assigned showed discordance between
cyst sizes and RAPD patterns. The cyst sizes
of isolates U/E 4 and 5 were 18.33 µm and
14.17 µm, respectively, whereas their RAPD
profiles were very similar (Figure 2).
It is noteworthy that U/E 7.1 and 7.2, and
U/E 8 L and R also showed discrepancies
between cyst sizes and RAPD profiles. The
two clones of U/E 7, which were simultaneously isolated from the same corneal
sample, showed quite different cyst sizes
(Table 1, Figure 1). These observations may
suggest that the patient had been infected
with genetically different amebae. However,
despite some detected differences, especially
with primer 688 (similarity index of 0.87),
very similar RAPD patterns were obtained
(Figure 2), indicating that the two clones
probably originated from the same organism. In fact, it has been reported that cyst
morphology might vary depending on culture conditions, even within cloned strains
(6,26), possibly explaining the polymorphism
Braz J Med Biol Res 33(1) 2000
of cyst sizes. Isolates U/E 8R and 8L, which
were respectively obtained from the right
and left eye of another patient, showed very
similar cyst features (Table 1). However, the
RAPD patterns with primer 688 (Figure 2)
showed a lower similarity index (0.57) when
compared with that of the two clones of U/E
7. Analyses with other primers showed similar results (data not shown), indicating that
this patient could have been infected by
genetically different organisms.
A remarkable feature of the RAPD-derived phenogram is the presence of strains
assigned to the same species (A. castellanii
and A. polyphaga) distributed through different branches. On the other hand, different
species - A. poly. #1, A. cast. #2 and A.
royreba - were assigned to nearby branches.
These observations do not agree with the
morphological data, especially with cyst diameter. For example, the four strains designated as A. polyphaga (morphological group
II) showed a narrow range of cyst sizes and
A. royreba showed cyst shapes and measurements typical of morphological group III
(Table 1). In contrast, A. astronyxis, a representative species of morphological group I,
could not be clustered with any other reference species or our keratitis isolates, showing concordance between RAPD profiles and
cyst features. Similar findings were also observed by other approaches (8,14,27). Therefore, it is clear that species definition in the
genus Acanthamoeba - especially those assigned to either A. polyphaga or A. castellanii
- must be reviewed, as recently proposed
(14).
Our data demonstrate the ability of RAPD
analysis to assign a specific genetic fingerprint to otherwise morphologically indistinguishable Acanthamoeba isolates. Furthermore, this approach proved to be useful in
the characterization of new isolates and for
the assessment of genetic relatedness and
proved to be a fast and informative strategy
to determine relationships among different
strains. A general limitation of our technique
25
Characterization of Acanthamoeba by RAPD
is its inability to properly infer phylogenetic
relationships, because genetic distances calculated from RAPD could be affected by
paralogy, which would make RAPD patterns
inconsistent with speciation events. Even
identification could be hampered by such
problems, since some patterns could eventually mislead species assignment. However,
our RAPD analyses are in agreement with
preliminary SSU rDNA fingerprinting profile determination, which is in progress in
our laboratory, indicating that this problem
probably does not affect our analyses. This
is nonetheless very serious and should be
addressed with care in future studies.
Other approaches, such as sequencing of
ribosomal DNA subunits, can be used for a
more precise determination of the relationships among our strains. However, such relationships cannot be assessed if the approach used is unable to detect subtle differences between very closely related organisms, as recently found in the analysis of
SSU rDNA sequences (14). Based on this
last approach, at least 12 different sequence
types (T1-T12) were detected, presenting
dissimilarities ranging from 5.0 to 37.6%
between sequence types. The detection of
such divergent SSU rDNA sequences is in
accordance with our data, since it also reflects the high polymorphism of these organisms. However, as stated by those authors,
this strategy could not identify branching
patterns within T4 sequence type strains, a
group to which 24 of 25 worldwide-distributed keratitis isolates were assigned. Although our keratitis isolates were not characterized by that approach, they showed a high
degree of polymorphism and hence were
distributed through different branches by our
RAPD analyses. It would thus be interesting
to investigate whether these isolates present
the same SSU sequence types or, conversely,
if RAPD patterns of the isolates designated
as T4 would be so polymorphic as to allow
the identification of their branching patterns.
It should be noted that three ATCC reference
strains - A. poly. #1 (30873), A. poly. #3
(30871), and A. cast. #1 (30011) - which
were assigned to the same sequence type
(T4), were also spread across different
branches of the phenogram (Figure 4).
In conclusion, the RAPD technique can
be useful to distinguish between closely related Acanthamoeba sp isolates and to possibly characterize additional isolates of this
genus. On the other hand, more conserved
sequences would still be required to determine major groups involving less related
strains.
Acknowledgments
The authors thank Annamaria S. Stolf,
Regina V. Milder and Silvia C. Alfieri for a
critical reading of the manuscript, and Manoel
A. Peres for technical assistance.
References
1. Ma P, Visvesvara GS, Martinez AJ,
Theodore FH, Dagget PM & Sawyer TK
(1990). Naegleria and Acanthamoeba infections: review. Reviews of Infectious
Diseases, 12: 490-513.
2. Kilvington S & White DG (1994). Acanthamoeba: biology, ecology and human disease. Reviews in Medical Microbiology,
5: 12-20.
3. Logar J & Kraut A (1997). Acanthamoeba
corneal infection in a contact lens wearer.
Journal of Infection, 35: 237-240.
4. Szénási Z, Endo T, Yagita K & Nagy E
(1998). Isolation, identification and increasing importance of “free-living” amoebae
causing human disease. Journal of Medical Microbiology, 47: 5-16.
5. Pussard R & Pons M (1977). Morphologie
de la paroi kystique et taxonomie du genre
Acanthamoeba (Protozoa, Amoebida).
Protistologica, 13: 557-598.
6. Stratford MP & Griffiths AJ (1978). Variations in the properties and morphology of
cysts of Acanthamoeba castellanii. Journal of General Microbiology, 108: 33-37.
7. Costas M, Edwards SW, Lloyd D, Griffiths
AJ & Turner G (1983). Restriction enzyme
analysis of mitochondrial DNA of members of the genus Acanthamoeba as an
aid in taxonomy. FEMS Microbiology Letters, 17: 231-234.
8. Daggett P, Lipscomb D, Sawyer TK &
Nerad TA (1985). A molecular approach to
the phylogeny of Acanthamoeba. BioSystems, 18: 399-405.
9. Visvesvara GS (1991). Classification of
Acanthamoeba. Reviews of Infectious
Diseases, 13: S369-S372.
10. Costas M & Griffiths AJ (1985). Enzyme
Braz J Med Biol Res 33(1) 2000
26
11.
12.
13.
14.
15.
16.
J.M.P. Alves et al.
composition and the taxonomy of Acanthamoeba. Journal of Protozoology, 32:
604-607.
Yagita K & Endo T (1990). Restriction enzyme analysis of mitochondrial DNA of
Acanthamoeba strains in Japan. Journal
of Protozoology, 37: 570-575.
McLaughlin GL, Brandt FH & Visvesvara
GS (1988). Restriction fragment length
polymorphisms of the DNA of selected
Naegleria and Acanthamoeba amoebae.
Journal of Clinical Microbiology, 26: 16551658.
Kong HH & Chung DI (1996). PCR and
RFLP variation of conserved region of
small subunit ribosomal DNA among
Acanthamoeba isolates assigned to either
A. castellanii or A. polyphaga. Korean Journal of Parasitology, 34: 127-134.
Stothard DR, Schroeder-Diedrich JM,
Awwad MH, Gast RJ, Ledee DR,
Rodriguez-Zaragoza S, Dean CL, Fuerst
PA & Byers TJ (1998). The evolutionary
history of the genus Acanthamoeba and
the identification of eight new 18S rRNA
gene sequence types. Journal of Eukaryotic Microbiology, 45: 45-54.
Welsh J & McClelland M (1990). Fingerprint genomes using PCR with arbitrary
primers. Nucleic Acids Research, 18:
7213-7218.
Williams JGK, Kubelik AR, Livak KJ,
Rafalski JA & Tingey SV (1990). DNA poly-
Braz J Med Biol Res 33(1) 2000
17.
18.
19.
20.
21.
morphisms amplified by arbitrary primers
are useful as genetic markers. Nucleic
Acids Research, 18: 6531-6535.
Steindel M, Dias Neto E, Carvalho Pinto
CJ, Grisard EC, Menezes CLP, Murta
SMF, Simpson AJG & Romanha AJ
(1994). Randomly amplified polymorphic
DNA (RAPD) and isoenzyme analysis of
Trypanosoma rangeli strains. Journal of
Eukaryotic Microbiology, 41: 261-267.
Pogue GP, Koul S, Lee NS, Dwier DM &
Nakhasi HL (1995). Identification of intraand interspecific Leishmania genetic polymorphisms by arbitrary primed polymerase chain reactions and use of polymorphic DNA to identify differentially
regulated genes. Parasitology Research,
81: 282-290.
Pélandakis M, Kaundun SS, De
Jonckeheere JF & Pernin P (1997). DNA
diversity among the free-living amoeba,
Naegleria fowleri, detected by the random amplified polymorphic DNA method.
FEMS Microbiology Letters, 151: 31-39.
Tibayrenc M (1998). Genetic epidemiology of parasitic protozoa and other infectious agents: the need for an integrated
approach. International Journal of Parasitology, 28: 85-104.
Neff RJ, Ray SA, Benton WF & Wilborn M
(1964). Induction of synchronous encystment (differentiation) in Acanthamoeba
sp. In: Prescott DM (Editor), Methods in
22.
23.
24.
25.
26.
27.
Cell Physiology. Academic Press, New
York.
Kilvington S, Beeching J & White DG
(1991). Differentiation of Acanthamoeba
strains from infected corneas and the environment by using restriction endonuclease digestion of whole-cell DNA. Journal of Clinical Microbiology, 29: 310-314.
Armstrong J, Gibbs A, Peakall R & Weller
G (1994). RAPDistance Programs, Version
1.03 for the Analysis of Patterns of RAPD
Fragments. Australian National University,
Canberra.
Felsenstein J (1989). Phylip 3.2 Manual.
University of California, Herbarium, Berkeley, CA.
Walker CWB (1996). Acanthamoeba: ecology, pathogenicity and laboratory detection. British Journal of Biomedical Science, 53: 146-151.
Jacobson LM & Band RN (1987). Genetic
heterogeneity in a natural population of
Acanthamoeba polyphaga from soil, an
isoenzyme analysis. Journal of Protozoology, 34: 83-86.
Bogler SA, Zarley CD, Burianek LL, Fuerst
PA & Byers TJ (1983). Interstrain mitochondrial DNA polymorphism detected in
Acanthamoeba by restriction endonuclease analysis. Molecular and Biochemical Parasitology, 8: 145-163.
Download