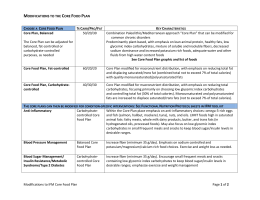
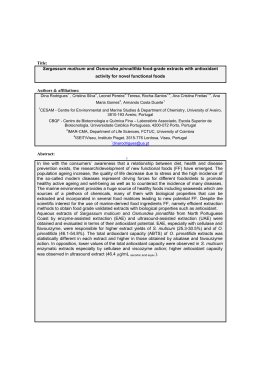
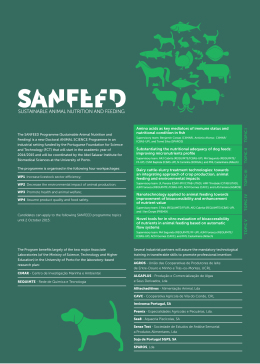
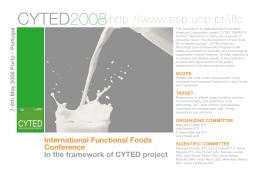
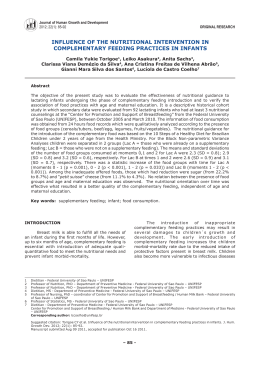
Acta Pædiatrica, 2006; Suppl 450: 27 /37
Complementary feeding in the WHO Multicentre Growth Reference
Study
WHO MULTICENTRE GROWTH REFERENCE STUDY GROUP1,2
1
Department of Nutrition, World Health Organization, Geneva, Switzerland, and 2Members of the WHO Multicentre
Growth Reference Study Group (listed at the end of the first paper in this supplement)
Abstract
Aim: To describe complementary feeding practices in the Multicentre Growth Reference Study (MGRS) sample. Methods:
Food frequency questionnaires and 24-h dietary recalls were administered to describe child feeding throughout the first 2 y
of life. This information was used to determine complementary feeding initiation, meal frequency and use of fortified foods.
Descriptions of foods consumed and dietary diversity were derived from the 24-h recalls. Compliance with the feeding
recommendations of the MGRS was determined on the basis of the food frequency reports. Descriptive statistics provide a
profile of the complementary feeding patterns among the compliant children. Results: Complementary feeding in the
compliant group began at a mean age of 5.4 mo (range: 4.8 (Oman) /5.8 mo (Ghana)). Complementary food intake rose
from 2 meals/d at 6 mo to 4 /5 meals in the second year, in a reverse trend to breastfeeding frequency. Total intake from the
two sources was 11 meals/d at 6 /12 mo, dropping to 7 meals/d at 24 mo. Inter-site differences in total meal frequency were
mainly due to variations in breastfeeding frequency. Grains were the most commonly selected food group compared with
other food groups that varied more by site due to cultural factors, for example, infrequent consumption of flesh foods in
India. The use of fortified foods and nutrient supplements was also influenced by site-variable practices. Dietary diversity
varied minimally between compliance groups and sites.
Conclusion: Complementary diets in the MGRS met global recommendations and were adequate to support
physiological growth.
Key Words: Complementary feeding, dietary diversity index, food frequency, infant feeding, 24-hour dietary recall
Introduction
The WHO Multicentre Growth Reference Study
(MGRS) was designed to collect growth data from
an international sample of healthy breastfed infants
from widely differing ethnic backgrounds and cultural
settings (Brazil, Ghana, India, Norway, Oman and the
USA) [1]. These data have been used to create the
new length/height- and weight-based growth
standards presented in this supplement [2]. As
described elsewhere [3], complementary feeding
practices were one of the secondary criteria used for
selection of the study sites for the MGRS. The
intention was to select populations in which feeding
practices were unlikely to pose any constraints on
growth. Thus, it is important to document how the
children in the MGRS sample were fed in each of the
sites.
The period of complementary feeding, when other
foods are added to the diet of breastfed children, is a
time of particular vulnerability to nutritional deficiencies. This is because children at this age are growing
and developing rapidly, yet do not consume large
quantities of food. Thus, the foods they eat must be of
high nutrient density to provide adequate amounts of
essential nutrients. In recent years increasing attention has been paid to the importance of complementary feeding [4,5]. The key limiting nutrients
identified for breastfed children between the ages of
6 and 24 mo are iron, zinc, vitamin B6 and, in some
populations, riboflavin, niacin, thiamin, calcium,
vitamin A, folate and vitamin C. Vitamin D is also
of concern in populations with low exposure to
sunshine or at high latitudes. In 2003, global guidelines for complementary feeding of the breastfed child
were published [6]. These included recommendations
on 1) introducing complementary foods at 6 mo of
age, 2) continued breastfeeding to 2 y of age or
beyond, 3) responsive feeding practices, 4) safe,
hygienic preparation and feeding of complementary
Correspondence: Mercedes de Onis, Study Coordinator, Department of Nutrition, World Health Organization, 20 Avenue Appia, 1211 Geneva 27,
Switzerland. Tel: /41 22 791 3320. Fax: /41 22 791 4156. E-mail: [email protected]
ISSN 0803-5326 print/ISSN 1651-2227 online # 2006 Taylor & Francis
DOI: 10.1080/08035320500495456
28
WHO Multicentre Growth Reference Study Group
foods, 5) amounts of complementary foods needed at
each age interval, 6) food consistency, 7) meal
frequency and energy density, 8) assuring adequate
nutrient intake from complementary foods, 9) use of
fortified foods or nutrient supplements, and
10) feeding during and after illness. This paper
describes the complementary feeding practices of the
sample of infants and young children used to construct the WHO Child Growth Standards, and discusses the patterns observed with regard to several of
the global guidelines above, such as age of introduction of complementary foods, meal frequency, dietary
quality, and use of fortified foods or nutrient supplements.
Methods
Overview of the MGRS
The MGRS was a six-country community-based
project designed to develop new growth standards
for infants and young children. The design included a
longitudinal component that followed children from
birth to 24 mo and a cross-sectional component that
enrolled children aged 18 to 71 mo. The pooled
sample from all six countries included 8440 children.
The study subpopulations were selected so that socioeconomic conditions would be favourable to growth,
and the selection criteria for individuals specified
absence of health or environmental constraints on
growth, adherence to recommended infant feeding
practices, absence of maternal smoking, single term
birth, and absence of significant morbidity. This paper
describes data from the longitudinal component of the
MGRS where mothers and newborns were screened
and enrolled at birth and visited in the home at weeks
1, 2, 4 and 6, monthly from 2 to 12 mo, and every 2
mo in the second year of life. Details of the study
design and methods can be found elsewhere [3].
Complementary feeding guidelines
As described elsewhere [7/12], mothers in each site
were given guidelines on complementary feeding.
Mothers were advised to introduce complementary
foods at 4 /6 mo (the WHO recommendation prior to
2001) in Norway and the USA and, in line with
individual national policies, at 5 /6 mo in Oman and
at 6 mo in Brazil, Ghana and India. In all sites,
continued breastfeeding was recommended and the
guidelines emphasized use of a variety of nutrient-rich
foods. Most of the sites also included guidelines
regarding meal frequency, food consistency, use of a
separate bowl for the infant, use of iron-rich and
vitamin A-rich foods, and responsive feeding practices. Half of the sites included advice on nutrient
supplements (India, Norway and the USA), limita-
tions on use of sugary beverages such as juice (Norway, Oman and the USA), and avoidance of certain
foods if there was a family history of allergy (Norway,
Oman and the USA). India and Oman provided
guidelines on the amounts of foods to be fed. Ghana
and India included recommendations regarding hygiene when preparing and feeding complementary
foods. Norway and the USA included advice to use
infant formula if a supplement to breast milk was
needed. India and Oman advised using only iodized
salt, while Norway advised against adding salt to baby
food.
Compliance criteria
As described elsewhere [13], the MGRS included
three compliance criteria with regard to infant feeding: 1) exclusive or predominant breastfeeding for at
least 4 mo (120 d), 2) introduction of complementary
foods between 4 and 6 mo (120 to 180 d), and 3)
partial breastfeeding to be continued for at least 12
mo (365 d). The operational definition of compliance
with the first criterion was that the infant did not
consume formula, other milk, or more than one
teaspoon of solid or semi-solid food on more than
10% of days during the first 4 mo (i.e. 5/12 d). This
paper focuses on the complementary feeding practices
of subjects who were ‘‘compliant’’ with all three
feeding criteria, with brief reference to whether the
results for the ‘‘non-compliant’’ subjects differed
substantially from those for the compliant subjects.
The final sample used to construct the growth
standards also excluded children whose mothers
smoked and those experiencing morbidity with adverse effects on growth [2].
Definitions of variables and data analysis
Data on feeding practices, including a 24-h dietary
recall, were collected at each of the follow-up visits
[3]. Before conducting the 24-h recall, the interviewer
asked the mother if the child’s diet on the preceding
day was typical. If not (e.g. because of illness or
travelling), then the recall data were collected for the
last day when the diet was typical. The mother was
asked what the child ate or drank in each of seven time
periods during the day (when the child woke up;
morning; lunch; afternoon; dinner; evening; during
the night).
The results presented here come from several
questions in the follow-up questionnaire. Age of
introduction of solid or semi-solid foods was derived
from a question about whether the child had received
certain fluids or foods since the previous visit (which
at this age was an interval of 1 mo). If the answer was
yes for either of the two non-fluid choices (‘‘fruit’’ or
‘‘solid or semi-solid foods’’), the age of the child at the
Complementary feeding
current visit was taken as the age of introduction.
Meal frequency was derived from the 24-h recall. If a
child ate twice within 45 min, it was considered a
single meal. Water, tea, juice or other beverages
consumed on their own were not considered as meals,
nor were small snacks (e.g. a small cookie or a
spoonful of mashed fruit). The total number of meals
included both solid/semi-solid foods and milk-only
meals (including breast milk). Milk-only meals included breastfeeds and feedings of formula, milk or
yogurt.
Data on the types of foods consumed and dietary
diversity were also derived from the 24-h recall. Foods
were grouped into 12 categories based on type and
nutrient content: grain products, legumes/nuts, tubers, milk products, flesh foods (meat, poultry and
fish), eggs, vitamin A-rich fruits and vegetables, other
fruits and vegetables, juices, sweetened beverages,
soups, and fats/oils (in Brazil, 11 categories were
used, without separating vitamin A-rich fruits and
vegetables from other fruits and vegetables). To assess
dietary diversity, an index developed by other investigators [14] was used, based on the following eight
food groups: 1) grain products and tubers,
2) legumes/nuts, 3) milk products, 4) flesh foods,
5) eggs, 6) vitamin-A rich fruits and vegetables,
7) other fruits and vegetables and juices, and 8) fats/
oils. This categorization of foods was chosen so that a
higher total score would be likely to reflect greater
consumption of foods of higher nutrient density, such
as animal-source foods (three categories) and fruits
and vegetables (two categories). The number of food
groups represented in the child’s diet (range 0/8,
except in Brazil where it was 0 /7), regardless of the
amount consumed from each food group, was calculated as a measure of dietary diversity. Thus, for
example, if the 24-h recall showed that six out of the
eight food groups were represented in the diet, then
the dietary diversity for that day was 6.
Use of fortified foods was derived from a question
that followed the 24-h recall: ‘‘Were any of the foods
fortified with any of the following nutrients: a) iron, b)
vitamin A, c) vitamin C, d) vitamin D, e) other
(specify)?’’ The site-specified fortificants in the
"other" category were calcium and zinc (India, Norway, the USA), vitamin E and vitamin B-complex
(Ghana), and folic acid (Oman). Use of salt was
determined by asking: ‘‘Do you add salt to his/her
food?’’ If the mother answered ‘‘yes’’, this was
followed by: ‘‘Please show me the type of salt you
put in your baby’s food. I would like to check if it
contains iodine, which is important for the baby.’’
Use of nutrient supplements was determined by
asking: ‘‘Since the last visit, has your baby received
any vitamins or minerals?’’ If the response was yes,
data were recorded on the brand name of the
supplement, the dose given and the frequency of
29
supplementation (per day, week or month). The
nutrient contents of all supplements used at each
site were recorded in order to determine which
specific nutrients were taken by each child.
Basic summary statistics such as means, standard
deviations, medians, summary ranges and frequency
distributions were used in these analyses.
Results
Table I shows the mean and median age of introduction of solid or semi-solid foods for the compliant
subjects. The overall mean was 5.4 mo, ranging from
4.8 mo in Oman to 5.8 mo in Ghana. For noncompliant subjects (data not shown), the overall mean
was somewhat lower (4.8 mo).
Figure 1 shows the mean number of non-milk meals
between 4 and 24 mo for the compliant subjects at
each site. Values were close to zero at 4 mo, increasing
to an overall average (meals/d) of about 2 at 6 mo, 4 at
9 mo and 4 /5 at 12 /24 mo. During the first year of
life, meal frequency was generally similar across sites,
but in the second year the children in Ghana tended
to eat somewhat more often and the children in Brazil
less often than the children in the other sites. For noncompliant subjects, non-milk meal frequency was
slightly higher at 6 mo ( /3 meals/d) compared to
compliant subjects, but at the older ages the mean
values were similar. Figure 2 shows the mean number
of all meals (including milk-only meals) for the
compliant subjects. The average decreased with age,
from an overall mean of /11 meals/d at 6 /12 mo to
/9 at 18 mo and /7 at 24 mo. Because of
differences in breastfeeding frequency across sites
[13], total meal frequency at 4 /12 mo tended to be
higher in Ghana and Oman and lower in Norway than
in the other sites. After 12 mo, total meal frequency
remained high in Oman, was lowest in Norway and
dropped steadily throughout the second year in
Table I. Mean and median age (in months) of the introduction of
solid or semi-solid foods for compliant children.
Site
Brazilb
Ghana
India
Norway
Oman
USA
All
n
68
228
173
159
153
121
902
Mean (SD)
5.5
5.8
5.0
5.5
4.8
5.4
5.4
(0.7)
(0.6)
(0.6)
(0.8)
(0.6)
(0.7)
(0.7)
Median (min., max.)a
6.0
6.0
5.0
5.1
5.0
5.1
5.1
(4.0,
(1.4,
(3.0,
(3.0,
(3.2,
(3.9,
(1.4,
7.1)
7.5)
7.0)
7.1)
7.0)
7.2)
7.5)
a
The minimum age of introduction is less than 4 mo in several sites
because the operational definition for compliance with exclusive or
predominant breastfeeding for at least 4 mo allowed for occasional
consumption of solid or semi-solid foods, as long as the number of
days on which this occurred did not exceed 12.
b
Excludes one child with missed visits at ages 6 and 7 mo.
30
WHO Multicentre Growth Reference Study Group
7
6
Frequency
5
4
3
2
1
0
4
5
6
7
Brazil
8
9
Ghana
10
India
11
12
Age (mo)
14
Norway
16
Oman
18
20
USA
22
24
A ll
Figure 1. Mean number of non-milk meals (age 4 to 24 mo) per day for compliant children.
Ghana. For non-compliant subjects (data not shown),
total meal frequency was lower by about 1/2 meals/d
at 6 /18 mo in comparison with the values shown for
compliant subjects.
Subjects’ food consumption patterns were evaluated by categorizing the foods reported in the 24-h
recall into 12 food groups. The percentages of
compliant children fed foods from these food groups
15
14
13
12
11
Frequency
10
9
8
7
6
5
4
3
2
1
0
4
5
6
Brazil
7
8
Ghana
9
10
India
11
Age (mo)
12
Norway
14
16
Oman
18
20
USA
Figure 2. Mean number of all meals (age 4 to 24 mo) per day for compliant children.
22
All
24
Complementary feeding
by the stated ages are reported in Table II. Grain
products were consumed by the vast majority of
subjects at all ages (except in Brazil at 6 mo). There
was wide variability in the percentage of children who
consumed legumes or nuts after 6 mo: B/6% in
Norway, 12 /21% in Oman, 9 /43% in the USA,
36 /47% in Ghana, 39 /60% in Brazil, and 71 /91%
in India. Consumption of tubers was uncommon at 6
mo (except in Oman), but increased thereafter to 33 /
51% overall, with the highest percentages in Ghana,
India and Oman. Consumption of milk products
varied by site at 6 /9 mo (high in Ghana, India and
Oman, lower in Norway and the USA), but at 12 /24
mo /75% of children in all sites consumed milk
products. Flesh foods were rarely consumed at 6 mo
(except in Oman), but intake rose thereafter. In all
sites except India, the percentage of children consuming flesh foods on the day of the recall was /50% at
12 mo, /66% at 18 mo, and /75% at 24 mo; in
India 5/11% of children consumed flesh foods on the
day of the recall. Egg consumption varied by age and
by site, with the overall percentage being 3 /10% at
6 /9 mo and /20 /30% thereafter. Eggs were rarely
consumed in Norway (at all ages) and in the USA at
6 /9 mo, whereas they were consumed by almost half
the children in Oman at 24 mo. Consumption of
vitamin A-rich fruits and vegetables was relatively low
at 6 mo (except in Oman and the USA), but increased
thereafter to 43 /48% overall, with the highest percentages reported for Ghana and the USA. Other
fruits and vegetables were consumed by 35% of
children at 6 mo, with intake rising thereafter to
70 /87% overall. At 6 mo, juice was infrequently
consumed by infants in Ghana, Norway and the USA,
but consumed by 20 /45% of infants in Brazil, India
and Oman; thereafter, juice consumption rose in all
sites, with the highest percentages at 24 mo reported
for Oman and the USA. Sweet beverages were rarely
consumed at 6 /9 mo (except in Brazil), with intake
rising to 15 /34% overall from 12 to 24 mo. Consumption of soup was highly variable across sites: it
was common in Brazil, Oman and Ghana but
uncommon in India, Norway and the USA. Consumption of fats and oils after 6 mo was also highly
variable across sites, being very common in Ghana
and Norway, less common in India and the USA, and
rare in Brazil and Oman.
Food consumption patterns of the non-compliant
subjects (data not shown) did not differ dramatically
from those of compliant subjects with the following
exceptions. Because they were less likely to be
breastfeeding, non-compliant children were more
likely to consume milk products. Compared to
compliant subjects, they tended to have a lower
consumption of vitamin A-rich fruits and vegetables
and fats and oils (at all ages), and a higher consumption of soups at 6 /9 mo.
31
Mean and median dietary diversity are shown in
Table III for compliant subjects. The median number
of food groups consumed, out of a maximum of eight
(seven in Brazil), was two at 6 mo, four at 9 mo, and
five at 12/24 mo. Values for Brazil were lower than for
the other sites because the dietary diversity index
included seven rather than eight food groups. For the
other sites, dietary diversity at 6 mo was lower in
Norway and higher in India and Oman compared to
the overall median; by 18/24 mo dietary diversity was
similar among sites except for Ghana, where it was
higher. Dietary diversity was similar between compliant and non-compliant subjects (data not shown).
Use of fortified foods varied by age and by site. For
simplicity, only data for foods fortified with iron or
vitamin A are shown. Figure 3 shows the percentage
of compliant subjects consuming iron-fortified foods
at each age. The majority of infants consumed such
foods at 6 mo in all sites, ranging from /60% in
Oman to 75 /90% in Ghana and the USA. Thereafter,
the percentage remained very high in the USA and
rose from /60% to /85% in Oman, but declined in
the other sites to /40% in Ghana and /20% in
India and Norway by 24 mo (data were unavailable
for Brazil). Figure 4 shows the percentage of compliant subjects consuming vitamin A-fortified foods.
In Norway and Ghana, the percentage was /80 /
100% at all ages, whereas in Oman it was 50 /60%,
in India it decreased from /65% at 6 mo to /20% at
24 mo, and in the USA it increased from /20% at
6 mo to/90% at 24 mo. Use of iron- or vitamin Afortified foods was generally somewhat lower among
compliant than among non-compliant subjects (data
not shown).
Salt was commonly used in the foods provided to
the children, particularly after 6 /9 mo. The percentage using salt between 6 and 24 mo increased from
71% to 99% in Brazil, 48% to 100% in Ghana, 82%
to 100% in India, 2% to 80% in Norway, 40% to
100% in Oman, and 0% to 36% in the USA. Of those
using salt in food, over 93% used iodized salt, except
in Norway where 8/17% used non-iodized salt at 12 /
24 mo.
Use of nutrient supplements varied greatly by site.
Table IV shows the percentage of children in the
compliant group who received supplements that
contained one or more of the specified nutrients.
The fat-soluble vitamins A, D and E are often
combined in one supplement for infants, and this
combination was commonly used in Norway throughout the age range 6 /24 mo (73 /80% of children).
Vitamins A and D were taken by 30 /35% of children
in Ghana and 12 /40% of children in India. Between
12 and 44% of children in Norway, Ghana and India
also used supplements containing vitamins C, B1, B2
and B6. In Norway folate was taken by 15 /22% of
children, in Ghana niacin was taken by 23 /29% of
32
WHO Multicentre Growth Reference Study Group
Table II. Twenty-four-hour dietary intake (prevalence and median) from selected food subgroups by compliant children at 6 /24 mo.
Sites
Food subgroups
Age
(mo)
Brazil
(n/69)
Ghana
(n /228)
India
(n /173)
Norway
(n/159)
Oman
(n/153)
USA
(n /121)
All
(n /903)
Grains
6
9
12
18
24
24.6
59.4
85.5
95.7
97.1
(1)
(2)
(3)
(4)
(3)
88.6
94.3
97.4
98.7
97.8
(3)
(4)
(4)
(4)
(4)
86.1
97.7
100.0
97.1
99.4
(2)
(3)
(4)
(4)
(4)
79.2
97.5
100.0
98.1
98.7
(1)
(3)
(3)
(4)
(3)
85.6
94.8
97.4
98.7
100.0
(2)
(2)
(3)
(3)
(4)
73.6
93.4
97.5
99.2
97.5
(1)
(2)
(3)
(4)
(4)
79.1
92.8
97.5
98.1
98.6
(2)
(3)
(3)
(4)
(4)
Legumes & nuts
6
9
12
18
24
5.8
39.1
43.5
60.0
56.5
(1)
(1)
(2)
(2)
(1)
20.2
36.4
38.6
45.2
47.4
(2)
(2)
(1)
(1)
(1)
35.3
70.5
87.3
87.9
90.8
(1)
(1)
(1)
(2)
(2)
0.0
1.3
3.8
2.5
5.7
(0)
(1)
(1)
(1)
(1)
10.5
11.8
15.7
17.6
20.9
(1)
(1)
(1)
(1)
(1)
0.8
9.1
33.9
43.0
43.0
(1)
(1)
(1)
(1)
(1)
14.2
29.1
37.7
42.0
44.0
(1)
(1)
(1)
(1)
(1)
Tubers
6
9
12
18
24
5.8
18.8
23.2
38.6
37.7
(1)
(1)
(1)
(1)
(1)
9.2
39.0
49.6
55.7
64.5
(1)
(1)
(1)
(1)
(1)
12.1
38.2
50.9
59.0
59.5
(1)
(1)
(1)
(1)
(1)
10.7
30.2
33.3
44.0
46.5
(1)
(1)
(1)
(1)
(1)
47.7
45.8
45.8
51.0
55.6
(1)
(1)
(1)
(1)
(1)
3.3
11.6
21.5
21.5
22.3
(1)
(1)
(1)
(1)
(1)
15.5
33.2
40.5
47.6
51.2
(1)
(1)
(1)
(1)
(1)
Milk (dairy) products
6
9
12
18
24
20.3
75.4
75.4
91.4
88.4
(1)
(1)
(2)
(4)
(4)
59.2
73.2
76.3
89.9
93.0
(2)
(2)
(2)
(2)
(2)
64.2
82.7
89.6
92.5
96.0
(2)
(2)
(3)
(4)
(4)
13.2
33.3
82.4
95.6
95.6
(1)
(1)
(2)
(4)
(4)
49.7
73.2
83.0
94.1
94.1
(1)
(2)
(2)
(3)
(4)
9.1
43.0
86.0
97.5
97.5
(2)
(2)
(2)
(4)
(3)
40.8
64.1
82.3
93.3
94.5
(2)
(2)
(2)
(3)
(3)
Flesh foods
6
9
12
18
24
2.9
10.1
50.7
65.7
81.2
(1)
(1)
(2)
(2)
(1)
11.4
70.6
81.1
91.2
93.9
(1)
(2)
(2)
(2)
(2)
0.0
2.3
6.4
9.2
11.0
(0)
(1)
(1)
(1)
(1)
3.1
42.1
66.7
79.9
80.5
(1)
(1)
(1)
(2)
(2)
26.8
63.4
77.8
84.3
77.8
(1)
(1)
(1)
(1)
(1)
1.7
26.4
59.5
69.4
76.9
(1)
(1)
(1)
(1)
(1)
8.4
40.8
58.5
67.5
69.7
(1)
(1)
(1)
(2)
(2)
Eggs
6
9
12
18
24
2.9
7.2
8.7
27.1
26.1
(1)
(1)
(1)
(1)
(1)
4.4
13.2
27.2
35.5
39.0
(1)
(1)
(1)
(1)
(1)
3.5
8.1
13.9
26.0
33.5
(1)
(1)
(1)
(1)
(1)
0.0
1.9
3.1
5.7
8.8
(0)
(1)
(1)
(1)
(1)
7.8
22.2
31.4
42.5
47.1
(1)
(1)
(1)
(1)
(1)
0.0
5.8
18.2
21.5
19.0
(0)
(1)
(1)
(1)
(1)
3.3
10.3
18.5
27.1
30.3
(1)
(1)
(1)
(1)
(1)
Vitamin A-rich fruits and vegetablesa
6
9
12
18
24
/
/
/
/
/
7.5
46.9
53.9
69.7
73.2
(1)
(1)
(1)
(2)
(2)
15.0
32.4
31.8
38.7
38.7
(1)
(1)
(1)
(1)
(1)
7.5
32.7
29.6
35.8
34.6
(1)
(1)
(1)
(1)
(1)
38.6
56.9
46.4
36.6
37.3
(1)
(1)
(1)
(1)
(1)
34.7
69.4
78.5
79.3
75.2
(1)
(1)
(2)
(2)
(1)
17.3
42.7
43.3
48.1
48.4
(1)
(1)
(1)
(1)
(1)
Other fruits and vegetables
6
9
12
18
24
73.9
71.0
76.8
75.7
72.5
(1)
(1)
(2)
(2)
(2)
11.4
68.9
78.9
94.3
94.7
(1)
(1)
(2)
(2)
(2)
52.6
73.4
85.0
87.9
91.9
(1)
(1)
(2)
(2)
(2)
23.9
67.9
79.9
84.3
78.0
(1)
(1)
(2)
(2)
(2)
39.9
62.1
69.9
81.7
83.7
(1)
(1)
(1)
(1)
(2)
37.2
84.3
89.3
90.9
89.3
(1)
(2)
(2)
(2)
(2)
34.6
70.7
80.0
87.3
86.9
(1)
(1)
(2)
(2)
(2)
Juice
6
9
12
18
24
27.5
49.3
52.2
55.7
40.6
(1)
(1)
(2)
(1)
(1)
9.2
19.3
24.6
29.8
44.7
(1)
(1)
(1)
(1)
(1)
19.7
15.6
20.2
17.3
29.5
(1)
(1)
(1)
(1)
(1)
0.6
5.7
12.6
27.7
39.0
(1)
(1)
(1)
(1)
(1)
45.1
46.4
60.8
56.9
63.4
(1)
(1)
(1)
(1)
(1)
3.3
20.7
43.0
50.4
65.3
(1)
(1)
(1)
(2)
(1)
16.4
23.3
32.3
36.4
46.4
(1)
(1)
(1)
(1)
(1)
Sweet beverages
6
9
12
18
24
23.2
14.5
34.8
48.6
1.4
(1)
(1)
(1.5)
(2)
(3)
1.8
6.1
11.8
17.5
25.4
(1.5)
(1)
(1)
(1)
(1)
1.7
6.4
9.8
16.2
23.1
(1)
(1)
(1)
(1)
(1)
6.3
11.3
24.5
44.0
59.7
(1)
(1)
(1)
(1)
(1)
4.6
5.2
11.8
25.5
35.9
(1)
(1)
(1)
(1)
(1)
0.0
0.0
8.3
33.9
51.2
(0)
(0)
(1)
(1)
(1)
4.4
6.8
15.0
27.9
34.4
(1)
(1)
(1)
(1)
(1)
Soup
6
9
12
18
24
66.7
63.8
47.8
37.1
21.7
(1)
(2)
(2)
(1)
(1)
4.4
26.3
34.2
39.0
34.2
(1)
(1)
(1)
(1)
(1)
12.1
10.4
8.7
5.2
10.4
(1)
(1)
(1)
(1)
(1)
0.0
1.9
2.5
6.9
9.4
(0)
(1)
(1)
(1)
(1)
38.6
42.5
40.5
30.1
26.1
(1)
(1)
(1)
(1)
(1)
0.0
0.8
3.3
5.0
2.5
(0)
(1)
(1)
(1)
(1)
15.1
21.2
21.7
20.7
18.7
(1)
(1)
(1)
(1)
(1)
Complementary feeding
33
Table II (Continued )
Sites
Food subgroups
Fats & oils
a
Age
(mo)
6
9
12
18
24
Brazil
(n /69)
Ghana
(n /228)
0.0
0.0
0.0
0.0
2.9
6.6
59.2
72.8
89.5
94.3
(0)
(0)
(0)
(0)
(1)
India
(n /173)
(1)
(1)
(2)
(2)
(2)
15.6
32.9
45.1
45.1
43.4
Norway
(n /159)
(1)
(1)
(1)
(1)
(1)
2.5
36.5
64.2
81.8
83.6
(1)
(1)
(2)
(2)
(2)
Oman
(n/153)
1.3
3.9
2.0
3.9
4.6
(1)
(2)
(1)
(1)
(1)
USA
(n /121)
All
(n/903)
0.0
0.8
10.7
22.3
19.8
5.3
28.5
40.1
49.2
50.5
(0)
(2)
(1)
(1)
(1)
(1)
(1)
(1)
(2)
(2)
In Brazil, vitamin A-rich fruits and vegetables were not separated from other types of fruits and vegetables.
children, and in India vitamin B12 was taken by 10 /
17% of children. In Brazil, Oman and the USA, use of
vitamin supplements was rare (generally B/10%). Use
of mineral supplements was rare except for iron in
Brazil (7 /19% of children) and iron and zinc in India
(9 /13% of children). Among non-compliant subjects,
use of nutrient supplements was generally similar to
the patterns observed for compliant subjects.
national policy recommended 6 mo. The two highest
mean values for age of introduction of complementary
foods were in two of these three sites (5.8 mo in
Ghana and 5.6 mo in Brazil), though the means in
Norway (5.5 mo) and the USA (5.4 mo) were not
much lower. The lowest mean value was in Oman (4.8
mo), where the policy at the time was to recommend
introduction at 5 mo. It should be noted that these
mean values are biased towards older ages because the
actual age of introduction of solid or semi-solid foods
could have occurred up to a month prior to the date of
the interview.
Solids or semi-solids were fed on average about
twice per day at 6 mo, three times per day at 9 mo,
four times per day at 12 mo and 4 /5 times per day at
14 /24 mo. These means are consistent with the
recommendations in the Guiding Principles , which
state that breastfed infants should be given meals of
complementary foods 2 /3 times per day at 6 /8 mo
and 3 /4 times per day at 9 /11 and 12 /24 mo, with
additional nutritious snacks offered 1 /2 times per day
as desired [6].
There was considerable variability in the types of
food consumed by children in each of the sites, which
Discussion
These results document that the complementary
feeding practices for the subjects included in the
‘‘compliant’’ group for the MGRS were generally
consistent with the recently published Guiding
Principles for Complementary Feeding of the Breastfed
Child [6].
The overall mean age of introduction of solid or
semi-solid foods was 5.4 mo, with relatively little
variability across sites. The MGRS was initiated
before the WHO policy on the optimal duration of
exclusive breastfeeding was changed in 2001 from
‘‘4 /6 months’’ to ‘‘6 months’’ [15,16], although in
three of the six sites (Brazil, Ghana and India)
Table III. Mean and median dietary diversity indexa at selected ages.
Sites
Age (mo)
Brazil
(n / 69)
Ghana
(n/ 228)
India
(n / 173)
Norway
(n / 159)
Oman
(n/ 153)
USA
(n / 121)
All
(n/ 903)
6
Mean (SD)
Median (min., max.)
1.4 (0.8)
1.0 (0,4)
2.2 (1.3)
2.0 (0,7)
2.8 (1.3)
3.0 (0,7)
1.3 (0.9)
1.0 (0,4)
2.9 (1.3)
3.0 (0,7)
1.6 (1.0)
2.0 (0,4)
2.1 (1.3)
2.0 (0,7)
9
Mean (SD)
Median (min., max.)
2.8 (1.0)
3.0 (0,5)
4.7 (1.8)
5.0 (0,8)
4.1 (1.2)
4.0 (0,7)
3.2 (1.5)
3.0 (0,7)
4.1 (1.2)
4.0 (0,7)
3.3 (1.3)
3.0 (0,6)
3.9 (1.5)
4.0 (0,8)
12
Mean (SD)
Median (min., max.)
3.5 (1.3)
4.0 (0,6)
5.3 (1.6)
6.0 (0,8)
4.6 (1.1)
5.0 (2,7)
4.3 (1.2)
4.0 (2,7)
4.4 (1.2)
4.0 (0,7)
4.8 (1.2)
5.0 (0,8)
4.6 (1.4)
5.0 (0,8)
18
Mean (SD)
Median (min., max.)
4.3 (1.1)
4.0 (0,6)
6.2 (1.2)
6.0 (0,8)
4.9 (1.3)
5.0 (0,8)
4.9 (1.1)
5.0 (0,7)
4.7 (1.0)
5.0 (0,7)
5.3 (1.0)
5.0 (3,8)
5.2 (1.3)
5.0 (0,8)
24
Mean (SD)
Median (min., max.)
4.3 (1.2)
4.0 (0,6)
6.3 (1.3)
6.0 (0,8)
5.1 (1.0)
5.0 (2,8)
4.9 (1.2)
5.0 (0,7)
4.8 (1.0)
5.0 (2,8)
5.3 (1.2)
5.0 (0,8)
5.3 (1.3)
5.0 (0,8)
a
Dietary diversity index: the sum (1/yes, 0 /no) of eight food groups (seven food groups for Brazil): 1) grains and tubers; 2) legumes and
nuts; 3) milk products; 4) flesh foods; 5) eggs; 6) vitamin-A rich fruits and vegetables; 7) other fruits and vegetables and juices; 8) fats and
oils.
34
WHO Multicentre Growth Reference Study Group
100
90
80
70
Percent
60
50
40
30
20
10
0
at 6 mo
at 9 mo
at 12 mo
at 18 mo
at 24 mo
Age
Ghana
India
Norway
Oman
USA
All
Figure 3. Percentage of compliant children consuming iron-fortified foods at selected ages.
is not surprising given the cultural differences in food
habits across countries. Nonetheless, there were
certain commonalities that indicate that the diets
were generally of high nutritional quality in all sites.
For example, in the second year of life, /75% of
children in each site consumed milk products and
fruits/vegetables, and 50 /95% consumed meat, poultry or fish (except in India) on the day of the recall.
These dietary characteristics reflect the high socioeconomic status of the subjects included in the
MGRS. Some of the differences across sites may be
due to variability in the complementary feeding
guidelines that parents were given, either from the
MGRS staff or from healthcare providers. For example, advice to avoid potentially allergenic foods such
as eggs and nuts (in families with a history of allergy,
though this caveat is not always added by healthcare
providers) was given in Norway, Oman and the USA,
which may explain the lower percentage of children
with intake from the egg (except Oman) and legumes/
nuts food groups in these sites, at least during the first
year of life. The guidelines in these three sites also
advised limiting the intake of juice, which may
account for the low frequency of juice consumption
at 6 /9 mo in Norway and the USA (though this was
not evident in Oman). In addition, the guidelines in
Norway advised against adding salt to foods for
infants, and the rates of salt usage during the first
year of life were correspondingly low in that site
(though they were also low in the USA, which may
reflect general public concern about excessive salt
intake).
Median dietary diversity on the day of the recall
increased from two food groups at 6 mo to five food
groups (out of a maximum of eight) at 12 /24 mo.
Using the same dietary diversity indicator [14], the
values at 9 /12 mo (generally 4/5 food groups) are
higher than the averages observed for low-income
populations in Peru (3.7 food groups), Ghana (3.4
food groups) and Bangladesh (2.1 food groups). This
indicates that MGRS subjects generally consumed a
varied diet, which on any given day typically included
fruits and/or vegetables and at least one type of
animal-source food, in addition to the usual staple
foods. Dietary diversity is correlated with nutritional
adequacy of the complementary food diet at this age
(r /0.4 /0.7) [14].
Use of fortified foods and nutrient supplements
varied greatly across sites. Most infants received ironfortified foods at 6 mo, but the percentage continuing
to receive such foods through the first and second
years of life was not consistently high. This probably
reflects the lack of uniform policies about the recommended duration of use of such products for infants
and toddlers. Vitamin supplements (which included
vitamin D) were commonly given in Norway, presumably because of recommendations that breastfed
infants in populations at high latitudes receive an
35
Complementary feeding
Table IV. Percentages of compliant children who received supplements at selected ages.
Sites
Age
(mo)
Brazil
(n/ 69)
Ghana
(n / 228)
India
(n/ 173)
Norway
(n / 159)
Oman
(n/ 153)
USA
(n/ 121)
All
(n / 903)
Vitamin A
6
9
12
18
24
8.7
7.2
13.0
2.9
1.4
29.8
35.1
36.4
30.3
33.8
39.3
28.9
24.3
18.5
12.1
78.6
80.5
78.0
74.2
74.8
2.6
11.8
2.6
1.3
0.7
0.0
1.7
2.5
5.0
14.0
30.0
31.3
29.3
25.3
26.1
Vitamin D
6
9
12
18
24
8.7
7.2
13.0
4.3
1.4
29.8
35.1
36.4
32.0
34.2
39.9
30.6
26.0
25.4
16.8
78.6
80.5
80.5
76.7
77.4
2.0
0.7
2.0
0.7
0.7
0.0
1.7
2.5
5.0
14.0
30.0
29.8
30.0
27.5
27.6
Vitamin E
6
9
12
18
24
4.3
1.4
4.3
2.9
0.0
7.0
9.2
7.9
7.0
7.5
25.4
19.1
15.6
8.1
5.2
77.4
78.6
77.4
73.0
76.1
0.0
0.7
0.0
0.0
0.0
0.0
0.0
1.7
3.3
11.6
20.6
20.0
19.2
16.8
17.8
Vitamin C
6
9
12
18
24
2.9
5.8
8.7
5.7
1.4
26.3
31.1
31.1
27.6
25.0
34.1
23.1
19.7
18.5
12.1
20.8
30.2
28.9
29.6
32.7
3.3
1.3
3.3
0.7
2.0
0.0
1.7
2.5
6.6
15.7
17.6
18.5
18.3
17.1
16.9
Vitamin B1
6
9
12
18
24
2.9
5.8
7.2
7.1
0.0
26.3
36.4
33.3
39.9
36.0
43.9
31.8
27.7
22.5
15.6
21.4
30.2
28.9
29.6
32.7
3.3
1.3
3.3
0.7
2.0
0.0
0.0
1.7
2.5
9.9
19.6
21.3
20.2
20.6
19.5
Vitamin B2
6
9
12
18
24
2.9
5.8
7.2
7.1
0.0
25.9
35.5
32.5
38.6
32.9
43.9
31.2
27.2
22.0
16.2
21.4
30.2
28.9
29.6
32.7
3.3
1.3
3.3
0.7
2.0
0.0
0.0
1.7
2.5
10.7
19.5
20.9
19.8
20.1
18.9
Vitamin B6
6
9
12
18
24
2.9
1.4
4.3
4.3
1.4
25.9
36.0
32.9
38.6
36.0
43.9
30.6
26.0
22.5
16.2
20.8
30.2
28.9
29.6
32.7
2.6
1.3
2.6
0.7
2.0
0.0
0.0
1.7
2.5
11.6
19.3
20.6
19.4
20.0
19.9
Vitamin B12
6
9
12
18
24
2.9
5.8
7.2
7.1
0.0
2.6
7.9
9.2
17.1
19.3
12.1
9.8
13.3
16.8
15.0
5.7
8.2
8.8
11.3
14.5
0.0
0.7
0.0
0.0
0.7
0.0
0.0
0.8
3.3
10.7
4.2
5.9
7.1
10.5
11.8
Folate
6
9
12
18
24
2.9
1.4
4.3
2.9
1.4
0.0
0.9
1.3
3.1
3.1
8.7
8.7
6.9
4.0
5.2
15.7
22.0
20.1
19.5
20.1
0.0
0.0
0.0
0.0
0.7
0.0
0.0
0.0
2.5
9.9
4.7
5.9
5.5
5.5
6.9
Niacin
6
9
12
18
24
2.9
5.8
7.2
7.1
1.4
22.8
29.4
28.1
28.5
25.9
0.0
0.0
0.0
0.0
0.0
6.3
8.2
8.8
11.3
14.5
3.3
1.3
3.3
0.7
2.0
0.0
0.0
1.7
2.5
10.7
7.6
9.5
10.0
10.2
11.0
Iron
6
9
12
18
24
7.2
17.4
18.8
10.0
8.7
1.8
4.4
3.9
6.1
7.5
13.9
9.2
13.3
9.8
8.7
0.6
0.0
0.0
1.3
0.6
0.7
0.7
1.3
1.3
0.7
0.0
0.8
4.1
2.5
9.9
3.9
4.4
5.8
5.0
5.8
Supplement
36
WHO Multicentre Growth Reference Study Group
Table IV (Continued )
Sites
Age
(mo)
Brazil
(n / 69)
Ghana
(n / 228)
India
(n/ 173)
Norway
(n / 159)
Oman
(n/ 153)
USA
(n / 121)
All
(n/ 903)
Zinc
6
9
12
18
24
2.9
1.4
4.3
2.9
0.0
0.4
0.9
1.8
4.8
5.3
12.1
12.1
11.0
10.4
8.7
0.6
0.0
0.0
1.3
1.3
0.0
0.0
0.0
0.0
0.7
0.0
0.0
0.0
2.5
7.4
2.8
2.7
2.9
4.0
4.3
Iodine
6
9
12
18
24
0.0
0.0
1.4
0.0
0.0
0.0
0.0
0.0
0.0
0.0
1.2
0.6
0.6
1.7
0.0
0.6
0.0
0.0
1.3
1.3
0.0
0.0
0.0
0.0
0.0
0.0
0.0
0.0
2.5
6.6
0.3
0.1
0.2
0.9
1.1
Calcium
6
9
12
18
24
2.9
1.4
4.3
5.7
0.0
0.4
0.9
0.4
0.4
1.8
2.9
2.9
2.9
6.9
5.2
0.6
0.6
0.6
0.6
1.3
0.0
0.0
0.0
0.0
0.7
0.0
0.0
0.8
2.5
6.6
1.0
1.0
1.2
2.3
2.7
Supplement
external source of vitamin D. Vitamin supplements
were given to up to 40% of children in Ghana and
India but were rarely used in Brazil, Oman and the
USA. Mineral supplements were not commonly used
in any of the sites.
In general, except for practices that were related to
the reasons for non-compliance */introduction of
solid or semi-solid foods at an earlier age, fewer
‘‘milk-only’’ meals because of a lower frequency of
breastfeeding, and greater consumption of milk products other than breast milk*/there were few substantive differences in complementary feeding
practices between the compliant and non-compliant
subjects of the MGRS. This indicates that the
compliant group was not an ‘‘atypical’’ subset of the
overall MGRS sample with respect to most complementary feeding practices among the relatively economically well-off groups that we studied.
100
90
80
70
Percent
60
50
40
30
20
10
0
at 6 mo
at 9 mo
Ghana
India
at 12 mo
Age
Norway
at 18 mo
Oman
USA
Figure 4. Percentage of compliant children consuming vitamin A-fortified foods at selected ages.
at 24 mo
All
Complementary feeding
To summarize, these results indicate that the
complementary food diets of children in the MGRS
were generally of high quality. Global recommendations for complementary feeding stress the need for
frequent intake of animal-source foods as well as fruits
and vegetables [6]. After the initial period of /6 /9
mo, when new foods were still being introduced, the
majority of children consumed animal-source foods
and fruits and vegetables on the day of each dietary
recall in all of the MGRS sites. Dietary diversity was
relatively high and meal frequency was in accord with
global guidelines. The majority of children received
iron-fortified complementary foods during the first
year of life, and many continued to receive them
during the second year of life. Thus, the risk of
nutritional deficiencies was low. We conclude that the
complementary food patterns of MGRS subjects were
adequate to support physiological growth.
Acknowledgements
This paper was prepared by Kathryn G. Dewey,
Adelheid W. Onyango, Cutberto Garza, Mercedes
de Onis, Deena Alasfoor, Elaine Albernaz, Nita
Bhandari, Gunn-Elin A. Bjoerneboe and Anna Lartey
on behalf of the WHO Multicentre Growth Reference
Study Group. The statistical analysis was conducted
by Amani Siyam and Alain Pinol.
References
[1] de Onis M, Garza C, Victora CG, Bhan MK, Norum KR,
editors. WHO Multicentre Growth Reference Study (MGRS):
Rationale, planning and implementation. Food Nutr Bull
2004;25 Suppl 1:S1 /89.
[2] WHO Multicentre Growth Reference Study Group. WHO
Child Growth Standards based on length/height, weight and
age. Acta Paediatr Suppl 2006;450:76 /85.
[3] de Onis M, Garza C, Victora CG, Onyango AW, Frongillo EA,
Martines J, for the WHO Multicentre Growth Reference
Study Group. The WHO Multicentre Growth Reference
Study: Planning, study design, and methodology. Food Nutr
Bull 2004;25 Suppl 1:S15 /26.
[4] WHO/UNICEF. Complementary feeding of young children in
developing countries: a review of current scientific knowledge.
WHO/NUT/98.1. Geneva: World Health Organization; 1998.
37
[5] Dewey KG, Brown KH. Update on technical issues concerning complementary feeding of young children in developing
countries and implications for intervention programs. Food
Nutr Bull 2003;24:5 /28.
[6] Pan American Health Organization/World Health Organization. Guiding principles for complementary feeding of the
breastfed child. Washington, DC: Pan American Health
Organization; 2003.
[7] Araujo CL, Albernaz E, Tomasi E, Victora CG, for the WHO
Multicentre Growth Reference Study Group. Implementation
of the WHO Multicentre Growth Reference Study in Brazil.
Food Nutr Bull 2004;25 Suppl 1:S53 /9.
[8] Lartey A, Owusu WB, Sagoe-Moses I, Gomez V, Sagoe-Moses
C, for the WHO Multicentre Growth Reference Study Group.
Implementation of the WHO Multicentre Growth Reference
Study in Ghana. Food Nutr Bull 2004;25 Suppl 1:S60 /5.
[9] Bhandari N, Taneja S, Rongsen T, Chetia J, Sharma P, Bahl R,
et al., for the WHO Multicentre Growth Reference Study
Group. Implementation of the WHO Multicentre Growth
Reference Study in India. Food Nutr Bull 2004;25 Suppl
1:S66 /71.
[10] Baerug A, Bjoerneboe GE, Tufte E, Norum KR, for the WHO
Multicentre Growth Reference Study Group. Implementation
of the WHO Multicentre Growth Reference Study in Norway.
Food Nutr Bull 2004;25 Suppl 1:S72 /7.
[11] Prakash NS, Mabry RM, Mohamed AJ, Alasfoor D, for the
WHO Multicentre Growth Reference Study Group. Implementation of the WHO Multicentre Growth Reference Study
in Oman. Food Nutr Bull 2004;25 Suppl 1:S78 /83.
[12] Dewey KG, Cohen RJ, Nommsen-Rivers LA, Heinig MJ, for
the WHO Multicentre Growth Reference Study Group.
Implementation of the WHO Multicentre Growth Reference
Study in the United States. Food Nutr Bull 2004;25 Suppl
1:S84 /9.
[13] WHO Multicentre Growth Reference Study Group. Breastfeeding in the WHO Multicentre Growth Reference Study.
Acta Paediatr Suppl 2006;450:16 /26.
[14] Dewey KG, Cohen RJ, Arimond M, Ruel MT. Developing
and validating simple indicators of complementary food intake
and nutrient density for breastfed children in developing
countries. Report to the Food and Nutrition Technical
Assistance (FANTA) Project/Academy for Educational Development (AED). Washington DC: FANTA/AED; September
2005.
[15] World Health Assembly. Resolution WHA54.2. Infant and
young child nutrition. Geneva: World Health Organization;
2001.
[16] World Health Organization. The optimal duration of exclusive
breastfeeding. Report of an expert consultation. Geneva:
World Health Organization; 2002.
/
/
Download