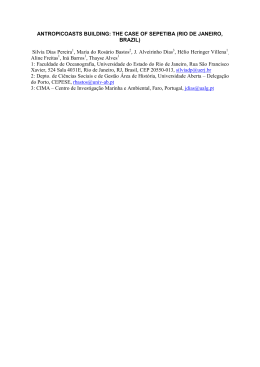
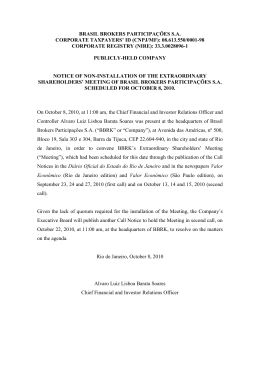
DOI: 10.5327/Z0102-9800201300010003
Ecological risk index for
aquatic pollution control: a
case study of coastal water
bodies from the Rio de Janeiro
State, southeastern Brazil
Cristiane da Silveira Fiori1
Ana Paula de Castro Rodrigues1*
Ricardo Erthal Santelli1
Renato Campello Cordeiro1
Rodrigo Guerra Carvalheira1
Patrícia Correa Araújo2
Zuleica Carmen Castilhos2
Edison Dausacker Bidone1
Department of Geochemistry, Universidade
Federal Fluminense (UFF) – Niteroi (RJ), Brazil.
1
Center for Mineral Technology – (CETEM) –
Rio de Janeiro (RJ), Brazil.
2
*Corresponding author: [email protected]
Abstract
The Potential Ecological Risk Index (PERI) was proposed by Håkanson in 1980 to be used as a diagnostic tool for water pollution. The aim
of this study was to apply the PERI for tropical conditions, proposing
modifications. The metal contamination of 15 areas, including five bays,
from the coastal systems of the Rio de Janeiro State, Brazil, which present different pollution degrees and trophic status, was assessed. For
environment sensitivity assessment through bioproduction estimation,
the ratio of total phosphorus (in mg/g)/organic matter in sediment (in %)
×100 was used, instead of the correlation between total nitrogen and
organic matter as used in the original index calculation. The results for
environment sensitivity were correlated with the concentration of acid
volatile sulfides in sediments and with chlorophyll-a of the water column,
showing a compatible relationship between water trophic status and sediment anoxia. The highest degree of contamination (DC) was found for
the N-NW sector of the Guanabara bay (60.21 – classified as very high),
followed by the Sepetiba bay stations, which showed DC values classified
as moderate. The Ilha Grande bay and Paraty (Mamanguá) showed low
DC values. The station of the Guanabara bay was the only one classified
by the index as of very high ecological risk (PERI=697), followed by three
stations classified as of moderate risk (Mouth of Guanabara bay; Garsas,
Sepetiba bay; and Angra, Ribeira bay). All the other stations present low
risk associated with metal exposure. As mercury is the metal of highest
toxicity factor in the Håkanson formulation, a control test was applied
to observe the relationship between PERI and mercury concentrations
in fish and its bioconcentration factors, which are related to mercury
bioavailability in the system. The results of the modified PERI were fully
satisfactory for ranking areas of contamination.
Keywords: coastal systems, toxic metals, trophic status, sediments, fish.
Resumo
O Índice de Risco Ecológico Potencial (IREP) foi proposto por
Håkanson, em 1980, para ser utilizado como ferramenta de diagnóstico
de poluição da água. O objetivo deste estudo foi aplicar o IREP para
condições tropicais, propondo modificações. Foi avaliada a contaminação por metais em 15 áreas, incluindo cinco baías, da costa do Estado
do Rio de Janeiro, Brasil, que apresentam diferentes graus de poluição
24
Geochimica Brasiliensis 27(1): 24-36, 2013
Fiori C.S. et al.
e trofia. Para avaliar a sensibilidade do meio, a partir da estimativa de
bioprodução, foi usada a razão entre a concentração de fósforo total em
sedimento (em mg/g) e o percentual de matéria orgânica em sedimento
(em %) x 100, ao invés da utilização da correlação entre nitrogênio total
e matéria orgânica, conforme proposto originalmente para o cálculo do
índice. Os resultados de sensibilidade do meio foram correlacionados com
as concentrações de sulfetos voláteis em ácido em sedimentos e com a
clorofila-a medida na coluna d’água, apresentando uma relação compatível
entre o status de trofia da coluna d’água e a anoxia de sedimentos. O maior
grau de contaminação (GC) foi encontrado no setor N-NO da Baía de
Guanabara (60,21 – classificado como muito alto), seguido das estações
localizadas na Baía de Sepetiba, que apresentaram GC classificado como
moderado. A baía da Ilha Grande e Paraty (Mamanguá) apresentaram GCs
baixos. A estação da Baía de Guanabara foi a única classificada pelo índice
como risco ecológico potencial muito alto (IREP=697), seguida de três
estações classificadas como risco moderado (boca da baía de Guanabara;
Enseada das Garsas, na baía de Sepetiba; e Angra, na baía da Ribeira).
Todas as outras estações apresentaram baixo risco associado à exposição por metais. O mercúrio é o metal com maior fator de toxicidade na
formulação de Håkanson; então, um controle foi aplicado para observar
a relação entre o IREP e as concentrações de mercúrio em peixes e seus
fatores de bioconcentração, que são indicativos da biodisponibilidade do
mercúrio no sistema. Os resultados do IREP modificado foram totalmente
satisfatórios para o ranqueamento da contaminação das áreas estudadas.
Palavras-chave: sistema costeiro, metais tóxicos, status de trofia,
sedimentos, peixes.
1. Introduction
For an ecological risk assessment associated with
pollutant exposure in aquatic ecosystems, several environmental factors must be considered, such as chemical, physicochemical, biological, and ecotoxicological
parameters. All these variables must be integrated and
some indexes have been applied to do it. The sediment
quality triad, for example, was proposed originally by
Long & Chapman (1985) for risk assessment in estuarine
and marine ecosystems, based on the relationship among
measures of chemical contamination and ecotoxicity of
sediments and resident infauna community. Abreu (2009)
applied this index for some sectors of the Guanabara bay
(State of Rio de Janeiro, Brazil), showing that the highest
risks to biota were found in northwest and west sectors,
especially at the area of Rio de Janeiro port.
Another index is the Potential Ecological Risk Index
(PERI), proposed by Hakanson (1980), to be used as a
quick and practical tool for environmental assessment,
obtaining as results the pollution classification of areas
and the identification of the toxic substances of interest,
supporting actions for pollution control of limnic aquatic
systems. The PERI provides a fast and simple quantitative
value for the PER of a given contamination situation. The
results have been tested on 15 Swedish lakes representing
a wide range in terms of size, pollution, physicochemical
characteristics (especially, pH), and trophic status. This
model, despite being formulated in 1980s and for limnic systems, has an organized structure based on simple
algorithms, including the most important environmental
parameters for an ecological risk assessment, and also
includes the mathematical relationships between them.
The PERI is based exclusively on chemical parameters of sediments because sediment data show mean
integrated values in time, with higher stability than water
column parameters; sediments are easily sampled at field
work; sediment samples are more representative for time
and space scales and analytical data are easily obtained,
especially because sediments present high concentrations
of contaminants, decreasing the possible errors due to
detection limits of the applied analytical method.
As proposed originally, the PERI considers four
premises:
• the risk index increases with sediment contamination
increase;
• higher the number of pollutants, higher the risk index;
• different substances show different toxicological risk levels;
• waters with different characteristics can show differences on sensitivity for toxic substances.
Geochimica Brasiliensis 27(1): 24-36, 2013
25
Ecological risk index for aquatic pollution control: a case study of coastal water bodies from the Rio de Janeiro State, southeastern Brazil
Considering these premises, the main operational
aspects to PERI estimation are:
• superficial sediments must be sampled in accumulation
areas, that is, low energy areas;
• natural levels for toxic substances must be obtained
using geological references or preindustrial levels determined using sediment cores;
• the metals included in the model are mercury (Hg),
cadmium (Cd), lead (Pb), cupper (Cu), zinc (Zn), and
chromium (Cr). Polychlorinated biphenyls and arsenic
(As) must be included if possible.
Previously, authors tested the PERI application in aquatic ecosystems of the Rio de Janeiro State, but no adaptation
was suggested or calibration was conducted. Campos (2000)
observed that the eutrophication of the Guanabara bay was
able to reduce the PERI for metals, despite the high concentrations found in superficial sediments. Additionally, the
highest risks were found for mercury and cadmium. Further,
the PERI was tested for lagoons in the Rio de Janeiro State
by Castilhos et al. (2001) and Fonseca (2002).
This study aimed to investigate the possibility of adaptation of PERI, a good idea as indicator, to an estuarine/
marine ecosystem with high dynamics, including superficial sediment resuspension, at tropical climate, testing the
sensitivity of the index to classify five bays with different
contamination degrees and trophic state of water column.
This way, a simple index that uses a small number of variables could be used as tool for environmental management
of degraded areas.
2. Materials and Methods
2.1 Study areas
The study was made at five bays from the coastal
system of the Rio de Janeiro State (Brazil), with different
degradation degrees (Figure 1): Guanabara bay – largely
polluted; Sepetiba bay – has some contaminated areas;
Ribeira bay – at initial state of degradation with punctual anthropogenic alterations; Ilha Grande bay – with
intense tourism activity, however with well-preserved
areas; and Paraty – more specifically, Mamanguá
small cove, which preserves the properties of natural
ecosystems.
The Guanabara bay (22°24’ to 23°57’S; 42°33’ to
43°19’E) is one of the largest bays of Brazil. The poor
water quality of its affluent rivers (around 55), which
drain the metropolitan region of the Rio de Janeiro city,
is associated with the multiple anthropogenic activities
that are developed at this drainage area (4,198 km²).
More than 10 million habitants and around 12,000
industries are located at this drainage area, being distributed in 15 municipalities.
The most common environmental problems at the
Guanabara bay are caused by unplanned occupation, intensive and inadequate use of natural resources, and/or
inexistent or precarious treatment of sewage. The main
causes for fluvial water quality degradation are deforestation, siltation, industrial effluents and domestic
wastes without treatment, and solid residues. Sewage
without treatment is responsible for more than 80%
of pollutant discharge (approximately 460 tons of biochemical oxygen demand – BOD – per day), including
micronutrients, toxic metals, and organic compounds
(Bidone & Lacerda, 2004).
The Sepetiba bay (22°53’ to 23°05’S; 43°35’ to
44°03’W) is a complex of estuarine system of high
social, economical, and environmental importance.
26
Geochimica Brasiliensis 27(1): 24-36, 2013
It has a watershed of 2,711 km 2, with circa 1.7 million
of habitants. One of the biggest port and industrial
complexes of Brazil are located at its drainage area,
and this complex continues arising at the present days.
It receives high discharges of domestic wastes without
treatment and of toxic metals from industrial activities
(Molisani et al. 2004).
The Ribeira bay (22°55’ to 23°02’ S; 44°18’ to
44°26’W) has 120 km2 of superficial area. This bay is
still well preserved; however the littoral occupation
process during the last decade increased considerably,
and actually there are punctual impacts caused by yards,
marinas, and urban centers. The main activities are
tourism, naval industry, and nuclear energy generation
(two nuclear centrals, which use bay’s waters to cool the
reactors, being a third central built).
The Ilha Grande bay (22°50’ to 23°20’ S; 44°00’ to
44°45’W) has a surface area of 1,120 km2. This bay is of
spectacular beauty and its fauna and flora are rich, being
a singular biodiversity sanctuary. It is located between
the two largest metropolis of Brazil – São Paulo and Rio
de Janeiro. The richness and diversity of species in this
region is still weakly known and has origin on geographic
and hydrographical conditions, allied to connectivity
with coastal systems, organic matter from rivers, and
physicochemical factors (Creed et al. 2007).
The Paraty – Mamanguá small cove (23°10’ to
23°23’ S; 44°30’ to 44°51’ W) – is part of an ecological
reserve area. Mamanguá small cove has a high irregular
coastal line, forming 33 small sand beaches linked by
rocky shores. Only 120 families live in those beaches,
with the same lifestyle of last generations, depending
on the knowledge about forest and sea biodiversity
for living.
Fiori C.S. et al.
Figure 1
Location of the sampling stations at
Guanabara, Sepetiba, Ribeira, and
Ilha Grande bays and Paraty
(Mamanguá small cove), Rio de Janeiro State, southeastern Brazil.
23º28’33.0” S
22º36’26.7” S
Rio de Janeiro
State
44º48’48.3” W
42º54’40.0” W
2.2 Sampling and Analytical Procedures
Superficial sediment was sampled at 15 accumulation
points: two sample stations at the Guanabara bay; two at
the Sepetiba bay; four at the Ribeira bay; five at the Ilha
Grande bay, and two at the Mamanguá small cove. At each
sample station, five samples were obtained using Eckman
dredge, with an approximated area of 0.04 m2. The sample
stations correspond to isolate coves, with profundity from
around 5 to 20 m.
For metal determination (Cd, Zn, Cu, Cr, and Pb),
sediment samples were pretreated according to US
EPA 3051 method, using concentrated nitric acid in a
microwave digester. The metal determination was conducted in inductively coupled plasma-optical emission
spectrometer (ICP-OES), at Laboratory of Analytical
Geochemistry, Geochemistry Department, Fluminense
Federal University, Niterói, Brazil.
Total mercury (HgT) determination was performed
using LUMEX equipment (RA 915+), which is an atomic
absorption coupled to a pyrolysis chamber, without pretreatment, only homogenization. These analyses were performed
at the Laboratory for Environmental Mercury Speciation,
Centre for Mineral Technology, Rio de Janeiro, Brazil.
As and PCB were not considered in this study. The
results are presented as humid weight. Certified materials
were used for equipment calibration.
Organic matter was determined using the method of lost
for ignition, exposing the samples to 450°C during 24 h. The
total organic carbon (TOC) and total nitrogen (TN) were
determined using an automatic CHN elemental analyzer.
Total phosphorous (TP) concentrations were determined
through the absorbency at 880 nm, using calibration curve
of dihydrogen potassium phosphate standard solutions,
with measures in spectrophotometer (FEMTO, 700 PLUS
model). These analyses were performed at Laboratory of
Biogeochemistry, Geochemistry Department, Fluminense
Federal University, Niterói, Brazil.
The procedures for acid volatile sulfide (AVS) analysis
were adapted from the method described by Allen et al.
(1993), and the analyses were performed at Laboratory of
Environmental and Analytical Geochemistry, Geochemistry
Department, Fluminense Federal University, Niterói, Brazil.
Chl-a data were obtained from monitoring reports of the
Environmental Agency of the Rio de Janeiro State (unpublished data). Results are listed in Tables 1 to 4.
Geochimica Brasiliensis 27(1): 24-36, 2013
27
Ecological risk index for aquatic pollution control: a case study of coastal water bodies from the Rio de Janeiro State, southeastern Brazil
2.3 Potential Ecological Risk Index Estimation
PERI calculation as established by Håkanson (1980)
is made using the following components:
(a) Contamination Factor (CF):
CF = C/C0,
where C is mean concentration of metal in sediment and
C0 is background or preindustrial concentrations. For CF
calculation, the background value was obtained from cores
collected by the environmental agency of the Rio de Janeiro
State (INEA – unpublished data). The classifications according to CF results are as follows:
Contamination Factor
Classification
CF<1
Low
1≤CF<3
Moderate
3≤CF<6
Considerable
CF≥6
Very high
The degree of contamination (DC) of one determined
area is the sum of all CFs:
SSF = BPR = ([TP in mg/g]/(TOC in %)×100
DC = ∑ CF
The areas are classified according to DC as follows:
Degree of Contamination
Classification
DC<1
Low
1≤DC<3
Moderate
3≤DC<6
Considerable
DC≥6
Very high
(b) Toxic Response Factor (TRF): This depends on
the sedimentological toxic factor (STF) and on sedimentological sensitivity factor (SSF).
(i) STF includes the toxicity variable, which must reflect
the different toxic effects of each metal at natural aquatic systems. The toxicity values assigned by Håkanson were derived
from three principles: abundance (more rare, more toxic is the
metal); deposition (sink effect, measured using the ratio of metal
concentration in water and metal concentration in sediment);
and sizing principle (standardization and adjustment of abundance numbers, so that numbers may be used subsequently as
STFs and be compared with the CFs). Since these principles, the
following metals were classified in decreasing order of toxicity:
Hg = 40 > Cd = 30 > Cu = Pb = 5 > Cr =2 > Zn =1.
(ii) SSF is related to the trophic status of the system, which
influences the bioavailability of metals. In eutrophic aquatic eco-
28
systems, metals are less bioavailable due to complexation effects
and to biological dilution (Håkanson et al. 2003). In general, the
negative effect of metals tends to increase with the bioproduction
decrease. For SSF estimation, it is proposed to use correlations
between nitrogen content and organic matter content (or loss
on ignition) in bottom sediment samples, describing two characteristics of the regression line: the slope coefficient – BPN (bioproduction number) and the nitrogen content on the regression
line for the organic matter content value of 10%, called BPI
(bioproduction index). The BPN-value could be an adequate
sediment measure of the trophic level, but only when the organic
content is less than 20% (Håkanson, 1984).
In this study, for SSF estimation, the relations among TN,
TP, organic matter (OM), and TOC were tested. TP and TOC
were tested as alternative parameters to TN and OM, respectively. Due to the low number of samples (maximum five) that has
been collected in each area, instead of regression curve construction for BPN or BPI calculation, the ratio among mean values of
tested parameters for each area was used. Then, the previously
described BPI and BPN were substituted by bioproduction ratio
(BPR). The best responses were found using the ration among
phosphorous and TOC, so BPR was calculated as follows:
Geochimica Brasiliensis 27(1): 24-36, 2013
(iii) The TRF is calculated for each metal as follows:
Hg = 40×5/BPR; Cd = 30×51/2/BPR1/2; Pb = 5×51/2/BPR1/2;
Cu = 5×51/2/BPR1/2; Cr = 2×51/2/BPR1/2; Zn = 1×51/2/BPR1/2.
(c) PER: PER = TRF × CF, which is calculated separately
for each metal. The classification according to PER results
is as follows:
Potential Ecological Risk
Classification
PER<40
Low
40≤PER<80
Moderate
80≤PER<160
Considerable
160≤PER<320
High
PER≥320
Very high
(d) PERI is the sum of all PER calculated for each metal
inside one area: PERI = ∑ PER.
Potential Ecological Risk Index
Classification
PERI<150
Low
150≤PERI<300
Moderate
300≤PERI<600
Considerable
PERI≥600
Very high
Fiori C.S. et al.
2.4 Correlations
In anoxic sediments, degradation reactions mediated by
microorganisms are less efficient and, consequently, the organic
matter is not degraded so fast or as extensively as it occurs in
toxic sediments (Canfield 1988). This process is more intense
if the water column is also anoxic. In this way, the BPR results
were calibrated using chlorophyll-a (Chl-a) concentrations
in water and AVS in sediment samples. The Chl-a is a well-
known indicator of trophic status of a water body, and AVS
is an important indicator for anoxia that could be related to
organic content and potential redox in sediments. When there
is an increase of Chl-a and AVS values, metal bioavailability
in water and sediments decreases. High concentrations of AVS
allow metal retention in sediment at sulfite forms, being no
longer bioavailable (Machado et al. 2004).
3. Results and Discussion
3.1 The contamination factor and the degree of contamination
Mean values from superficial sediment from investigated areas for Hg, Cd, Pb, Cu, Cr, and Zn are given in Table 1
as well as the background values, the calculated CF and
DC, and the ranking in descending order according to DC.
DC values characterize a decreasing gradient of pollution
from north to south of the Rio de Janeiro State’s littoral, reflect-
Table 1
Mean values from superficial sediment, contamination factors, degree
of sediment contamination, and the
degree of contamination ranking
(descending order).
Bay
Area
Guanabara
N-NW
sector
ing the changes in soil occupation and the intensity of economic
activities. The N-NW sector is the most contaminated of the
Guanabara bay, and it shows the highest DC value of all studied
areas (60.21 – classified as very high), followed by the Sepetiba
bay stations, which show DC values classified as moderate. The
Ilha Grande bay and Paraty (Mamanguá) show low DC values.
Hg
Cd
Pb
Cu
Cr
Zn
4.10
21.80
60.00
Co
0.05
0.60 10.50
Ci
1.06
0.82 58.00 59.90 270.00 308.00
CFi 21.20
vh
Mouth/entry Ci 0.05
CFi 1.00
m
Sepetiba
Garças
Ci 0.12
CFi 2.43
m
Engenho
Ci 0.20
CFi 3.95
c
Ribeira
Jacuacanga Ci 0.06
CFi 1.25
m
Angra
Ci 0.07
CFi 1.46
m
Ariró
Ci 0.07
CFi 1.34
m
Bracuí
Ci 0.06
CFi 1.19
m
Ilha Grande
Palmas
Ci 0.05
CFi 1.02
m
Céu
Ci 0.05
CFi 1.01
m
1.36
m
1.00
1.67
m
1.37
2.28
m
2.41
4.02
c
0.61
1.02
m
0.79
1.32
m
0.64
1.07
m
0.78
1.30
m
0.21
0.35
l
0.29
0.48
l
5.52
c
20.00
1.90
m
34.90
3.32
c
87.71
8.35
vh
16.75
1.60
m
15.21
1.45
m
11.43
1.09
m
17.65
1.68
m
7.10
0.68
l
14.80
1.41
m
14.61
vh
2.00
0.49
l
13.79
3.36
c
21.32
5.20
c
12.50
3.05
c
9.17
2.24
m
3.83
0.93
l
7.82
1.91
m
4.23
1.03
m
4.15
1.01
m
12.39
vh
10.00
0.46
l
24.80
1.14
m
47.00
2.16
m
22.00
1.01
m
27.00
1.24
m
33.00
1.51
m
32.00
1.47
m
28.00
1.28
m
24.00
1.10
m
5.13
c
30.00
0.50
l
349.00
5.82
c
732.00
12.20
vh
102.00
1.70
m
120.00
2.00
m
109.00
1.82
m
114.00
1.90
m
72.00
1.20
m
58.00
0.97
l
DC
DC
ranking
60.21
Vh
1
6.02
l
9
18.36
c
3
35.87
vh
2
9.62
m
5
9.70
m
4
7.76
l
7
9.44
m
6
5.56
l
11
5.98
l
10
Co: Background values for each metal; Ci: Concentration in superfitial sediments for each metal; CFi:
Concentration factors for each metal; N-NW- north-northwest sector of Guanabara Bay; l: low; m:
moderate; c: considerable; vh: very high.
Geochimica Brasiliensis 27(1): 24-36, 2013
29
Ecological risk index for aquatic pollution control: a case study of coastal water bodies from the Rio de Janeiro State, southeastern Brazil
Bay
Area
Hg
Abraão
Paraty
Ci 0.05
CFi 1.10
m
Estrelas
Ci 0.05
CFi 1.00
m
Sítio Forte Ci 0.06
CFi 1.15
m
Mamanguá 1 Ci 0.05
CFi 1.07
m
Mamanguá 2 Ci 0.05
CFi 1.05
m
Cd
Pb
Cu
Cr
Zn
0.35
0.58
l
0.26
0.43
l
0.15
0.25
l
0.09
0.15
l
0.17
0.28
l
13.33
1.27
m
13.40
0.57
l
5.10
0.49
l
11.74
1.12
m
13.79
1.31
m
2.10
0.51
l
2.73
0.67
l
0.42
0.10
l
0.30
0.07
l
1.86
0.45
l
31.00
1.42
m
28.00
1.28
m
13.00
0.60
l
8.30
0.38
l
1.30
0.06
l
83.00
1.38
m
76.00
1.27
m
29.00
0.48
l
57.00
0.95
l
62.00
1.03
m
CF followed the same tendency found for DC, where the
most contaminated areas (Guanabara and Sepetiba bays) were
classified as considerable and very high; the Ribeira bay was
classified as moderate and the Ilha Grande and Paraty as low.
It is important to observe the total Hg results, which showed
CF, at minimum, moderate for all areas. Also, Hg represents
one-third of DC value of N-NW sector at the Guanabara bay.
DC
DC
ranking
6.27
l
8
5.22
l
12
3.06
l
15
3.75
l
14
4.19
l
13
Table 1
Continuation
Besides the possibility of ranking the study areas according to DC, data summarized in the Table 1 allow to
identify CF sequences, that is, which metal presented the
highest enrichment factor in sediments. For example, for
the Guanabara bay, the descending order of enrichment is:
Hg > Cu > Cr > Pb > Zn > Cd.
3.2 The sedimentological sensitivity factor and the bioproduction ratio
For BPR choice, the ratios TN/OM, TN/TOC, TP/OM
and TP/TOC were tested. In order to evaluate which ratio
was capable of a better description of SSF, the following criteria were used: adherence of ratio values to bioproduction
scale proposed for sediments and the relations between the
tested ratios and the trophic status of water and sediment
anoxia. For testing the last criteria, previously the relation
among AVS (indicator of anoxia and proxy of redox potential in sediments) and Chl-a (indicator of trophic status
of water) was evaluated. The AVS and Chl-a data showed
positive correlation (r=0.677, α=0.005), pointing to a comBay
Area
Guanabara
Sepetiba
N-NW sector
Garças
Engenho
Jacuacanga
Angra
Ariró
Bracuí
Palmas
Céu
Abraão
Estrelas
Sítio Forte
Mamanguá 1
Mamanguá 2
Ribeira
Ilha Grande
Paraty
OM
(%)
21.00
22.25
19.89
16.72
18.02
16.63
17.56
14.95
13.73
14.75
14.26
5.85
13.92
14.33
TOC
TP
(%) (mg/g)
5.50
1.60
3.91
1.01
3.78
0.80
2.81
0.55
3.35
0.62
2.79
0.56
2.87
0.66
1.83
0.44
3.39
0.39
3.44
0.47
3.27
0.41
0.31
0.16
2.31
0.44
2.17
0.43
TN
(mg/g)
4.50
6.62
6.41
3.16
4.06
3.18
3.38
2.06
3.51
3.42
3.52
0.38
2.72
2.54
patible relationship between water trophic status and sediment type as determined with AVS content from superficial
sediment data.
Mean values of TN, TP, OM, TOC, AVS and Chl-a from
superficial sediment are shown in Table 2. Using these data,
the ratios TN/OM, TN/TOC, and TP/TOC were calculated.
The original model proposed for PERI utilized TN and OM
for sediment bioproduction determination. These attributes
of sensibility were not efficient to classify areas in this study,
probably because there are differences on material cycling
among temperate and tropical regions.
Chl-a
AVS
(ug/L) (µmol/g)
20.00
75.98
6.59
51.36
4.22
56.41
2.67
14.91
4.14
31.66
3.64
9.93
3.15
11.54
1.62
3.30
1.15
5.74
1.87
5.62
1.29
25.06
0.20
0.16
1.26
0.97
1.26
1.68
OM: organic matter; TOC: total organic carbon; TP: total phosphorous; TN: total nitrogen; Chl-a:
Chlorophyll-a; AVS: acid volatile sulfide; N-NW: north-northwest sector of Guanabara Bay.
30
Geochimica Brasiliensis 27(1): 24-36, 2013
Table 2
Mean values from superficial sediment for
total nitrogen, total phosphorous, total
organic carbon, organic matter, acid volatile sulfide (indicators of bioproduction in
sediments) and Chl-a mean values (indicator of water trophic status).
Fiori C.S. et al.
Table 3
Comparative analysis between
the water trophic status and
the sedimentological bioproduction ratio.
Eutrophic
Hypertrophic
(average annual) (1) <1.0 1.0–3.0
Bioproduction (BPR)
<3.3
(sediment level) (2)
Chl-a/BPR
Guanabara N-NW sector
20.00/7.6
Sepetiba
Garças
6.59/4.6
Engenho
4.22/4.00
Ribeira
Jacuacanga
2.67/3.30
Chl-a
Angra
4.14/3.50
Ariró
3.64/3.40
Bracuí
3.15/3.70
Ilha Grande
Palmas
1.62/3.00
Chl-a/BPR
Céu
1.15/2.90
Chl-a/BPR
Abraão
1.87/3.20
Chl-a/BPR
Estrelas
1.29/2.90
Chl-a/BPR
Sítio Forte
1.20/2.80
Chl-a/BPR
Paraty Mamanguá 1
1.26/3.20
Chl-a/BPR
Mamanguá 2
1.26/3.00
Chl-a/BPR
Mesotrophic
Water trophic level (Chl-a) and sediment bioproduction ration
Oligotrophic
Area
Chlorophyll-a
(ug/L)
Bay
latitudes (Kennish, 1996). TN values of the studied areas are
circa one fold higher than TN at lakes from the original study at
Sweden. BPR values obtained using the equation (TP/OM)×100
were coherent with the original bioproduction scale, in dimension
and classification (Table 3), possibly because phosphorous shows
a conservative behavior, being more stable in marine environment
than nitrogen (Souza & Mayr, 1995).
Ultra-oligotrophic
The nutrient flux on benthonic layer depends on, among
others, temperature, organic matter deposition proportion,
organic matter degradation integrated to mineralization in superficial and subsuperficial layers, denitrification, ion exchanges,
and processes above and below oxicline. This flux tends to be
higher at tropical regions due to high primary productivity and
to higher deposition and consume of organic matter in median
3.0–8.0
<4.5
8.0–30.0
<6.5
>30.0
>6.5
Chl-a
BPR
BPR
Chl-a
Chl-a/BPR
BPR
Chl-a/BPR
Chl-a/BPR
Chl-a/BPR
Chl-a: Chlorophyll-a; BPR: bioproduction ratio.
The BPR and Chl-a of studied areas show positive correlation (r=0.979, α=0.001), demonstrating a compatible relationship between water trophic status and sediment type as
determined with TP and OM contents in superficial sediments.
Another positive correlation was obtained for BPR and AVS
(r=0.660, α=0.005). At contaminated areas, sediments showed a higher BPR than the trophic status of water column indicated by Chl-a, probably reflecting the water renew character.
3.3 The Potential Ecological Risk and the Potential Ecological Risk Index
Table 4 summarizes TRF, SSF, and Potential Ecological
Risk (PER) values and the results for PERI calculation at
the studied areas. Data allow observing that:
• PER of Hg summed to PER of Cd corresponds to
80–90% of PERI at each area;
• PER of Hg corresponds to 50–80% of PERI at each area;
• Lower or higher PERI were obtained according to the
weight of Hg PER for final PERI;
• Higher relative participation of Cd PER was found for
the Sepetiba and Ribeira bays. There is a possibility of
transference of Cd contamination from the Sepetiba
bay to the Ribeira bay, as shown in Paraquetti et al.
(2004). The Sepetiba bay is the second major receptor of
•
•
industrial effluents of the Rio de Janeiro State, receiving
significant amounts of Hg, Cd, Pb, Cu, and Zn.
SSF reduction (i.e., trophic status and bioproduction)
cause an increment in PERI, proportionally. For example, if BPR of the Guanabara bay was three times higher,
such as 2.5, the environment would be classified as
oligotrophic, and the resulting PERI would be approximately three times higher (around 1940 instead of 697);
CF increment generates an equal increase of DC, since
DC = ∑ CF, but PERI increment will depend on which
metal has this higher CF, because STF is a fixed value
and it is specific for each one (Hg = 40 > Cd = 30 >
Cu = Pb = 5 > Cr > Zn =1).
Geochimica Brasiliensis 27(1): 24-36, 2013
31
Ecological risk index for aquatic pollution control: a case study of coastal water bodies from the Rio de Janeiro State, southeastern Brazil
The results showed positive and significant correlations
of PERI with DC (r=0.979; α=0.001), SSF, and BPR (r=768;
α=0.001). Also, DC and SSF are correlated positively (r=0.838;
α=0.001). These correlations, besides expressing the intern links
among these components during PERI calculation, indicate
that at these studied areas the responsible substances for SSF
(OM, TP) and the considered metals have the same source or
interdependent sources — for example, domestic wastes without treatment, deforestation, ports and shipyard installation.
Bay
Area
Guanabara N-NW sector SSF=7.6
TRF
PER
Mouth/entry SSF=2.1
TRF
PER
Sepetiba
Garças
SSF=4.6
TRF
PER
Engenho
SSF=4.0
TRF
PER
Ribeira
Jacuacanga SSF=3.3
TRF
PER
Angra
SSF=3.5
TRF
PER
Ariró
SSF=3.4
TRF
PER
Bracuí
SSF=3.7
TRF
PER
Ilha Grande
Palmas
SSF=3.0
TRF
PER
Céu
SSF=2.9
TRF
PER
Abraão
SSF=3.2
TRF
PER
Estrelas
SSF=2.9
TRF
PER
Sítio Forte SSF=2.8
TRF
PER
Paraty
Mamanguá 1 SSF=3.2
TRF
PER
Mamanguá 2 SSF=3.0
TRF
PER
Hg
Cd
26.3
24.3
558 (vh) 33 (l)
95.2
95 (c)
Pb
The PERI application in estuarine and marine ecosystems
was successful, demonstrating that the environmental variables used in the algorithm proposed by Hakanson (1980),
with few modifications in sedimentological SSF, are the main
integrator parameters for biogeochemical processes in aquatic
ecosystems. Also, the relationship among these variables shows
a logical synthesis of biogeochemical processes that influence
metal behavior in the media (anoxia and/or productivity on
superficial sediments).
Cu
Cr
4.1
4.1
1.6
22 (l) 59 (m) 20 (l)
Zn
PERI
0.8
4 (l) 697 (vh)
46.3
7.7
77 (m) 15 (l)
7.7
4 (l)
3.1
1 (l)
1.5
1 (l) 193 (m)
43.5
31.3
5.2
106 (c) 71 (m) 17 (l)
5.2
18 (l)
2.1
2 (l)
1.0
6 (l) 221 (m)
50.0
33.5
5.6
5.6
197 (h) 135 (c) 47 (m) 29 (l)
2.2
5 (l)
1.1
14 (l) 426 (c)
60.6
76 (m)
36.9
38 (l)
6.2
10 (l)
6.2
19 (l)
2.5
2 (l)
1.2
2 (l)
57.1
84 (c)
35.9
47 (m)
6.0
9 (l)
6.0
13 (l)
2.4
3 (l)
1.2
2 (l) 158 (m)
58.8
79 (m)
36.4
39 (l)
6.1
7 (l)
6.1
6 (l)
2.4
4 (l)
1.2
2 (l)
136 (l)
54.1
34.9
5.8
64 (m) 45 (m) 10 (l)
5.8
11 (l)
2.3
3 (l)
1.2
2 (l)
136 (l)
66.7
68 (m)
38.7
14 (l)
6.5
4 (l)
6.5
7 (l)
2.6
3 (l)
1.3
2 (l)
97 (l)
69.0
70 (m)
39.4
19 (l)
6.6
9 (l)
6.6
7 (l)
2.6
3 (l)
1.3
1 (l)
109 (l)
62.5
69 (m)
37.5
22 (l)
6.3
8 (l)
6.3
3 (l)
2.5
4 (l)
1.3
2 (l)
107 (l)
69.0
69 (m)
39.4
17 (l)
6.6
4 (l)
6.6
4 (l)
2.6
3 (l)
1.3
2 (l)
99 (l)
71.4
82 (c)
40.1
10 (l)
6.7
3 (l)
6.7
1 (l)
2.7
2 (l)
1.3
1 (l)
98 (l)
62.5
67 (m)
37.5
6 (l)
6.3
7 (l)
6.3
0.5 (l)
2.5
1 (l)
1.3
1 (l)
82 (l)
66.7
70 (m)
38.7
11 (l)
6.5
8 (l)
6.5
3 (l)
2.6
1.3
0.2 (l) 1 (l)
147 (l)
94 (l)
SSF: sedimentological sensitivity factor; TRF: toxic response factor; PER: potential ecological risk; PERI:
potential ecological risk index; l: low; m: moderate; c: considerable; h: high; vh: very high.
32
Geochimica Brasiliensis 27(1): 24-36, 2013
Table 4
Results for Potential Ecological
Risk Index.
Fiori C.S. et al.
As a predict model, the PERI is dependent on calibration
with bioindicators in order to evaluate its effectiveness for potential risk to biota, that is, in the case of calibration, the identification, characterization, and quantification of the toxic substance
in organism tissues (exposure biomarkers) should be done. The
central idea of this model is that the contaminant bioavailability is
reduced when there is an increase in sediment anoxia and trophic
state of water column. So, the bioindicator must be related to
both characteristics, that is, both matrixes (sediment and water).
In this study as a control test, the bioavailability of mercury for
one carnivorous fish species in all study areas was investigated.
Mercury was chosen because it represents up to 80% of PERI
values for almost all study areas, being representative of metal
bioavailability and their risks in these areas.
3.4 Control Test
For this evaluation, a carnivorous species was chosen — white
mouth croaker (Micropogonias furnieri) — to represent the top of
aquatic food chain and also because this species is well studied in
four of the five bays in different time scale by several researchers.
A summary of Hg concentrations in white mouth croakers is given
in the Table 5. Hg concentrations were grouped by length in order
to null the possible influences on the results caused by differences
on growth, which is essential for comparisons among areas.
All areas do not show significant differences in the
Hg concentrations in fish muscles. At the Sepetiba bay, Hg
concentrations in specimens <300 mm and between 300
and 400 mm were similar, but they were different from
the concentrations in fishes >400 mm. For the other bays
(Guanabara and Ilha Grande), the accumulation seemed
to be more linear, where all the three length intervals were
different from each other, increasing levels with growth.
Reference
Kehrig, 1992
Kehrig et al. 2002
Baeta, 2004
Rodrigues, 2006
Rodrigues et al. 2009
Ratio of Hg in fish /Hg in
sediment
Kehrig, 1992
Ratio of Hg in fish/Hg in
sediment
Table 5
Summary of total Hg concentrations
(wet weight) in white mouth croaker
(Micropogonias furnieri) from Rio de
Janeiro estuaries, grouped in different
length intervals.
Rodrigues, 2006
Ratio of Hg in fish /Hg in
sediment
Kehrig, 1992
Ratio of Hg in fish /Hg in
sediment
Comparing the means found for Hg in small specimens
of white mouth croaker, it was observed that they have
very close Hg levels. Only when they are 400 mm or larger
than this, the increase in the Hg concentrations is evident
and the difference among areas becomes clear, with higher
Hg levels found for specimens from the Ilha Grande and
Ribeira bays. However, it is important to highlight that only
one specimen of this length was observed at the Ribeira
bay, and then this value only can be used as example. In
this way, Hg concentration in fish muscles from bays with
oligotrophic characteristics (Ribeira and Ilha Grande bays)
is significantly higher than the level found at eutrophic bays
(Guanabara and Sepetiba).
Total Hg in muscles (ng/g) (w.w.)
<300mm
300–400mm
>400mm
Guanabara bay
45.4±21.7 (16) 116.6±45.9 (31) 165.7±46.1 (14)
—
108.9±58.6 (61) 199.5±119.3 (20)
—
—
88±77 (14)
—
—
56.8±13.0 (14)
—
—
30.7±29.9(16)
0.04
0.09
Sepetiba bay
36.0±7.7 (4)
59.2±27.3 (28)
0.22
0.37
Ribeira bay
65.2±45.8 (32)
81.9±52.9 (2)
1.0
1.26
Ilha Grande bay
45.5±22.7 (10) 90.9±39.8 (29)
0.91
1.82
0.17
146.1±68.2 (30)
0.91
536.1 (1)
8.24
224.6±97.3 (18)
4.49
Considering a scenario where 100% of Hg in sediment
would be released to water and consequently bioavailable to
benthonic fish, such as white mouth croaker (M. furnieri),
and that this fish could absorb and accumulate this mercury
form, the bioconcentration factor (BCF) could be used as
a proxy of bioavailability. In Table 5, the ratios of mercury
in fish muscles by mercury in sediments are listed for each
area. For the ratio calculation, the mean values found for
both parameters were used.
Observing the BCFs, the ratios increased for all length
intervals in direction of oligotrophic areas. The ratios
demonstrated that there is a higher bioavailability of Hg at
oligotrophic areas such as Ilha Grande and Ribeira bays,
Geochimica Brasiliensis 27(1): 24-36, 2013
33
Ecological risk index for aquatic pollution control: a case study of coastal water bodies from the Rio de Janeiro State, southeastern Brazil
being in agreement with the index premises. One could
suggest that mercury in these areas is rapidly absorbed and
accumulated by biota, reaching easily to carnivorous species
like white mouth croakers. Hg concentrations in these fishes
from these areas may be not even higher, because new/recent
Hg input is low and Hg concentration in sediment is also
low (<50 ng/g).
Additionally, the differences in BCFs obtained for
<300 mm and >400 mm specimens are clear. For the Guanabara, Sepetiba, and Ilha Grande bays, the BCFs of >400 mm
specimens are four times higher than BCFs of 300 mm specimens (4.25; 4.14; 4.93, respectively). Only at the Ribeira
bay, this difference was even higher (8.24).
Those results for BCFs demonstrated that Hg bioaccumulation occurs in different ways at the four studied areas.
Previously, Rodrigues et al. (2010) demonstrated that bioaccumulation in the Ribeira bay was faster than in the Guanabara bay, using accumulation curves according to fish length,
for the other two fish species — a catfish, Genidens genidens,
and a grunt, Haemulon steindachneri. These species also
showed higher BCFs ratios at the Ribeira bay (oligotrophic
system) than at the Guanabara bay (eutrophic system).
Some biological and geochemical factors could be
influencing the accumulation in the Ribeira bay, such as
differences either in growth or in maturation, new Hg
inputs linked to the increase of anthropogenic activities,
and others. Comparing with PERI results, the concentration factors (CFs) of Hg in the Ribeira bay were classified
as moderate. One could suggest that this oligotrophic
environment with a rising input of Hg and organic matter
from untreated sewage is clearly transforming Hg to methylmercury, which is being transferred to food web faster
than the other studied areas.
The Sepetiba bay, where Hg distribution is given mainly
by fluvial sediment deposition, with posterior sulfide formation, seems to be an intermediate system, in comparison with
the two extremes (Ilha Grande and Guanabara bays). Only
for larger specimens of M. furnieri (>400 mm) a proximity
of fish and sediment concentrations (ratio close to 1) can
be observed. At this environment, methylmercury could be
formed by remobilization and oxidation of Hg associated with
sulfides in sediment (Marins 1998). Comparatively, Hg concentration in sediment from the Sepetiba bay is one fold lower
than sediments from northwest region of the Guanabara bay.
The BCF ratios can be used as proxies/indicators for
Hg bioaccumulation, because the differences in mercury
accumulation at the four studied areas were clearly demonstrated by them, emphasizing the higher accumulation in
oligotrophic areas. It is also important to highlight that
differences among areas were not clear before using those
ratios. The differences were clear only for concentrations
with larger than 400 mm specimens. Using the BCFs, it was
possible to observe these differences even at smaller fish
length intervals. There is a clear positive gradient between
BCF and fish length at all bays. One could suggest that the
Hg absorption increases with fish age at each area and that
this accumulation is higher in oligotrophic bays, comparing
fish with the same weight among bays.
4. Conclusions
The PERI application for tropical areas — established initially for limnic systems at temperate climate conditions — can
be considered as promising according to the results achieved
at this work. Some adaptations in the original proposal were
necessary for sediment sensitivity calculation, using the BPR,
which is the relation among TP and OM. The BPR results
correlated with trophic state and anoxia indicators (chlorophyll-a and AVS, respectively). These results also corroborate
the findings related to metal bioavailability to trophic chain,
exemplified by Hg concentrations in fish muscles in this study
case, where the oligotrophic ecosystem showed higher mercury incorporation by fish than eutrophic areas.
The modifications on PERI calculation were capable of
ranking coastal areas and their potential toxicity to biota.
5. Acknowledgments
This work is part of the Instituto Nacional de Ciência
e Tecnologia — INCT-TMCOcean, Universidade Federal do
Ceará, Fortaleza, State of Ceará, Brazil.
34
Geochimica Brasiliensis 27(1): 24-36, 2013
The original premise proposed for PERI was, in general,
confirmed — more eutrophic ecosystems have lower toxicological risks associated with metal bioavailability. The
index results highlight Hg role and importance in the final
results, defining the Guanabara bay as highly impacted.
It also allows tracing an N-S environmental degradation
gradient, beginning with the most impacted area at the
northwest Guanabara bay until the Mamanguá small cove,
which presents low ecological risk. However, it is necessary
to emphasize that major studies about the index efficiency
and a better calibration of this method in terms of bioavailability and accumulation by biota (including other metals)
are extremely important to understand and to apply this
index as a useful tool in managing coastal water resources.
Fiori C.S. et al.
6. References
Abreu I.M. 2009. Avaliação geoquímica, biológica e ecotoxicológica dos
sedimentos da Baía de Guanabara – RJ. Tese de Doutorado, Departamento de
Geoquímica, Universidade Federal Fluminense, Niterói-RJ, 120 p.
Allen H.E. 1993. Determination of Acid Volatile Sulfides and Selected
Simultaneously Extractable Metals in Sediment. United States Environmental
Protection Agency Report 821/12-91/100.
Baeta A.P. 2004. Mercúrio Total e Metilmercúrio em Diferentes Espécies de Peixes
da Baía de Guanabara. Dissertação de Mestrado, Departamento de Química,
Pontifícia Universidade Católica do Rio de Janeiro, Rio de Janeiro, 133 p.
Bidone E.D. & Lacerda L.D. 2004. The use of DPSIR framework to evaluate
sustainability in coastal areas. Case study: Guanabara Bay Basin, Rio de
Janeiro, Brazil. Regional Environmental Change, 4(1):5-16.
Campos A.N. 2000. Ensaio de adaptação e utilização de um ‘índice de risco
ecológico potencial’ para controle da contaminação por metais pesados em
ambiente costeiro tropical: Baía de Guanabara, RJ – Brasil. Dissertação de
Mestrado, Departamento de Geoquímica, Universidade Federal Fluminense,
Niterói-RJ, 176 p.
Canfield D.E. 1988. Sulfate Reduction and the Diagenesis of Iron in Anoxic Marine
Sediments. Tese de Doutorado, Yale University, Yale, 496 p.
Castilhos Z.C., Gonçalves G.O., Campos A., Bidone E.D. 2001. Potential
Ecological Risk by Hg Contamination in Aquatic Ecosystems of Rio de Janeiro
State, Brazil. In: International Conference on Mercury as a Global Pollutant,
6, Minamata, SP.
Creed J.C., Pires D.O., Figueiredo M.A.O. 2007. Biodiversidade Marinha da
Baía da Ilha Grande. –Brasília – DF, Ministério do Meio Ambiente – MMA.
Biodiversidade 23.
Fonseca M.C. 2002. Avaliação de índice de risco ecológico potencial para a
contaminação por metais pesados, caso das lagunas do leste fluminense.
Dissertação de Mestrado, Departamento de Geoquímica, Universidade Federal
Fluminense, Niterói-RJ, 116 p.
Hakanson L. 1980. An ecological risk index aquatic pollution control. A
sedimentological approach. Water Research, 14:975-1001.
Hakanson L. 1984. On the relationship between lake trophic level and lake
sediments. Water Research, 18(3):303-314.
Hakanson L., Ostapenia A., Parparov A., Hambright K.D., Boulion V.V. 2003.
Management criteria for lake ecosystems applied to case studies of changes
in nutrient loading and climate change. Lakes & Reservoirs: Research and
Management, 8(2):141-155.
Kehrig H.A., Costa M., Moreira I., Malm O. 2002. Total and methylmercury in
a Brazilian estuary, Rio de Janeiro. Marine Pollution Bulletin, 44:1018-1023.
Kehrig H.A. 1992. Estudo comparativo dos níveis de concentração de mercúrio
total de corvinas (Micropogonias furnieri) de quatro estuários brasileiros.
Dissertação de Mestrado, Departamento de Química, Pontifícia Universidade
Católica do Rio de Janeiro Rio de Janeiro – RJ, 121 p.
Kennish M.J. 1996. Practical Handbook of Estuarine and Marine Pollution. Boca
Raton, Florida, CRC Marine Science Series, 544 p.
Long E.R. & Chapman P.M. 1985. A sediment quality triad: measures of sediment
contamination, toxicity and infaunal community composition in Puget Sound.
Marine Pollution Bulletin, 16:405415.
Machado W., Carvalho M.F., Santelli R.E., Maddock J.E.L. 2004. Reactive
sulfides relationship with metals in sediments from an eutrophicated estuary
in Southeast Brazil. Marine Pollution Bulletin, 49:89-92.
Marins R.V., Lacerda L.D., Paraquetti H.M., Paiva E.C., Villas-Boas R.C. 1998.
Geochemistry of mercury in sediments of a sub-tropical coastal lagoon,
Geochimica Brasiliensis 27(1): 24-36, 2013
35
Ecological risk index for aquatic pollution control: a case study of coastal water bodies from the Rio de Janeiro State, southeastern Brazil
Sepetiba Bay, Southeastern Brazil. Bulletin of Environmental Contamination
and Toxicology, 61:57-64.
Molisani M.M., Marins R.V., Machado W., Paraquetti H.H.M., Bidone E.D.,
Lacerda L.D. 2004. Environmental changes in Sepetiba Bay, SE Brazil. Regional
Global Change, 4:17-27.
OECD, Organization for Economic Co-Operation and Development. 2008.
Probability Distribution Diagrams- Vollenweider’s dictum. Disponível em:
http://www.chebucto.ns.ca/ccn/info/Science/SWCS/TPMODELS/OECD/
probability.html. Acessado em 25 Set 2009.
Paraquetti H.H.M., Ayres G.A., Almeida M.D., Molisani M.M., Lacerda L.D.
2004. Mercury distribution, speciation and flux in the Sepetiba Bay tributaries,
SE Brazil. Water Research, 38:1439-1448.
Rodrigues A.P.C. 2006. Avaliação de risco ecológico associado à contaminação
mercurial em dois estuários do estado do Rio de Janeiro: Baía de Guanabara
e Baía da Ribeira. Dissertação de Mestrado, Departamento de Geoquímica,
Universidade Federal Fluminense, Niterói, 96 p.
Rodrigues A.P.C., Bidone E.D., Castilhos Z.C., Araújo P.C., Fernandes P.S.,
Almosny N.R.P., Linde-Arias A.R. 2009. Biacumulação de mercúrio em três
espécies de peixes na Baía de Guanabara, RJ. In: International Symposium
on Environmental Geochemistry, 8, Ouro Preto, S.P.
Rodrigues A.P.C., Carvalheira R.G., Cesar R.G., Bidone E.D., Castilhos Z.C.,
Almosny N.R.P. 2010. Bioacumulação de Mercúrio em Quatro Espécies de
Peixes Tropicais Oriundos de Ecossistemas Estuarinos do Estado do Rio de
Janeiro, Brasil. Anuário do Instituto de Geociências – UFRJ, 33(1):54-62.
Souza M.F.L. & Mayr L.M. 1995. Nitrogen phosphorus and granulometric
characterization in nearshore sediments of Guanabara Bay: tentative
applications of a solid phase diagenetic model. Neritica, 9(1/2):7-18.
36
Geochimica Brasiliensis 27(1): 24-36, 2013
Download