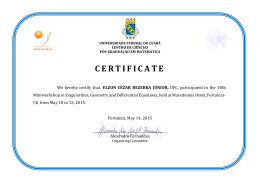
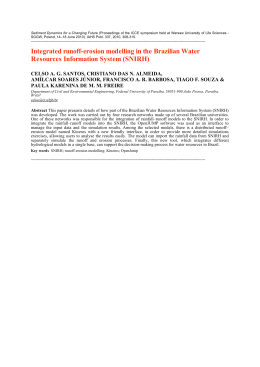
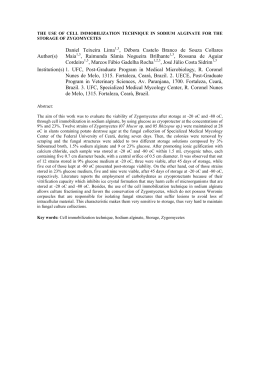
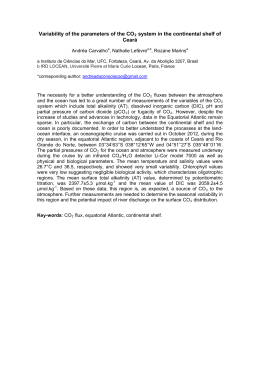
Arquivos de Ciências do Mar CHANGES IN ESTUARINE ISLANDS AND RAINFALL TRENDS IN THE JAGUARIBE RIVER WATERSHED, CEARÁ STATE, BRAZIL Alterações nas ilhas estuarinas e tendências da pluviosidade na bacia hidrográfica do Rio Jaguaribe, Ceará, Brasil Mario Duarte Pinto Godoy1, Luiz Drude de Lacerda2 ABSTRACT The Jaguaribe River drains the largest watershed of Ceará state, in northeastern Brazil, with a catchment of about 75,000 km², over 50% of the total state area. Land use and global climate changes are altering river morphology, difficulting navigation in the estuary and affecting the aquatic biota. Mapping of fluvial islands using images from the Landsat 5 satellite between 1988 and 2010 showed that the existing islands in the estuary suffered great changes during this period. Overall, there was an increase of 24.15 hectares in the islands area, which are presently colonized by mangrove vegetation. The period of largest growth occurred between 1992 and 2003 when there was an increase of 13 hectares with a rate of 2.7 ha.yr-1. The increased rate of sedimentation in the estuary caused by land use drivers are aggravated by the decrease in river flow caused damming and the decrease in rainfall over the basin caused by global climate change. Keywords: mangrove forest, geoprocessing, land use changes, rainfall trends, watershed, Jaguaribe River. RESUMO O Rio Jaguaribe drena a maior bacia hidrográfica do Estado do Ceará, com uma área de cerca de 75.000 km² e cobrindo mais do que 50% do estado. Alterações no uso da terra e mudanças climáticas globais estão causando alterações na morfologia do rio, dificultando a navegação e afetando a biota aquática. O mapeamento das ilhas fluviais usando imagens de satélite Landsat 5 entre os anos de 1988 e 2010 mostraram que as ilhas existentes dentro do estuário sofreram grandes mudanças durante o período de estudo. No geral, houve um crescimento de 24,15 hectares na área das ilhas, essas áreas são prontamente colonizadas pela vegetação de mangue. O período de maior crescimento ocorreu entre os anos de 1992 e 2003 quando houve um aumento total de 13 hectares a uma taxa de 2.7 ha.yr-1. O crescimento da taxa de sedimentação no estuário é causado por alterações no uso do solo e são agravados pela diminuição na vazão do rio causada pela construção de barragens e represas e pela diminuição das chuvas sobre a bacia de drenagem causada pelas alterações climáticas globais. Palavras-chaves: manguezal, geoprocessamento, alterações no uso do solo, pluviosidade, bacia hidrográfica, Rio Jaguaribe. 1 2 Aluno de Doutorado, Instituto de Ciências do Mar, Universidade Federal do Ceará. E-mail: [email protected] Professor Titular, Pesquisador 1-A do CNPq, Instituto de Ciências do Mar, Universidade Federal do Ceará. Arq. Ciên. Mar, Fortaleza, 2013, 46(2): 47 - 54 47 INTRODUCTION The state of Ceará is located in the northeastern region of Brazil and is inserted in a semi-arid climate characterized by two very distinct periods, a rainy season from December to May, that can extend to July in abnormally wet years, and a dry season which happens, typically, from June to November. The Jaguaribe River drains the state’s largest watershed with a total catchment area of about 75,000 km2, it is divided into five sub-basins (high, medium and low Jaguaribe, Banabuiú and Salgado) and occupies over 50% of its surface area. The northeastern of Brazil, where one third of the country’s population lives, is its poorest region, and that is why for over one century many people have migrated to the more affluent southern Brazil. Due to the strong seasonality of rainfall and occurrence of El-Niño-related drought years, northeastern Brazil suffers from water scarcity, which negatively influences regional development and the quality of life of the inhabitants (Döll et al, 2002), probably because of the reduction in annual rainfall to the rate of 8% per decade between 1976 and 1999. The tidal regime is semi-diurnal, with a maximum three-meter range. The watershed has a great diversity of land’s cover and use, being mostly farmland, pastures, urban areas and zones of natural vegetation (Marins et al, 2003). The right margin of the estuarine mouth is dominated by sand dunes and the left margin is dominated by cliffs. The catchment is also responsible for 70% of all freshwater that reaches the Atlantic Ocean on the western portion of the northeastern coast of Brazil. Much of its hydrographic network is composed of intermittent rivers, with water flowing only during the rainy season (Dias et al, 2011). The changes in the expansion of mangroves in Northeast Brazil derive from the interaction of a number of factors, including river damming, water withdraw, decrease of about 10% in the annual rainfall since the 1960’s, and rising sea level (Lacerda et al., 2006). This set of conditions accounted for a greater penetration of seawater into the continent and, consequently, a decrease in the river capacity to export sediments to the adjacent continental shelf. Dias et al. (2011) analyzed the river hydrology and concluded that over the years there has been a significant change in its flow due to construction of several dams. According to this study, the construction of dams has caused river discharge to no longer correspond to rainfall, and rather to be presently controlled by dam operations. Due to the reduced flow, there was the development of several sandbanks in the Jaguaribe River estuary. According to the Ceará State’s Department of Water Resources (SRHCE, 2011), its watershed encompasses 87 largeand medium-sized dams which are intended to provide water for both human consumption and the maintenance of regional economic activities. This change in river flow can be seen by analyzing the data from the National Water Agency (ANA, 2011) for the station located in the town of Tabuleiro do Norte, on the river’s margins and at 100 km from the estuary. Prior to 2003, rainfall and river flow showed the same pattern, but afterwards, with the construction of the dam of Castanhão reservoir there was high river flow only in very rainy years because of the opening of the dam’s gates (Figure 1). Figure 1 – River flow and annual rainfall data from the station in the city of Tabuleiro do Norte, Ceará). (source: ANA, 2011). 48 Arq. Ciên. Mar, Fortaleza, 2013, 46(2): 47 - 54 The river presented, from the 1970’s through the early 1990’s a discharge that followed the intensity of rainfall, with periods of low discharge followed by several peaks that could reach 1,000 m³/s following rainy periods. From the 1990’s onwards, with the construction of major reservoirs, this flow was replaced by one with less variation throughout the year, except for those years with atypical heavy rainfall, as was the case in 2008 and 2009, when the Castanhão reservoir, the largest in the watershed, was forced to open its floodgates to prevent structural damage. In those years, the peak flows may even exceed the ones that existed previously. It was stated in another research that the decrease in the delivery of freshwater due to damming causes the appearance of new areas of sedimentation, promoting the silting of the river in some places. The author also says that this sedimentation process along the estuary of the Jaguaribe river is restricting navigation to only two main access channels to the estuary (Dias et al, 2007). A study by Marins et al. (2003) showed that, even in years with atypical high rainfall, the rising tide causes the increase of particulate matter within the estuary and the decrease of dissolved oxygen. This is an evidence that flooding of sea water causes erosion and resuspension of bottom sediments, along with the erosion of the estuary margin, creating new areas of sedimentation that will eventually be colonized by mangroves. The fast growth of mangroves in sedimentation areas was seen in other estuaries from northeastern Brazil. Lacerda et al. (2004) conducted a study on the expansion of mangroves in the Pacotí River and showed that, in addition to colonizing old salt pits, mangroves also grew on prograded areas of islands and beaches. In the period from 1958 to 1999 the formation of six new islands in that estuary that were quickly occupied and secured by a mangrove forest which increased from 71 ha to 142 ha over that time span and went on expanding so as to reach 144 ha in 2004. METHODS Mapping of the study area The first phase of this work consisted in the mapping of the lower estuary of Jaguaribe River from Aracati city, about 15 km from the sea, to Fortim, at its mouth. To this end, we used the softwares ENVI 4.0 and ArcGIS 9.2 and the satellite images chosen for this study came from Landsat 5 with 30 meters of spatial resolution (INPE, 2011). The images were digitally processed in ENVI and composite images in RGB bands 432 were generated, whose choice was made so that it was easier to differentiate the various environments in the study area. After this process the created images were saved in Geotiff format to be used in the ArcGIS 9.2 program. For the georeferencing of the images, control points were chosen by selecting artificial features recognisable in all of them, such as road crossings and farm borders. This selection was made because these artificial features are more permanent on the landscape than trees, streams and lakes, which can disappear from one image to another. The cartographic projection system used was Universal Transverse Mercator (UTM), referenced to the geodesic horizontal datum World Geodetic System (WGS) - 24 South Zone. The total RMS Error was below 10 m for all of the images. With the images ready the next step was to convert them into vector representations, consisting of polygons. Since the areas of sedimentation can change with the rising tide and the river flow, it was decided that in the case of river islands, their increase in area was evaluated through the addition of green areas, since vegetation should fix the sediment and prevent its dispersion. Image interpretation was done visually and manually, taking into account such factors as texture, hue, shape and location. To eliminate any doubts related to the mapping, field campaigns were undertaken and the area of vegetated islands was classified at this stage. Rainfall trends In order to conduct this study a database with rainfall time series gathered from 384 pluviometric stations of 82 municipalities within the Jaguaribe River watershed was created. They were provided by the website of ANA (2011), and refer to each station found in the county’s city, and eventual gaps in the historical rainfall data were then filled up with the ones from nearby stations. The next step was the calculation of annual rainfall, taken as the sum of all the monthly rainfall data together (rainy season) plus the one for the dry season months of August, September, October, November and December from 1960 to 2008. Using the tendency line, two maps where created in ArcGis for the Jaguaribe River watershed, one using the tendencies of annual rainfall and other using the tendencies for the rainfall in the dry season. Arq. Ciên. Mar, Fortaleza, 2013, 46(2): 47 - 54 49 RESULTS Mapping We identified 10 islands in the estuary of Jaguaribe River between 1988 and 2010, whose surface areas were estimated through the mapping of the various satellite images (Table I). In 1988 there were 6 islands inside the river’s estuary of Jaguaribe river, from this year to 1992 three new islands were added, so that overall there was an increase of 1.56% in mangrove-occupied islands with a growth rate of 0.7 ha.yr-1. From 1992 to 2003 there was the emergence of two new islands and the fusion of two previously existing ones. The total area of the islands increased from 229.92 ha in 1992 to 243.79 ha in 2003 with a growth rate of 2.7 ha.yr-1. From 2003 to 2008, except for two of the islands (one lost 16.67% of its area due to erosion and the other was aggregated by a larger island), all the other islands areas showed an increase. This ranged from 0.6% to 54.6% as related to each individual island, resulting in an overall increase of approximately 2.59 ha with a growth rate of 1.2 ha.yr-1. In the period between 2008 and 2010 three islands showed loss of area and one was aggregated by a larger one. Overall there was a small increase in area of 0.18 ha from 250.1 ha in 2008 to 250.54 ha in 2010. From the beginning of the mapping in 1988 until 2010, there was a total increase of 24.15 ha, or approximately 10% compared to the initial area. The speed of this increase also changed over time, from 1988 to 1992, the growth rate of the islands being 0.7 ha.yr-1, and the rate increased to 2.7 ha.yr-1 between 1992 and 2003; from 2003 to 2008 and from 2008 and 2010 the growth rates were 1.2 ha.yr-1 and 0.22 ha. yr-1, respectively. Overall, the average increase rate between 1988 and 2010 was 1.09 ha.yr-1. A good example to demonstrate this process is the Pinto Island (Figure 2), where there were originally only Islands 1 and 2. In 1992, the appearance of the new two vegetated islands 5 and 6 was registered (Table I). In 2010, these new islands had a much larger area; also there was a heavy growth of vegetation in the southern part of the Pinto Island (Island 1) as it advances through the channel that divides the two main islands (Figure 3). Rainfall trends As it can be seen in Figure 4, out of the 82 surveyed municipalities, 22 of them did not have enough data to create a rainfall time series and, from the remaining sixty, forty-eight in the rainy years and forty-two in the dry season showed a negative trend. Only 10 municipalities, in the rainy years and seventeen in the dry season showed a positive trend in annual rainfall, whereas two municipalities in the rainy years and only one in the dry season showed did not show any trend. Table I - Areas of Jaguaribe’s estuarine islands and the respective changes in the period between 1988 and 2010. 2008 75.45 Change (%) 2.40 75.25 Change (%) -0.86 2.59 152.89 4.86 157.4 2.95 158.79 0.88 0.88 550,0 1.42 61.36 1.85 30.28 1.81 -2.16 1.61 1.85 14.91 1.52 -17.84 1.57 3.29 1.61 2.55 5 X 0.12 100.0 x -100.0 x X x x 6 X 1.11 100.9 5.34 381.08 5.39 0.94 5.63 4.45 7 3.05 3.02 -0.98 3.64 20.53 3.67 0.82 3.79 3.27 8 X x X 0.36 100,0 0.3 -16.67 x -100.0 9 3.32 3.05 -8.13 2.6 -14.75 4.02 54.62 3.66 -8.96 10 X 0.41 100,0 0.57 39.02 x -100.0 x x 226.39 229.92 1.56 243.79 6.03 250.1 2.59 250.54 0.18 1988 1 76.13 2 142.12 145.8 3 0.16 4 Total 50 Change (%) 73.68 -3.22 Island 1992 Arq. Ciên. Mar, Fortaleza, 2013, 46(2): 47 - 54 2003 Change (%) 75.9 0.60 2010 Figure 2 - Mapping of Pinto Island located in the Jaguaribe River estuary (source: author’s collection). Figure 3 - Mangrove spreading on a beach in the southern part of Pinto Island: A – photo taken in October, 2009; B – photo taken in August, 2010 (source: author’s collection). Arq. Ciên. Mar, Fortaleza, 2013, 46(2): 47 - 54 51 Figure 4 - Map of annual rainfall trend (A) and rainfall trend in dry season (B) in the Jaguaribe River watershed in the period 1960-2008 (source: author’s collection) DISCUSSION The islands of Jaguaribe River are currently undergoing a process of increasing size due to the accumulation of sediment in the estuary, since once the sediment is deposited, it undergoes a rapid process of colonization by mangrove vegetation whose role it to promote its fixation. The Jaguaribe River is far from being the only case where mangroves are expanding, and in fact there are several others have been reported to occur in Northeastern Brazil and in several countries. In a survey of mangrove areas between the states of Piauí and Pernambuco using satellite images from 1999 to 2004, Maia et al. (2006) compared the results with maps published by Herz (1991), who used the aerial photos from 1978 and showed an increase in mangrove area from 444 km² to 610 km², about 37% over a period of 25 years. Lara et al. (2002) conducted a study in Bragança, Northern Brazil, which also measured the advancement of mangrove forest over inland vegetation following saline intrusion. According to 52 Arq. Ciên. Mar, Fortaleza, 2013, 46(2): 47 - 54 its results, from 1972 to 1997 there was an increase of 36% in the local mangrove surface area. In the USA, a study conducted in Florida (Ross, 1994) showed the replacement of pine forests by mangroves due to soil salting caused by a 15-cm rise in the sea level over 70 years, and that the original 88-hectare area of pine forests in Sugarloaf Keys in 1991 was reduced to a 30-hecatere area towards its conclusion in 1993. In Australia, a study conducted by Wilton (2002) revealed that in almost every one of the nine sampling locations the expansion of mangroves occurred at the expense of some other kind of vegetation. At the end of the study period, only 42% of the original area of salt marsh remained and the rest was occupied by mangrove forests. In New Zealand, a study conducted at the Firth of Thames by Lovelock et al. (2010) showed an accretion of mangrove forest of 1 km seaward in a period of over 50 years (an average of 20 m per year). There were two major phases of mangrove expansion, one in 19781981 and another in 1991-1995, both of them coincided with periods of sustained El Niño activity. The period of major siltation in the Jaguaribe River estuary took place while the Castanhão dam was being built, but in the same watershed it is also worth mentioning the construction of the 113 kmlong Worker’s Waterway that began in 1993 and was meant for draining water from the Jaguaribe watershed into the Pacajus reservoir and for making do the Irrigated Perimeter of Jaguaribe-Apodi system, in the late 1980’s. The rainfall trend found is this paper is similar to the one by Moncunill (2006), who gathered rainfall data from several stations within the state and discovered a negative trend of 5.3 mm/year (about 6% per decade). The findings of this study are corroborated by data from IPCC (2001), as stated before, to the effect that in Northeastern Brazil there prevailed a showed a negative trend with a reduction of annual rainfall at the rate of 8% per decade between 1976 and 1999. CONCLUSIONS The mapping clearly showed there to be an increase in the area of the islands located within the estuary of the Jaguaribe River, but its rate was at its highest between the years 1992 and 2003, which also correspond to the period when the Jaguaribe watershed has undergone greater changes in land use, including river damming and water diversion. Therefore, it is possible that the major works that have occurred in the watershed made a large amount of sediment to be trapped in the estuary, thus contributing to the increase of its islands. However, a general rainfall negative trend was found to exist in the watershed, so that out of 60 municipalities where it was possible to build up a time series, in 48 of them this trend occurred during the rainy season and in 42 of them during the dry season. The reduction of rainfall could worsen a situation that is already critical due to human action, since the lack of rain will further decrease the sediment export capacity by Jaguaribe River, creating a condition that favors even more sediment accumulation inside the estuarine region. Acknowledgement - This study is part of INCTTMCOcean, Proc. nº 573.601/2008-9. REFERENCES ANA. HidroWeb, Available in : http://hidroweb. ana.gov.br/. Acessed in: 07/09/2011. Dias, F.J.S. Hidrodinâmica das descargas fluviais para o estuário do Rio Jaguaribe (CE). Dissertação de Mestrado, Programa de Pós-Graduação em Ciências Marinhas Tropicais, Universidade Federal do Ceará, Fortaleza, 111 p., Fortaleza, 2007. Dias, F.J.S.; Lacerda, L.D. & Marins, R.V. Comparative analysis of rating curve and estimates of instantaneous water discharge through estuaries in two contrasting Brazilian rivers. Hydrological Processes, p. 2188-2201, 2011. Döll, P. & Hauschild, M. Model-based scenarios of water use in two semi-arid Brazilian states. Regional Enviromental Change, Springer-Verlag, p.150-162, 2002. Herz, R. Manguezais do Brasil. Instituto Oceano gráfico, Universidade de São Paulo, 227 p., São Paulo, 1991. INPE. Catálogo de imagens. Available in: http:// www.dgi.inpe.br/CDSR/. Acessed in: 15/11/2011. IPCC. Third Assessment Report, 2001, Available in: http://www.grida.no/publications/other/ipcc_ tar/?src=/climate/ipcc_tar/wg1/077.htm Lacerda, L.D.; Maia, L.P.; Monteiro, L.H.U.; Souza, G.M.; Bezerra, L.J.C. & Menezes, M.O.T. Manguezais do Nordeste e mudanças ambientais. Ciência Hoje, v.39, p.24-29, 2006. Lacerda, L.D.; Menezes, M.O.T. & Molisani, M.M. Changes in mangrove extension at the Pacoti River estuary, CE, NE Brazil due to regional environmental changes between 1958 and 2004. Biota Neotropica (Ed. Portuguesa). Available in: http://www. biotaneotropica.org.br/v7n3/pt/ abstract?article+bn00807032007, 2007. Lara, R.; Szlafsztein, C.; Cohen, M.; Berger, U.; & Glaser, M. Implications of mangrove dynamics for private land use in Bragança, North Brazil: a case study. J. Coast. Conserv., p.97-102, 2002. Lovelock, C.E.; Sorrell, B.K.; Hancock, N.; Quan Hua & Swales, A. Mangrove forest and soil development on a rapidly accreting shore in New Zealand. Ecosystems, v.13, n.3, p.437-451, 2010. Maia, L.P.; Cavalcante, M.D. & Miranda, P.T.C. Zoneamento ecológico-econômico do Ceará. Secretaria do Meio Ambiente do Estado do Ceará, Fortaleza, 2006. Marins, R.V. & Dias, F.J.S. Alterações na hidrogeoquímica do estuário do Rio Jaguaribe-CE: descarga ou retenção de materiais?, p. 480-482, in Anais do IX Congresso Brasileiro de Geoquímica, Belém, 2003. Arq. Ciên. Mar, Fortaleza, 2013, 46(2): 47 - 54 53 Marins, R.V.; Lacerda, L.D.; Abreu, I.M. & Dias, F.J.D. Efeitos da açudagem no Rio Jaguaribe. Ciência Hoje, v.33, n.197, p.66-70, 2003. Moncunill, D.F. The rainfall trend over Ceará and its implications, p.315-323, in Proceedings of the Internatonal Conference on Southern Hemisphere Meteorology and Oceanography, 8, Foz do Iguaçu, 2006. Ross, M.S.; Obrien, J.J. & Sternberg, L.D.L. Sea-level 54 Arq. Ciên. Mar, Fortaleza, 2013, 46(2): 47 - 54 rise and the reduction in pine forests in the Florida Keys. Ecol. Appl., p.144-156, 1994. SRHCE. Sistema de Informações dos Recursos Hídricos do Ceará, Available in: http://atlas.srh.ce.gov.br/ Acessed in: 20/05/2011. Wilton, K.M. Coastal wetland habitat dynamics in selected new South Wales estuaries. Doctor’s Thesis, Australian Catholic University, Melbourne, 2002.
Baixar