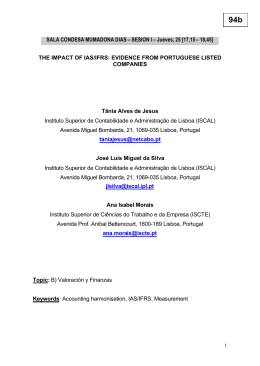
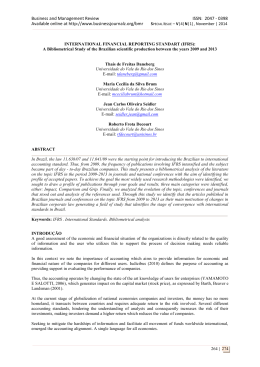
3
A. L.Revista
Martinez;
M. C. R. Dumer
/ Rev. Cont Org
20 (2014)
de Contabilidade
e Organizações
20 (2014)
3-163-16
Revista de
Contabilidade e
Organizações
http://dx.doi.org/
Journal of
Accounting and
Organizations
www.rco.usp.br
www.rco.usp.br
Adoption of IFRS and the Properties of Analysts’ Forecasts: The Brazilian Case
Antonio Lopo Martineza; Miguel Carlos Ramos Dumerb
a
b
Fucape Business School.
Faculdade Afonso Claudio - FAAC/Iseac.
Informações do Artigo
Abstract
Histórico do Artigo
Recebido: 09 Outubro 2012
Aceito: 15 Dezembro 2013
Using data from Thomson Reuters I/B/E/S, we investigated the statistical properties
of analysts’ quarterly earnings projections in the years around the adoption of IFRS
in Brazil (2007 to 2011). Characteristics such as accuracy, bias and precision of
analysts’ forecasts are useful in different situations. The results indicate that the
accuracy improved with increased coverage and for more profitable firms. Univariate
and multivariate tests did not indicate significant changes in the accuracy and bias of
the forecasts in the years around the adoption of IFRS.
Keywords:
Earnings projections
Analysts
Accuracy
Bias
IFRS.
1. INTRODUCTION
An important part of analysts’ work in
the capital market is the projection of future
earnings, because this is a key variable for
stock valuation models. Good projections of
future results are a prerequisite for adequate
measurement of the fair value of a stock.
In this context, it is important to
analyzed the characteristics (or properties)
of these projections by analysts in the capital
market. Are they accurate? Is there some type
of bias? Knowing the accuracy of analysts’
projections provides important support to
guide investors regarding the validity (or
limitations) of these projections for their
valuation models.
For the purpose of identifying the
general characteristics of analysts’ projections
for Brazilian companies, in this article we
seek to document the performance of these
Corresponding author
E-mail : A. L. Martinez ([email protected]); M. C. R. Dummer ([email protected])
Fundação Instituto Capixaba de Pesq. em Contabilidade, Economia e Finanças. Av. Fernando Ferrari, 1358, Boa Vista. 29075505 - Vitória, ES - Brasil
Copyright © 2014 FEA-RP/USP. Todos os direitos reservados
important information intermediaries in two
specific aspects: bias and accuracy.
The study is focused on the quarterly
earnings projections for Brazilian firms
covering the period from the first quarter
of 2007 through the fourth quarter of 2011,
predominantly those with shares listed for
trading in the Novo Mercado (New Market)
segment of the São Paulo Stock, Commodity
and Future Exchange (BM&FBovespa).
The investigation is based on the premise
that the best representation of the market’s
expectations can be obtained from a central
tendency measure of the distribution of
analysts’ projections.
This study innovates by evaluating
the possible benefits of the adoption of IFRS
in Brazil, by investigating the statistical
properties of analysts’ projections in the
years around their adoption. We believed
the question of whether analysts benefited
from the adoption of IFRS, in terms more
accurate and less biased forecasts, is of
interest to market participants because of
the importance of analysts’ projections to
investment decisions.
4
A. L. Martinez; M. C. R. Dumer / Rev. Cont Org 20 (2014) 4-16
Brazil adopted International Financial
Reporting Standards (IFRS) starting in
2008 after the enactment of Lei 11,638 of
December 28, 2007, which amended key
provisions of the Law of Corporations (Law
6,404/76) regarding accounting standards.
According to Antunes et al. (2012), the main
innovation of the process of convergence
to international standards is that Brazilian
accounting practice is now more based on
the interpretations issued by the Accounting
Pronouncements Committee (Comitê de
Pronunciamentos Contábeis - CPC) than on
mere application of legal rules as previously.
This presumably brings relevant implications
for the quality of accounting information and
for those that rely on this information, such
as investors and financial market analysts.
In general lines, the analyses performed
permit concluding that in the period studied
the projections presented by Brazilian analysts
demonstrated a significantly pessimistic bias.
The accuracy of these projections was on
average positively influenced by the number
of analysts covering a firm and negatively
by firm size. Regarding IFRS adoption, the
results do not show significant benefits in the
statistical properties of the forecasts, both
with respect to accuracy and bias.
The article is divided into six sections
besides this introduction. In the next section
we discuss the concepts of accuracy, bias
and precision and in the third we review the
literature on adoption of IFRS and analysts’
projections. We then explain the research
method and the database in the fourth
section and discuss and analyze the results of
univariate and multivariate analyses covering
the years around the adoption of IFRS in
Brazil the fifth section. We close the article
with a set of conclusions and implications for
those that rely on analysts’ forecasts for stock
valuation models.
2. CLARIFICATION OF CONCEPTS:
ACCURACY, BIAS AND
PRECISION
In examining the earnings projections
of analysts, both from an individual and
consensus perspective, various approaches
can be employed. One alternative is to
identify the statistical properties of their
projections. The accuracy, bias and precision
(or reliability) of the projections are examples
of aspects evaluated and tested to observe
whether analysts are doing a good job.
The precision or reliability of a set
of estimations is related inversely to the
variance (or standard deviation): the lower
the variance is, the higher the precision
will be. Bias is an error in the estimations
that makes the average value estimated for
a parameter to be systematically different
from its true value. The level of accuracy is
defined by the combination of or precision
and bias. In simple terms, it can be said that
a set of estimations will be more accurate the
lower the bias and the greater the precision
are. But perfect precision (zero variance) is
not a sufficient condition for accuracy.
Target shooting is an analogy
commonly used to clarify these concepts.
The bullseye is the true value of a population,
which an investigator tries to hit by analyzing
the sample.
An unbiased and precise estimator
is one that identifies values very near the
bullseye, with significant accuracy. A precise,
but biased, estimator is one that predicts
values near each other but far from the correct
value. An unbiased but imprecise estimator
chooses values are far from each other and
that also miss the bullseye, despite being
evenly dispersed around it. Finally, a biased
and imprecise estimator selects values that
are scattered far from each other and miss the
bullseye, but are not evenly spaced around
it, instead showing a tendency for error in a
A. L. Martinez; M. C. R. Dumer / Rev. Cont Org 20 (2014) 5-16
particular direction. Figure 1 illustrates these
concepts.
Figure 1. Illustration of the concepts of bias,
accuracy and precision
3. LITERATURE REVIEW
3.1 Analysts’ projections and adoption of
IFRS
One of the reasons given for many
countries to adopt IFRS was that this
would increase the quality and quantity of
disclosures. This improvement should permit
analysts to have a better understanding
of firms’ performance, leading to better
forecasts. According to Brown (2011),
proponents of IFRS claim they improve the
comparability and transparency of financial
statements.
In the post-2005 European setting,
Hodgdon et al. (2008) concluded that the
observance of IFRS improved the accuracy
of analysts’ forecasts, mainly regarding
5
Swiss and German firms. Byard et al.
(2011), Preiato et al. (2009) and Wang et al.
(2008) all documented an improvement in
the accuracy of projections for firms in the
European Community after the adoption of
IFRS. However, according to Hodgdon et al.
(2008), the improvements in the information
environment related to IFRS in Europe
were greater for companies that voluntarily
adopted IFRS. In the same sense, Horton et
al. (2010) observed that the adoption of IFRS
resulted in smaller prediction errors for firms
that mandatorily adopted IFRS in comparison
to those that did so voluntarily.
However, the existing studies are
not always conclusive. Dake (2005) found
less accuracy and greater dispersion in the
predictions of analysts for German firms that
adopted International Accounting Standards
(IAS) between 1993 and 2002. Cuijpers &
Buijink (2005) reported greater dispersion
in the forecasts for firms in the European
Community using IAS, but stated these
results could reflect a selection bias for firms
that voluntarily adopted the international
standards.
Regarding mandatory adoption,
Aubert & Dumontier (2010) argued that
analysts are not always able to efficiently
anticipate the consequences of IFRS
adoption. It might be that predictions become
harder under IFRS, depending on the extent
of the changes in national GAAP in relation
to IFRS and the resulting impact on earnings
calculations. Finally, Beuselink et al. (2010)
concluded that IFRS adoption improves the
processing of information by analysts in
general, but this effect is not homogeneous
for all analysts.
Despite the fair number of studies for
other countries, to the best of our knowledge
there are no studies of the effects of IFRS
adoption on the statistical properties of
analysts’ forecasts for Brazilian companies.
6
A. L. Martinez; M. C. R. Dumer / Rev. Cont Org 20 (2014) 6-16
3.2 Is there a bias in analysts’ projections?
The international literature over the
past two decades has generally concluded
that analysts tend to be optimists. This
optimistic bias is inferred from the finding
that there is a consistently negative difference
between observed and estimated earnings.
In other words, earnings projections are
predominantly higher than those actually
obtained. This optimism has been verified
by using data from Value Line, I/B/E/S and
Zacks. The estimates of analysts’ optimism
vary from study to study, due to differences in
the methods used, definition of the variables
and the period analyzed, among other factors.
Lim (1998), using the average of
quarterly profit estimates, found optimism
of 0.94% of the price. The bias was
considerably higher, at 2.5%, for small firms,
in comparison with 0.53% for companies
with large capitalization. The author found
this bias to be present in the entire market for
all years studied. Richardson et al. (1999),
using individual analysts’ projections and
projection errors analyzed in yearly and
monthly time frames, found that while
bias existed for both horizons, there was a
significant decline in this bias, from 0.91%
to 0.09% of the price, when the projection
horizon was reduced from a year to a month.
However, Brown (1998) observed that the
bias appeared to have shifted from optimistic
to pessimistic, or at least almost nil.
A possible explanation given in the
literature for bias is the existence of a large
number of extreme observations, causing
asymmetric distribution of the projection
errors. Gu & Wu (2003) and Abarbanell &
Lehavy (2003) observed that a small number
of projection errors disproportionately
contribute to the observed bias.
In the Brazilian case, the tendency
for optimistic bias has also been documented
by Martinez (2004), Saito et al. (2008) and
Dalmácio et al. (2011). Both studies, although
relying on different methods and databases
and trying to resolve distinct problems, noted
the existence of an optimistic bias in analysts’
projections for Brazilian firms. However,
these studies cover periods before 2004.
There are no studies in the Brazilian
literature touching on the statistical behavior
of the prediction errors in recent years,
particularly after the adoption of IFRS in the
country. Our aim here is to fill in this gap in
the national literature.
3.3 What are the determinants of bias in
analysts’ projections?
According to Kothari (2001), the
determining factors for bias in analysts’
projections are of two types: a) economic
incentives; and b) behavioral-cognitive
postures.
a) Economic motivations
An important economic incentive
for “sell-side” analysts to issue optimistic
earnings projections is the compensation
they receive for their services. Investment
banks obtain much of their revenues from
their services related to issuance of securities
and assistance in mergers and acquisitions.
Optimistic projections by analysts can
help stimulate new deals. In this sense, Lin
& McNichols (1998) stated that analysts
who work for institutions affiliated with
investment banks will tend to issue more
upbeat projections.
Another reasonable explanation for
bias is analysts’ concerns over obtaining
as much access as possible to information
from managers, especially in cases of large
information asymmetry between the firm
and investment community. Although they
realize that bias in their projections is not
desirable, they opt to err on the optimistic
side to create a more favorable relationship
with managers and hence gain the inside
track to obtain important information. In this
A. L. Martinez; M. C. R. Dumer / Rev. Cont Org 20 (2014) 7-16
respect, Lim (1998) and Das et al. (1998)
demonstrated that the bias increases as the
information asymmetry (or uncertainty)
increases between the firm and the investment
community.
b) Behavioral-cognitive postures
According
to
the
behavioral
explanations for bias, analysts consistently
overreact to information (especially on past
earnings), which causes them to take a biased
stance. It is naturally assumed that positive
overreactions will outweigh negative ones,
i.e., exaggerated responses to good news
will be greater than to bad news. DeBondt &
Thaler (1985; 1987), in their classic works on
the subject, proposed the existence of such a
cognitive bias mechanism.
Another very coherent explanation
was traced out by Trueman (1994). He
concluded that analysts tend to imitate the
behavior of their peers, seeking to follow the
consensus. He applied elegant mathematical
models to show that analysts tend to make
projections near to previous expectations.
This causes herding behavior among analysts,
in which their projections are similar to those
announced previously by other analysts,
even when the information is different.
This behavior undermines the fundamental
hypothesis for calculating the consensus
projects, namely that the projections are
independent.
4. RESEARCH METHOD
4.1 Database
To analyze the statistical properties
of the earnings projections for Brazilian
companies, we used the data collected by
the Thomson Reuters I/B/E/S system. Since
7
1971, I/B/E/S has been the most important
source of earnings projections for investment
professionals
throughout
the
world.
According to Nobel Laureate William Sharpe
(1998), in a comment in his classic manual
“Investments”: “While I/B/E/S is not the only
company collecting earnings expectations
data...it was the first and remains the leader
in the field... The systematic collection of
earnings estimates is an excellent example
of the forces that have been increasing the
efficiency of security markets. Before I/B/E/S
collected such data, consensus earnings
estimates were difficult to obtain and highly
ambiguous.”
The Thomson Reuters I/B/E/S system
contains projections and recommendations of
analysts throughout the world, including on
Brazilian firms. There are three main sections
in the I/B/E/S database: a) Detail History, b)
Summary History and c) Recommendations.
The Detail History section contains
individual estimates of analysts over time,
while the Summary History section contains
the consensus estimates of all analysts in a
determined period.
Here we study the period from the
first quarter of 2007 to the fourth quarter of
2011. In this part of the study we used all the
Brazilian firms listed for trading in the Novo
Mercado segment of the BM&FBovespa
about which there was information in the
database. We did not carry out any type of
selection. In the above period we analyzed
92 listed Brazilian companies by examining
the quarterly earnings per share (EPS)
projections. This figure is a key variable for
many valuation models. Among the various
metrics available, we verified that in the EPS
projections for the current year contained the
greatest number of observations.
We collected the EPS projections for
each quarter going back one year beforehand,
The Thomson Reuters I/B/E/S system
contains information on forecast earnings
based on the average estimate of analysts
and reports the number of analysts that
participated in each average estimate. The
other data used in this study were obtained
A. L. Martinez; M. C. R. Dumer / Rev. Cont Org 20 (2014) 8-16
8
from the Economática system, including the
observed earnings and the control variables
used.
In computing the projection errors,
we found a large number of disparate values,
indicating possible errors in entering data
in the base. To rectify this problem, we
applied Grubb’s test to detect outliers, as
recommended by Martins (2002: 59). This
led us to exclude 20 observations from the
sample, leaving a total of 1,004 observations.
4.2. Metrics for bias, accuracy and
precision of the projections
To identify the performance of
analysts in their projections, we computed
the bias, accuracy and precision. Bias was
calculated as the difference between the
actual (observed) earnings result and the
average figure projected by analysts. When
this difference is negative, it indicates a
negative surprise, or that the true earnings
fell short of the predicted level. Likewise, a
positive difference means the actual earnings
were higher than the consensus projection.
For purposes of comparability, we
computed the projection errors in terms of
earnings per share (EPS). Therefore, the
forecast error (bias) measure for this study is
the real (observed) EPS for the period minus
the forecast EPS divided by the absolute
value of the real EPS:
Bias =
EPS real − EPS pred
EPS real
Where
EPSreal = Real earnings per share in
the period covered by the forecast
EPSpred = Predicted earnings per
share according to the consensus of analysts
(average)
We used the absolute value (modulus)
in the denominator so as not to lose the
direction of the projection error for firms
with negative earnings.
From a methodological standpoint,
there are various other measures to scale
projection errors. Besides actual earnings
results (observed profit or loss), it is very
common to find articles in the international
literature that have measured forecast errors in
percentage terms of the stock price. However,
we believe that consideration of stock price
can bring distortions by introducing into
the calculation the price factor over which
analysts have no control.
We also did not use total assets (or
stockholders’ equity) as a factor to deflate
the forecast errors. First, we believe that total
assets could be correlated with the forecast
errors in an undesirable way. In working
with figures deflated by total assets, one is in
essence measuring an indicator of return on
assets. Second, some economic sectors have
a higher average ROA than others, so this
factor could compromise the comparability
of the projection errors measured.
We recognize, however, that the
procedure of measuring the forecast error in
terms of the actual result is not immune from
problems. For example, the forecast errors
for firms that obtain profits or losses very
near zero are exaggerated. Additionally, this
required elimination of observations where
the actual earnings figure was zero.
We also measured the accuracy of
the projections in terms of the real earnings
per share, in this case taking the absolute
value of the entire expression rather than
just the numerator (observed earnings minus
predicted earnings):
Accur =
EPS real − EPS pred
EPS real
This formulation allows considering
the distribution of errors that in absolute
terms are near zero, but regardless of whether
9
A. L. Martinez; M. C. R. Dumer / Rev. Cont Org 20 (2014) 9-16
they are positive or negative. Therefore, in
measuring the accuracy, all the errors are
considered, in contrast to the measurement of
bias, where the positive errors cancel negative
errors of the same magnitude. The lower the 5. ANALYSIS OF THE RESULTS
metric is, the greater is the accuracy of the
estimate.
We applied t-statistic tests to check
the null hypothesis that the average of the 5.1 Descriptive statistics
prediction errors (bias) was different from
zero. To attest that the results determined were
According to Table 1, the data from
not compromised by the scale used to deflate
the projection errors, we present the signs of the analysts’ projections indicate a statistical
predominance of positive errors (86.62%)
these errors.
over negative errors (41.22%). Panel A shows
Finally, we estimated the precision as
the mean of the distribution of the analysts’
the inverse of the standard deviation of the
projection errors, with a significantly positive
distribution of the projection errors (bias).
value of 0.40749 (t-statistic = 16.110).
Therefore, the lower the standard deviation,
Likewise, the median is strongly positive at
the more precise the analysts’ estimates are.
0.69621.
Table 1 – Descriptive statistics for the analysts’ EPS projections for the following year, measured between the
1st quarter of 2007 and 4th quarter of 2011
This table shows the descriptive statistics of the frequency distribution of the analysts’ projection errors for earnings
per share (EPS) for the next period, computed based on information from the Thomson Reuters I/B/E/S system in the
period from the 1st quarter of 2007 to the 4th quarter of 2011. Panel A records the mean, median and other statistics for
the positive and negative forecast errors. Panel B shows the percentiles of the error frequency distribution.
Panel A: Statistics of the distribution of the projection errors
All Errors
N (observations)
Percentage (%)
Mean
Median – P 50
Standard Deviation
Skewness
Kurtosis
Minimum
Maximum
Est. t for difference of bias from
zero
1,004
100%
0.40749
0.69621
0.80109
-2.929
10.557
-4.8937
3.3625
t = 16.110
Negative Errors
138
13.88%
-1.3158
-1.1658
0.9825
-1.406
2.245
-4.8937
-0.0032
Positive Errors
865
86.62%
0.6824
0.7173
0.2028
2.359
38.538
0.0137
3.3625
Panel B: Statistics of asymmetry of the tails of the distribution of projecting errors
P5
P 10
P 25
P 75
P 90
P 95
-1.3979
-0.7543
-0.4908
0.7665
0.8373
0.8802
A. L. Martinez; M. C. R. Dumer / Rev. Cont Org 20 (2014) 10-16
10
Panel C: Temporal pattern of the quarterly EPS projection errors for firms that disclose profits
and losses
N- Forecast
Accur Mean
894
110
1.004
0.7522
0.9036
0.7688
Profit
Losses
Total
T Test Mean Differences
Sig (2 tailed)
-3.241
0.001
To understand the distribution of
projection errors better, we analyzed them
in percentile terms (Panel B). This analysis
revealed a particularity of this distribution:
the negative tail is longer than the positive
one. Intuitively this means that the extreme
projection errors (tails) are predominantly
optimistic.
In Panel C, we segmented the
observations into two groups: a first group
containing firms that obtained profits in the
period targeted by the projection and a second
group containing firms that lost money in
that period. The aim of this stratification
was to check if there are any systematic
differences in the accuracy and bias between
the projections for profitable and unprofitable
firms. The differences in accuracy and bias are
significant between the two groups of firms
(as shown by the t-statistics). The results are
revealing, improving the understanding of
the bias and accuracy of analysts of Brazilian
firms.
In general lines the results indicate
that Brazilian analysts do a relatively better
job when a firm reports profits, because they
persistently underestimate negative results.
This apparent optimism likely results from
the reluctance of analysts to report loss
projections.
The graph in Figure 2 allows
visualizing the distribution of the projection
errors, showing from left to right the variation
of negative to positive errors.
Simple observation of the distribution
and its associated statistics can lead to the
opinion that Brazilian analysts were ex
post pessimists in the years around IFRS
adoption. In other words, their projections
were predominantly lower than the earnings
Accur StD
0.4187
0.7253
0.4642
Bias Mean
0.4599
-0.0179
0.4075
Bias StD
0.7286
1.1617
0.8011
6.005
0.000
actually observed.
Figure 2 – Histogram of the analysts’ projection
errors for quarterly EPS between -3.0 and 3.0
Distribution of the errors of the consensus projections
of analysts for EPS, for quarterly observations from
the 1st quarter of 2007 to the 4th quarter of 2011,
computed from information from Thomson Reuters
I/B/E/S. The average projection errors in terms of real
EPS are on the horizontal axis while the percentage
of the observations found in a determined bar are on
the vertical axis.
To complement this study, Figure 3
plots the dispersion diagram between real
and estimated earnings. It can be seen that
the observations with real positive earnings
tend to be above the 45º line from the origin,
meaning the real earnings tend to be greater
than the estimated figures. The projections
associated with real negative earnings, on the
other hand, are visibly more optimistic.
11
A. L. Martinez; M. C. R. Dumer / Rev. Cont Org 20 (2014) 11-16
Table 2 Metrics in the years around IFRS adoption (2007 – 2011)
Panel A: Temporal evolution of the bias, accuracy and dispersion
Bias
Years
Mean
Mean
StandDev
Mean
2007
0.4132
0.7143
0.8229
0.7723
0.8246
0.7374
2008
0.3881
0.6774
0.7758
2009
0.2353
0.6419
0.9170
0.5400
0.7185
0.5814
0.7322
2010
0.4088
0.7013
0.8500
2011
0.8095
Accur
Median
0.7407
0.6963
0.7242
0.7356
0.7355
StandDev
0.4971
0.5329
0.5398
0.3043
0.4794
T-Test Mean Diff.
2007-2011
Sig (2 tailed)
0.0450
-0.6700
0.9640
0.5030
Panel B: Boxplot of the bias and accuracy (2007 to 2011)
Bias Boxplot
Accuracy Boxplot
.
5.3. Multivariate analysis
To enrich the study and reduce the
chance of cross effects, we also performed a
multivariate analysis to test how the accuracy
and bias can be explained by the adoption of
IFRS as well as other explanatory variables
of the forecasts’ properties. We used the
following variables to describe the behavior
of accuracy and bias:
- Years x IFRS: We assigned a
progressive variable to indicate the years.
This choice was based on the assumption of
a learning curve for working with the new
standards (learning by doing). Therefore, we
attributed a value of zero to 2007, the year
before adoption, and then increase the value
by one for each succeeding year, so that the
value of 4 was attributed to 2011, after four
years of experience working with IFRS. This
scheme is depicted below:
Years N
IFRS = Years * IFRS
2007
0
0
= 0
2008
1
1
= 1
2009
2
1
= 2
2010
3
1
= 3
2011
4
1
= 4
- Loss dummy: In view of the specific
behavior noted in the previous analysis
for cases of loss-making firms, we created
a dummy to control for this. Apparently
analysts have markedly different performance
when making forecasts for firms with negative
earnings than for profitable ones. This variable
is 0 for firms that made a profit in the forecast
period and 1 for those that lost money.
- Number of estimates: Considering
A. L. Martinez; M. C. R. Dumer / Rev. Cont Org 20 (2014) 12-16
12
that the number of analysts following a firm
can influence the propagation of information
and the quality of the projection depends on the
information environment, in the multivariate
analysis we controlled for this factor.
- Log_assets: To control for firm size,
we computed the logarithm of total assets in
period t.
5.3.1. Correlation matrix
Table 3 presents the matrix of
correlations between the accuracy and bias
variables and the control variables. This matrix
provides important insight into the correlation
of the variables.
Mention should be made of the
significant Pearson correlations, indicating the
sign of how the variables oscillate. Although
not shown in the table, we also computed the
nonparametric Spearman correlations and the
results were in the same sense.
The variable Years*IFRS is positively
correlated with the number of analysts and firm
size. We did not find significant correlations
between this variable and either accuracy or
bias. As expected, with a reduction of bias, the
accuracy improved. Also, bias is negatively
correlated with the dummy for loss, indicating
that analysts in the period were more likely
to make overly optimistic and less accurate
forecasts for firms that wound up losing
money in the period covered by the earnings
prediction.
Table 3 Matrix of Correlations
Bias
Accur
Num_An.
Years*IFRS
Log_Assets
Dummy-Loss
Corr. Pearson
Bias
Accur
Num_An.
Years*IFRS
Log_Asset
Dummy-Loss
1
-.664**
.121**
0.035
.070*
-.186**
0.000
0.000
0.270
0.028
0.000
1
-0.05
0.031
0.047
.102**
Sig. (2-tailed)
Corr. Pearson
Sig. (2-tailed)
Corr. Pearson
-.664**
0.000
.121**
-0.05
Sig. (2-tailed)
0.000
0.111
Corr. Pearson
0.035
0.031
0.111
0.324
0.138
0.001
1
.247**
.468**
-.113**
.247**
Sig. (2-tailed)
0.270
0.324
0.000
Corr. Pearson
.070*
0.047
.468**
Sig. (2-tailed)
Corr. Pearson
Sig. (2-tailed)
0.000
0.000
0.000
1
.123**
-0.028
.123**
0.000
0.380
1
-.089**
0.028
0.138
0.000
0.000
-.186**
.102**
-.113**
-0.028
-.089**
0.0000
0.0010
0.0000
0.3800
0.005
0.005
1
**. Correlation is significant at 0.01 level (2-tailed).
5.2 Metrics in the years around IFRS
adoption
Figure 3 – Real versus predicted earnings, 20072011, quarterly projections
To analyze the differences in accuracy
and bias from 2007 to 2011, we computed the
mean and standard deviation of each of these
variables for each year. The results are shown
in Table 2. It can be noted that the mean
accuracy and bias hold relatively steady
in all the years, while the observations are
highly dispersed (large standard deviation),
indicating low precision of the estimates.
To better illustrate the concepts,
we constructed the boxplots of the bias
and accuracy of the estimates. These show
13
A. L. Martinez; M. C. R. Dumer / Rev. Cont Org 20 (2014) 13-16
Table 4 Regression Models
Panel A : Dependent Variables : Bias
Bias = α0 + α1 Years*IFRS + α2 Dummy-Loss + α3 Num_Anal + α4 Log_Assets + ε0
Standard
Coefficients
Coefficients
B
Model
1
Std. Error
(Constante)
0.26
0.292
Years*IFRS
0.003
0.019
Dummy-Loss
-.448
Num-Anal
Log_Asset
a. Dependent variable: Bias
t
Sig.
0.89
0.374
0.005
0.163
0.871
.080
-.175
-5.607
0.000
.054
.020
.096
2.668
0.008
0.005
0.002
.008
0.241
0.809
R
R Square
0.212
Statistics
Beta
0.045
Adjusted R
Square
0.041
F
Sig.
11.746
0.000
Panel B: Dependent Variable : Accuracy
Accur = α0 + α1 Years*IFRS + α2 Dummy-Loss + α3 Num_Anal + α4 Log_Assets + ε0
Standard
Coefficients
Coefficients
B
Model
2
Std. Error
(Constante)
.302
.171
Years*IFRS
.016
.011
Dummy-Loss
.150
Num-Anal
Log_Assets
a. Dependent variable : Accuracy
Statistics
Beta
t
Sig.
1.764
.078
.046
1.417
.157
.047
.101
3.198
.001
-.031
.012
-.095
-2.597
.010
.032
.012
.094
2.663
.008
R
R Square
0.145
0.021
Adjusted R
Square
0.07
F
Sig.
5.328
.000
that in average terms the measures did not 5.3.2 Regression models
significantly change during the years studied,
either before or after IFRS adoption.
Table 4 depicts the regression models
To strengthen the evidence, we estimated and their significant statistics. With
computed the difference of the means between respect to bias (Panel A), the dummy variable
2007 (the year before IFRS adoption) and for money-losing firms and the variable for
2011 (the most recent post-adoption year). number of analysts were significant, providing
We found no significant differences between further support that analysts tend to be biased
these years. We should note that although not toward optimism regarding firms that wind in
documented in tables, the average differences the red and that the forecasts become more
of the means between 2009 and all the other pessimistic with an increasing number of
years studied were significant. In this case, analysts.
the accuracy in that year was lower than in the
For accuracy (Panel B), it tended
other years, perhaps explained by the process
to be lower for loss-making firms and for
of adapting the international standards.
larger firms, while it became greater with an
Additionally, we applied the Kruskal- increasing number of analysts following the
Wallis test to check whether the years firm.
present the same dispersion of results. The
The Years*IFRS variable was not
null hypothesis was rejected, indicating
differentiated behavior in terms of variance significant regarding bias or accuracy,
making it impossible to state with reasonable
for the years studied.
confidence that IFRS adoption in Brazil had
an effect on these properties of analysts’
estimates.
Although not documented in the tables,
to assure the robustness of the statistics we
performed additional tests, among them:
14
A. L. Martinez; M. C. R. Dumer / Rev. Cont Org 20 (2014) 14-16
(i) Jarque-Bera (JB) normality test, which
indicated the residuals had normal distribution;
(ii) variance inflation factor (VIF) test, which
presented high values, but lower than the limits
that would have indicated a serious problem of
multicollinearity; and (iii) Breusch-Godfrey
(BG) test, which indicated no autocorrelation
of the residuals.
6.
CONCLUSIONS
CONSIDERATIONS
AND
of accuracy and bias, except for 2009, in which
there was great dispersion in these metrics. A
possible explanation is the difficulties faced
in the process of conversion to international
accounting standards that year.
E. For the companies analyzed, the
adoption of IFRS during the study period
did not yet cause significant changes in the
statistical properties of the analysts’ forecasts.
The adoption of IFRS maintained a positive
correlation with the increase in the coverages
of analysts, indicating these standards created
FINAL a more favorable environment to these
information intermediaries.
IFRS adoption cannot be viewed as
a panacea for the problems of accountancy
and inefficiencies of the capital market. The
complexities of the adjustments to the new
accounting rules and the slow process of
consolidating the conversion of financial
statements can partially explain the results
found here.
The analyses reported in this article
regarding the characteristics of the earnings
projection errors of analysts in the Brazilian
capital market between 2007 and 2011, the
years around the adoption of International
Financial Reporting Standards in Brazil,
The projections of analysts regarding
indicate:
Brazilian companies have substantial value
A. The analysts were pessimistic and notwithstanding the insignificance of the
in average terms. This was shown by a shift to IFRS documented in the study period,
significantly positive mean projection the forecasts need to be placed in context and
error. Furthermore, the analysts on average examined to find those that have conditions to
performed weakly regarding accuracy and be more effective. Understanding how these
professionals operate in average terms is
precision.
relevant from both an academic and practical
B. The analysts were particularly
standpoint.
optimistic with respect to firms that wound
The observations made here can open
up losing money in the periods covered by the
forecasts. In this respect, analysts of Brazilian the way to future research to help academics
companies proportionally commit many understand the expectations of the market and
more negative projection errors for losing therefore to improve valuation models and
optimize the calculation of variables, such as
companies than for profitable ones.
the cost of capital.
C. As the number of analysts covering
Among the limitations of this study,
firms increased, the accuracy of their
projections rose during the study period. On the main one is the relatively small sample
the other hand, with growing firm size there size. Nevertheless, the sample significantly
was a tendency for less accurate forecasts, reflected the composition of the firms listed
probably because larger companies have more on the BM&FBovespa and we included all
those for which it was possible to obtain data
complex accounting practices.
from Thomson Reuter I/B/E/S. We should
D. For the years from 2007 to 2011 we
add that the study period covered years of
did not find any significant differences in terms
A. L. Martinez; M. C. R. Dumer / Rev. Cont Org 20 (2014) 15-16
both strong and weak overall economic
performance. Additionally, we gathered
data from the financial statements in the
Economática database to cross-reference
them with the figures from Thomson Reuters
I/B/E/S. Nevertheless, we cannot rule out the
possible existence of measurement errors due
to the classification criteria used by these two
sources of information.
REFERENCES
ABARBANELL, J.; LEHAVY, R. Can
stock recommendations predict earnings
management and analysts’ earnings forecast
errors? Journal of Accounting Research.
Rochester. v. 41, n. 1, p. 1-31, 2003.
ABARBANELL, J.; LEHAVY, R. An
explanation for why prior stock returns
and analysts’ earnings forecast revisions
predict earnings management and forecast
errors. Working Paper. 2003. Available
at: <http://webuser.bus.umich.edu/rlehavy/
ALBiasExplanation05-23-03.pdf> Consulted
on: May 25,2012.
ANTUNES,
M.;
GRECCO,
M.;
FORMIGONI, H.; MEDEIROS NETO O. R.
A adoção no Brasil das normas internacionais
de Contabilidade IFRS: o processo e seus
impactos na qualidade da informação
contábil. Revista de Economia & Relações
Internacionais. v.10, n. 20, pp. 5-20, 2012.
AUBERT, F.; DUMONTIER, P. Analyzing
brokers’ expertise: Did analysts fully
anticipate the impact of IFRS adoption on
earnings? The European evidence. Working
paper. 2009. Available at http://ssrn.com.
abstract=1420035. Consulted on: May 25,
2012.
BROWN, L. Analysts forecasting errors and
their Implications for security analysis: An
alternative perspective. Financial Analysts
Journal, p. 40-46, 1996.
BROWN, P. International Financial Reporting
Standards: What are the benefits? Accounting
15
& Business Research. v. 41, n. 3, p. 269-285,
2011.
BEUSELINCK, C., JOOS, P.; KHURANA,
I.; MEULEN VANDEN. Mandatory adoption
of IFRS and analysts’ forecasts information
properties. Working Paper. 2010 available at
http://ssrn.com.abstract=1705402. Consulted
on: May 25, 2012.
BYARD, D.; LI, Y.; YU, Y. The effect of
mandated IFRS adoption on analysts‟ forecast
errors. Journal of Accounting Research. v.
49, n.1, p. 69-96, 2011.
CUIJPERS, R.; BUIJINK, W. Voluntary
adoption of non-local GAAP in the
European Union: A study of determinants
and consequences. European Accounting
Review. v. 14, n. 3, p. 487-524, 2005.
DALMÁCIO, F. Z.; LOPES, A. B.; SARLO
NETO, A.; REZENDE, A. J. A influência
da adoção de práticas diferenciadas de
governança corporativa sobre a acurácia
das previsões dos analistas do mercado
brasileiro. In: V ANPCONT. Vitória/ES. v. 1.
p. 1-17, 2011.
DASKE, H. Adopting international financial
reporting standards in the European
Union: Empirical essays on causes, effects
and economic consequences. Thesis, Johann
Wolfgang Goethe-Universität Frankfurt am
Main. 2005.
DA SILVA, H. R. A capacidade previsionária
no mercado acionário brasileiro – Um
estudo focado nas projeções dos analistas
de investimentos. In: ENANPAD.1998.
DAS,
S.;
LEVINE,
C.;
SIVARAMAKRISHNAN,
K.
Earnings
predictability and bias in analysts’ earnings
forecasts. The Accounting Review. v. 73, p.
277-294, 1998.
DEBONDT, W.; THALER, R. Does the stock
market overreact? Journal of Finance. v. 40,
p. 793-805, 1985.
DEBONDT, W.; THALER, R. Further
evidence of investor overreaction and stock
16
A. L. Martinez; M. C. R. Dumer / Rev. Cont Org 20 (2014) 16-16
market seasonality. Journal of Finance. v.
42, p. 557-581, 1987.
FRANCO, D. Projeções de lucros: há
evidências de exageros sistemáticos? Revista
da Bovespa. p. 9-11, 2000.
GIVOLY, D.; LAKONISHOK, J. Properties
of analysts’ forecast of earnings: A better
surrogate for earnings expectations. Journal
of Accounting and Economics. p. 85-107,
1984.
GU, Z.; WU, J. Earnings skewness and analyst
forecast bias. Journal of Accounting and
Economics. v. 35, n. 1, p. 5-29, 2003.
HODGDON, C.; TONDKAR, R.; HARLESS,
D.; ADHIKARI, A. Compliance with IFRS
disclosure requirements and individual
analysts’ forecast errors, Journal of
International Accounting, Auditing and
Taxation. v. 17, n. 1, p. 1-13, 2008.
HORTON, J.; SERAFEIM, G.; SERAFEIM,
I. Does mandatory IFRS adoption improve the
information environment? Working paper.
2010. London School of Economics, Harvard
University. Available at http://www.hbs.edu/
research/pdf/11-029.pdf Consulted on May
25, 2012.
KOTHARI, S. P. Capital market research
in accounting. Journal of Accounting and
Economics. v. 31 n. 1, p. 105-231, 2001.
LIM, T. Are analysts’ forecasts optimistically
biased?
Working
Paper.
Darmouth
University. 1998.
LIN, H.; MCNICHOLS, M. Underwriting
relationship and analysts’ earnings forecast
and investment recommendations. Journal of
Accounting and Economics. v. 25, p. 101127. 1998.
MARTINEZ, A. L. Analisando os analistas:
estudo empírico das projeções de lucros
e das recomendações dos analistas de
mercado de capitais para as empresas
brasileiras de capital aberto. 2004. 234p.
Doctoral Thesis – Escola de Administração
de Empresas de São Paulo, Fundação Getúlio
Vargas, São Paulo.
MARTINS, G.A. Estatística Geral
Aplicada. São Paulo: Ed. Atlas. 2002.
e
PREIATO, J.; Brown, P.; TARCA, A.
Mandatory IFRS and properties of analysts
forecasts: How much does enforcement
matter? Working paper. 2009, University
of Western Australia. Available at http://
papers.ssrn.com/sol3/papers.cfm?abstract_
id=1499625. Consulted on May 25, 2012.
RICHARDSON, S.; TEOH, S.; WYSOCKI,
P. Tracking analysts’ forecasts over the annual
earnings horizon: are analysts’ forecast
optimistic or pessimistic? Working Paper.
1999, University of Michigan. Available at
SSRN:
http://ssrn.com/abstract=168191.
Consulted on May 25, 2012.
SAITO,R.; VILLALOBOS, S.; BENETTUI,
C. Qualidade das Projeções dos Analistas
Sell side: Evidências Empíricas do Mercado
Brasileiro. Revista de Administração da
USP. v. 43, n.4, p. 356-369, 2008.
SHARPE, W. Investments, Prentice Hall, 6th
Edition, New York: 1998,
TRUEMAN, B. Analysts’ forecasts and
herding behavior. The Review of Financial
Studies. v. 7, n. 1, p. 97-124, 1994.
WANG, X.; YOUNG, D.; ZHUANG,
Z. The effects of mandatory adoption
of International Financial Reporting
Standards on information environments.
In: American Accounting Association
Conference, Anaheim, California, 2008.
Download