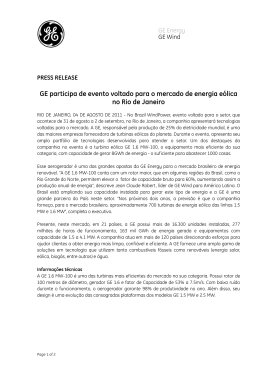
The Brazilian Energy Matrix and Greenhouse Gas Emissions M A U RICIO TIO M N O TOL M AS Q UIM Chair of the Energy Planning Program oft C O PPE/UFRJ – Chair of SBPE – Brazilian Society for Energy Planning 1 Sources Tolmasquim, M.T., Cohen, C. e Szklo, A S, ¨CO2 Emissions in the Brazilian Industrial Sector According to the Integrated Energy Planning Model, Energy Policy, 2000 Tolmasquim, M.T., Schaeffer, R., Machado, ¨Energia e Carbono Embutidos no Comércio Internacional Brasileiro¨, Documento Preparado para o MCT, Setembro de 2000. Rosa, L.P, Goldemberg, J., Nobre, C, Dias e Tolmasquim, Documento da SBPC, 2000. Poole, A D, Hollanda, J. B., Tolmasquim, M, ¨Conservação de Energia e Emissões de Gases do Efeito Estufa no Brasil¨, Documento Preparado para o MCT, 1998. Wachsmann, U., Tolmasquim, T.M., “Windpower in Brazil – a Transition Using the German Experience”, Documento preparado para Rio02 2 CO2 Emissions from Fossil Fuels Brazil and Some Emerging and OECD Countries - 1995 Brazil Japan Europ Union USA Mexic o India China Russia CO2 & economy (kg CO2/US$90GDPPPP) 0.33 0.46 0.51 0.85 0.51 0.73 0.92 2.24 CO2 per capita (t CO2/hab) 1.81 9.17 8.55 19.88 3.46 0.86 2.51 10.44 Total CO2 (million t CO2 ) 287 1151 3180 5229 328 803 3007 1548 Transport Emissions (million t CO2 ) 119 252 828 1580 101 112 167 108 Share of Transport (%) 41.5 21.9 26.0 30.2 30.8 13.9 5.6 7.0 Source: International Energy Agency, CO2 Emissions from Fossil Fuel Combustion: 1972-1995. OECD, Paris, 3 1997 Hydro Power generation contributes with just 5% of the total CO2 energy emissions in Brazil. OCDE – 30% of emissions if the “mix” were 50% hydro, 25% coal and 25% natural gas combined cycle – the avoided emissions would be on the order of 30 million tC in 1996. more or less 1/3 of the Brazilian emissions in that year. 4 Alcohol from Sugarcane The production and use of ethanol as the sole fuel or mixed with gasoline reduces current emissions by an estimated 9 million tC In the late 80s, alcohol vehicles accounted for 90% of total sales – a fleet of 5 million alcohol vehicles circulated in Brazil. Today– less than 0,5% of new car sales. 5 Charcoal Brazil is one of the few countries in the world that has kept a significant metallurgical industry based on charcoal The current level of use of charcoal avoids an annual emission of more than 3 million t C of CO2. 6 Metalurgical Charcoal in Brazil - 1980/96 Metalurgical (106 t/year) charcoal Share of planted wood (%) 1980 1985 1990 1995 1996 4.9 8.1 8.4 6.8 6.1 - 15 35 55 - 7 Emissions of CO2 from Fossil Fuels per Unit of GDP – Brazil (tC/106 US$96 GDP ) 98 6 E m i s s io In n t e n s ity (tC /1 U0S $ -1 9 9 6 ) 96 94 92 90 88 86 84 82 80 19 74 19 76 19 78 19 80 19 82 Y ear 19 84 19 86 19 88 19 90 19 92 19 94 19 96 8 CO2 Emissions Different Technologies Tecnologias Tecnologias Planta Plantaconvencional convencionalde dequeima queimade decarvão carvão Planta de queima de gás Planta de queima de gás Pequenas Pequenashidrelétricas hidrelétricas Energia eólica Energia eólica Solar Solarfotovoltaico fotovoltaico Grandes Grandeshidrelétricas hidrelétricas Solar térmico Solar térmico Lenha Lenha(Extração (Extraçãoprogramável) programável) Emissões Emissõesde deCO CO2 2 nos nosestágios estágiosde deprodução produçãode de energia (ton/GWh) energia (ton/GWh) Extração Total Extração Construção Construção Operação Operação Total 11 11 962 964 962 964 00 00 484 484 484 484 -10 10 10 10 -77 -77 -55 -55 -44 -44 -33 -33 -1.509 33 1.346 -160 -1.509 1.346 -160 Fonte: "Renewable Energy Resources: Opportunities and Constraints 1990-2020" - World Energy Council - 1993 9 The Future of Renewable Energy Sources 10 Renewable Energy Costs Evolution (US$/MWh) 3500 Fotovoltaica Eólica Geotérmica Termosolar - Gás Termosolar - Parabólicos Biomassa 3000 2500 2000 1500 1000 500 0 1980 1988 2000 2030 11 Fonte: www.cresesb .cepel.br www.cresesb. The Future of Wind Energy Forecast until 2004 12 Wind Energy in German - 2001 1600 Fonte: DEWI, 2000 1400 Installed Power/ear [MW] Number of Wind Turbines (in June 2001) Number of Wind Turbines (in June 2001) Installed Capacity (MW) Installed Capacity (MW) Average Rated Power (kW/unit) Average Rated Power (kW/unit) Only in the first Only in the first Cumulated 6 month of 2001 Cumulated 6 month of 2001 10.033,00 674,00 10.033,00 674,00 6.916,00 821,00 6.916,00 821,00 689,40 1.219,00 689,40 1.219,00 1200 Turbinas Instaladas Turbinas Instaladas ao longo dos anos ao longo dos anos 1000 800 600 400 200 13 *106 0 MWh/year (2000) 1988 1989 1990 1991 1992 1993 1994 1995 1996 1997 1998 1999 2000 2001 Year 7000 2% of the German Energy Consumption in 1999 Cumulated Power [MW] 6000 5000 4000 Potência Instalada Potência Instalada ao longo dos anos ao longo dos anos 3000 2000 1000 0 13 1988 1989 1990 1991 1992 1993 1994 1995 1996 1997 1998 1999 2000 2001 Year Finaciadores Início de operação Instalação Potência Actual Situation of the Brazilian Wind Energy Use (Types of Turbines) CELPE, UFPE/Folkcenter CEMIG COELCE CEPEL/CELPA 30% Dinamarca 70% Alemanha 70% Alemanha 100% USA 75 kW 1 MW 1.2 MW 40 kW 1992 1994 1996 1997 Wobben Windpower/ COELCE Privado 10 MW 1999 Wobben Windpower /COELCE Wobben Windpower/COPEL Privado Privado 5 MW 1999 2.5 MW 1999 Implementação Projetos em operação Fernando de Noronha – PE Morro do Camelinho – MG Porto de Mucuripe – CE Sist. Híbrido de Joanes – PA Central Eólica de Prainha – CE Central Eólica de Taíba – CE Usina de Palmas – PR 20,3 MW installed 14 Brazilian Wind Energy Atlas – Preliminary Version 2001 15 Fonte: www.cresesb .cepel.br www.cresesb. Valor Normativo - Res. ANEEL 22/2001 Fonte Fonte R$/ R$/MWh MWh Termelétrica TermelétricaaaGás Gás 72,35 72,35 Termelétrica TermelétricaCarvão Carvão 74,86 74,86 Pequena PequenaCentral CentralElétrica Elétrica 79,29 79,29 Termelétrica TermelétricaBiomassa Biomassa 89,86 89,86 Usina UsinaEólica Eólica 112,21 112,21 Usina UsinaSolar SolarFotovoltaica Fotovoltaica 264,12 264,12 Ref. Fev/2001 16 Economic Evaluation of Wind Energy in Brazil - own capital - Fonte: DUTRA,2001 Load Factor 40% Model Power Turbina 1 200 kW Turbina 2 250 kW Turbina 3 300 kW Turbina 4 500 kW Turbina 5 750 kW Turbina 6 660 kW Turbina 7 1300 kW Turbina 8 1500 kW Turbina 9 1500 kW 17 Economic Evaluation of Wind Energy in Brazil - resources from BNDES - PASE PASE – Electrical Power Program Load Factor 40% Fonte: DUTRA,2001 18 BAGASSE-BASED COGENERATION Market Percentage for the 2005 Scenario 19 Technology Harvestin g Method (a) Associated Biomass Proportion Available Biomass Distribution by Season (million tons/year) Harvest Mid-Harvest Forecast (GWh/year ) For ecas t (M W) (b,c ) Current CounterPressure Cycle Without Recovery 60% 52.65 - 3,949 676 Efficiency-Enhanced Counter-Pressure Cycle With Recovery 40% 56.94 - 12,812 2,19 4 Condensation and Extraction Cycle - 0% - - 0 0 Biomass Gasification and Combined Cycle - 0% - - 0 0 Total 109.59 2,87 0 16,760 20 Without Recovery - straw and tips are burned off before harvesting With Recovery - raw sugarcane is mechanically harvested, with a recovery rate of 40% in absolute terms of the straw and tips Market Percentage for the 2010 Scenario Harvestin g Method (a) Associated Biomass Proportion Current CounterPressure Cycle Without Recovery Efficiency Enhanced Counter-Pressure Cycle Technology Available Biomass Distribution by Season (million tons/year) Forecast (GWh/year ) For ecas t (M W) (b,c ) Harvest Mid-Harvest 30% 28.35 - 2,126 364 With Recovery 40% 61.32 - 13,797 2,36 3 Condensation and Extraction Cycle With Recovery 15% 14.18 8.82 9,888 1,69 3 Biomass Gasification and Combined Cycle With Recovery 15% 14.8 8.82 20,466 3,50 4 46,277 21 7,92 4 Total 118.02 NATURAL GAZ COGENERATION 22 Reasons to encourage cogeneration Compared to conventional thermo-power generation: • It ensures lowest energy consumption • It reduces atmospheric emissions • It could serve electricity markets with: o lower investments in the transmission and distribution grids and networks o with lower energy losses during transmission. It may allow the postponement of high-volume investments in expanding centralized power generation capacity. 23 However, these reasons have not encouraged investments in cogeneration in Brazil in the past. • total cogeneration potential - between 11 and 17 GW • technical potential for industrial cogeneration - about 12,499 MW the installed capacity of cogeneration systems in Brazil by 2000 did not exceed 2 GW. 24 Energy policy 1. Foster the expansion of cogeneration in segments where investments are not allocated spontaneously, either because: • the benefits of cogeneration are not perceived or • these benefits are not properly appraised, –o investors may be unwilling to channel funds to a sector outside their core activities, or o there may be market barriers to this investment. 25 Energy policy 2. Encourage: o the expansion of more efficient cogeneration systems and o the conversion of less efficient systems to more efficient levels, resulting in high fuel savings. – For instance, this was one of the guidelines of Denmark’s (1980s and 1990s) and French (1990s) policy. 26 Energy policy 3. Encourage rapid expansion of the installed capacity of cogeneration systems. For instance, incentives designed to encourage the sale of cogenerated surplus power speeded up the expansion of installed cogeneration capacity in – the USA (1980s), – Netherlands (early 1990s), and – France (end of this decade). 27 Energy policy 4. Encourage the consumption of certain fuels rather than others, due to: • either environmental reasons or • issues of a technical and economic nature (such as the availability of energy resources). This is the case with both – the Netherlands and – Denmark, (in terms of natural gas and renewable fuel sources). 28
Download