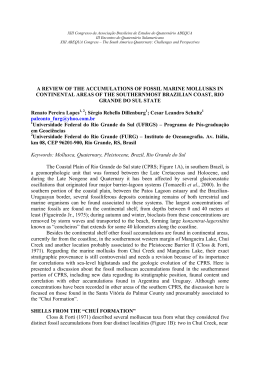
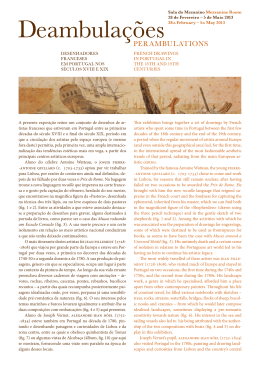
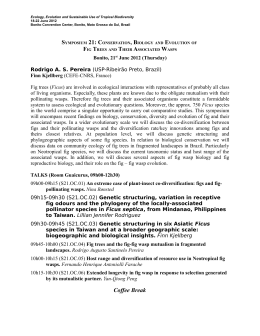
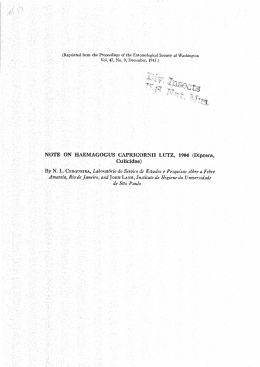
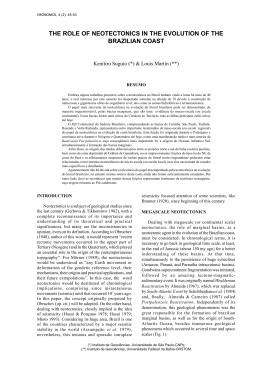
ELSEVIER
Marine Geology 140 (1997) 141-166
The Brazilian sea-level curves: a critical review with emphasis on
the curves from the ParanaguA and Canan&a regions
Rodolfo Jo& Angulo a,1, Guilherme Camargo Lessa b,*
a Departamento de Geologia, Universidade Federal do Parami, C. P. 1901 I, Curitiba 81531-990, Brazil
b Centro de Estudos do Mar, Universidade Federal do Paranci, C. P. 43, Paranaguri (PR) 8325.5-000, Brazil
Received
1 August
1996; accepted
10 February
1997
Abstract
Relative sea-level curves for the mid- to late-Holocene
have been proposed for eight different sectors along the
Brazilian coast. This paper aims to review the data used to construct the curves proposed for two sectors, the
ParanaguA and Canankia regions in southeast Brazil. More specifically, we analyze the palaeo-sea-level indicators
(vermetid tubes, shells, wood fragments and shell-midden deposits) related to (1) the sea-level maximum of the midHolocene and (2) the two secondary oscillations that would have occurred between 4100-3800 years B.P. and
3000-2700 years B.P. The sedimentary deposits of the coastal plain as well as vermetid datings suggest a midHolocene sea-level maximum between + 3.5 and +4 m. The great majority of the indicators used to infer the
secondary oscillations in previous studies were derived from shell middens. Besides being unreliable palaeo-sea-level
indicators. these data also showed inconsistencies that undermine the existence of such oscillations. The plot of all
the data derived from vermetid samples found along the Brazilian coast also indicate a rather smoother sea-level fall
in the last 5100 years. 0 1997 Elsevier Science B.V.
Keywords: Holocene;
radiocarbon
dating;
shell middens
1. Introduction
Pioneering studies trying to establish a Holocene
mean sea level (MSL) curve for Brazil date back
30 years, when a series of radiocarbon datings of
palaeo-sea level indicators were published by van
Andel and Laborel ( 1964) and Delibrias and
Laborel ( 1969). The dated indicators, most of
* Corresponding author. Present address: Curso de Pk.GraduaqLo
em Geologia - UFBa, R. Caetano
Moura
123,
Federaclo,
Salvador (BA) 41210-340, Brazil. Fax: +5.5 71 247
3004; e-mail: [email protected]
‘Fax: 55 41 266 2393.
0025-3227/97/$17.00
0 1997 Elsevier Science B.V. All rights reserved.
PII SOO25-3227(97)00015-7
them represented by vermetid samples, came from
various localities, spanning the coastline from
Recife to Angra dos Reis (Fig. 1). Because elevated vermetid lines were observed throughout the
Brazilian coast, Delibrias and Laborel ( 1969) suggested that the results of the 18 datings spanning
6000 years could be representative of the overall
mid- to late-Holocene
MSL trend along the
Brazilian coast. The trend suggested that sea level
exceeded the present MSL by 6000 years B.P.,
reached +3.0 m by 4500 years B.P. and then fell
gradually to the present level.
Although the sea-level course proposed by
Delibrias and Laborel (1969) was derived from
14 2
R.J. Angulo. G.C. Lessa 1 Marine Geology 140 (1997) 141-166
ra dos Reis
AMER
C
r Paranagub
A
c,
0
ltajaf
Laguna
SO’S
L
7O’W
m’ I
60’ \
\
Fig. 1. Location
of the sites where sea level studies have been undertaken
widely separated areas, it proved to be somewhat
similar to the trend suggested by regional sea-level
curves (Figs. 1 and 2). Suguio and Martin (1976)
and Martin and Suguio ( 1976) made the first real
attempt to develop a sea-level curve with dated
samples from sedimentary (wood fragments and
in Brazil.
shells) and shell-midden deposits from the
CananCia coastal plain (an updated version of this
curve is given in Fig. 2f). Since then, eight other
regional curves have been proposed for different
sites along the Brazilian coast. It is observed in
Fig. 2 that the curves between Salvador and Itajai
R.J. Angulo,
G.C. Lessa J Marine
Geology
140 (1997)
143
141-166
+5
m
0
5
+5
m
0
Caravelas
__- .__
m0 -
+5
- F
Tr
-
4
R.
.
T2
“-=------
R.
C
---
-.-___________________
~
7
6
t
Angra
+5
dos
5
4
3
2
1
0
Reis
d
m
n
*
I
7
6
5
4
3
2
1
0
-5
+5
m
0
-5
S.
S.
+5
f
m
0
-5
S.
YYYUUvyu
+5
m
0
-5 L
Itajai-Laguna
+5 me
o-
e
._____
1
Tyq-~&-.*
-.______;
________
y
,
-7’
6
5
4
3
2
1
0
-5 L
+5 - Rio
m_
0
Grande
1)
- Y’
do Sul
// /H-C
6
.
5
,--,
m
TTTTTT
levels
wave
terraces
Fig. 2. The Brazilian
sea-level
(see Fig. 1 for location).
built
of
curves
,
4
3
Years
reconstruction
paleo-sea
i
S.
-“““““““““‘“““““““““”
#cB\
2
-
1
0
B.F? x 10”
vvvyr~vv
ages
-
lagoonal
for the last 7000 years (after
-_---we---- -
of shell-middens
terraces
Suguio
-
et al., 1985; Villwock
Pontal das
(2995?125
Concei+o
(1975+15
Desertas
y.B.F?)
peat
lignite
v.B.p.1
and Tomazelli,
1989; Tomazelli,
1990)
144
R. J. Angulo,
G.C. Lena
1 Marine
Geology
Soc,.ty
I,lmds,
140 (1997)
FRENCH
4
a
8
4
POLYNESIA
2
ky
FRENCH
10
141-166
POLYNESI
2
b
Tlerra
Fig. 3. Holocene
higher-frequency
dol Fuq#o, ARGENTINA
sea-level
oscillations
curves in the Southern
in the last 5000 years.
Bumce
Airr
Province,
Hemisphere
(Fig. 2a-h) follow the same general trend: a general fall of sea level after a maximum of about 5 m
at the post-glacial marine transgression (PMT)
around 5100 years B.P., intercalated with two
intervals of negative oscillations when sea level
may have been at or below the present elevation
(4100-3800 and 3000-2700 years B.P.) (Suguio
et al., 1985). The last curve (Fig. 2i), proposed for
the southernmost Brazilian state, is somewhat
different. With a limited number of datings, it
suggests that sea level reached a minimum of
- 1.5 m at 1500 years B.P. and has been rising
(after
ANGOLA
ARGENTINA
Ma,
1989,
and
Pirazzoli,
1991),
showing
no evidence
of
since then (Villwock
and Tomazelli,
1989;
Tomazelli, 1990; Angulo and Suguio, 1995).
Sea-level curves in the Southern Hemisphere for
the last 7000 years are characterized by either a
falling or a fluctuating trend (Isla, 1989; Pirazzoli,
1991). Higher-than-present
mean sea level at the
end of the PMT, with heights varying from 1 to
5 m, appear to have occurred throughout
the
Southern Hemisphere, but with a time lag towards
the Equator (Isla, 1989) (Fig. 3). Secondary oscillations of the MSL that occurred after the end of
the PMT are also observed in many curves,
R. J. Angulo, G. C. Lessa / Marine Geology 140 (1997) 141-166
although most of the oscillations are poorly established (Pirazzoli, 199 1). The secondary oscillations
in Brazil are suggested to have occurred along a
latitudinal span of about 18 degrees, between
Salvador in the north and Laguna in the south
(Suguio et al., 1985; Tomazelli and Vilwock in
Angulo and Suguio, 1995; Tomazelli and Vilwock
1989 in Tomazelli, 1990) (Fig. 1). The oscillations
presented by Suguio et al. ( 1985) comprise about
5 m of amplitude and extend over a significantly
broad area. Given the large spatial extent of this
similar sea-level trend, it is expected that cognate
sea-level patterns should be observed in neighbouring regions, either to the north or south. An
inspection of other published curves in South
America shows that there is hardly any coincidence
of other curve shapes with that of Brazil (Fig. 3).
Exceptions are two curves (Urien, 1970 and
Farinati, 1984, in Pirazzoli, 1991) that show oscillations of more than 5 m, which are, however, of
doubtful validity due to the nature of the data
utilized (Pirazzoli, 199 1).
The purpose of this work is the re-evaluation of
the sea-level data used by other authors to determine the maximum elevation of the Holocene
transgression and the two secondary oscillations
(4100-3800 and 3000-2700 years B.P.) in the
Cananeia and Paranagua regions. By critically
reviewing key indicators from these two areas, this
study attempts first to re-assess the validity of the
sea-level curves in these two regions, and second,
to contribute to the calibration of the other
Brazilian sea-level curves.
2. Study area
The study area encompasses most of the coastal
plain of the State of Parana and the southern part
of Sao Paulo State (Fig. 4) with a N-S extension
of about 200 km. This coastal plain can be divided
into three distinct sectors, separated by coastal
ranges that run almost normal to the coastline:
( 1) Guaratuba, in the south of the State of Parana;
(2) ParanaguCSuperagui,
that extends up to the
border of the State of SBo Paulo; and (3) the
Canantia coastal plain.
Studies of the Quaternary geology and evolution
145
of the area span the last 50 years in Guaratuba
and Paranagua (Bigarella, 1946; Rivereau et al.,
1968, 1969a,b,c,d,e, 1970; Bigarella et al., 1978;
Martin et al., 1988; Angulo, 1992; Lessa and
Angulo, 1995), but have begun more recently in
Cananeia (Petri and Suguio, 1973; Suguio and
Petri, 1973; Barcelos, 1975; Suguio and Martin,
1978a, b; Suguio and Barcelos, 1978; Poncano,
1981; Souza, 1995). Similar to what is observed
along most of the Brazilian coastline (Suguio et al.,
1985), the coastal plains show evidence of the
regression that followed the sea-level maxima of
120,000 years B.P. and 5100 years B.P. (Suguio
and Martin, 1978a,b; Martin et al., 1988;
Angulo, 1992).
In the ParanaguCSuperagui
sector beach ridges
are the predominant morphological feature of the
coastal plain. Martin et al. (1988) and Angulo
(1992) have subdivided the ridges between
Pleistocene and Holocene ages, but their suggested
boundaries are different (see Fig. 5). Based on logs
from water wells, Lessa and Angulo (1995) proposed a preliminary evolutionary model for the
Paranagua coastal plain, with the existence of
transgressive and regressive sequences comprising
marine sands and estuarine muds. In the whole
region, the Holocene strandplain appears to have
evolved into an encroachment mode (Roy et al.,
1995) against the Pleistocene strandplain in the
later stages of the PMT. No true lagoonal depression in the back of the Holocene strandplain is
observed, although palaeo-lagoonal deposits are
found underneath the present shoreline at depths
around - 10 m (Lessa and Angulo, 1995). The
low-lying area within the Paranagua coastal plain
located behind the Holocene strandplain is actually
an erosive platform of the Guaraguacu River
constructed
upon the Pleistocene strandplain
(Lessa and Angulo, in prep.). Corings performed
across the valley show an entirely sandy substrate
with (sub)horizontal
plane-parallel
structures
characteristic of a beach-face environment (Lessa
and Angulo, in prep.).
In Canantia, the major part of the coastal plain
is composed of a dissected Pleistocene strandplain
(Suguio and Martin, 1978b). An evolutionary
model for the coastal plain that covers the last
120,000 years (Fig. 6) shows that a beach ridge
146
R. J. Angulo, G. C. Lessa 1 Marine Geology 140 (1997) 141-166
24’50%
onprlda
Island
I Canon&
Superagui
25’30’5
R.J. Angulo, G.C. Lessa 1 Marine Geology I40 (1997) 141-166
plain was formed during regressive episodes
(Suguio and Martin, 1978a). During marine lowstands, fluvial erosion carved valleys parallel to
the shoreline that were later infilled by sedimentation associated with the subsequent rise of sea level
(Fig. 6). Also according to this model, a translating barrier should not be preserved at the shoreface
accompanying sea-level rise. Instead, the only feature associated with the PMT is an erosion platform on the pre-existing barrier.
During the secondary Holocene sea-level fluctuations at 4100 and 3500 years B.P., other generations of beach ridges were formed on Comprida
Island ( Fig. 4C) (Suguio and Martin, 1978a).
These authors identify “at least two generations
of beach ridges separated by a more or less
swampy, low-lying zone that can be followed about
50 km”, parallel to the coastline.
3. Published key palaeo-sea-level indicators
3.1. Guavatuba and Paranaguh coastalplains
The first datings reported for this region are
related to archaeological studies in shell-middens.
Laming-Emperaire
(1968) studied a midden
located on Rosas’ Island (Fig. 4), at a place currently beneath a small human settlement that up
to the 19th century utilized the midden as raw
material for a kiln. Three shell samples at the
lower part of the midden were dated at 3 150 + 110
(Gif. 1047), 2480 &-110 (Gif. 1046) and 2500-& 110
years B.P. (Table l), the first one located close to
the present low tide level. Since human settlements
are assumed to occur above the high tide level,
Laming-Emperaire
( 1968) interpreted
that sea
level during the time of the midden occupation
was below the present elevation.
141
Martin et al. (1988) indicated that the midden
rests on a rock outcrop submerged during high
tide, and that the lowest layer of the midden
(3150 + 110 years B.P.) is overlain by estuarine
deposits, which in turn underlie a second layer of
midden shells (2480 years B.P. + 110). Martin et al.
(1988) suggested that the presence of estuarine
sediments capping the first layer of the midden is
an indication that sea level was rising at about
3100 years B.P., and that the second layer of shells
was laid down with a falling sea level after a
maximum that occurred before 2500 years B.P.
In the Boguacu River (Fig. 4A) Martin et al.
(1988) dated mollusc shells from a shell-midden
whose base is presently underwater. The shells
were collected at the present MSL, and dated at
3920+ 190 years B.P. (Bah. 1272), suggesting that
sea level was below the present elevation by that
time.
Bigarella ( 197 1) dated typical open marine shells
(SI 237) (Donax and Arca amongst others,
J.J. Bigarella, pers. commun., 1990) retrieved from
a coring performed on the Caioba tombolo
(Fig. 4), whose surface lies approximately 2 m
above MSL (Fig. 7). The shells were embedded in
muddy sediments buried under 4 m (i.e., at - 2 m)
of marine sand, and provided an age of 3830 years
B.P. Bigarella (1971) interpreted the deposit as
being associated with a sea level higher than today,
whereas Martin et al. (1988) proposed that the
stratigraphic sequence of the tombolo is transgressive, and that sea level was below the present
elevation around 3800 years. The authors imply
that the deposit where the shell is embedded, is
related to a back-barrier lagoon. According to this
scenario, the back-barrier lagoon was buried by a
transgressive barrier that accompanied the rise of
sea level that ended around 3500 years B.P.
Martin et al. (1988) presented two datings of
Fig. 4. The coastal plain of the states of Parana and southern Sao Paulo, and location of the Rosas’ Island shell-midden
(Gif-1046
and Gif-1047). (A) Marine sedimentary
deposits and location of the dated samples from the Guaratuba
coastal plain: 1= sedimentary
deposit (SI-327), 2 =sedimentary
deposit (Bah-1277),
3=sedimentary
deposit (Bah-1278)
4=vermetid
(CENA-140)
5=vermetid
(CENA-141),
6= Boguacu River shell-midden
(Bah-1273)
7= Boguacu River shell-midden
(Bah-1272).
(B) Marine sedimentary
deposits and location of the dated samples from Paranagua
coastal plain: I = sedimentary deposit (Bah-1270)
2 = sedimentary deposit
(Bah-1269),
3=vermetid
(GSC-5255),
4=vermetid
(CENA-143).
(C) Marine sedimentary
deposits and location of the samples
from Cananeia
coastal plain: I = sedimentary
deposit (Bah-630),
2 = sedimentary
deposit (Bah-445),
3 =Ararapira
channel shellmidden (Bah-289),
4 = Ararapira
channel shell-midden
(Gif-3437),
5 =Comprida
Island shell-midden
(Gif-3436 and Bah-303).
6 = Tapera-Cananeia
shell-midden
( Bah-29 1).
148
R.J. Angulo, G.C. Lessa / Marine Geology 140 (1997) 141-166
0
5 km
Holocene barrier
Pleistocene barriir
m
~~~s~”
e6tuarine sediments
-
bed-rock and
continental deposii
R.J. Angulo, G. C Lessa / Marine Geology 140 (1997) 141-166
Canane’ia
Channel
0
-I--
PMorro
I
Tapera
da
5
10
km
m
Bed-rock and
continental
deposits
m
Holocene
lagoonal
riverine deposits
Holocene
Pleistocene
barrier
barrier
and
150
R J. Angulo, G. C. Lessa / Marine Geology 140 (1997) 141-166
Pleistocene
m
Holocene
m
lagoonal
bedrock
Holocene
strandplain
deposits
mangrovee
m
Pleistocene
strandplain
111
and continental
strandplain
paleo-estuarine
estuarine
deposits
strandplain
deposits
deposits
deposits
Fig. 5. Geological map of the Paranagua costal plain after Martin et al. (1988) and Angulo (1992). Note the partition of the
Pleistocene and Holocene strandplains.
mollusc shells located on palaeo-estuarine sediments from the Guaratuba coastal plain (Fig. 4A).
These samples were dated at 2970 years B.P.
(Bah-1278) and 3160 years B.P. (Bah-1277)
(Table 2), and were related to palaeo-sea levels of
> + 1.Om. Since these samples were collected at
the surface, Martin et al. (1988) suggested that the
palaeo-lagoon could have dried out at approximately 3000 years B.P., after a sea-level fall presumably associated with the secondary oscillation
between 3000 and 2700 years B.P.
Two other datings of mollusc shells were presented by Martin et al. (1988) from samples collected in the Itibere and Guaraguaqu rivers, both
located in Paranagua Bay (Table 2). These samples
were dated at 2650 years B.P. (Bah-1269), 2680
years B.P. (Bah-1270), and according to Martin
et al. (1988) indicate palaeo-sea levels of
+ 1 f0.5 m, or sea levels higher than at present.
An inference of a sea-level maximum of about
2.5 m at the end of the PMT was made by Suguio
et al. (1985, 1988) and Martin et al. (1988) based
R. J. Angulo, G. C. Lena 1 Marine Geology 140 (I 997) 141-166
Pleistocene
(120,000
151
transgression
years B.P.)
A
Rearession
and beach
progradation
ridaes
-
B
Partial
erosion
of marine
during lowstand
deposits
’
C
Holocene
(5,000
transgression
years B.P.)
D
Regression
toward
present
level
E
transgressive
marine
sand
IzEJ
continental
. . .
m
transitional
clay
m
regressive
sand
Fig. 6. Evolutionary
model for the Canantia coastal plain (after Suguio and Martin, 1978b). No sand body is associated
sea level and marine transgression.
The formation
of strandplains
is allied to falling sea levels.
with rising
152
Table 1
Radiocarbon
R. J. Angulo,
datings
of shell-midden
Local
Baguacd River
Boguacu
River
Rosas’ Island
Rosas’ Island
Ararapira
Channel
Ararapira
Channel
Comprida
Island
Comprida
Island
Tapera-Cananeia
G. C. Lessa / Marine
Geology
140 (1997)
141-166
deposits
Latitude
(south)
Longitude
(west)
Age
(years
25”55’12”
25”55’24”
25”25’00”
25’25’00”
25”01’30”
25”09’12”
24”59’00”
24”59’00”
25”02’00”
48”37’12”
48”38’18”
48”39’36”
48”39’36”
48”03’30”
48”02’06”
47”53’00”
47”53’00”
47”59’00”
329Ok 190
3920~190
3150+110
2480 + 110
4130+100
3790 + 110
4120_+110
4120&-90
396O_f90
B.P.)
Palaeo-level
(m)
Lab.
Ref. No
< +1.3
10
10
<o
E f0.5
EO
< f1.5
< +1.5
< f1.5
Bah-1273
Bah-1272
Gif-1047
Gif-1046
Bah-289
Gif-3437
Gif-3436
Bah.-303
Bah-291
Source
Martin
et al.,
Martin
et al.,
Laming-Emperaire,
Laming-Emperaire,
Suguio et al.,
Suguio et al.,
Suguio et al.,
Suguio et al.,
Martin
et al.,
1988
1988
1968
1968
1976
1976
1976
1976
1979b
E
w
rata mountain
Caiobh tombolo
-
-
-
-
-
lm
1
I
I
100 m
Crystalline
Younger
Older
rocks
sandy
sequence
Fig. 7. Schematic
profile
I
@I
of the Caioba
on the highest elevation of the innermost part of
the wave-built
Holocene
strandplain.
These
authors defined the Holocene strandplain
by
the non-occurrence of indurated, epigenetically
sandy
sequence
Clayey-silty
marine
sediments
Dated
sample
(3830
tombolo
shell
and the location
of the dated
+ 120 y.B.P.)
sample.
organic-rich, dark-brown
sands, then acknowledged to be a characteristic of Pleistocene deposits
only. However, Angulo
(1992) and Angulo
and Suguio (1995) presented a new set of dated
RJ. Angulo. G.C. Lessa / Marine Geology 140 (1997) 141-166
153
Table 2
Radiocarbon datings of sedimentary deposits
Local
Latitude
(south)
Longitude
(west)
Nature
Age
(years B.P.)
Palaeo-level
(m)
Lab. Ref. No.
Source
Caioba Tombolo
Guaratuba
Guaratuba
Guaraguacu River
Itibere River
Cananeia
Cananeia
MelMel’s Island
MelMel’s Island
Caioba Hill
Caioba Hill
25”50’55”
25”56’55”
25”56’55”
25’33’14”
25”32’33”
24”51’54”
24”51’18”
25”32’20”
25”32’54”
25”51’06”
25”51’06”
48”32’19”
48”36’11”
48”36’11”
48”27’48”
48”31’31”
47”47’12”
47”28’30”
48”17’26”
48”17’30”
48”32’04”
48”32’04”
shells a
shells b
shells b
shells b
shells b
wood
wood detritus
vermetids
vermetids
vermetids
vermetids
3830+120
316Ok 170
2970 + 150
268O_f240
265Ok 170
378Oi 110
3710+ 140
35OOk60
3300+60
4750 * 70
5300 * 70
20”
> +1.0
> +l.O
+1.0+0.5d
+1.0*0.5’
+2_+0.5
+0.5*0.3
+ 2.90 + 0.50
+2.05*0.50
+3.60*0.50
+3.45+0.50
SI-327
Bah-1277
Bah-1278
Bah-1270
Bah-1269
Bah-630
Bah-445
GSC-5255
CENA-143
CENA-140
CENA-141
Bigarella, 1971
Martin et al., 1988
Martin et al., 1988
Martin et al., 1988
Martin et al., 1988
Martin et al., 1979b
Martin et al., 1979b
Angulo, 1992
Angulo, in prep.
Angulo, in prep.
Angulo, in prep.
a Marine shells, Arca and Donax amongst others (J.J. Bigarella, pers. commun.).
b Estuarine, mainly Anomalocardia brasiliana.
’ Palaeo-level after Martin et al., <O m.
d Palaeo-level after Angulo (1993), > +0.9 m.
e Palaeo-level after Angulo (1993), > + 1.0 m.
palaeo-sea-level indicators for the area, discovering
that the epigenetically organic-rich sands also
occur in Holocene deposits, and re-evaluated the
morphological boundary between the Pleistocene
and Holocene strandplains (Fig. 5). With this
information, sea level at the end of the PMT was
re-assessed at about 4 m above the present level
(Fig. 8). The overall curve for Paranagua then
attained elevations similar to the other Brazilian
coastal sectors (Fig. 2), suggesting that there may
not be any significant difference between the maximum Holocene sea levels along the Brazilian coast
(Angulo and Suguio, 1995).
Four dated samples of vermetid in the region
was presented by Angulo (1992, in prep.), two
list
from the Caioba tombolo and two from Mel
Island (Table 2, Fig. 4B). The samples from
Caioba, dated at 5300 years B.P. (CENA 141) and
4750 years B.P. (CENA 140), indicate the approximate maximum palaeo-sea level at the end of the
PMT, i.e., 3.45 m and 3.60 m, respectively. Those
from Mel Island dated at 3500 years B.P.
(GSC-5255) and 3300 years B.P. (CENA 143),
indicate palaeo-sea levels of 2.90 m and 2.05 m,
respectively. All CENA vermetid datings followed
standard
preparation
procedures
(such as
mechanical cleaning of secondary surface encrustations and chemical treatment for adsorbed
material), and were corrected only for their 6i3C
factor.
maximum
2nd maximum
I
----.\\\
*
\
6.0
5.5
5.0
- _\
, , @----_
6
r.:
LA
4.5
4.0
3.5
l_3~_,aximum
---__
I
3.0
---__
-r-fl-_____
2.5
2.0
1.5
1.0
0.5
Years B.f? x lo3
lXl
temporal/spatial
sea
level reconstruction
--L
temporal reconstruction
lowest 8811 level
of
*
temporal reconstruction
of lowest
sea level based on shell middens
Fig. 8. Sea-level curve for the Paranagua costal plain (Angulo and Suguio, 1995), re-assessing the position of the sea-level maximum
after the PMT.
154
R. J. Angulo, G. C. Lessa J Marine Geology 140 (1997) 141-166
3.2. Canandia coastal plain
The Holocene sea-level maximum in Cananeia
was assessed through a so-called erosional platform identified on the Pleistocene strandplain at
the southern end of Comprida Island (Suguio
et al., 1976; Martin and Suguio, 1976) (Fig. 4C).
Normally, the Pleistocene strandplain at the same
relative position attains 5-6 m in elevation,
whereas in this location it does not surpass 3-4 m.
Similar to the scenario drawn in the evolutionary
model (Fig. 6), it was hypothesised that no barrier
was formed during the Holocene transgression in
the area, and that the Pleistocene strandplain was
partially eroded at the end of the PMT (Fig. 9).
Based on the elevation of the ‘eroded’ platform,
the authors suggested that sea level at the end of
the PMT was not higher than 3.5 m.
As in Paranagua, the only evidence for the
secondary oscillations in Cananeia were shellmidden deposits. Suguio et al. (1976) and Martin
and Suguio ( 1976) presented the results of four
radiocarbon datings performed on samples from
three different shell-middens, dated at 4130 years
B.P. (Bah. 289), 4120 and 4120 years B.P. (Gif.
3436 and Bah. 303) and 3790 years B.P. (Gif.
3437). The middens from the Ararapira channel
(samples Bah. 289 and Gif. 3437, Fig. 4C), are the
only ones described by the authors. Samples Gif.
3436 and Bah. 303, from the same site, are suggested to be related to a palaeo-sea level below
+ 1.5 m. The midden where sample Gif. 3437
originated has its base at about the present high
tide level, and was interpreted as evidence of a sea
level close to the present one at about 3800 years
B.P. Sample Bah. 289 was taken from the base of
another midden situated about 0.5 m above the
present high tide level, and its age appears to
substantiate the proposed sea-level oscillation.
Martin et al. (1979b) presented the results of
another shell-midden sample (Bah. 291), dated at
3960 years B.P. and related it to a palaeo-sea level
below + 1.5 m.
Two more datings within the time frame of the
secondary sea-level oscillations are presented by
Martin et al. (1979b) for the Cananeia region,
although without detailed descriptions of the sampling sites. Sample Bah. 630 (Fig. 4C) is a piece
of wood dated at 3780 years B.P. and related to a
palaeo-sea level of +2 m. Sample Bah. 445
(Fig. 4C), made of wood detritus, was dated at
3710 years B.P. and related to a palaeo-sea level
of +0.5 m.
4. Discussion
4.1. Wave built terraces and the reconstruction of
palaeo-sea levels
For the whole Brazilian coast there are only five
palaeo-sea level indicators (oyster and vermetids)
likely to give the elevation of the sea level maximum at the end of the PMT (one in the State of
Bahia, one in the State of Rio de Janeiro, one in
the State of Sao Paulo and 2 in the State of
Parana) (Suguio and Martin, 1978a; Martin et al.,
1979b; Martin and Suguio, 1978; Angulo, in prep.).
Hitherto, in the studied area as well as in any of
other previously investigated sites lacking absolute
datings, inference of the sea-level maximum was
made upon the maximum elevations of wave-built
terraces (Fig. 2) (Suguio et al., 1976; Martin and
Suguio, 1976; Martin et al., 1988).
The elevations of the terraces are related to the
elevations of the swash limits during storms, which
in its turn depends on the wave spectrum, beach
grain size and slope, and the bathymetry of the
nearshore and the tidal range. Roep (1986) investigated the elevation of the swash limit during a
storm and during fair weather in the North Sea,
showing that palaeo-sea levels in that area should
be 2-3 m below the surface of the wave-built
terraces.
Bigarella et al. ( 1961) studied the elevation of
several beaches in the State of Parana, and verified
a direct relationship between the mean grain size
of the beach face and the elevation of the backshore in relation to MSL. Although no consideration was given to the energy level of the beaches,
Bigarella et al. ( 1961) found that coarser grain
beaches were associated with higher back-shore
elevations. For instance, a beach with mean grain
size of 0.5 mm was associated with a back-shore
elevation of 3 to 6 m above MSL, whereas a mean
grain size diameter of 0.125 mm was associated
R.J. Angulo, G.C. Lessa J Marine Geology 140 (1997) 141-166
A)
Maximum
B) Maximum
of 5100
years
B.P.
of 3500 years
: ‘.
B.P.
155
___..____......~
_,
_;.
.
C) Present
stage
m
Holocene
deposits
15 km
Pleistocene
partially
deposits
eroded
submerged
Pleistocene
Pleistocene
deposits
strandplain
Fig. 9. Morphology and sedimentary units of Comprida Island. (A) The Pleistocene strandplain during the Holocene highstand.
(B) The Holocene strandplain and the remnants of the submerged Pleistocene strandplain. (C) The present morphology (Suguio
et al., 1976)
with back-shore elevation of 2.5 to 3 m above
MSL. These results show that wave- built terraces
with different elevations can be associated with the
same MSL. They also indicate that in the State of
Parana, and possibly in the whole study area, MSL
at the end of the PMT may have been 1 to 6 m
below the average elevation of the inland-most
part of the strandplain (Angulo, 1994).
Suguio et al. ( 1976) and Martin and Suguio
( 1976), on the basis of the elevation of a proposed
Holocene strandplain (3.5 m), suggested that MSL
at the end of the PMT was between 3.5 and 4m
(Fig. 9). According to the model used by these
authors (Fig. 6) the beginning of the strandplain
formation is associated with a falling sea level, a
mechanism similar to the emergence of an offshore
bar (Hoyt, 1967). During the final phases of the
transgression,
waves eroded the top of the
Pleistocene strandplain (Fig. 9), and the Holocene
strandplain was formed during the subsequent
156
R. J. Angulo. G. C. Lessa / Marine Geology 140 (1997) 141-166
regression. Assuming that the results of Bigarella
et al. (1961) also apply to this region (mean grain
size around O.l5mm, Tessler, 1988), the +3Sm
elevation of the Holocene strandplain at the end
of the PMT would more likely be related to a sea
level lower than +2.5 m at the end of the PMT,
which is apparently too low. We believe that the
so-called eroded Pleistocene strandplain platform,
close to the estuary entrance, is actually a Holocene
strandplain formed after the PMT, associated with
a decreasing tidal prism and inlet cross-sectional
area. A visit to the area revealed that exposed
sections of the seaward strandplain along the
Cananeia channel (Fig. 4C) show epigenetically
indurated sands, which may have been the reason
for the Pleistocene classification proposed by
Suguio et al. (1976) and Martin and Suguio
(1976), similar to what occurred in the Paranagua
coastal plain.
The samples of vermetid dating at 5300 and
4750 years B.P. (Table 2) show that sea level at
the end of the PMT was about +3.5 m. In the
Paranagua coastal plain we have been gathering
an increasing amount of evidence showing that sea
level at the end of the PMT was lower than +4 m.
The evidence includes: ( 1) the seaward and lowest
side of the Pleistocene strandplain, with no signs
of in-place drowning, is about 4 m above MSL,
which is an indication that the Holocene sea-level
maximum could not have been higher than 4 m
(Lessa and Angulo, in prep.); and (2) sedimentary
structures observed on exposed cliffs at the back
of the Holocene strandplain, along with the maximum elevation of palaeo-beach deposits, indicate
that the Holocene sea-level maximum was between
3 and 4 m (Lessa and Angulo, in prep.). The ages
provided by the vermetid samples mentioned above
are about 200 and 350 years older, respectively, as
judged from the suggested time for the end of the
PMT (5100 years B.P.). Therefore is possible that
sea level may have risen slightly above + 3.5 m,
although not surpassing +4 m.
4.2. Secondary oscillations and topographic records
The existence of secondary sea-level oscillations
with amplitudes of about 4 m, would have forced
significant transgressive and regressive cycles.
Shoreline advance and retreat associated with
oscillations of decreasing amplitudes could be in
the order of a few kilometres, and would have left
records on the coastal landscape.
A transgressive scenario on a barrier coast is
commonly
associated with lagoons stranded
behind newly formed barriers. Hence, two consecutive highstands may leave behind two barriers
separated by a lagoon or at least a low-lying,
swampy area. In a time when the chronology of
the coastal landscape was still uncovered, and in
the light of the recently proposed sea-level curves,
some Brazilian researchers interpreted the actual
Pleistocene barriers/strandplains as the Holocene
PMT, and the actual Holocene (PMT) barriers/
strandplains as the one resulting from the proposed
transgression at 3500 years B.P. (Martin and
Suguio, 1976; Perrin, 1984; Muehe and Ignarra,
1984; Maia et al., 1984; Neto, 1984; Turq et al.,
1986; Muehe and Correa, 1988). In these cases,
the Pleistocene barrier/strandplain was interpreted
as completely eroded, buried by the PMT, or even
non-existent.
References to Pleistocene barrier/strandplains
were only made in studies of the large beach ridge
plains associated with river mouths (Dominguez
et al., 1981; Martin et al., 1984b; Silva, 1987).
Again accepting the occurrence of the secondary
sea-level oscillations, these investigations suggest
that the 3500 years B.P. transgression would have
either left a third barrier generation of strandplains
(Dominguez et al., 1981; Martin et al., 1984b) or
imprinted discontinuities observed in the beach
ridges (Silva, 1987).
With the aim of verifying the morphological
adjustment of the shoreface to the effects of a fall
and subsequent rise of sea level, a simulation
exercise was performed assuming the approximate
rate and amplitude of the first proposed oscillation
(3800 years B.P.). The simulation was carried out
using the Shoreface Translation Model (Cowell
et al., 1992, 1995; Roy et al., 1995), which involves
the translation of a pre-determined barrier form
across a substrate under the influence of a falling
or rising sea level, while maintaining the shoreface
shape. The values for the environmental variables
used in the model (wave height, shoreface profile,
storm surge height, longshore sediment imbalance,
R. J. Angulo. G. C. Lena J Marine Geology I40 (1997) 141-166
and depth at surf base) were those from the coast
of the State of Parana. A longshore sediment
imbalance of + 15 m3 m-’ year-i was assumed
based on the coastal progradation rates assessed
at Pontal do Sul (Fig. 4) (Soares et al., 1994). The
simulation started at 5100 years B.P. with a sea
level 5 m above the present MSL and a barrier
500 m wide (Fig. lOa). In Fig. lob sea level fell
2 m below the present elevation at 3800 years B.P.
During this period the barrier became some 9000 m
wider with removal of sediment from the lower
shoreface and transportation to the upper shoreface. Subsequently, sea level rose again to + 3 m,
and sediments were eroded from the upper shoreface and deposited on the lower shoreface.
Additionally, a terrace 2 km wide was built in the
back-shore (Fig. 10~). The next fall of sea level
towards the present elevation widened the barrier
once more (Fig. 10d).
The simulation shows that the morphological
record associated with the secondary oscillations
would more likely form a well defined terrace
(‘encroached barrier’, Roy et al., 1995) than a
barrier-lagoon system. The width of the terrace is
heavily dependent on the longshore sediment
imbalance; a simulation with no sediment imbalance resulted in the same topography but with a
terrace 500 m wide. It is suggested that the morphological change observed in the simulation
would be characteristic of most of the Brazilian
barrier coasts. The existence of particular topographic features at strandplains associated with
large river mouths, can be explained by lateral spit
growth or even the emergence of swash bars downdrift of the river outlet (Dias, 1981). Both processes can account for many isolated inland
depressions characteristic of these wave-dominated
river mouths. In regard to the interruption of
beach ridge formation,
this could easily be
explained by fluctuations in the sediment supply
associated with the dynamics of the river mouths.
4.3. The secondmy
oscillations andpulaeo-sea
level
indicators
With the exception of one natural shell deposit
found in the Caioba tombolo and two other
samples of wood and wood detritus from Cananeia
157
(Table 2), where diverging interpretations exist, all
the evidence supporting secondary sea-level oscillations in the study area comes from the dating of
shell-middens.
The age (3830 years B.P.) and genera (Donas
and Arca) of the shells from the Caioba tombolo,
when used with the sea-level curve of Fairbridge
( 1962), led Bigarella ( 1971) to conclude that the
shells were deposited above the present sea level.
However, Bigarella (1971) did not suggest the
depositional environment, nor determined whether
the shells were transported or found in living
position, and failed to propose the generating
mechanism of the observed sedimentary succession
to strengthen his assertion. In light of the transgressive nature of the sedimentary sequence, where
muds underlie marine sand, Martin et al. (1988)
interpreted the age and the nature of the deposit
as evidence of a sea level lower than the present
sea level. The interpretation of Bigarella ( 1971 )
seems unreasonable as it is difficult to envisage the
deposition of mud at the mouth of a wave-dominated estuary. The present surface sediment distribution at the mouth of the estuary shows the
deposition of medium to coarse sands in most of
the area, as indicated by the presence of
large-scale bedforms observed on vertical aerial
photographs. The interpretation of Martin et al.
(1988) is more reasonable, given the sequence of
the sedimentary strata. Nevertheless, as has been
shown in the simulation exercise above, the formation of a transgressive sequence including a backbarrier lagoon is unlikely. We interpret the stratigraphic profile as resulting from the transgression
that occurred until 5100 years B.P., and the subsequent regression. The transgression caused the
translocation of the barrier coastline over palaeolagoonal/estuarine deposits (mud sequence) that
became exposed to erosion on the shoreface
towards the end of the PMT. The subsequent sealevel fall promoted the progradation of the coastline and the burying of the mud by a thin layer of
sand. Hence, the shells could indicate the approximate time when the layer became buried. Presently,
a patch of similar mud deposit is found parallel to
the shoreline beneath a couple of centimetres of
sand, at a depth similar (- 2 m) to the mud found
158
R. J. Angulo,
12
G. C. Lessa / Marine
Geology
140 (1997)
141-166
,
5100
years
B.P.
a
I
I
1
I
I
36
27
1%
9
0
12
4000
years
b
B.P.
-24
I
I
/
I
I
36
27
18
9
0
12
3500
E
.a
years
C
B.P.
0
5
i
5
-12
w
-24
I
-
I
I
I
I
I
36
27
10
9
0
12
2800
E.
.-5
5
5
years
d
B.P.
0
-12
ii
-24
I
I
I
I
I
36
27
18
9
0
Distance
(km)
Fig. 10. A simulation of the two-dimensional morphological changes of the Holocene barrier in the Paranaguk coastal plain considering
one secondary oscillation after the end of the PMT.
R.J. Angulo, G.C. Lessa J Marine Geology 140 (1997) 141-166
in the tombolo (C.R. Soares and C. Borzone, pers.
commun., 1995).
It is difficult to discuss samples Bah. 630 and
Bah. 445 (Table 2) because there is no information
about the sampling site or any indication on how
the palaeo-sea level was estimated. However, it is
worth noting that sample Bah. 630 gives a palaeolevel of +2 m at the time of a proposed secondary
oscillation.
The two datings (3160 years B.P. and 2970 years
B.P.; Bah-1277 and Bah-1278) derived from
samples of mollusc shells (mostly Anomalocardia
brasiliana) presented by Martin et al. (1988) indicate a sea level about 1 m above the present
(Angulo, 1993). Again, these samples indicate sea
levels higher than those expected around the
secondary oscillation (3000&2700 years B.P.).
4.4. The shell-midden data
As shown in Table 1, the majority of the data
supporting the secondary sea-level oscillations
come from shell-midden deposits. Two types of
problems were met during the re-evaluation of the
shell-midden data as palaeo-sea level indicators.
The first problem occurs in the interpretation of
the elevation of the base of the shell-midden. The
second problem results from the conflicts between
shell-midden data and other indicators, or even
within the shell-midden data.
Misinterpretation of the actual elevation of the
base of the middens was, at least in one case, due
to slumping over erosive channel margins. Sample
Gif. 3437 from Cananeia was interpreted by
Suguio et al. ( 1976) as an indication of a sea level
not higher than the present one at 3790 years B.P.
The sample was collected from the base of the
shell-midden, and interpreted to be at the same
elevation as the present high tide level. A field
inspection of that site revealed that part of the
midden has slumped over the edge of the channel.
The base of the deposit is actually sitting on top
of a palaeo-lagoonal terrace, approximately 1.5 m
above the mean spring high tide level. In another
instance, Martin et al. (1988) misinterpreted the
maximum tidal elevation, under-estimating the
palaeo-sea level by more than 1 m (Angulo and
Suguio, 1995).
159
A couple of cases exist regarding conflicting
shell-midden data. Martin et al. ( 1988), in the
analysis of the Rosas’ Island shell-midden, corroborates the interpretation of Laming-Emperaire
(1968) by stating that sea level was rising at 3100
years B.P. This interpretation contrasts with the
proposed curves (Martin and Suguio, 1976; Suguio
et al., 1985), at both local and regional scales,
because it would mean some 500 years delay in
the proposed transgression between 3800 and 3500
years B.P. It is difficult to imagine a significant
sea-level rise in Paranagua concomitant with a sealevel fall in Cananeia or Itajai (Fig. l), just a few
hundred kilometres away. Moreover, there are
some dated samples from the same region that
indicate sea levels higher than at present: ( 1) two
samples of mollusc shells, Bah-1269 and Bah-1270
(Table 2) point to a sea level 1 m higher relative
to the present elevation at 2680 years B.P. and
2650 years B.P., respectively; (2) two vermetid
samples dated by Angulo (1992, in prep.), show
that sea level was 2.90 m and 2.05 m above the
present elevation at 3500 and 3300 years B.P.,
respectively (Table l), suggesting that sea level
would already have attained a highstand and
would be falling before 3100 years B.P.
A sample collected in the lower portion of a
shell-midden in Boguacu River (the Guaratuba
coastal plain) (Fig. 4A) was dated at 3290 (Bah.
1273) (Martin et al., 1988). The midden was
located on top of a palaeo-lagoonal surface elevated 1.3 m above the present MSL. This was used
by Martin et al. (1988) as an indication that the
sea-level maxima after the supposed transgression
between 3800 and 3500 was not higher than 1.3 m.
Vermetid data from the area (Table 2) show that
at 3500 and 3300 years B.P., sea level was at 2.90
and 2.05 m above the present MSL, respectively
(Table 2).
These inconsistencies call attention to the danger
of the utilization of shell-middens as palaeo-sealevel indicators. Most of the middens considered
here were built on top of palaeo-lagoonal deposits,
which are likely to suffer subsidence due to compaction and dewatering. Therefore, it is possible
that the present surfaces are lower than the original
ones (Martin et al., 1986; Dominguez et al., 1990).
Moreover, there is no supporting evidence to the
160
R.J. Angulo, G. C. Lessa / Marine Geology 140 (1997) 141-166
Years B.P. x IO3
Fig. 11. Elevation of the published palaeo-sea-level indicators in Brazil derived from vermetid radiocarbon dates (see Table 3). Shaded
areas indicate the time for the proposed secondary oscillations and the line is a 4th-order polynomial best fit.
fact that the shell-middens were always built above
the high tide level; only the fact that it appears to
be logical from our viewpoint is not enough to
dispute the various possibilities that could have
led an unknown culture to initiate a mound under
water. Therefore, this criterion can not be regarded
as a reliable evidence for palaeo-sea levels.
5. Is there a common Brazilian sea-level curve?
Despite the noise that local tectonic behaviour
may impinge on the palaeo-sea-level records of
any site, as in Salvador (Martin et al., 1984a),
there appear to be few differences between the
proposed Brazilian sea-level curves. Of primary
importance, however, is the suggested rise in the
elevation attained by sea level northward along
the Brazilian coast at the end of the PMT (Martin
et al., 1985). In Cananeia and Paranagua, the sea
level reached altitudes between + 3.5 m and +4 m
(this paper), while it may have attained +4 m to
+ 5 m in Salvador and Angra dos Reis (Martin
et al., 1979a,b; Martin and Suguio, 1989)
(Fig. 2a,d), as given by absolute datings. With the
information available at present, it seems possible
that a single curve could represent the trend of the
eustatic oscillation along the Brazilian coast with
an error of f 1.0 m. Indeed, the secondary oscillations discussed in this paper were proposed to
occur at the same time throughout the coast
(Suguio et al., 1985). Therefore, the available
palaeo-sea level data may cluster along the mean
of the proposed eustatic oscillations.
Nevertheless, there are many problems with the
certainty of the dated indicators that come from
the natural sedimentary deposits (the majority of
them), which may indicate erroneous elevation
relative to sea level during deposition. Except for
problems involving carbonate recrystallization, the
vermetids are widely recognized as an accurate
palaeo-sea-level indicator (van Andel and Laborel,
1964; Delibrias and Laborel, 1969; Laborel, 1979,
1986; Angulo, 1993). These organisms occur in
the lower quarter of the intertidal area, between
neap and spring low tides, and can provide mean
sea levels with a precision of 0.1 and 1.Om, in the
best (low tide range and wave height) and worst
(high tide range and wave height) scenarios,
respectively (Laborel, 1986).
Fig. 11 plots the published vermetid dates along
the Brazilian coast (Table 3). The data cover the
R.J. Angulo, G.C. Lessa J Marine Geology 140 (1997) 141-166
161
Table 3
Datings from vermetid samples published in Brazil
Local
Latitude
(south)
Longitude
(west)
Age
(years B.P.)
Ponta de Itapiruba (SC)
Mosuaba (RJ)
Rio Vermelho (BA)
Ilha Grande (RJ)
Ponta de Itapiruba 1 (SC)
Ilha dos Currais (PR)
Morro da Tapera (SP)
Ponta de Itapituba 5 (SC)
Picinguaba (SP)
Amaralina (BA)
Rio Vermelho (BA)
Porto da Barra (BA)
Praia de Pernambuco (SP)
Morro do Cristo (BA)
Ponta de Martins de SB (SP)
Porto da Barra (BA)
Tarituba (RJ)
Ponta do Ji 2 (SC)
Praia de ArmaqLo (SC)
Poqo de Anchieta (SP)
Cabo de Santa Marta (SC)
Cabo San Agostinho (PE)
Passagem 3 (SC)
Ponta da Ilhota 1 (SC)
Morro da Enseada (SP)
Ilha dos Currais (PR)
Rio Vermelho (BA)
Cabo de Santa Marta 7 (SC)
Parati-Mirim (RJ)
Amaralina (BA)
Morro do Cristo (BA)
Ponta da Ilhota 2 (SC)
Cabo de Santa Marta 1 (SC)
Mangaratiba (RJ)
Ilha Grande (RJ)
Ponta da Galheta 1 (SC)
Cabo de Santa Marta 4 (SC)
Cabo San Agostinho (PE)
Ponta do Ji 1 (SC)
Praia de Mambucaba (RJ)
Baia da Fortaleza (SP)
Morro da Tapera (SP)
Rio Vermelho (BA)
Morro da Jurkia (SP)
Cabo Santo Agostinho (PE)
Ponta da Ilhota 3 (SC)
Cabo de Santa Marta 6 (SC)
Ponta da Galheta 2 (SC)
Morro S%o Loureqo (SP)
Ilha do Aratijo (RJ)
Rio Vermelho (BA)
28”20’18”
23”Ol’OO”
13”00’32”
23”10’?
28”20’18”
25”44’07”
25’11’36”
28’20’18”
23”22’36”
13’00’32”
13-00’32”
12”59’48”
23”58’24”
14”48’30”
23”37’54”
12”59’48”
23”02’54”
28”25’25”
25’47’10”
24’12’00”
28”36’18”
08”20’12”
28”30’19”
28”32’10”
23”49’12”
25”44’07”
13”00’32”
28”36’18”
23’14’48”
13’00’32”
14”48’30”
28”32’10”
28”36’8”
22”58’12”
23”10’?
28”34’00”
28”36’18”
08”20’12”
28”25’25”
23”02’12”
23’30’00”
25”11’36”
13”00’32”
23”45’54”
08’20’12”
28”2’0”
28”36’18”
28”34’00”
23”47’48”
23”09’12”
13”00’32”
48”41’57” 19Ok65
44”13’18” 230 k 60
38”30’10” 365k115
44”10?
380 + 90
48”41’57” 450+65
48”21’51” 490 k 60
47”58’18” 500 + 60
48”41’57” 570 k 65
45”50’24” 62Oi 120
38”28’04” 660 + 80
38”30’00” 700* 110
38”31’48” 770& 125
46”11’18” 790 * 90
39’01’31” 830&90
45”23’24” 865 +90
38”31’48” 950 k 125
44”36’42” 975 + 80
48”44’15” 980 rt 65
48”36’42” 1045*75
46”48’36” 1105*115
48”48’54” 1180170
34”56’00” 1190+ 130
48’44’45” 12OOk70
48”45’36” 121Ok70
46”02’12” 1270& 130
48’21’51” 1280+60
38”30’00” 136Ok 120
48”48’54” 137Ok60
44”37’36” 1490k 80
38”28’04” 1495+140
39”01’31” 1560f80
48”45’36” 1580+70
48”48’54” 161Ok 110
44”02’48” 163Ok65
44”10’?
167Ok 100
48”47’11” 169Ok90
48”48’54” 1730*70
34”56’00” 1750+ 170
48”44’15” 1840_+100
W33’12”
184Ok90
45”08’30” 184Ok 120
47”58’18” 1890f60
30”30’00” 1975+80
45”48’06” 1985k 120
34”56’00” 2OlOk 160
48’45’36” 2060 + 70
48”48’54” 2080 + 60
48”47’11” 2210+70
45”59’42” 2240 _+90
44”41’48” 2300 + 85
38’30’00” 2310+115
Palaeo-level
(m)
Lab. Ref. No
Source
+0.20*0.5
+0.50f0.40
+0.50*0.50
+0.50*0.50
+0.20*0.50
+0.20+0.50
+0.30~0.50
+0.20_+0.50
+ 0.40 * 0.40
+0.8OkO.50
+0.7oi_o.50
+ 1.00~0.50
+1.40*0.40
+0.80*0.50
+ 1.00~0.40
+ 1.00+0.50
+0.70+0.40
+0.40*0.50
+2.55 +0.50
+ 1.6OkO.40
+0.20*0.50
+1.6OkO.50
+0.20+0.50
+0.20+0.50
+ 1.00~0.40
+1.15*0.50
+ 1.50*0.50
+0.25*0.50
+ 1.oo * 0.40
+1.2OkO.50
<+2
+ 1.05*0.50
+ 1.05&0.50
+0.80+0.40
+ 1.50+0.50
+0.80+0.50
+1.55*0.50
+ 1.40*0.50
f0.55 +0.50
+1.50
+ 1.20 * 0.40
+ 1.3o_fo.50
+ 2.00 * 0.50
+ 1.50*0.40
+4.83 +0.50
+ 1.10*0.50
+0.35*0.50
+1.15+0.50
+ 1.6OkO.40
+ 1.40+0.40
+2.80+0.50
CENA-184
Bah-483
Bah-507
Gif-1061
CENA-181
CENA-137
CENA- 136
CENA-185
Bah-487
Bah-595
Bah-509
Bah-570
Gif-3848
Bah-574
Bah-463
Bah-569
Bah-478
CENA-190
GX-14061
Bah-325
CENA-173
Shell-Al 7
CENA-194
CENA-186
Bah-356
CENA-138
Bah-588
CENA-175
Bah-482
Bah-597
Bah-573
CENA-187
CENA-169
Bah-499
Gif-1060
CENA-176
CENA-172
Shell-A21
CENA-189
Bah-471
Bah-468
CENA-135
Bah-506
Bah-358
Bah-1236
CENA-188
CENA-174
CENA-177
Bah-357
Bah-470
Bah-508
Angulo et al., in prep.
Martin and Suguio, 1978
Martin et al., 1979a
Delibrias and Laborel, 1969
Angulo et al., in prep.
Angulo, in prep.
Angulo, in prep.
Angulo et al., in prep.
Martin and Suguio, 1978
Martin et al., 1979a
Martin et al., 1979a
Martin et al., 1979a
Suguio and Martin, 1978a
Martin et al., 1979a
Martin et al.. 1979b
Martin et al., 1979a
Martin and Suguio, 1978
Angulo et al., in prep.
Angulo, 1989
Suguio and Martin, 1978a
Angulo et al., in prep.
van Andel and Laborel, 1964
Angulo et al., in prep.
Angulo et al., in prep.
Suguio and Martin, 1978a
Angulo, in prep.
Martin et al., 1979a
Angulo et al., in prep.
Martin and Suguio, 1978
Martin et al., 1979a
Martin et al.. 1979a
Angulo et al., in prep.
Angulo et al., in prep.
Martin and Suguio, 1978
Delibrias and Laborel, 1969
Angulo et al., in prep.
Angulo et al., in prep.
van Andel and Laborel, 1964
Angulo et al., in prep.
Martin and Suguio, 1978
Suguio and Martin, 1978a
Angulo, in prep.
Martin et al., 1979a
Suguio and Martin, 1978a
Dominguez et al., 1990
Angulo et al., in prep.
Angulo et al., in prep.
Angulo et al., in prep.
Suguio and Martin, 1978a
Martin and Suguio, 1978
Martin et al., 1979a
162
R.J. Angulo, G.C. Lessa / Marine Geology 140 (1997) 141-166
Table 3 (continued)
Local
Latitude
(south)
Longitude
(west)
Cabo de Santa Marta 2 (SC)
Cabo de Santa Marta 3 (SC)
Cabo Frio (RJ)
Itaparica (ES)
Praia da Enseada (SP)
Passagem 2 (SC)
Gaibu (PE)
Coroa Grande (RJ)
Ponta Azeda, Ilhabela- (SP)
Gaibu (PE)
Arraial do Cabo (RJ)
Frade (RJ)
Cabo San Agostinho (PE)
Ponta da Galheta 3 (SC)
Ponta da Galheta 5 (SC)
Pedra Oca (BA)
Porto da Barra (BA)
Mangaratiba (RJ)
Ilha do Mel (PR)
Buzios (RJ)
Buzios (RJ)
Ilha Grande (RJ)
Ilha do Mel (PR)
Ponta do Retiro (RJ)
Praia da Guaiuba (SP)
Cabo San Agostinho (PE)
Gaibu (PE)
Cabo Frio (RJ)
Ponta de Itapiruba 2 (SC)
Sao F’“. do Sul (SC)
Ponta do Ji 3 (SC)
Ponta de Itapiruba 3 (SC)
Ponta Azeda, Ilhabela- (SP)
Ponta Santo Amaro (SP)
Passagem 1 (SC)
Caioba (PR)
Morro da Sereia (BA)
Santos (SP)
Porto da Barra (BA)
Caioba (PR)
Ponta da Galheta 4 (SC)
Poco de Anchieta (SP)
28’36’18”
28”36’18”
22”54’16”
20”22’49”
23”29’36”
28”30’9”
08”19’05”
22”55’42”
23”44’54”
08’19’05”
22”56’42”
22=58’42”
08”20’12”
28”34’0”
28”34’00”
48”48’54”
48”48’54”
42”OO’OO”
41”41’51”
45’05’54”
48’44’45”
34’56’43”
43”50’36”
45”20’48”
34”56’43”
42”01’12”
44”26’18”
34”56’00”
48”47’11”
48”47’11”
Age
(years B.P.)
2340+520
2340 k 80
2400 + 95
2450 k 95
2530+ 130
2570&70
257Oi 160
2595&132
2665k130
2670 k 170
2680+ 180
2695+ 130
279Ok150
2820 k 70
291Ok70
3030t 120
12”59’48” 38”31’48
2990+ 135
22”51’48” 44”02’36” 3255klOO
25’32’54” 48’17’30” 33OOk60
22’46’12” 41’53’00” 3360_+180
22’44’18” 41”51’18” 342Ok 180
23”lO’
44”lO’
3420+110
25”32’20” 48”17’26” 35OOk60
21”21’34” 40”57’37” 3620 + 150
24”00’54” 46” 17’42” 3625+ 100
08”20’12” 34’56’00” 366Ok 170
08’19’05” 34’56’43” 3870 i. 170
22”54’16” 42”OO’OO” 3900*110
28”20’18” 48”41’57” 3920 k 70
26’13’42” 48”29’53” 4015*90
28”25’25” 48”44’15” 4060 f 70
28”20’18” 48”41’57” 4340 * 70
23’44’54” 45”20’48” 4455 * 145
23”59’37” 46”1221”
448Oi 180
28”30’19” 48”44’45” 4600 + 70
25’51’06” 48’32’04” 4750 + 70
4970 * 150
23‘52’18” 46”50’48” 5010+ 120
12”59’48” 38”51’48” 5195*110
25”51’06” 48”32’04” 5300 * 70
28”34’00” 48”47’11” 541o*so
24”32’00” 46”48’36” 628Oi135
last 6200 years, and show a consistent
trend of
falling sea level after a maximum
around
5100
of a secondary
years B.P., with no indication
oscillation.
Except for the shell-middens,
the only
evidence of a sea-level fall between 4100 and 3800
years B.P. in the whole Brazilian coast are the
shells within
beach-rocks
found
in Salvador
Palaeo-level
(m)
Lab. Ref. No
Source
+0.85*0.50
+0.95*0.50
+2.00&0.50
+2.OO_fO.50
+ 1.80*0.40
+ 1.00+0.50
+2.56iO.50
+ 1.6OkO.40
+0.80+0.40
+ 1.16kO.50
+1.80_+0.40
+ 1.50*0.40
+2.20+0.50
+0.75*0.50
+2.00*0.50
>3
+ 3.00 kO.50
+ 1.70+0.40
+2.05 +0.50
+ 1.80+0.40
f2.10k0.40
+ 3.00 + 0.50
+2.90*0.50
+3.00+0.40
+2.6OiO.40
+ 2.60 f 0.50
+4.36+0.50
+3.00+0.50
+ 1.05*0.50
+3.05+0.50
+ 2.00 + 0.50
+ 1.75kO.50
+ 1.90 +0.40
t 3.00+0.50
+ 1.95kO.50
+3.60+0.50
t2.5
t 3.40&0.40
+4.70+0.50
t 3.45 + 0.50
+2.10*0.50
t l.3OkO.40
CENA-170
CENA-171
Gif-1935
Gif-1933
Bah-469
CENA-193
Bah-1237
Bah-473
Bah-460
Bah-1222
Bah-1298
Bah-465
Shell-Al6
CENA-178
CENA-180
Bah-542
Bah-568
Bah-472
CENA-143
Bah-1306
Bah-1304
Gif-1059
GSC-5255
Bah- 1008
Bah-352
Shell-A22
Bah-1221
Gif-1934
CENA-182
GX- 14060
CENA-191
CENA-183
Bah-461
Gif-2147
CENA-192
CENA- 140
Bah-579
Bah-354
Bah-567
CENA-141
CENA-179
Bah-350
Angulo et al., in prep.
Angulo et al., in prep.
Delibrias and Laborel, 1969
Delibrias and Laborel, 1969
Suguio and Martin, 1978a
Angulo et al., in prep.
Dominguez et al., 1990
Martin and Sugnio, 1978
Suguio and Martin, 1978a
Dominguez et al., 1990
Martin and Suguio, 1989
Martin and Suguio, 1978
van Andel and Laborel, 1964
Angulo et al., in prep.
Angulo et al., in prep.
Bittencourt et al., 1979
Martin et al., 1979a
Martin and Suguio, 1978
Angulo, in prep.
Martin and Suguio, 1989
Martin and Suguio, 1989
Delibrias and Laborel, 1969
Angulo, 1992
Martin and Suguio, 1989
Suguio and Martin, 1978a
van Andel and Laborel, 1964
Dominguez et al., 1990
Delibrias and Laborel, 1969
Angulo et al., in prep.
Angulo, 1989
Angulo et al., in prep.
Angulo et al., in prep.
Suguio and Martin, 1978a
Delibrias and Laborel, 1969
Angulo et al., in prep.
Angulo, in prep.
Martin et al., 1979a
Suguio and Martin, 1978a
Martin et al., 1979a
Angulo, in prep.
Angulo et al., in prep.
Suguio and Martin, 1978a
(Martin et al., 1979a) (Fig. 2a). Evidence to the
contrary are five vermetid samples showing that
sea level was above + 1 m during that interval
(Fig. 11 and Table 3). It should be pointed out
that the sample at +4.5 m may have been made
younger by post-depositional
calcification,
and its
height could actually be related to the maximum
R. J. Angulo, G. C. Lessa / Marine Geology 140 ( 1997) 141-166
PMT at 5100 years B.P. (Dominguez et al.,
1990).
Palaeo-sea level interpretations based on shells
from beach-rocks were based on primary sedimentary structures and textural grain size changes
in the sediments (Flexor and Martin, 1979). It is
argued that similar grain-size textural changes and
structures, such as inclined plane-parallel stratifications either dipping sea- or landwards, can be
produced in intertidal and subtidal environments,
up to depths of 2-3 m (Short, 1984; Angulo, 1994).
Therefore, palaeo-sea levels derived from such
sources can be offset by several metres.
In regard to the time interval of the second
proposed sea-level fall (3000-2700 years B.P.), we
stress that it is based on data from only one site
(Martin et al., 1979b) (Fig. 2a). The evidence is
again a shell found within a beach-rock in the
State of Bahia. In this case, eight vermetid dates
of this age frame indicate that sea level was above
+ 1 m (Fig. 11 and Table 3). In short these vermetid data show a smooth decline in sea level
(Fig. 11). Only in Salvador and Ilheus is there
evidence from sources other than shell-middens of
a sea level lower than present. However, the nature
of the dated material makes it prone to misinterpretation.
Observations in the Paranagua and Cananeia
regions show that maximum sea level at the PMT
was not higher than +4.0 m, and was more likely
around 3.5 m. A vermetid sample from the Santos
coastal plain gave a palaeo-sea level indication of
about + 3.4 m some 100 years after the end of the
PMT (Fig. lob), and is in agreement with our
proposed elevation for the maximum PMT. Three
vermetid
datings from the northern
coast
(Salvador, BA and Recife, PE) (Martin et al.,
1979a; Dominguez et al., 1990) indicate that the
Holocene sea-level maximum was higher than in
the south, as has been postulated by Martin
et al. (1985).
6. Conclusion
In the State of Parana and south of Sao Paulo,
vermetid samples as well as the elevation of the
Pleistocene strandplains suggest that sea-level max-
163
imum at the end of PMT was around + 3.5 m, but
not higher than +4 m.
The proposal of secondary sea-level oscillations
along the Brazilian coast in the late Holocene has
caused problems in the interpretation of the coastal
geomorphology, especially due to the premise that
such oscillations would be able to develop a new
strandplain or barrier/lagoon systems. Given the
existence of these sea-level oscillations, a numerical
model suggested that the morphological response
of the shoreline would more likely be a beach
terrace encroached against the pre-existing barrier
than another barrier/lagoon system.
Evidence of the secondary sea-level oscillations
in the State of Parana and south of the State of
Sao Paulo, based exclusively on shell-midden data,
is inconsistent and contradictory. Shell-middens
are not reliable palaeo-sea level indicators, especially when they are located on palaeo-estuarine
sediments, which are subject to compaction and
dewatering due to its own load. Also, it is risky to
assume that middens would be only built above
high-tide levels, since the cultural aspect of an
ancient population is difficult to assess.
An analysis of the vermetid data available in
the literature for the Brazilian coast (93 samples)
points to a smooth decline of the sea level since
the end of the PMT at 5100 years B.P. Accordingly,
the data do not support the existence of the
secondary oscillations, or at least oscillations with
a range of 4-5 m. Nine of the samples fall in the
intervals of the proposed oscillations, all indicating
palaeo-sea levels higher than 1 m. The new trend
suggested by the vermetid sea-level curve is more
similar to the trends detected in other coastal
regions of the Southern Hemisphere, where a
smooth decline of sea level is observed after the
Holocene post-glacial sea-level maximum.
Acknowledgements
We are thankful to Federico Ignacio Isla,
Stephen Meyers, Paulo Cesar Giannini, Kenitiro
Suguio and C.M. Clapperton for their comments
on the manuscript. Berenice Valle is acknowledged
for the drawing of most of the diagrams. The
authors received financial support from the
164
R. J. Angulo, G. C. Lessa 1 Marine Geology 140 ( 1997) 141-I 66
Brazilian Research Council (CNPq) and the
FINEP/PADCT-UFPR
project ‘Evolu@o Geo16gica e Mineraliza@es-3’ (No. 65.91.03.03.00).
References
Angulo, R.J., 1989. Fossil Vermetidae between latitudes 25”34’S
and 27”09’S, State of Parana and Santa Catarina - Brazil
Int. Symp. Global Changes in South America During the
Quaternary, Sao Paulo, Spec. Publ. 1, pp. 2633268.
Angulo, R.J., 1992. Geologia da Planicie Costeira do Estado
do Parana. Ph.D. Thesis, Instituto de Geociencias, Universidade de SBo Paulo, 332 pp.
Angulo, R.J., 1993. Indicadores biologicos de paleoniveis
marinhos quatemarios na costa paranaense. Bol. Parana.
Geocien. 41, l-34.
Angulo, R.J., 1994. Indicadores morfologicos e sedimentologices de paleoniveis marinhos quatemarios na costa paranaense. Bol. Parana. Geocienc. 42, 185-202.
Angulo, R.J., (in prep.). Radiocarbon datings from the State
of Parana and paleo-sea level reconstructions.
Angulo, R.J., Giannini, P.C.F. 1997. Varia@o do nivel relativo
do mar nos ultimos dois mil anos na regiao sul do Brasil:
Uma discussao. Bol. Parana. Geocien. 44 (in press)
Angulo, R.J., Suguio, K., 1995. Re-evaluation of the Holocene
sea-level maxima for the State of Parana, Brazil. Palaeogeogr., Palaeoclimatol., Palaeoecol. 113, 385-393.
Angulo, R.J., Giannini, P.C.F., Suguio, K., Pessenda, L.C.R.
(in prep.). Varia@o nivel relativo do mar nos ultimos 5500
anos na regiao de Laguna-Imbituba (Santa Catarina), corn
base em datagoes radiocarbonicas de tubos de vermetideos.
Barcelos, J.H., 1975. Sedimenta@ e Subambientes Deposicionais da Ilha Comprida, Sao Paulo. M.Sc. Thesis, Instituto
de Geociencias, Universidadde de Slo Paulo, 155 pp.
Bigarella, J.J., 1946. Contribui@o ao estudo da planicie litoranea do Estado do Parana. Arq. Biol. Tecnol. 1, 75-l 11.
Bigarella, J.J., 1971. Variagdes climaticas no Quaternario Superior do Brasil e sua data@0 radiomttrica pelo metodo do
carbon0 14. Paleoclimas 1, l-22.
Bigarella, J.J., Salamuni, R. and Marques F3, P.L. 1961.
Metodo para avalia$io do nivel oceanico a Cpoca da
forma@0 dos terraGos de constru@o marinha. Boletim Paranaense Geogratia, 4- and 5: 1l- 115.
Bigarella, J.J., Becker, R.D., de Matos, D.J., Werner, A. (Eds.),
1978. A Serra do Mar e a por@o oriental do Estado do
Parana: urn problema de seguranCa ambiental e national.
Gov. Par./SEPL/ADEA, Curitiba, 249 pp.
Bittencourt, A.C. da S.P., Martin, L., Vilas Boas, G. da S.,
Flexor J.M., 1979 Quatemary marine formations of the coast
of the State of Bahia (Brazil). Proc. Int. Symp. Coastal Evolution in the Quaternary, SBo Paulo, 1979. SLo Paulo,
pp. 232-253.
Cowell, P.J., Roy, P.S., Jones, R.A., 1992. Shoreface translation
model: computer simulation of coastal-sand-body response
to sea level rise. Math. Comput. Simulation 33, 603-608.
Cowell, P.J., Roy, P.S., Jones, R.A., 1995. Simulation of large
scale coastal change using a morphological behaviour model.
Mar. Geol. 126, 45561.
Delibrias, C., Laborel, J., 1969. Recent variations of the sea
level along the Brazilian coast. Quaternaria 14, 45-49.
Dias, G.T.M., 1981. 0 compolexo deltaico do rio Paraiba do
Sul (Rio de Janeiro). IV Simposio Brasileiro do Quatemario,
IV Brazilian Quaternary Symp. Spec. Publ. 2, CTCQ/SBG,
Rio de Janeiro, pp. 58-88.
Dominguez, J.M.L., Bittencourt, A.C.S.P., Martin, L., 1981.
Esquema evolutivo da sedimenta@ quaternaria nas feicdes
deltaicas dos rios Sao Francisco (SE/AL), Jequitinhonha
(BA), Dote (ES) e Paraiba do Sul (RJ). Rev. Bras. Geocien.
11 (4) 2277237.
Dominguez, J.M.L., Bittencourt, A.C.S.P., Leao, Z.M.A.N.,
Azaevedo, A.E.G., 1990. Geologia do Quatemario costeiro
do estado de Pernambuco. Rev. Bras. Geocien. 20 (l-4),
208-215.
Fairbridge, R.W., 1962. World sea level and climatic changes.
Quaternaria 6, 111-134.
Flexor, J.M., Martin, L., 1979. Sur l’utilisation des grts
coquilliers de la region de Salvador (Bresil) dans la reconstruction des lingnes de rivages Holocbnes. Proc. Int.
Symp. Coastal Evolution in the Quatemary. IGCP, Sao
Paulo, pp. 3433355.
Hoyt, J.H., 1967. Barrier island formation. Geol. Sot. Am. Bull.
78, 112551136.
Isla, FL, 1989. Holocene sea-level fluctuation in the Southern
Hemisphere . Quat. Sci. Rev. 8, 3599368.
Kraft, J.C., John, C.J., 1979. Lateral and vertical facies relations
of transgressive barrier. Am. Assoc. Pet. Geol. Bull. 63,
2145-2163.
Laborel, J., 1979 Fixed marine organisms as biological indicator
for the study of recent sea level and climatic variations along
the Brazilian tropical coast. Proc. Int. Symp. Coastal Evolution in the Quatemary. IGCP, Sao Paulo, pp. 193-211.
Laborel, J., 1986. Vermetid gastropods as sea-level indicators.
In: van de Plassche, 0. (Ed.), Sea-Level Research: A Manual
for the Collection and Evaluation of Data. Geo Books, Norwich, pp. 281-310.
Laming-Emperaire, J., 1968. Missions archeologiques franqaises au Chili austral et au Bresil meridional: datations de
quelques sites par le radiocarbone. J. Sot. American. 57,
77-99.
Lessa, G.C., Angulo, R.J., 1995. A framework for the stratigraphy and evolution of the Paranagua coastal plain-Parana,
Brazil. In: Anais V Congress0 da Associa@o Brasileira de
Estudos do Quaternario. Proc. VII Congress of the Brazilian
Association of Quaternary Studies, ABEQUA, Niteroi,
pp. 92-98.
Lessa, G.C. and Angulo, R.J. (in prep.). A 3-D model for the
evolution of the Paranagua coastal plain.
Maia, M.C.A.C., Martin, L., Flexor, J.M., Azevedo, A.E.G.,
1984. Evol@o holocenica da planicie costeira de Jacarepagua (RJ). Proc. XXX111 Bras. Geol. Congr., SBG, Rio de
Janeiro, 1, pp. 105-118.
R.J. Angulo, G.C. Lessa J Marine Geology 140 (1997) 141-166
Martin, L., Suguio, K., 1976. 0 Quatemario marinho do litoral
do Estado de Slo Paulo. Proc. XIX Congr. Bras. Geol.,
SBG, Belo Horizonte (MG), 1, pp. 281-294.
Martin, L., Suguio, K., 1978. Excursion rout along the coastline
between the town of Canantia (State of SPo Paulo) and
Guaratiba outlet (state of Rio de Janeiro). Int. Symp.
Coastal Evolution, SLo Paulo, 1978. Spec. Publ. SBo Paulo,
IG, USP, SBG, 2, 98 pp.
Martin, L., Suguio, K., 1989. Excursion Route along the Brazilian Coast Between Santos (SP) and Campos (RJ) (North
of State of Rio de Janeiro). Int. Symp. Global Changes in
South America During the Quaternary. Spec. Publ. 2,
ABEQUA-INQUA, SLo Paulo, 136 pp.
Martin, L., Flexor, J.M., Boas, G.S.V., Bittencourt. A.C.S.P.,
Guimaraes, M.M.M., 1979a. Courbe de variation du niveau
relatif de la mer au tours des 7000 dernieres an&es sur un
secteur homogene du littoral bresilien (nord de Salvador
Bahia). Proc. Int. Symp. Coastal Evolution in the Quaternary.. IGCP, Sao Paulo, pp. 296-331.
Martin, L., Suguio, K., Flexor, J.M., 1979b. Le Quaternaire
marin du littoral bresilien entre Cananeia (SP) et Barra de
Guaratiba (RJ). Proc. Int. Symp. Coastal Evolution in the
Quaternary, IGCP, S;io Paulo, pp. 296633 1.
Martin, L., Bittencourt, A.C.S.P., Flexor, J.M., Vilas-Boas,
G.S., 1984. Evidencia de urn tectonismo quaternario nas
costas do Estado da Bahia. Proc. XXX111 Congr. Bras. Geol.
SBG, Rio de Janeiro, 1, pp. 19-35.
Martin, L., Suguio, K., Flexor, J.M., Dominguez, J.M.L., de
Azevedo, A.E.G., 1984b. Evolucao da planicie costeira do
rio Paraiba do Sul (RJ) durante o Quaternario: Influencia
das flutuacoes do nivel do mar. Proc. XXX111 Congr. Bras.
Geol., Rio de Janeiro, 1, pp. 84-97.
Martin, L., Flexor, J.M., Blitzkow, D., Suguio, K., 1985. Geoid
change indications along the brazilian coast during the last
7,000 years. Proc V Int. Congr. Coral Reef, Tahiti, 3,
pp. 85590.
Martin, L., Suguio, K., Flexor, J.M., 1986. Shell middens as a
source for additional information in Holocene shoreline and
sea-level reconstruction: examples from the coast of Brazil.
In: Van de Plasseche, 0. (Ed.), Sea-Level Research: A
Manual for the Collection and Evaluation of Data. Free
Univ. Amsterdam, Amsterdam, pp. 503-521.
Martin, L., Suguio, K., Flexor, J.M., Azevedo, A.E.G., 1988.
Mapa geologic0 do Quaternario costeiro dos Estados do
Parana e Santa Catarina. Serie Geol. DNPM. Brasilia, 28,
40 PP.
Muehe, D., Correa, C.H.T., 1988. OS ‘arenitos de restinga’ do
cordlo litodneo da Macambaba/Lagoa de Araruama RJ. Proc. XXXIV Congr. Bras. Geol., SBG, Belem, 2,
pp. 553356 1,
Muehe, D., Ignarra, S., 1984 Arenito de praia submerso em
frente a praia de Itaipuacu -RJ. Proc. XXX111 Congr. Bras.
Geol., SBG, Rio de Janeiro, 2, pp. 341.-346.
Neto, R.C.. 1984. Algumas consideracdes sobre a origem do
sistema lagunar de Araruama. In: Lacerda, L.D. et al. (Eds.),
Restingas ~ Origem, Estruturas, Processes. UFF, Rio de
Janeiro. pp. 61-63.
165
Perrin, P., 1984. Evolucao da costa fluminense entre as pontas
de Itacoatiara e Negra. Preenchimentos e restingas. In: Lacerda, L.D. et al. (Eds.), Restingas - Origem, Estruturas,
Processes. UFF, Rio de Janeiro, pp. 65573.
Petri, S., Suguio. K., 1973. Stratigraphy of the Iguape-Canantia lagoonal region sedimentary deposits, SLo paulo, Brazil,
Part 2. Heavy mineral studies, microorganisms inventories
and stratigraphical interpretations. Bol. IG-USP, Inst. Geocien. 4, 71-85.
Pirazzoli, P.A., 1991. World Atlas of Holocene Sea-Level
Changes, Oceanography Series, 58, Elsevier, Amsterdam,
300 pp.
Poncano, W.L., 1981. As coberturas cenozoicas. In: Almeida,
F.F.M. et al. (Eds.), Mapa Geologic0 do Estado de Sao
Paulo na escala 1:500,000. Instituto de Pesquisas Tecnologicas, Sao Paulo, Publ. 1184, 1, pp. 82-96.
Rivereau, J.C., Fuck, R.A., Muratori, A., Trein. E., 1968. Ilha
do Mel, Folha Geologica. Comissao da Carta Geologica do
Parana, Curitiba, Escdla 1:70.000.
Rivereau, J.C., Fuck, R.A., Muratori, A., Trein, E., 1969a.
Barra do Ararapira, Guaratuba, Paranagua, Pedra Branca
de Araraquara, Guaraquecaba, Folhas Geologicas. Comissao da Carta Geologica do Parana, Curitiba, Escala
1:70.000.
Rivereau, J.C., Fuck, R.A., Muratori, A., Trein, E., 1969b.
Guaratubd, Folha Geologica. Comissao da Carta Geologica
do Parana, Curitiba, Escala 1:70.000.
Rivereau, J.C., Fuck, R.A., Muratori, A., Trein, E., 1969~.Paranagua, Folha Geologica. Comissao da Carta Geologica do
Parana, Curitiba, Escala 1:70.000.
Rivereau, J.C., Fuck, R.A., Muratori, A., Trein, E., 1969d.
Pedra Branca de Araraquara, Folha Geologica. Comissao
da Carta Geolcgica do Parana. Curitiba, Escala 1:70.000.
Rivereau, J.C., Muratori, A., Trein, E., Fuck, R.A., Hausen,
J.P., Basumallick, S., 1969e. Guaraquecaba, Folha Geologica. Comissrio da Carta Geologica do Parana, Curitiba.
Escala 1:70.000.
Rivereau, J.C., Trein, E., Muratori, A., Fuck, R.A., Basumallick, S., Bertoldo, A.L., 1970. Antonina, Folha Geologica.
Comissao da Carta Geolhgica do Parana. Curitiba, Escala
1:70.000.
Roep, Th.B., 1986. Sea-level markers in coastal barrier sands:
examples from the North Sea coast. In: van de Plassche, 0.
(Ed.), Sea-Level Research: A Manual for the Collection and
Evaluation of Data. Geo Books, Norwich, pp. 97-128.
Roy, P., Cowell, P.J., Ferland, M.A., Thorn, B.G., 1995. Wave
dominated coasts. In: Carter, R.W.G., Woodroffe, C.D.
(Eds.), Coastal Evolution. Cambridge University Press.
pp. 121-186.
Short, A.D., 1984. Beach and nearshore facies: southeast
Australia. Mar. Geol. 60, 261-282.
Silva, G.C., 1987. Complexo deltaico do rio Paraiba do Sul.
Proc. I Symp. Regional Geology, RJ-ES. SBG, Rio de
Janeiro, pp. 2999346
Soares, R.S., Paranhos Fo, A.C., Souza, M.C. de Branco, J.C.,
Fabianovicz, R., Prazeres Fo, H.J., Kogut. J.S., 1994. Variacdes da linha de scosta no balneario de Pontal do Sul (PR)
166
RJ. Angulo, G.C. Lessa/MarineGeology140
no period0 de 1953-1993, urn balan$o sedimentar. Bol.
Parana. Geocien. 42, 161-171.
Souza, L.A.P., 1995. A Planicie Costeira Cananeia-Iguape,
Litoral Sul do Estado de Sao Paulo: urn Exemplo de Utiliza$50 de Metodos Geofisicos no Estudo de Areas Costeiras.
M.Sc. Thesis, Instituto Oceanografico, Sao Paulo University, 207 pp.
Suguio, K., Barcelos, J.H., 1978. Quatemary sedimentary environments in Comprida Island, State of SBo Paulo, Brazil.
Bol. IG-USP, Inst. Geocien. 9, 203-211.
Suguio, K., Martin, L., 1976. Brazilian coastline quatemary
formations the States of SLo Paulo and Bahia littoral zone
evolutive schemes. Anais Acad. Bras. Cien. 48 (Suppl.),
325-334.
Suguio, K., Martin, L., 1978a. Formacdes quaternaria marinhas
do litoral paulista e sul fluminense. Int. Symp. Coastal Evolution in the Quaternary-The
Brazilian National Working
Group for the IGCP, Project 61. Instituto de Geociencias da
USP, Spec. Publ. 1.
Suguio, K., Martin, L., 1978b. Mapa geologic0 do litoral
paulista, folhas Cananeia e Iguape (1: 100,000). SLo Paulo.
Suguio, K., Petri, S., 1973. Stratigraphy of the IguapeCananeia lagoonal region sedimentary deposits, S%oPpaulo,
Brazil, Part 1. Field Observations and grain size analysis.
Bol. IG-USP, Inst. Geocien. 4, l-20.
Suguio, K., Martin, L., Flexor, J.M., 1976. Les variations relatives du niveau moyen de la mer au quatemaire recent dans
la region de Cananeia-Iguape, Sao Paulo. Bol. IG-USP, Inst.
Geocien. 7, 1133129.
(1997) 141-166
Suguio, K., Martin, L., Bittencourt, A.C.S.P., Dominguez,
J.M.L., Flexor, J.M., Azevedo, A.E.G., 1985. Flutuagoes do
nivel relativo do mar durante o Quatemario Superior ao
longo do litoral brasileiro e suas implica@es na sedimenta@o costeira. Rev. Bras. Geocien. 15 (4) 2733286.
Suguio, K., Martin, L., Flexor, J.M., 1988. Quatemary sealevels of the Brazilian coast: recent progress. Episodes 11
(3), 2033208.
Tessler, M.G., 1988. Dinamica Sedimentar Quaternaria no
Litoral Sul Paulista. Ph.D. Thesis, Instituto de Geociencias,
Universidade de Slo Paulo, 276 pp.
Tomazelli, L.J., 1990. Contribui@o ao estudo dos sistemas
deposicionais
holocenicos do nordeste da provincia
costeira do Rio Grande do Sul, corn enfase no sistema eolico.
Ph.D. Thesis, Universidade Federal do Rio Grande do Sul,
270 pp.
Turq, B., Coe, R., Froidefond, J.M., 1986. Variability of beach
ridges on the coast of Marica (Rio de Janeiro, Brazil).
In: Rabassa, J. (Ed.), Quaternary of South America and
Antarctic Peninsula. A.A. Balkema, Rotterdam, Vol. 4,
pp. 45-57.
van Andel, T.H., Laborel, J., 1964. Recent high relative sea
level stand near Recite, Brazil. Science 145, 580-591.
Villwock, J.A., Tomazelli, L.J., 1989. Sea-level changes and
Holocene evolution in Rio Grande do Sul coastal plain,
Brazil. Int. Symp. Global Changes in South America During
the Quatemary: Past-Present-Future.
Spec. Publ. 1,
INQUA-ABEQUA S%o Paulo, pp. 192-196.
Download