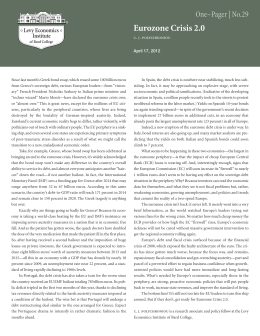
RESIDENTIAL RESEARCH
Global House Price Index
European performance weighs on
global housing markets
House prices around the world have risen on average by just 1% in the last
12 months according to Knight Frank’s Global House Price Index. However,
Europe was the only world region to see prices decline in the last year. Kate
Everett-Allen examines the latest data:
Results for Q3 2012
The Knight Frank Global House Price
Index rose by 0.1% in the three
months to September 2012 and by 1%
over a 12 month period
European countries occupy the
bottom twelve rankings in terms of
annual price growth
Greece is positioned at the bottom of
the rankings, with a 11.7% decline in
prices in the year to September
Brazil recorded the highest annual
increase in prices (up 15.2%) but the
pace of growth is slowing
Price growth in Asia Pacific is also
slowing, with 4.2% annual growth in
the year to September, compared to
7.6% in the previous 12 months
Mainstream global property prices stand just
5.2% above the lows hit in the wake of the
financial crisis in Q2 2009, according to our latest
index. As such, they have underperformed prime
global property prices by some margin. Knight
Frank’s Prime Global Cities Index, which tracks
the value of luxury property in 26 cities across
the world, shows that prime property values
have climbed by 18.7% over the same period.
It seems that many of the world’s mainstream
housing markets are flagging, bereft of any
effective stimulus.
With the Eurozone now in its second recession
in three years buyer confidence is at an all-time
low and it is no coincidence that all the bottom
12 rankings are occupied by European countries
this quarter.
The Eurozone’s 17 member states have on
average seen prices fall by 1.8% in the 12
months to September, this compares to other
world regions such as South America and Asia
Pacific which have seen growth of 9.8% and
4.2% respectively.
With Europe stagnating, the mounting evidence
of a US housing market recovery in recent
months led some to believe it could provide the
much-needed impetus for the global markets.
Prices in the US are now 3.6% higher than in the
third quarter of 2011, vacancy rates are at their
lowest level since 2005 and housing starts are
up 49% year-on-year. However, the US fiscal
cliff – the crunch point when tax benefits are
due to end and spending cuts commence at the
end of 2012 – could extinguish this hope.
Looking east, Asia’s policymakers are offering
little hope of an Asian-driven recovery. China’s
new leadership looks set to continue with
stringent property cooling measures and new
lending restrictions in Hong Kong are likely to
limit the availability of credit.
But it’s not all bad news. Six markets recorded
double-digit annual price growth in the year to
September; Brazil, Hong Kong, Turkey, Russia,
Colombia and Austria.
Greece has now pushed Ireland off the bottom
slot – where it has resided for five consecutive
quarters – by recording an average price fall of
11.7% in the last year. Ireland, by comparison,
has seen its rate of decline improve, up from
-14.3% a year ago to -9.6%.
In summary, confidence, affordability and debt
are constraining Europe. Strict lending and the
looming fiscal cliff may dent the early signs of
growth in the US while regulatory measures in
Asia are keeping housing markets in check.
The current period of stagnation looks set to
continue well into 2013.
Figure 1
Figure 2
Unweighted average global house price change
Unweighted average change in house prices,
by world region, 12 months to Q3 2012
Global performance
6
Regional analysis
10
5
4
8
Kate Everett-Allen, International Residential Research
2
12-month % change
“With the Eurozone now
in its second recession
in three years...it is no
coincidence that all
the bottom 12 rankings
for annual growth are
occupied by European
countries this quarter.”
% change
3
1
0
-1
6
4
2
-2
-3
-4
0
Q3 Q3
96 98
Q3
00
Q3 Q3 Q3
02 04 06
12-month % change
Q3 Q3 Q3
08 10 12
3-month % change
Source: Knight Frank Residential Research
-2
South Asia North Africa Middle Europe
America Pacific America
East
Source: Knight Frank Residential Research
RESIDENTIAL RESEARCH
Global House Price Index
Data digest
Table 2 Knight Frank Global House Price Index
The Knight Frank Global House Price Index
established in 2006 is the definitive means
for investors and developers to monitor and
compare the performance of mainstream
residential markets across the world. The
index is compiled on a quarterly basis using
official government statistics or central bank
data where available.
Figure 3
Top perfoming housing markets by
quarterly growth
3-month % change
6
3-month % change
5
4
3
2
US
Russia
Estonia
Switzerland
Brazil3
Turkey
South Africa
Hong Kong2
China1
0
Colombia
1
Source: Knight Frank Residential Research
Based on Beijing and Shanghai 2
Provisional data 3
Asking prices 1
Notes to Editors
Knight Frank LLP is the leading independent global property
consultancy. Headquartered in London, Knight Frank and its New
York-based global partner, Newmark Knight Frank, operate from
244 offices, in 43 countries, across six continents. More than 7,067
professionals handle in excess of US$817 billion (£498 billion)
annually, advising clients ranging from individual owners and buyers
to major developers, investors and corporate tenants. For further
information about the Company, please visit www.knightfrank.com.
Residential Research
Kate Everett-Allen
International Residential Research
+44(0)20 7861 1513
[email protected]
Rank Country
12-month % change
1
2
3
4
5
6
7
8
9
10
11
12
13
14
15
16
17
18
19
20
21
22
23
24
25
26
27
28
29
30
31
32
33
34
35
36
37
38
39
40
41
42
43
44
45
46
47
48
49
50
51
52
53
54
55
(Q3 2011-Q3 2012)
Brazil¹ Hong Kong² Turkey Russia Colombia Austria China³ Malaysia Norway Iceland India Estonia Switzerland New Zealand Indonesia Mexico Canada United States Germany Belgium Luxembourg Finland Dubai, UAE Latvia South Africa Singapore South Korea Taiwan Morocco Czech Republic Jersey Australia Malta France Slovakia Ukraine United Kingdom Slovenia Israel Bulgaria Sweden Lithuania Japan Italy Poland Croatia Denmark Hungary Cyprus Portugal Netherlands Romania Spain Ireland Greece 6-month % change
(Q1 2012-Q3 2012)
15.2%
14.2%
11.5%
10.7%
10.5%
10.1%
7.7%
7.3%
7.0%
6.6%
6.5%
6.4%
6.3%
5.0%
4.2%
3.7%
3.6%
3.6%
3.3%
2.8%
2.2%
2.1%
2.0%
1.7%
1.5%
1.1%
1.1%
1.0%
1.0%
1.0%
0.5%
0.3%
0.1%
-0.1%
-0.6%
-0.9%
-1.6%
-1.7%
-2.0%
-2.2%
-2.6%
-2.6%
-2.6%
-3.5%
-4.6%
-5.2%
-5.4%
-5.7%
-5.9%
-7.0%
-7.9%
-8.9%
-9.3%
-9.6%
-11.7%
6.3%
14.1%
6.9%
5.6%
5.7%
0.2%
12.8%
1.3%
3.8%
3.8%
3.9%
4.0%
0.9%
2.9%
2.2%
1.9%
3.7%
9.4%
-3.2%
0.6%
-1.3%
2.5%
1.0%
0.3%
6.2%
1.0%
-0.3%
4.4%
1.0%
0.8%
2.6%
0.9%
-3.3%
-1.2%
0.4%
2.4%
0.7%
-3.1%
-4.1%
-0.3%
1.3%
-1.1%
-1.3%
-2.0%
-2.5%
-3.3%
1.4%
-2.9%
-3.0%
-2.4%
-5.1%
3.1%
-4.9%
-0.5%
-6.4%
3-month
% change
(Q2 2012-Q3 2012)
3.0%
4.5%
3.5%
2.4%
4.9%
0.7%
4.6%
-1.8%
0.6%
0.7%
0.6%
2.6%
2.5%
1.2%
1.0%
1.3%
0.5%
2.2%
-0.5%
-0.1%
0.5%
2.0%
0.0%
-0.2%
3.1%
0.5%
-0.5%
-3.3%
1.0%
-0.8%
-3.1%
0.3%
-3.2%
0.2%
1.1%
-7.1%
-0.6%
1.1%
-3.3%
-0.5%
0.2%
-3.9%
-0.6%
-1.0%
-2.2%
-1.9%
1.0%
0.1%
-2.0%
-1.2%
-4.7%
-0.6%
-2.4%
1.5%
-3.6%
Latest data if
not Q3 2012
Q2
Q2
Q2
Q2
Q2
Q2
Q1
Q2
Q2
Q2
Q2
Q2
Q2
Q2
Q2
Based on asking prices 2Provisional data 3Based on Beijing & Shanghai
1
Recent market-leading research publications
Press Office
Bronya Heaver
+44 (0)20 7861 1412
[email protected]
The Wealth Report
2012
Prime Global Cities
Index Q3 2012
Asia Pacific Residential
Report October 2012
Hong Kong Monthly
November 2012
Knight Frank Research Reports are available at www.KnightFrank.com/Research
© Knight Frank LLP 2012 - This report is published for general information only and not to be relied upon in any way. Although high standards have
been used in the preparation of the information, analysis, views and projections presented in this report, no responsibility or liability whatsoever can be
accepted by Knight Frank LLP for any loss or damage resultant from any use of, reliance on or reference to the contents of this document. As a general
report, this material does not necessarily represent the view of Knight Frank LLP in relation to particular properties or projects. Reproduction of this report
in whole or in part is not allowed without prior written approval of Knight Frank LLP to the form and content within which it appears. Knight Frank LLP is a
limited liability partnership registered in England with registered number OC305934. Our registered office is 55 Baker Street, London, W1U 8AN, where you
may look at a list of members’ names.
Download