GEOProcessing 2013 : The Fifth International Conference on Advanced Geographic Information Systems, Applications, and Services
Starting a Spatially Enabled Society: a Web System
for Collecting Volunteered Geographic Information in
the Area of Public Security
Jarbas Nunes Vidal Filho, Jugurta Lisboa-Filho, Wagner Dias de Souza, Diogo Franklin de Oliveira
Universidade Federal de Viçosa (UFV)
Departamento de Informática (DPI)
Viçosa – Minas Gerais - Brazil
{jarbas.filho,jugurta}@ufv.br, {wagner.supremo, diogofranklinn}@gmail.com
Abstract— A spatially enabled society provides to citizens,
businesses and government access to spatial data regardless of
computing platform. The article describes a collaborative Web
system to gather geographic information about the area of public
security and disseminate it at all levels of a society using Web 2.0
tools. The data generated by the user become another source of
data for agencies involved in public security to use the
information in order to try to minimize violence and allow
citizens to protect themselves from criminality.
Keywords- Volunteered Geographic Information; Web Systems;
Google Maps; Public Security.
I.
INTRODUCTION
Currently, the use of geographic information is fundamental
to sustainable development as well as improvements in the
making decision process by a particular organization, in which
the factor "where" is important and precedent to perform an
action on several sectors, such as public security, health, urban
planning, deforestation control, agricultural production and
others. The economic development, social stability,
improvement of citizen’s public security, and others can be
reached by developing products and services that are based on
geographic information collected by all levels of a society or
government [1].
These actions can be facilitated by the development of a
spatially enabled society [1]. In this type of society, spatial
information is regarded as common goods made available to
citizens and organizations to assist in developing techniques to
support decision making [1, 2]. A spatially enabled society in
the context of public security may be useful to bring citizens
closer to police departments and improve the activities within
these organizations. Any user may search for a service or
information, which should always be available and reliable
access [3]. Moreover, people can voluntarily contribute
information to help security departments to make decisions
based on volunteered information.
For the development of such society, it is necessary the use
spatial data. These, in turn, need to have a certain degree of
quality, sufficiently reliable, easily accessible and available in
real time for use by that society [1]. Based on this
understanding, Spatial Data Infrastructures (SDI) are being
Copyright (c) IARIA, 2013.
ISBN: 978-1-61208-251-6
developed in many countries as a platform that improves the
sharing, access and integration of spatial data and services. An
SDI can also store spatial data and provide services of access to
data supplied voluntarily.
In recent years, the amount of spatial data generated by the
users has grown. Increasingly users are indexing content based
on their geographic coordinates. With this new paradigm of
spatial data production, the term Volunteered Geographic
Information (VGI) has arisen, identified by Goodchild [4] as a
new phenomenon to describe user-generated information,
combining elements of Neogeography, Collective Intelligence
and Web 2.0 [5].
It is possible to note an evolution in the treatment and
production of spatial information. With the popularization of
the Internet and the emergence of Web tools, it is possible to
observe a breakthrough in the development of new
technologies for the production of geographical information
[4]. Considering that Web 1.0 initially assumed a unidirectional
role only allowing users to visualize information, Web 2.0
plays a bidirectional role in which users are able to interact and
provide information that can be accessed by any user who has
access to the computer network.
The purpose of making a society become a spatially
enabled one is to transform the citizen into a "voluntary human
sensor" in the Web 2.0 world, providing information and
reviewing information that has been contributed by other
voluntary users. According to Georgiadou et al [6], the use of
"participatory human sensors" can extend the power of action
of ordinary citizens, improving the ability of citizens to directly
influence the services performed by a particular organization.
The rest of the paper is organized as follows. Section II
describes the main related work. Section III presents the
motivations and objectives of the project and describes the case
study developed. Section IV describes the methodology used
and some conclusions are presented in Section V.
II. RELATED WORK
There are many works developed with the use of
information technology and employing spatial data, applied in
the area of public security. However, these works are ceasing
151
GEOProcessing 2013 : The Fifth International Conference on Advanced Geographic Information Systems, Applications, and Services
to be developed in a conventional environment of Geographic
Information System (GIS) and starting to use Web 2.0 concepts
and neogeography to produce data from ordinary citizens, i.e.
without knowledge of specific areas of geosciences. Some
examples of these projects are listed below.
The project Wikicrimes [7] main idea is the access to
information and collaborative mapping of crime in a digital
map using the Google Maps API. Any user with a mobile
device or a computer with Internet access can cooperate with
the system and seek information about a registered crime. This
work contains functions to automatically validate registered
crimes, display statistics of them and identify hot points of the
city, i.e., identify areas of greatest risk, using an algorithm
based on Kernel Map.
The project called “Paz tem voz – Mapa do Crime” [8] or
“Peace has voice - Crime Map” in English is a project
developed to collect volunteered information from police
reports that the citizen was a victim or witnessed the fact. The
system consists of a module of voluntary collaboration,
functions for visualization of statistical analysis of recorded
data and identification of homicide profile, such as age, crime
motivation and weapon used. Moreover, it is also possible to
make a complaint about theft, burglary and other crimes. The
system uses the Google Maps API and is designed to meet the
desires of the people of the state of Paraná, in southern Brazil.
The project CrimeViz [9], developed at the University of
Pennsylvania, also uses the Google Maps API to provide
digital maps of Washington, District of Columbia, United
States. However, this study differs from others cited above in
two aspects. Firstly, the CrimeViz is fed by official data of the
District of Columbia and not by voluntary contributions.
Secondly, it implements a panel of spatio-temporal analysis by
day, month or year. This panel can be understood as a box
containing a button to play, pause and continue. The user
selects the unit of time (day, month or year) and selects the
play button. Then, the system will display a color histogram
representing the number of incidents that were reported and it
is possible to view on the map a spatio-temporal analysis
showing the data records in the last days, months or years.
The works cited above have great contributions to public
security in combating violence. The work proposed here differs
by proposing some contributions that are useful for
approximating the population to police agencies by, for
example, using concepts of Wiki in VGI data in order to make
the citizen a reviewer of user-generated content. Another
example is the development of a forum to discuss the recorded
data, creating a collective intelligence that can be useful to
perform validation of data, from the testimony of others or
serving as collection for more information about a registered
crime. Furthermore, in order to improve access to and
dissemination of VGI data, an SDI is used for data storage.
Finally, the potential of VGI in the area of public security can
be validated based on some statistical analysis on the VGI data
in relation to official bases of police agencies.
Copyright (c) IARIA, 2013.
ISBN: 978-1-61208-251-6
III.
MOSSORÓ SPATIALLY ENABLED: MOTIVATIONS AND
OBJECTIVES
The city of Mossoro, located in western Rio Grande do
Norte state, in Brazilian northeast, is the second most populous
city in the state and has a large growth related to industries and
companies that have settled in the city such as Petrobras. In
recent years the feeling of insecurity in the city has grown
among citizens. The “Instituto Técnico-Científico de Polícia
(ITEP)” or Scientific-Technical Institute of Police, an institute
responsible for statistics from police reports, started to show
alarming numbers in recent years related to the increase in
crime in the city.
According to data from the Sangari Institute [10], the
number of homicides in Mossoró city has been growing year
by year. In 2009, 132 homicides were recorded. The number
rose to 178 homicides in 2010 and to 196 homicides in 2011.
In 2012, until September, 97 occurrences of homicide had
already been recorded. Due to this alarming increase, the case
study of this work is related to Mossoró city.
The aim of this study is to make the citizen a participatory
"voluntary human sensor" in a spatially enabled society using
Web 2.0 tools. Any user who uses a mobile device or a
computer with Internet access can report problems of insecurity
or register crimes in which the citizen was the victim or a
witness. The data generated by the user are stored in a database
integrated with a SDI, making it easier to search for data by the
various organizations that have some direct or indirect
influence in the area of public security and the dissemination of
data at all levels of society, as well as avoiding efforts by users
in creating repeated data. The user can record VGI data,
participate in the forum of a registered data in order to enhance
the data or provide other relevant information, and use Wiki
services to review data from voluntary contributions, as it is
done at the free encyclopedia, Wikipedia.
IV. MATERIALS AND METHODS
The collaborative systems can be understood as tools that
support Web 2.0 resources and allow the direct or indirect
interaction of a particular individual or of collective groups
with any content available on the Internet [11]. This type of
system emerged in recent years due to the advances in Web.
Until recently, the Web was used only to provide information,
making users only consumers of information. This phase is
known as Web 1.0. With advances in technology it has become
possible to interact with content published on the Internet.
Blogs, Wikipedia, Email and others are examples that allow
users to interact with content, setting up another phase of the
Web known as Web 2.0. The system developed in this work
uses technologies that support Web 2.0 capabilities and other
tools needed for development, such as: (1) Apache; (2) Google
Maps API version 3 for map viewing, statistical analysis and
analysis of the most dangerous areas based on the algorithm of
Kernel Map; (3) The programming languages Hyper-Text
Markup Language (HTML), Cascading Style Sheets (CSS),
Hypertext Preprocessor (PHP), AJAX, jQuery, JavaScript and
eXtensible Markup Language (XML) were used for
customization of the Google Maps API, development of
collaboration module, interface and other features; (4) The
Database Manager System MySQLServer is used to store
152
GEOProcessing 2013 : The Fifth International Conference on Advanced Geographic Information Systems, Applications, and Services
users' contributions and PHPMyADMIN is used as database
configuration assistant.
these users in order to try to identify whether the user is
collaborating to help or disturb police activities.
The Apache server (or HTTP Apache server) is a free
software developed by the Apache Software Foundation, and
aims at processing information on the Web, i.e., it is a server
responsible for answering Hyper-Text Transfer Protocol
(HTTP) requests, Web standard protocol [12]. The system is
available in the domain (www.ide.ufv.br/mossorocrimes) using
a machine with Internet access as the physical server and the
Apache as Web server.
This work used the Google Maps API v3 with support for
browsers (Internet Explorer, Firefox, Safari, Opera and
Chrome) and mobile devices with Android and Iphone. This
API provides several features for viewing 2D and 3D maps,
geocoding services, best route and others. Features of this API
are used to perform statistical analysis of VGI data and risk
analysis, i.e., determining the most dangerous areas in the city.
To use the API it is necessary to possess a valid license key and
provided by Google itself. This key is used together with
JavaScript codes that can be loaded into the system. Google
provides all documentation for use of the API and the resources
supplied by it.
The collaboration module is a service offered by the system
to collect VGI data. The user can provide textual information
about an act of violence, insert videos and photos related to the
registered act and use the forum to discuss the data, providing
relevant information to help improve the quality of data. This
module was developed with the programming languages PHP,
JavaScript, HTML and XML, supplying the user with greater
interaction to insert, update or criticize a VGI data.
Figure 1. Interface of the system.
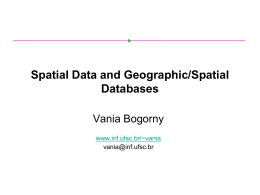
The identification of risk areas is essential when the topic is
public security. The Google Maps API provides resources to
implement services for risk analysis based on Kernel Map,
which is a statistical method of estimation of curves, i.e., is
plotted on the map using interpolation methods, the intensity of
a particular phenomenon in the region [13]. The system has a
button called "heatmap" to enables the function that
implements the Kernel Map. Moreover, as the user moves the
map it is possible to view the statistics of VGI data by region.
Fig. 3 shows the use of Kernel Map in recorded incidents.
Data collection is an important part of this work, because
from them, it is possible to perform statistical analysis of VGI
data and possibly infer about the potential of the VGI.
Therefore, it is necessary to create a database allowing the
authors to hold VGI data instead of them going to the Google
server. The MySQLServer was used due to it being easy to
install and use, being free software and having the
PHPMyADMIN assistant that facilitates the creation,
modification and settings of the database.
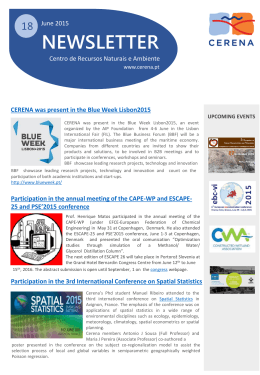
V. RESULTS AND DISCUSSIONS
The developed system consists of a prototype to collect
VGI data and perform statistical analysis of VGI data and by
geographic region. The software was developed to support
requests coming from computers (laptop, desktop) and
smartphones that support Android or Iphone operating systems.
Fig. 1 shows the system interface that uses only HTML and
CSS in its development to make viewing very simple in
devices that have limited screen such as mobile devices.
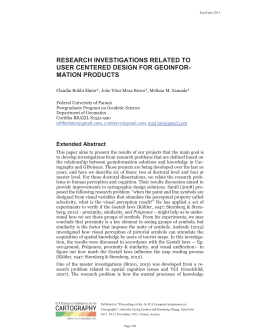
The system provides two categories: security and others. At
the time the user performs collaboration he can tell which
category and type of occurrence that he will provide. The
category "other" represents other data that have some
connection with the area of public security, for example, report
lack of lighting on a street. Fig. 2 shows statistical analysis on
the collaborated data by categories and on users who
cooperated more. Then it is possible to have a control over the
most active users and filter, in the database, the information of
Copyright (c) IARIA, 2013.
ISBN: 978-1-61208-251-6
Figure 2. Statistical analysis by category and user.
Because there are few collaboration, it is not possible to
infer any relevant result on the Kernel map. From the moment
that there is more collaboration in the system it will be possible
to see the color intensity by region.
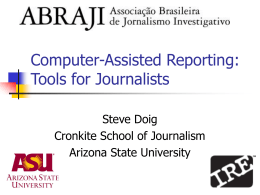
The collaboration module is responsible for receiving
contributions from users. To perform a collaboration is
necessary that the user is "logged in" to the system so it is
necessary a simple registration. This information is preserved
and is not available at any time that the user is interacting with
the system. After accessing the system using the credentials of
the registration, the user can click in the “collaborate” tab and
then click on the map to write a collaboration. The user can
register and send textual information, photo, video or any other
file. Fig. 4 shows the "infowindow" of collaboration module
with the tabs to send multimedia files. Mossoró has Streetview
service. The citizen can use this service to better identify the
place for registration of the occurrence.
153
GEOProcessing 2013 : The Fifth International Conference on Advanced Geographic Information Systems, Applications, and Services
This type of system when ethically used can provide a
satisfactory database for agencies responsible for security in a
city and help people to protect themselves from violent places.
In future work a Wiki module will be developed so that
citizens can interact in order to improve VGI data quality and
an SDI that will provide access to all the agencies. So at major
events in the city, the agencies that are related to public
security can use a database containing information from other
sectors and improve their activities in combating violence. To
validate the VGI data, statistical analysis will be conducted
comparing the VGI data with official data to assess the impact
of VGI in security.
Figure 3. Risk analysis based on Kernel Map.
Once the user registers the collaboration by clicking on
"send collaboration" it is created a forum about the data. To
interact with the forum, the user must be "logged in" to the
system. Therefore, any registered user can interact with other
users and provide extra information that was not addressed in
the description of the occurrence. This generates a collective
intelligence about the data, similar to those that exist in
relevant comments in posts on social networks, whose goal is
to help in the description of a photo, text, video or other.
The system also provides access to all data recorded and it
is possible to follow the updates in real time and analyze all
data that have contributed to the system. Moreover, it has a
data filtering service whose goal is to facilitate the viewing of
specific data such as homicides, thefts and others. These data
can be filtered and analyzed separately using Kernel analysis.
ACKNOWLEDGEMENTS
This project was partially funded by CNPq, Fapemig,
CAPES, Funarbe and the Company Sydle.
REFERENCES
[1]
[2]
[3]
[4]
[5]
[6]
[7]
[8]
[9]
Figure 4. Infowindow of collaboration module.
VI. CONCLUSION AND FUTURE WORKS
A collaborative Web system is essential for citizens to
share information that are often available on websites that do
not have the knowledge of agencies in charge of public
security. A society enabled with VGI data on public security
can be useful for companies, citizens and government using
another database to improve the decision-making process. VGI
data being used at a local level, which is highly recommended,
can provide a faster response to security departments than their
own official data. Therefore, in an emergency situation it is
possible to get better results in the execution of activities.
Copyright (c) IARIA, 2013.
ISBN: 978-1-61208-251-6
[10]
[11]
[12]
[13]
A. Rajabifard, “A Spatial Data Infrastructure for a Spatially
Enabled Government and Society”. In A multi-view Framework
to Assess Spatial Data Infrastructure. Austrália: Digital Print
Center, 2008, pp. 11-22.
H. Mohammdi, A. Colebatch, G. Dawson, and S. Ballingall,
“Intelligent Speed Assist: Spatially enabling societies”. In Proc.
of
GSDI,
Singapore,
2010.
Available
from:
<http://www.gsdi.org/gsdiconf/gsdi12/papers/73.pdf>.
I. Williamson, A. Rajabifard and J. Wallace, “Spatially Enabling
Government: An Internacional Challenge”. Available from:
<http://gsditest.opengeospatial.org/gsdiconf/gsdi10/papers/TS2.
3paper.pdf>. Access: 01 September 2012.
M.F. Goodchild, “Citizens as voluntary sensors: spatial data
infrastructure in the world of Web 2.0”, International Journal of
Spatial Data Infrastructures Research, v. 2, pp. 24-32, January
2007.
A. Hudson-Smith, A. Crooks, M. Gibin, R. Milton and M. Batty,
“NeoGeography and Web 2.0: concepts, tools and applications”,
Journal of Location Based Services, v. 3, pp. 118-145, June
2009.
Y. Georgiadou, B. Bana, R. Becht, R. Hoppe, J. Ikingura, M. J.
Kraak, K. Lance, R. Lemmens, J.M. Lungo, M. Mccall, G.
Miscione, and J. Verplanke, “Sensors, empowerment, and
accountability: a Digital Earth view from East Africa”,
International Journal of Geographical Information Science, v.4,
pp. 285-304, July 2011.
Wikicrimes. Available from: <www.wikicrimes.org>. Access:
20 September 2012.
Paz tem voz – Mapa do Crime. Available from:
<http://www2.gazetadopovo.com.br/pazsemvozemedo/mapadoc
rime/>. Access: 22 September 2012. (In Portuguese)
CrimeViz.
Available
from:
<http://www.geovista.psu.edu/CrimeViz/DC/v2/>. Access: 22
September 2012.
Instituto
Sangari.
Available
from:
<http://www.institutosangari.org.br/instituto/>.
Access: 25
September 2012. (In Portuguese)
V. Furtado, L. Ayres; M. Oliveira, E. Vasconcelos, C. Caminha;
J. D’Orleans and M. Belchior, “Collective intelligence in law
enforcement the wikiCrimes system”, Information Sciences,
v.180, n.1, pp. 4-17, January 2010.
The Apache Software Foundation. Available from:
<http://www.apache.org/>. Access: 25 September 2012.
An Introduction to Kernel Methods. Available from:
<http://intellisysdev.enm.bris.ac.uk/cig/pubs/2000/svmintro.pdf
>. Access: 04 December 2012.
154
Download