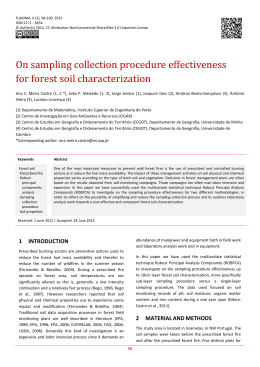
Florestal
Brasileira
PFB
Pesquisa Florestal Brasileira
Brazilian Journal of Foresty Research
www.cnpf.embrapa.br/pfb
Site evaluation and productivity of a 3-year old stand of Eucalyptus
urograndis in São Paulo, Brazil
Guilherme de Castro Andrade1, Itamar Antonio Bognola1, Antonio Francisco Jurado Bellote1, Luziane Franciscon1, Maarten Johannes Waterloo2, Leendert Adrian Bruijinzeel2
1
Embrapa Florestas, Estrada da Ribeira, Km 311, CP 319, CEP 83411-000, Colombo, PR, Brasil
VU-University Amsterdam, Department of Hydrology and Geo-Environmental Sciences, Faculty of Earth and Life Sciences, De Boelelaan 1085, 1081 HV,
Amsterdam, The Netherlands.
2
Autor correspondente:
[email protected]
*
Index terms:
Forest plantation
Biomass
Litter
Soil fertility
Soil strength
Termos para indexação:
Plantação florestal
Biomassa
Serapilheira
Fertilidade do solo
Resistência do solo
Histórico do artigo:
Recebido em 07 jul 2011
Aprovado em 20 dez 2011
Publicado em 28 dez 2011
doi: 10.4336/2011.pfb.31.68.331
Abstract - Plantation forests in Brazil cover 7 million hectares, which represents 1%
of the country (68% of Eucalyptus and 25% of Pinus plantations). The aim of this
study was to evaluate a Eucalyptus urograndis plantation. High levels of Ca and Mg
in the soil suggest that limestone had leached into the soil profile. The soil resistance
down to 60 cm depth in the row of planting was lower than the inter-row space,
indicating that deep tillage had been effective. Soil resistance, down to 20 cm depth at
an inter-row distance of 1 m from the planting row, was higher, likely by the increase
in soil compaction during the site preparation. The canopy biomass differed amongst
the DBH classes, justifying the use of an allometric equation based on a basal area
for assessing the canopy biomass. The observed variation in DBH did not correlate
with variation in wood density. The wood density of 0.37 g cm-3 was lower than those
reported for 7-year-old plantation. The in situ removal of the bark increased nutrient
availability by 8-11%. Harvesting of tree bole in 3-year old plantation didn’t result in
a large nutrient export, indicating that proper plantation management can contribute
to plantation forest sustainability.
Avaliações de sítio e produtividade em plantios de Eucalyptus
urograndis com 3 anos de idade em São Paulo, Brasil
Resumo - No Brasil os plantios florestais ocupam 7 milhões de hectares que
correspondem a 1% do território (68% com plantações de Eucalyptus e 25% com
Pinus) O objetivo desse trabalho foi avaliar plantios de Eucalyptus urograndis. Estoques
elevados de Ca e Mg no solo, sugerem uma lixiviação do calcário. A resistência do
solo até os 60 cm de profundidade na linha de plantio foi menor do que na entrelinha,
indicando que a subsolagem foi eficiente. Os valores de resistência do solo foram mais
altos na entrelinha, distante 1 m da linha de plantio, até os 20 cm de profundidade,
provavelmente pelo aumento da compactação na preparação da área. A biomassa da
copa das árvores diferiu entre as classes de DAP, justificando o uso de equação para
a sua estimativa. A variação observada para área basal não refletiu em diferenças de
densidade da madeira. A densidade da madeira de 0,37 g cm-3 foi menor do que a de
plantios com 7 anos. A remoção da casca no campo aumentou o suprimento de nutrientes
entre 8% e 11%. A colheita da madeira aos 3 anos não resultou numa exportação
significativa, indicando que o manejo apropriado dos plantios, pode contribuir para a
sustentabilidade florestal.
Pesq. flor. bras., Colombo, v. 31, n. 68, p. 331-346, out./dez. 2011
332
G. de C. Andrade et al.
Introduction
Forest plantations cover about 7 million ha and
represent approximately 1% of brazilian territory, with
4.75 million ha of Eucalyptus (68%), 1.76 million ha
of Pinus (25%) and 0.46 million ha of other species
(ANUÁRIO..., 2011).
In recent decades there has been a significant increase
in productivity of forest plantations. However, the
demand for forest products is also increasing, which
implies that there is a need for increasing the forest
plantation area in Brazil. A strategy for the establishment
of new plantations can be to afforest pastures with
low productivity. These pastures provide an attractive
opportunity for establishing new plantation forests.
In Brazil, charcoal production from forestry has
increased steadily since 2002. From 2006 to 2007,
charcoal production from plantation forests increased
by 46%, which represents about 3.8 million tonnes,
whereas charcoal production from natural forest had
a growth of only 1% with a production of 2.5 million
tonnes (SBS, 2008).
There is a current policy in Brazil to conduct research
to develop alternative energy sources. The hybrid
Eucalyptus urograndis is planted widely in different
regions of Brazil and is considered a viable option
for energy purposes (Tonini et al, 2006). Within this
context, novel research concerning forest biomass
development are technological innovations in biofuel
production using chemical and physical processes.
The specifications of the source material for biofuel
(charcoal, biodiesel) production may well be different
from that for construction timber or pulp production,
which may lead to shorter rotation lengths or influence
selection of tree species. In Malaysia, Yatim & Hoi
(1987) demonstrated that rubberwood, acacia, eucalypt
and pine could all generate charcoal of industrial-grade
quality. However, differences in charcoal properties can
be expected to occur between species or within a single
species because of differences in age at harvesting,
climate or site aspects (Mészáros et al., 2004).
Eucalypt is one of the main species planted in Brazil
for industrial purposes. Eucalypt plantation for energy
usually involves applying two coppices, with the first
thinning at 7 years, the second at 14 years and the final
harvesting at 21 years after planting. The cycle may
be shortened (to 5- or 6-year intervals) depending on
the region and soil type. Through economic studies
Pesq. flor. bras., Colombo, v. 31, n. 68, p. 331-346, out./dez. 2011
involving farmers with eucalypt plantations in southern
Brazil, Rodigheri (1997) observed that firewood
producers used a short rotation period of four to six
years, depending on their need for wood.
A shortening of the rotation period for biofuel
plantation forests may adversely impact soil structure
and soil fertility.
Plantation forests are usually established on low
fertility soils. Eucalypt is sensitive to low mineral
nutrients availability and therefore, in order to achieve
productive plantations it is highly recommended to
regularly apply fertilizer to replenish the nutrients lost
in each rotation (Barros et al., 1992; Gonçalves et al.,
2000a).
In conjunction with soil nutrient replenishment, it is
also necessary to monitor the nutrient distribution over
the various components of the system.
Because most plantations are located in low productive
areas, an impact on plantation productivity can be caused
by nutrient losses occurring during exploitation and
harvesting of the wood, or by erosion of deforested
areas. This is particularly so when complete removal of
biomass is practiced (Brown et al., 1997). Such losses
can be minimised through simple procedures, such as the
use of fertilisers, harvesting in strips (as opposed to clear
cut), increasing rotation length and careful construction
of roads (Van Hook et al., 1982; Nambiar, 1996)
It is also important to keep harvesting residues onsite (e.g. leaves, twigs and bark), seeking maximum
conservation of the remaining stock of nutrients, mainly
for phosphorous and potassium (Poggiani et al., 1983,
Turner & Lambert, 1983; Bruijnzeel & Wiersum, 1985;
Pande et al., 1987, Andrade et al., 2006).
After timber removal, the management of organic
matter without burning, the use of forestry equipment
which produces less soil compaction and the decrease
of machinery movement on the ground can be beneficial
(Bouillet et al., 2000, Gonçalves et al. 2000a; Laclau et
al., 2000).
The change in rotation length warrants studies of
the chemical, physical and biological site conditions of
young and fast-growing plantation forests, because these
factors can influence the productivity of the next rotation
and therefore the sustainability of forestry operations. A
comprehensive assessment of forest site condition may
also identify required actions to preserve the productive
potential of the soil in successive rotations (Gonçalves
et al., 2000 b).
Site evaluation and productivity of a 3-year old stand of Eucalyptus urograndis in São Paulo, Brazil
In view of the above the aim of this study is to evaluate
a 3-year old plantation forest of Eucalyptus urograndis,
with respect to soil physical and chemical conditions
three years after site preparation and liming/fertilising.
In addition we evaluate tree growth, biomass and wood
properties, as well as nutrient stock of the harvestable
wood, bark, canopy and litter. This should allow us to
evaluate the impact of short-rotation forestry for bioenergy purposes. It also provides a baseline for future
studies in this forest at the end of the first rotation and
after harvesting.
Material and methods
The coordinates of the study plot are 48°16’32” W
and 23°21’21” S. The elevation is 696 m above sea
level (a.s.l.).
The climate is Cwa, according to the Köppen
classification, i.e. mesothermic with a dry winter, and
an average annual rainfall between 1,300 and 1,400 mm.
Monthly average temperatures range from 15-16 oC in
July to 22-23 oC in January. The dry season is in winter,
between April and September.
The soil is a well-drained Quartzipsamment (USDA
classification system) or Arenosol (FAO classification
system) or Neossolos Quartzarênicos (Brasilian
classification system) on a consolidated sandstone
formation with minimum depth of 2.5 m. The soil has a
moderately developed A horizon and a clay fraction less
than 6%. These soils occupy 15% of the Cerrado biome
(Brazilian savannah ecosystem; Adámoli et al., 1986)
and are used for intensive agriculture, cattle pasture and
reforestation projects. They are typical for flat areas in
the landscape, but because of their sandy texture they
are also very susceptible to erosion as a consequence
of poor land management. Quartzipsamments have a
low natural fertility and a limited plant available water
capacity, leading to frequent water stress in the dry
season. Soil nutrients become exhausted within a few
years after fast-growing plantation establishment, which
requires a well-planned fertiliser management strategy
(liming, fertilisation) to ensure continued productivity.
This study site was a pasture that was planted with
Eucalyptus urograndis, a hybrid between E. urophylla
and E. grandis, in 2005. Before tree planting at 3 x
2 m spacing (1670 trees ha-1), the soil was subsoiled,
using one shank in row, and fertilised with 80 kg ha-1
of P2O5, 150 kg ha-1 of K2O; 150 kg ha-1 of N; 5 kg
333
ha-1 of B and limed by adding 1 Mg ha-1 of dolomitic
limestone. As such the study forest can be considered
not to have experienced nutrient deficiencies and would
exhibit optimal growth in the absence of water stress.
The plantation was established to provide pulpwood at
a relatively short 7-year rotation period. Consequently,
thinning and pruning operations were not realised. A plot
measuring 400 m2 (20 m x 20 m) was randomly selected
in the 3-year old plantation forest. The plot counted 63
trees and diameter at breast height (DBH) varied between
0.067 m and 0.173 m. Among these trees, 13 had a DBH
below 0.118 m and 21 a DBH above 0.173 m.
Soil sampling and analytical procedures
Soil samples were collected at random at three
points in the plot with a soil auger, at four depths
(0-5 cm, 5-10 cm, 10-20 cm and 20-30 cm). At one of
these sample points, an extra sample at 60-80 cm depth
was also collected. The samples were analyzed for pH,
organic matter content, exchangeable P, K, Ca, Mg,
Al amounts and particle size at the Laboratory of Soil
and Plant Tissue Analysis of the Embrapa-Florestas,
Curitiba, Brazil.
Available P and exchangeable K were extracted with
1N HCl, as described by Bloise et al. (1979). Other
exchangeable ions, organic matter content and pH (H2O
and CaCl2) were analysed according to the procedures
of Embrapa (1997).
Soil core samples were collected in the plot for
measurement of soil physical aspects and plant water
availability. The 0-10 cm samples had four repetitions
whereas those at greater depth had three repetitions.
These samples were analysed using ceramic plates for
macro- and micro-porosity, total porosity, aeration and
bulk density following Embrapa (1997). The moisture
retention curve was determined at tensions of -6, -10,
-100 and -1500 kPa (Black, 1965).
Air capacity (% by volume of air-filled voids at 10 kPa
matric potentials), macroporosity (% by volume of pores
at 6 kPa matric potentials) and total available water (%
volume of water drained between 10 and 1500 kPa matric
potentials) were measured by moisture release (Black, 1965;
Oliveira, 1968). The soil physical properties were determined
according to the methodology of Embrapa (1997).
Using a cone penetrometer (Soil Control 60, USA),
the soil mechanical strength was measured in three
replicates down to a depth of 60 cm on the planting row
(PR) and in the inter-row space (IR) at distances of 0.5,
1.0 and 1.5 m from the planting row.
Pesq. flor. bras., Colombo, v. 31, n. 68, p. 331-346, out./dez. 2011
334
G. de C. Andrade et al.
Tree volume, biomass and nutrient content
All trees in the plot were measured for height and
stem DBH using a clinometer and a flexible measuring
tape, respectively. The trees were classified according
to DBH into three diameter classes: 13 trees with DBH
between 6.7 and 11.8 cm (lower class), 29 trees between
12.4 and 14.3 cm (middle class) and 21 trees between
14.6 and 17.3 cm DBH (upper class). Nine representative
trees in the plot were harvested for biomass assessment,
three from each of the three DBH classes.
The measurements made by the length and diameter
of five segments of the stem (seg 1 to seg 5) and wood
samples were taken at six points (disc 1 to disc 6): d1
= base (near soil surface), d2 at DBH measurement
height, and d3, d4, d5 and d6, at 25, 50, 75 and 100%
of the whole stem down to a minimum diameter of 5
cm, respectively.
The proportional distribution of the total volume
of the tree for each segment was obtained through the
calculations of volume per stem segment of the nine
trees, based on the Equation of Smalian (Husch et al.,
1993). The data indicated a distinct pattern for each DBH
class (lower, middle and upper) allowing estimation of
the volume segment of all trees in the plot from their
DBH, their height measurement and form factor. These
data were then used to estimate the biomass for each
stem segment and nutrient content of the remaining
trees in the plot.
One specimen of each DBH class (lower, middle and
upper) had 4 cm wide discs cut in each of its reference
points (d1-d6) for nutrient content analysis and for
laboratory analysis of wood density by immersion in
water (Vital, 1984). Measurements were also made of
the biomass, separating leaves, twigs and the upper
part of stem (the end of the stem after d6). For nutrient
content analysis, each subsample was separately picked
from branches and leaves, from three different trees in
the plot. The canopy and the upper part of the stem of
six additional trees were fresh-weighted with leaves and
twigs attached, but no samples were taken.
The bark was removed from the stem disc samples
for density evaluation and nutrient analysis by each stem
compartment.
Samples of wood discs, leaves and stems were
dried at 60 °C, weighed, and grinded to be chemically
analyzed for N, P, K, Ca, Mg, Fe, Mn, Zn, Cu and total
Carbon. Nitropercloric digestion was used in order to
Pesq. flor. bras., Colombo, v. 31, n. 68, p. 331-346, out./dez. 2011
determine the levels of P, K, Ca and Mg. Phosphorous
was determined by using ammonium molybdate
absorption, potassium by flame photometry and Ca and
Mg by atomic absorption, according to the methodology
of Embrapa (1997). For nitrogen analysis, sulfuric
digestion was performed followed by the Micro Kjeldahl
method. These procedures are in accordance with the
methodology proposed by Sarruge and Haag (1974).
The estimation of the sapwood and bark biomass
was made based on the discs of the sampled trees. The
determination of basic density was performed with the
separation of bark and sapwood for the six discs of
wood (d1 to d6). The mean density of discs at the trunk
section extremities was used to calculate the density of
each segment we used.
The estimated biomass of bark and wood of the six
non-sampled trees was calculated based on the volume of
each of its segments and the basic density values found
in the segments (seg) of the sampled trees, according to
each DBH class (lower, middle and upper).
The estimated biomass of bark and wood of six nonsampled trees, was calculated based on the volume and
the basic density of the segments, according to each class
(lower, middle and upper).
The nutrient analysis data of three standard tree
samples were applied to each DBH class. The nutrient
values for the trunk were calculated similar to the density
determination for each segment.
For each of three standard trees sampled, we
calculated the percentage of leaves and branches to total
canopy biomass. These values were subsequently used
to estimate leaf and branch biomass of other six sample
trees in the plot. For the remaining trees, the canopy
biomass was estimated by a linear equation relating basal
area to biomass. The procedures described above were
applied per DBH class, in order to calculate separately
leaf and branch biomass for each tree in the plot.
The concentrations of macronutrients and
micronutrients in leaves and branches, multiplied by
the corresponding dry weight, were used to calculate the
nutrient content in biomass of the trees crown for each of
three DBH classes. For the other six trees, the leaf and
branch biomass and the nutrient concentrations of the
trees sampled were estimated for each DBH class. The
nutrients of three sub-standard trees were also used to
calculate the canopy nutrients content for the remaining
trees in the plot.
335
Site evaluation and productivity of a 3-year old stand of Eucalyptus urograndis in São Paulo, Brazil
Litter standing crop
For the sampling of litter standing crop, a sampler
plate of 0.5 m x 0.5 m was used. It was randomly placed
on the litter layer, with three replicates between the lines
and another three in the planting row. The moist litter
below the plate was cut, weighed and sampled. The
sample was dried at 60 °C and weighed for moisture
content analysis. Nutrient concentrations were measured
using the methods described above. The total biomass
and nutrient content of the litter layer were reported for
the plot and extrapolated to a hectare.
Data Analysis
Descriptive and graphical analysis of data collected
in the study were performed in order to check for
heterogeneity, means and standard errors. The variables
were also analyzed using linear models and variance
analysis (Faraway, 2005). The models were built
according to the design used and the factors of interest
for each variable (age and diameter classes within age).
The adjustment of the model to the data was determined
by the use of probability plots with simulated envelopes
of the normal distribution. Differences between
treatments were observed by orthogonal contrasts
(Mason et al., 2003).
surface layer (0 to 5 cm) the available water was 1.7 to
2.3 times higher than in the subsoil.
Tables 2 and 3 show statistical analysis of soil
penetrometer resistance measurements in the
experimental plot, collected at different depths in the
planting row (PR) and at increasing distances of 0.5,
1.0 and 1.5 m from the row. The changes in resistances
with depth are shown in Figure 1.
In the planting rows, the average resistance at all
depths was significantly lower than that measured at
other points between the planting rows (p<0.001). The
resistance at a distance of 1 meter from the planting row
was also significantly higher (p<0.001) than that at 0.5
and 1.5 m for the 0-10 cm and 10-20 cm depths (Table
3 and Figure 1). The soil resistance difference was not
significant between 0.5 and 1.5 m from the row planting.
The highest values of resistance, between 50 and 60 kg
cm-2, were observed below 30 cm depth without deep
tillage (0.5, 1.0 and 1.5 meters, Figure 1).
Soil resistance (kg cm-2)
0
30
60
90
PR
10
Results
IR 0.5 m
IR 1.0 m
IR 1.5 m
Soil depth, (cm)
Soils
The key soil characteristics of the plot is shown in
Table 1. Generally, the nutrient stock was highest in
the first layer (0-5 cm). For P, the highest levels were
observed in topsoil, down to 20 cm depth. Calcium and
magnesium, however, exhibited higher stocks at a depth
of 60 and 80 cm. Texture analysis showed that between
64% and 69% of particle size fraction was coarse sand,
whereas 2-6% was clay and silt in the top soil (2%). The
remaining size fraction was of fine sand.
The total porosity, aeration porosity and macro
porosity were similar for all analysed depths. In the soil
0
20
30
40
50
60
Figure 1. Soil penetrometer resistances depth profiles in the
planting row (PR) and at inter-row distances (IR) of 0.5 to
1.5 m from planting rows in a 3-year old E. urograndis plot.
Pesq. flor. bras., Colombo, v. 31, n. 68, p. 331-346, out./dez. 2011
336
G. de C. Andrade et al.
Table 1. Chemical and physical properties of soil in a plot of 3-year old E. urograndis.
Soil depth (cm)
Variable
0-5
pH (CaCl2)
OC (Mg ha-1)
5-10
10-20
20-30
60-80
4.14 ± 0.06
3.92 ± 0.04
3.91 ± 0.02
4.00 ± 0.06
4.36
4.014 ± 2.672
3.346 ±1.981
8.242 ± 4.551
6.838 ± 6.451
14.0
P available (kg ha )
2.276 ± 0.783
2.464 ± 0.895
5.299 ± 2.658
2.818 ± 1.695
0.4
K (kg ha-1)
11.651 ± 0.885
8.774 ± 0.416
9.897 ± 0.437
8.996 ± 1.901
10.9
Ca (kg ha-1)
169.97 ± 3.064
110.16 ± 8.594
226.47 ± 74.794
239.77 ± 37.674
683
Mg (kg ha-1)
118.11 ± 5.291
46.66 ± 1.671
100.92 ± 24.889
100.58 ± 21.06
408
Al (cmol kg )
0.400 ± 0.046
0.677 ± 0.030
0.653 ± 0.047
0.580 ± 0.093
0.30
Coarse sand (%) 2 – 0.2 mm
67.50 ± 2.50
64.67 ± 1.33
66.00 ± 1.73
66.00 ± 2.00
69.0
Fine sand (%) 0.2 – 0.05 mm
25.50 ± 1.50
29.00 ± 1.00
28.33 ± 0.67
28.67 ± 0.67
29.0
Clay (%)
6.00 ± 2.00
6.00 ± 1.15
5.67 ± 1.86
5.33 ± 1.76
2.00
Silt (%)
2.00
0.33
-
-
-
Bulk density
1.377 ± 0.004
1.407 ± 0.032
1.434 ± 0.077
1.373 ± 0.037
Total Porosity (cm3 cm-3)
0.467 ± 0.008
0.469 ± 0.015
0.449 ± 0.011
0.436 ± 0.017
0.282 ± 0.009
0.305 ± 0.034
0.284 ± 0.020
0.310 ± 0.009
-
0.257 ± 0.015
0.296 ± 0.034
0.269 ± 0.023
0.292 ± 0.010
-
0.077 ± 0.027
0.034 ± 0.011
0.038 ± 0.008
0.046 ± 0.018
-
-1
-1
Aeration Porosity (cm cm )
Macropores (cm3 cm-3) > 0.05
mm
Available water (cm3 cm-3)
3
-3
Standard errors of the mean (SEM) are indicated by plus-minus signs.
Table 2. Averages and standard errors of soil penetrometer
resistances in kg cm-2, down to 60 cm of soil depth as obtained
at different points in the 3-year-old E. urograndis plot.
Points1
Table 3. Descriptive level of probability (p-value) of test F
for soil resistances at different inter-row distances and soil
depths in the 3-year old E. urograndis plot.
Contrasts between points1 on the
F-value for soil
plot by soil depth (cm)
penetrometer resistance
PR vs IR 0.5. 1.0 e 1.5m; soil depth
<0.001
0-10 cm
IR1.0 vs IR 0.5 e 1.5m; soil depth
<0.001
0-10 cm
IR 0.5 vs IR 1.5m; soil depth 0-10 cm
0.1511
PR vs IR 0.5. 1.0 e 1.5m; soil depth
<0.001
10-20 cm
IR 1.0 vs IR 0.5 e 1.5 m; soil depth
<0.001
10-20 cm
IR 0.5 vs IR 1.5m; soil depth 10-20 cm
0.1104
PR vs IR 0.5. 1.0 e 1.5m; soil depth
<0.001
20-40 cm
IR 1.0 vs IR 0.5 e 1.5 m; soil depth
0.9363
20-40 cm
IR 0.5 vs IR 1.5m; soil depth 20-40 cm
0.9087
PR vs IR 0.5. 1.0 e 1.5m; soil depth
<0.001
40-60 cm
IR 1.0 vs IR 0.5 e 1.5 m; soil depth
0.9845
40-60 cm
IR 0.5 vs IR 1.5m; soil depth 40-60 cm
0.0671
Soil depth (cm)
0-10
10-20
20-40
40-60
PR
8.3 ± 2.1
14.0 ± 1.1
21.4 ± 5.7
25.4 ± 3.8
IR 0.5m
25.3 ± 4.1
43.9 ± 2.8
58.6 ± 2.8
50.8 ± 2.6
IR L 1.0m
38.4 ± 5.5
58.2 ± 0.8
58.1 ± 1.0
54.7 ± 1.8
IR L 1.5m
19.0 ± 2.9
36.9 ± 3.5
58.1 ± 1.8
58.8 ± 0.8
PR = planting row; IR = inter-rows; IR 0.5m, IR 1.0m, IR 1.5m from distance
of PR; Standard error of the mean (SEM) are indicated by plus-minus signs.
1
PR = planting row; IR = inter-rows; IR 0.5m, IR 1.0m, e IR 1.5m from
distance of PR.
1
Pesq. flor. bras., Colombo, v. 31, n. 68, p. 331-346, out./dez. 2011
Site evaluation and productivity of a 3-year old stand of Eucalyptus urograndis in São Paulo, Brazil
Stand characteristics
The average stand characteristics and total volume of
the trees in the plot are presented in Table 4.
Table 4. Average characteristics of growth tree and total
volume of wood, converted to hectare, to E. urograndis in
3-years-old plantation.
Commercial 1
14.5
13.4
0.59
Volume of wood
(m3 ha-1)
with
without
bark
bark
209.0
190.7
Total 2
18.5±1.7
13.4±2.2
0.47
212.7
Tree
Height
(m)
dbh
(cm)
Form
factor
193.9
Commercial = trunk, from base (soil surface) until the diameter of 5.0 cm;
2
Total = base until the top; Standard error of the mean (SEM) are shown in
plus-minus sign; Bark represented 8.8% of the trunk volume of E. urograndis
in the 3-year old plot. The trunk section with a diameter less than 5.0 cm, i.e.
the difference between the total and commercial volume of wood, represented
1.7% of total volume of wood. Annual average increments in total volume
with and without bark were observed of 70.9 m3 ha-1 y-1 and 64.6 m3 ha-1 y-1,
respectively.
1
Using the basal area of trees, we obtained a linear
equation in order to estimate the biomass of leaves and
branches for all trees in the plot: y = -6.41 + 990.83x (R²
adjusted = 93 %), where x is the basal area of tree (m2)
and y is the dry weight of leaves plus branches (kg). The
canopy biomass calculated by this equation was about
9% higher than the value based only on canopy biomass
of medium trees in the plot.
Biomass and nutrient concentrations in canopy
leaves and branches and in litter standing crop
Data of dry biomass and concentrations of carbon and
nutrients in leaves and branches and in the litter layer
are shown in Table 6.
Table 6. Biomass and concentrations of carbon and nutrients
in leaves, branches and litter standing crop of a 3-year-old
E. urograndis plantation forest.
Variable
Bark represented 8.8% of the trunk volume of E.
urograndis in the 3-year old plot. The trunk section
with a diameter less than 5.0 cm, i.e. the difference
between the total and commercial volume of wood,
represented 1.7% of total volume of wood. Annual
average increments in total volume with and without
bark were observed of 70.9 m3 ha-1 y-1 and 64.6 m3 ha-1
y-1, respectively.
Biomass (kg tree-1)
Canopy biomass
For the lowest tree class (DBH range 6.7-11.8 cm),
the canopy biomass composed of leaves, branches and
the uppermost section of the trunk (diameter less than
5 cm) was 4.77 ± 0.98 kg tree-1, whereas those for the
middle (DBH 12.4-14.3 cm) and upper tree classes (DBH
14.6-17.3 cm) were 8.41 ± 0.28 kg tree-1 and 11.80 ± 0.56
kg tree-1, respectively. Statistical analyses for the canopy
biomass of these three classes are presented in Table 5.
Table 5. P-values for the F-statistic for orthogonal contrasts
between DBH classes to canopy biomass of a 3-year old E.
urograndis plantation.
Contrasts
classes l versus m,u
classes m versus u
Canopy1
<0.001
0.012
l = lower; m = middle; u = upper DBHclass.1 leaves, branches and last stem.
The canopy biomass of three year old trees in the lower
class (l) significantly differed (p <0.001) from those of the
middle and upper classes and that of the middle class also
differed (p <0.01) from that of the upper class.
337
Carbon (g kg-1)
leaves
branches
Litter
3.63
3.72
9.0 ± 1.02
511 ± 1.58
505 ± 2.02
456 ± 6.63
N (g kg-1)
18.62 ± 2.35
3.80 ± 0.13
9.04 ± 1.04
P (g kg-1)
1.29 ± 0.05
K (g kg-1)
9.46 ± 0.49
4.74 ± 0.05
1.61 ± 0.12
Ca (g kg )
10.19 ± 0.52
5.34 ± 0.17
20.48 ± 0.83
Mg (g kg )
3.40 ± 0.64
1.61 ± 0.07
3.84 ± 0.34
Fe (mg kg-1)
108 ± 1.53
16.40 ± 0.89
658 ±105.3
-1
Mn (mg kg )
244 ± 37.73
44.89 ± 1.76
467 ± 15.17
Zn (mg kg-1)
14.27 ± 1.10
2.36 ± 0.93
6.80 ± 0.64
Cu (mg kg )
6.80 ± 0.86
4.26 ± 0.25
10.73 ± 0.73
-1
-1
-1
0.556 ±0.027 0.538 ± 0.024
Standard error of the mean (SEM) are shown after the plus-minus sign.
The canopy biomass amounted to 7.35 kg tree-1, or
13.4 Mg ha-1, and was 18% lower than the mass of the
litter standing crop (15.9 Mg ha-1). The biomass of the
canopy was evenly distributed over branches (51%) and
leaves (49%) was observed in Table 6.
Except for carbon, the nutrient concentrations in
leaves were significantly higher than those in branches.
The litter standing crop showed high levels of Ca, Fe
and Mn in comparison to those values in fresh leaves
and branches, whereas K showed depletion.
Density and concentration of carbon and nutrients
in wood and bark
Data of bark and sapwood density, as well as their
carbon and nutrient concentrations and significance
levels for differences between sapwood and bark are
summarised in Table 7, whereas a statistical analysis
Pesq. flor. bras., Colombo, v. 31, n. 68, p. 331-346, out./dez. 2011
338
G. de C. Andrade et al.
for DBH classes is presented in Table 8. All values are
based on the average of six discs sampled (the base of
the trunk to 5.0 cm in diameter). There were no statistical
differences between DBH classes, neither for sapwood
nor for bark density. The sapwood density was about
45% higher than that of bark. Significant differences
were observed for carbon and nutrient concentrations
of the sapwood data and also for the bark.
Nutrients concentration in wood showed significant
differences between classes of DBH for Ca and Mn.
Trees in the middle DBH class had higher contents of
Ca and Mn when compared to those in the upper class
(p <0.01 and p <0.05, respectively). In contrast, trees in
the lower class had a higher Mn concentration than those
in the other classes (p <0.01). In bark, it was observed
significant differences for carbon, N, K, Zn and Cu
concentrations (p <0.01), with trees in the lower DBH
class presenting higher concentrations of K, Zn and Cu
than those in the middle and upper classes (p <0.01).
Table 7. Means, standard errors and significance levels of differences of wood density
and carbon and nutrient concentrations between three DBH classes evaluated for each
wood component, sapwood and bark, of 3-year-old E. urograndis.
DBH classes1 for sapwood
l
m
DBH classes1 for bark
u
l
m
density (g cm ) ns
0.36±0.01
0.37±0.01
-3
0.38±0.01
0.25±0.01
0.53±1.28
0.51±3.24
0.52±0.92
N (g kg ) ns
-1
2.22±0.06
1.88±0.13
3.30±0.11
4.36±0.174.3
P (g kg ) ns
-1
0.12±0.02
0.11±0.01
0.55±0.07
0.53±0.08
K (g kg ) ns
-1
1.92±0.18
2.03±0.19
6.75±0.20
Ca (g kg-1) **
0.39±0.05
0.58±0.10
0.29±0.02
9.46±1.82
0.19±0.04
0.20±0.05
2.53±0.33
17.6±3.41
15.6±2.41
89.6±18.0
8.60±1.03
6.65±0.94
108.8±5.9
1.42±0.16
3.11±0.36
2.79±0.38
66.33±7.83
64.77±19.49
115.3±9.511
119.7±26.71
Zn (mg kg-1) **
3.57±0.52
3.86±0.96
9.21±0.68
Cu (mg kg-1) ns
1
11.44±2.04
Mn (mg kg-1) ns
Zn (mg kg-1) ns
3.46±0.17
13.46±2.601
Fe (mg kg-1) ns
Mn (mg kg-1) **
11.0±0.71
5.36±0.09
Mg (g kg-1) ns
Fe (mg kg-1) ns
19.9±2.61
5.86±0.42
Ca (g kg-1) ns
Mg (g kg-1) ns
0.23±0.05
0.53±0.14
K (g kg ) **
-1
2.19±0.11
3.41±0.16
P (g kg )
-1
0.12±0.01
0.51±1.83
N (g kg ) **
-1
2.11±0.23
0.26±0.01
C_total (kg kg ) **
C_total (kg kg ) ns
0.53±2.54
0.26±0.01
-1
-1
0.53±0.92
u
density (g cm ) ns
-3
2.62±0.642.6
4.66±1.19
Cu (mg kg-1) **
1.31±0.23
1.86±0.27
3.50±0.25
2.04±0.26
1.98±0.40
l = lower; m = middle; u = upper DBH. ns: not significant (p>0.05); *p<0.05; ** p<0.01.
Table 8. P-values for the F-statistic for orthogonal contrasts between DBH classes concentrations
of carbon and nutrients for sapwood and bark wood of 3-year-old E. urograndis (F-test).
Class
component
Total C
N
K
Ca
Mn
Zn
Cu
class l vs m,u
wood
-
-
-
0.570
0.008
-
-
class m vs u
wood
-
-
-
0.007
0.151
-
-
class l vs m,u
bark
0.0017
0.006
0.004
-
-
<0.001
0.001
class m vs u
bark
0.5459
<0.001
0.219
-
-
0.119
0.887
l = lower; m = middle; u = upper dbh class.
Pesq. flor. bras., Colombo, v. 31, n. 68, p. 331-346, out./dez. 2011
339
Site evaluation and productivity of a 3-year old stand of Eucalyptus urograndis in São Paulo, Brazil
Biomass, carbon and nutrient contents in aboveground tree components and in litter standing crop
Estimates of the biomass, carbon and nutrient contents
in the aboveground tree components and in litter standing
crop are given in Table 9.
The biomass and nutrient content of the roots was not
studied because these remain in situ after harvesting and
nutrients stored in roots would therefore be available for
the next rotation.
Aboveground tree biomass had 52% of the carbon
content and the litter layer biomass had 46% of the
carbon content.
Harvesting of trees with removal of stem wood only,
i.e. leaving the bark, canopy and litter layer on-site
ensures that between 68% and 95% of N, P, Ca, Mg, Fe
and Cu would remain available for the next rotation. This
percentage is slightly lower for K and Zn, of which 54%
of the total would remain on site. The removal of bark
in the field after harvesting ensures that on average 10%
more nutrients remain available for the next rotation.
This holds in particular for the macronutrients P, K,
Ca and Mg, for which gains are between 12% and to
21%. Ca and Mg had the highest proportions in the bark
consideringto the total stored in the trunk (67% and 56%,
respectively).
The nutrients stored in the litter layer amounted, on
average, to 45% of those in the aboveground forest
ecosystem (aboveground tree + litter layer) (Table 9).
Table 9. Biomass, carbon and nutrient content in tree components of a 3-year old E. urograndis plantation forest.
Variable
Canopy
Upper stem
portion
Trunk
Wood
Bark
Tree
Litter
Total
Stock1
4.7
90.4
15.9
106.3
35.4 (33)
Biomass
Mg ha
13.4
-1
1.4
75.6
70.9
Carbon
Mg ha-1
6.8
0.7
39.6
37.2
2.4
47.1
7.4
54.5
17.3 (32)
N kg ha-1
161.4
3.2
159.8
141.6
18.3
324.4
140.6
465.0
323.5 (70)
P kg ha-1
12.4
0.3
9.7
7.1
2.6
22.4
8.2
30.6
23.4 (77)
K kg ha-1
95.5
4.2
155.8
129.2
26.6
255.5
25.4
280.9
151.7 (54)
Ca kg ha-1
107.3
1.0
90.3
29.5
60.8
198.5
331.9
530.4
501.0 (94)
Mg kg ha-1
34.3
0.8
25.7
11.3
14.4
60.8
67.0
127.8
116.5 (91)
0.8
0.03
1.4
1.1
0.4
2.3
8.9
11.2
10.1 (90)
2.0
0.03
1.1
0.5
0.6
3.2
7.7
10.9
10.3 (95)
110.4
4.8
277.5
259.1
18.4
392.8
175.5
568.3
309.1 (54)
76.6
3.5
108.7
98.7
10.0
188.8
118.6
307.4
208.8 (68)
Fe kg ha
-1
Mn kg ha-1
Zn g ha
-1
Cu g ha
1
-1
(values in parenthesis are the stock percentage for each variable after wood harvest without bark).
Discussion
Soils
With exception of phosphorus, the nutrient stocks
observed in the soil of the 3-year old E. urograndis
plantation are typical for Quartzipsament soils. Sandy
soils have a greater capacity for nutrient desorption,
which leads to an overestimation in terms of P
availability. Elevated stocks of Ca and Mg down to soil
depths between 60 and 80 cm suggest that after limestone
had been applied during planting leaching occurred from the
surface to deeper layers in the soil profile. However, research
into application of lime and leaching of Ca and Mg has
shown that leaching from the addition of lime is slow
and not always results in significant increases in levels of
these nutrients deeper in the profile (Quaggio et al., 1982,
Pavan et al., 1984; Raij, 1989; De Maria et al., 1993).
Due to the high sand fraction, these soils are
characterised by low levels of exchangeable cations and
a low activity of the exchange complex. Therefore, such
soils would be exhausted within a few rotations, and there
is a need for proper management practices to guarantee
favourable production conditions, with emphasis to
development of management strategies to improve soil’s
water retention. In general, adding Ca through liming,
in combination with adequate fertilization (N, P, K) is
necessary when such soils are used for establishment
Pesq. flor. bras., Colombo, v. 31, n. 68, p. 331-346, out./dez. 2011
340
G. de C. Andrade et al.
of fast-growing, short rotation plantation forests. The
topsoil layer contains most of nutrients, so care should
be taken to ensure that this layer remains as undisturbed
as possible during forestry activities (Mello et al., 2007).
When plantations are established on sloping terrain
with this soil type, the susceptibility to erosion can
further affect the sustainability of the plantation forest.
Bruijnzeel & Wiersum (1985) showed nutrient losses
associated with surface erosion during the first three
years after establishment of Agathis plantations in Java
to represent a major portion of overall nutrient losses
over a 40-year rotation period.
Due to the low cation exchange capacity of soil,
leaching of nutrients from the decomposing slash
after harvesting may also occur with percolation to
groundwater. As greater rainfall occurs during the time of
year when temperatures are also greater, conditions are
more favourable for plant growth, and the roots of newly
planted eucalypts, as well as developing undergrowth
vegetation, may efficiently absorb nutrients from the soil
solution Thus, the most critical period for nutrient loss
occurs between harvest and the establishment of new
ground cover, when consumption of water and recovery
rates for nutrients are much lower than in the period
before harvesting (Waterloo, 1994; Bruijnzeel, 1998).
The low soil water retention capacity of these sandy
soils may also affect the forest productivity. In our study,
the available water in topsoil was higher than in subsoil.
Furthermore, a high density of fine roots in the superficial
soil layer was observed in eucalypt stands (Coelho et
al., 2007; Mello et al., 2007). Jetten (1996) showed
improved soil water retention on Quartzipsamments in
Guyana after mechanized harvesting.
According to Voorhees et al. (1989), the soil resistance
to penetration is an indicator of fracture planes or soil
weakeness, whereas the bulk density is more related
to the pore volume. Commonly, sandy soils have a
relatively high macroporosity, so compaction has to be
extremely high to cause a drastic reduction in porosity
(Dedecek & Gava, 2005). The Least limiting water
range (LLWR) is a soil quality assessment parameter
that incorporates penetrometer resistance, soil moisture
retention characteristics and bulk density (Leão & Silva,
2004).
Zou et al. (2000) observed that in coarse sandy soil, an
initial low compaction increased the LLWR, but further
moderate to high compaction decreased LLWR. LLWR
is therefore sensitive to variations in forest management
Pesq. flor. bras., Colombo, v. 31, n. 68, p. 331-346, out./dez. 2011
practices, including mechanized harvesting practices,
and is a potential indicator of soil physical condition for
sustainable forest management (Zou et al. 2000; Leão
& Silva, 2004).
Soil conditions must be favourable to a rapid
expansion of roots to ensure a good initial development
of tree. According to our penetrometer measurements,
the lowest values, 8-25 kg cm-2, occur in the planting
row soil profiles. This suggests that deep tillage on line
just before planting was effective in reducing the soil
resistance. In this type of soil, the highest resistances
in the topsoil were recorded at a distance of 1 m from
the planting row, in particular at depths between 10 cm
(38 kg cm-2) and 30 cm (58 kg cm-2, Figure 1). This
suggests that machines used for site preparation before
planting did compress the soil to some extent as their
tires pass more frequently at this distance from planting
row. At distances of 0.5 m and 1.5 m of planting row,
the maximum resistance occurred at depths between 30
cm and 40 cm.
Dedecek & Gava (2005), evaluating soil compaction
after harvesting of Eucalyptus coppice on sandy soil,
observed a maximum resistance layer (60 kg cm-2) at
20 to 30 cm depth, which coincides with our results
observed for tyre tracks.
Sands et al. (1979), assessed the compaction of
sandy soils in radiata pine forests and observed that
root penetration was severely restricted above a critical
penetration resistance of about 30 kg cm-2. These authors
discussed the importance of organic matter on the
maintenance of a favourable structure in sandy soils, as
well as to the site sustainability.
Growth and volume of tree
With an average commercial stem height of 14.5
meters and a DBH of 13.4 cm, the observed forest growth
is higher than those observed elsewhere in São Paulo
State for E. urograndis by Brigatti et al. (1980; height
of 13.5 m and DBH of 10.3 cm) and Braga (2008; height
11.9 m and DBH of 12.0 cm).
We observed a total aboveground tree biomass of
90.4 Mg ha-1 and an annual average increment, in
total volume with and without bark of 70.9 m3 ha-1 y-1
and 64.6 m3 ha-1 y-1, respectively. Recently, forestry
companies have succeeded in increasing plantation forest
productivity values through investments in research and
development for breeding techniques, such as cloning,
biotechnology, and hybridization (BSS, 2008). This
caused the average yield (according to the planted area)
Site evaluation and productivity of a 3-year old stand of Eucalyptus urograndis in São Paulo, Brazil
of Eucalyptus plantations in Brazil to increase from
36.7 m³ ha-1 y-1 in 2005 to 40.5 m³ ha-1 y-1 in 2007, which
represents a gain of 10.4%. Based on the annual growth
rate observed at this site it should be considered as highly
productive. This suggests that the observed soil, water
and nutrient conditions did not pose constraints to tree
growth at this forest age.
Canopy biomass
The statistical differences observed in the canopy
biomass of the 3-year old E. urograndis stand (Table
5) and the linear relation observed between the basal
area of the trees and the combined biomass of leaves
and branches, demonstrated the importance of stratified
sampling based on DBH classes. Therefore it is
necessary to measure the DBH frequency distribution
in order to determine the appropriate class boundaries
to better estimate the canopy biomass, as well as the
nutrient content accumulated in the trees.
The canopy biomass amounted to 13.4 Mg ha-1, or
15% of the tree biomass, which is in the range observed
by Spangenberg et al. (1996), who published biomass
values for leaves and branches from 7.5-21.2 Mg ha-1
for plots of E. urograndis in 4.5-year old plantations at
different sites in the eastern Amazon, Brazil.
Biomass, concentrations of carbon and nutrients in
above-ground tree components and litter standing
crop
The observed biomass of litter layer of E. urograndis
(Table 6) had accumulated over three years and amounted
to 9.0 kg per tree (1.5 kg m-2). The litter standing crop
was 2.8 times higher than that of a 9-year-old E. grandis
plantation forest in Rio Grande do Sul State in south
Brazil (0.54 kg m-2; Freitas et al., 2004).
Our canopy biomass (13.4 Mg ha-1, Table 10) amounted
to 53% and 78% of those found in 8-year old Australian
Eucalyptus globulus plantation forests on grey sands and
red soils, respectively (Mendham et al., 2003).
The higher concentrations of Ca, Fe and Mn in litter
layer, comparing to those in fresh leaves and branches,
suggest that these nutrients are immobilised in structural
tissue and accumulate on soil surface. Ca was the nutrient
with the highest concentration in the litter layer, which
was also observed by Freitas et al. (2004) for 9-year-old
E. grandis forests in south Brazil.
341
Density, concentrations of carbon and nutrients in
wood and bark
The densities of sapwood and bark were not related
to the DBH of the tree trunk. The sapwood basic density
at 0.37 g cm-3 was on an average of 45% higher than
that of bark. Gatto et al. (2003), analysing the wood
of Eucalyptus plantations and of native forests, found
that the wood basic density ranged near 0.44 g cm-3
for Eucalyptus and 0.46 g cm-3 for native trees, and
considered as slightly dense woods.
For the production of firewood and high-quality
charcoal, one of the most important considerations is
that wood density should be high. In the case of an
earlier harvest for energy use, the wood basic density
observed for the 3-years old E. urograndis (0.37 g cm-3)
was well below of the required density for charcoal,
which therefore limits its use for biofuel.
Sturion et al. (1988) studied the wood quality of
Eucalyptus viminalis plantations for energy purposes
in relation to different cutting ages and found that the
wood density increased on average by 8% between age
four (0.49 g cm-3) and age seven (0.53 g cm-3). Rodigheri
(1997) interviewed farmer owners of Eucalyptus
plantations in south Brazil and observed that some of
them, when requiring firewood, harvested trees at four,
five or six years of age. However, most of the interviewed
farmers extracted the wood at age seven, applying two
coppices for the plantation.
According to Simon (2005), harvests of trees occur
at 3.5 years old in Acacia mearnsii plantations in south
of Brazil for financial reasons of the producers, due to
a large demand for wood and bark. This practice brings,
as a consequence, lower forest productivity, low wood
density and lower tannin concentration in the bark.
Although there were some significant effects of
tree DBH on the concentration of carbon as well as of
nutrients in tree components (Table 8), the results have
shown that these occurred regardless of tree size.
Biomass, carbon and nutrient content in aboveground
tree components and litter standing crop
Naturally, higher nutrient exports and environmental
damage during harvesting and subsequent site preparation
for planting leads to a greater potential of compromising
the sustainability of plantation forest, particularly in
soils with low nutrient status and low water availability
(Jorgensen et al., 1975; Bruijnzeel, 1998; Gonçalves et
al., 2000b).
Pesq. flor. bras., Colombo, v. 31, n. 68, p. 331-346, out./dez. 2011
342
G. de C. Andrade et al.
To maintain high growth rates in short-rotation
plantations, nutrients inputs through fertilising,
especially of N, P and base cations, will often be required,
as its natural sources from the atmosphere (precipitation
and dust) and rock weathering (soil formation) are
insufficient to replace the nutrients losses from the site
during and after harvesting (Bruijnzeel & Wiersum,
1985; Waterloo, 1994; Bruijnzeel, 1991, 1998).
Management of such plantations should aim, for
instance, to reduce nutrient losses by retaining bark and
crown slash on site at the time of harvesting and distributing
all organic material evenly over the site (Waterloo, 1994;
Folster and Khanna, 1997) and by minimizing the area of
bare soil (Cassells & Bruijnzeel, 2005).
Several studies suggest that in timber harvesting it is
also important to manage the soil organic matter content
without burning the waste and to use forestry equipment
which produces lower compaction of soil as well as
streamline the movement of machinery on the ground
(Bouillet et al., 2000, Gonçalves et al. 2000a; Laclau et
al., 2000; Cassells and Bruijnzeel, 2005).
It is also recommended to maintain the litter as a
source of nutrients for the initial development of a new
planting (Gonçalvez et al. 2000a; Laclau et al., 2000,
Sankaran et al. 2000; Bouillet et al., 2000; Andrade,
2002). On fertile soils in Australia, planted with E.
globulus Labill, the removal of litter and all slash from
the site, after harvesting did not affect tree growth at
four years old in the second rotation. However, after
several rotations, any management practice that affects
the nutrients supply from the site may compromise the
plantations productivity (O’connell et al., 2000)
The bulk inputs of nutrients by rainwater in plantations
of E. grandis, as measured at Itatinga, SP, Brazil
(Andrade et al. 2003), at a distance of about 40 km
from the study plot with an annual average rainfall in
the region of 1.350 mm, amounted to 17.7 kg N, 2.0 kg
P, 6.8 kg K, 24.0 kg Ca and 3.0 kg Mg. These values
represent 12.5%, 28.5%, 5.3%, 81.5% and 26.9%,
respectively for N, P, K, Ca and Mg, of the nutrients
accumulated in the wood without bark in our plot of
3-year-old E. urograndis.
Considering the nutrient stock of biomass measured at
the studied site, harvesting at this age would not result in
a large nutrient export. As a consequence, the nutrients
loss with the removal of wood would be compensated
to a large extend by the annual input in precipitation.
Pesq. flor. bras., Colombo, v. 31, n. 68, p. 331-346, out./dez. 2011
Potassium would be the nutrient with lower
replacement by rainwater, and it is leached from the
soil profile more easily than other ions. Therefore, the
trees harvesting at this age would require application of
greater quantities of fertiliser than any other nutrients.
Potassium also has a very important role in plant
resistance to drought in sandy soils. Crops with K
deficiency suffer earlier and more severely the drought
effects (Informações Agronômicas, 2008).
In our study, the main problem of harvest after 3 years
would be an increase in the intensity of intervention on
the ground (e.g. added compaction), as well as more
soil exposure. According to Bruijnzeel & Wiersum
(1985), these conditions give less protection, promote
soil erosion and are associated with nutrient loss which
may also impair long-term sustainability.
Another important issue is the large amount of
nutrients accumulated in the litter layer of the 3-yearold plantation. It must be considered that when the
release of nutrients from organic matter increases, the
chances of leaching losses increases as well, especially
when there is still no new biomass of ground cover to
use immediately the nutrients that are released by the
decomposition of accumulated litter (Bruijnzeel, 1998).
The amount of nutrients removed can be high, even if
only the stem is harvested, especially by repeated cutting
of short-rotation crops. These losses are likely to be
enhanced by faster organic matter decomposition at the
exposed sites during the fallow period. Several factors
including the amount of runoff, the size of the nutrients
pool and the rate of organic matter mobilization affect
the loss nature and extention (Gonçalves, et al., 2000a).
Addition of slash to the forest floor results in increased
microbial mineralisation of organically bound nutrients,
causing a sudden increasing in cation and anion
concentrations in the soil solution. Depending on the soil
environmental conditions (e.g. high rainfall in the early
season after the dry season), some of these mineralised
elements may be leached beyond the main rooting zone
of the soil, especially when there is a reduction or even
an absence of living roots (Folster & Khanna, 1997)
However within the system adopted in this study plot,
as is a majority of Eucalyptus plantations in Brazil, there
are one or two coppices. In this case, after the coppices,
the trees roots are still absorbing nutrients from decaying
slash and stumps, which reduces the critical period
with a sudden drop of living biomass in the soil after
Site evaluation and productivity of a 3-year old stand of Eucalyptus urograndis in São Paulo, Brazil
harvesting. When this reduction occurs in the biomass
and the recovery of the ground cover is slow, the soils
remain moist for longer periods of time as evaporation
is decreased, which can contribute to increased surface
runoff with associated nutrient and sediment losses, and
higher leaching of nutrients to groundwater. This could
therefore enhance nutrient outputs and soil loss from the
system, potentially leading to a decline in site quality.
In this sense, important factors that could influence this
dynamic soil-plant-climate are: topography and soil
type, conditions of the forest floor and soil after harvest,
precipitation, incidence of solar radiation, temperature
and water excess in this period of cutting followed by
coppice of the stumps, as well as the recovery time of
the biomass on the site.
These results, without considering the losses of
soil nutrients by erosion, leaching and volatilization,
especially in areas of flat relief, reinforce the claim
of Evans (1999), that under certain conditions, the
nutrients export on the forest plantation may threaten
the sustainability of the site and that the most important
care to maintain the site quality is usually related to the
timber harvesting operations, to the conservation of
organic matter and to management remnant vegetation.
Conclusions
Elevated concentrations of Ca and Mg down to soil
depths between 60 and 80 cm, suggest that limestone
applied during planting had dissolved and the cations
had percolated into the subsoil.
The values of soil resistance down to 60 cm depth in
the planting row were lower than the values between
planting rows, indicating that deep tillage in the planting
row during preparation of the area for plantation was
effective in reducing the soil resistance, which could
enhance local root development and promote faster
growth.
The values of soil resistance, down to 20 cm depth, in
inter-row distance from 1.0 m of thee planting row, were
higher than those in the inter-row, which was attributed
to the likely increase in soil compaction in that part
of the area by vehicle tyre pressure on the soil during
preparation for planting.
The average annual growth in total volume (including
the bark) of 70.9 m3 ha-1 y-1 verified on this plot E.
urograndis in 3-years-old represents a forest of high
productivity.
343
The biomass of the canopy of E. urograndis in
3-years-old was different among the classes of DBH
studied, which justified the sample using DBH class
intervals, and showed the importance of making a
analysis of trees distribution by class in the plot for the
biomass and nutrients estimation accumulated in the
canopy in the forest site.
The observed variation in DBH in 3-year-old stems
did not relate to observed differences in wood density,
suggesting that tree age is a more important factor for
changes of this parameter than growth rate within an
even-aged stand.
Concerning an early cut of E. urograndis forest
plantations for traditional energy supply (firewood and
charcoal), the wood density observed in this 3-year-old
plantation was well below the values cited as adequate
for this purpose.
Removal of trees bark and its disposal in the field after
harvesting of the trees would be important to increase
the nutrient availability at the forest site for a second
rotation, as bark contained between 8% and 11% of the
forest P, K, Ca and Mg contents.
The bark contained about 56% and 67% of the total
Mg and Ca content of the stem, respectively.
The litter layer in the plot of E. urograndis contained
on average of 45% of the accumulated nutrients in the
biomass of the plot (above-ground tree biomass + litter).
A harvesting of trees in this 3-year-old plantation
forest would not result in a large nutrient export if
harvesting were limited to the bole, leaving bark and
slash on-site. Such a forest management decision would
contribute to forest sustainability at this site.
Acknowledgements
We thank the Suzano Pulp and Paper Company
for logistical support in the field, and EMBRAPA for
financial support, staff and laboratory analysis.
References
ADÁMOLI, J.; MACEDO, J.; AZEVEDO, L. G.; MADEIRA
NETO, J. S. Caracterização da Região dos Cerrados. In: Goedert
(Ed). Solos dos Cerrados: Tecnologias e estratégias de manejo.
São Paulo: Nobel, 1986. p.33-74.
ANDRADE, G. de C. Efeitos da aplicação de composto orgânico
de lixo urbano e de fertilizante mineral em povoamentos de
Eucalyptus grandis W. Hill ex Maiden”. 2002. 145 f. Tese
(Doutorado em Curso de Pós Graduação Em Engenharia Florestal) Setor de Ciências Agrárias, Universidade Federal do Paraná, Curitiba.
Pesq. flor. bras., Colombo, v. 31, n. 68, p. 331-346, out./dez. 2011
344
G. de C. Andrade et al.
ANDRADE, G. de C.; SILVA, H. D. DA; BELLOTE, A. F. J.;
FERREIRA, C. A. Efeitos da adubação fosfatada e da aplicação de
resíduo de celulose no crescimento de Eucalyptus dunnii. Boletim
de Pesquisa Florestal, Colombo, n 47, p. 43-54, 2003.
ANDRADE, G. de C.; BELLOTE, A. F. J.; SILVA, H. D. DA;
RIZZI, N. E.; GAVA, J. L. Acúmulo de nutrientes na biomassa
e na serapilheira de Eucalyptus grandis em função da aplicação
de lixo urbano e de nutrientes minerais. Boletim de Pesquisa
Florestal, Colombo, nº 53, p. 109-136, 2006.
ANUÁRIO estatístico da ABRAF 2011: ano base 2010. Brasília,
DF: ABRAF, 2011. 130 p. Disponível em: < http://www.abraflor.
org.br/estatisticas/ABRAF11/ABRAF11-BR.pdf>. Acesso em: 15
jun. 2011.
BARROS, N. F.; NOVAIS, R. F.; NEVES, J. C. L.; LEAL, P. G. L.
“Fertilizing eucalypt plantations on the Brazilian savannah soils”,
South African Forestry Journal, Pretoria, v. 160, p. 7-12, 1992.
BLACK, C. A. (Ed). Methods of soil analysis. Madison:
American Society of Agronomy, 1965. v. 2. (Agronomy
Monograph, 9).
BLOISE, R. M; MOREIRA, G. N. C.; DYNIA, J. F. Métodos
de análise de solos e calcários. 2. ed. rev. Rio de Janeiro:
EMBRAPA-SNLCS, 1979. 32 p. (EMBRAPA-SNLCS. Boletim
Técnico, 55).
BOUILLET, J. P.; NZILA, J. D., LACLAU, J. P., RANGER,
J. Effects of site management on Eucalyptus plantations in
the Equatorial Zone, on the Coastal Plains of the Congo. In:
Workshop Proceedings (1999). Eds. Nambiar, E.K.S.; Tiarks, A;
Cossalter, C.; Ranger, J. Kerala, Bogor: Center for international
Forestry Research, 2000. p.11-20
BRAGA, J.L.P. Estabilidade fenotípica de clone de Eucalyptus
urograndis, na Fazenda Bom Jardim - Aparecida - SP. 2008.
27p. (Monografia apresentada ao Curso de Engenharia Florestal,
como requisito parcial para a obtenção do Título de Engenheiro
Florestal).
BRIGATTI, R., A.; FERREIRA, M.; SILVA, A. P.; FREITAS, M.
Estudo comparativo do comportamento de alguns hibridos de
Eucalyptus spp. Piracicaba: IPEF, 1980. (Circular Técnica, 123).
BROWN, A.G., NAMBIAR, E.K.S., COSSALTER, C. Plantations
for the tropics their role, extent and nature. In: E.K.S. Nambiar
and A.G. Brown (Eds). Management of Soil, Nutrients and
Water in Tropical Plantation Forests, Canberra: Australian
Centre for International Agricultural Research, 1997. p. 1-23.
BRUIJNZEEL, L. A.; WIERSUM, K. F. A nutrient balance
sheet for Agathis dammara Warb. plantation forest under various
management conditions in central Java, Indonesia. Forest Ecology
and Management, Amsterdam, 10, p. 195-208, 1985.
BRUIJNZEEL, L. A. Nutrient input-output budgets of moist
tropical forest ecosystems: a review. Journal of Tropical
Ecology, Cambridge, v. 7, p. 1-24, 1991.
BRUIJNZEEL, L. A. Soil chemical responses to tropical forest
disturbance and conversion: the hydrological connection. In: A.
Schulte & D. Ruhiyat (Eds), Tropical Forest Soils and Their
Management], World Scientific Publications, Singapore, 1998. p.
45-61.
Pesq. flor. bras., Colombo, v. 31, n. 68, p. 331-346, out./dez. 2011
CASSELLS, D. S.; BRUIJNZEEL, L. A. Guidelines for
controlling vegetation, soil and water impacts of timber harvesting
in the humid tropics. In: M. Bonell & L.A. Bruijnzeel (Eds),
Forests, Water and People in the Humid Tropics. Cambridge:
University Press, 2005. p. 840-851.
COELHO, S. R. de F.; GONCALVES, J. L. M.; MELLO, S. L.
M.; SILVA, E. V.; MOREIRA, R.; LACLAU, J. P. Crescimento,
nutrição e fixação biológica de nitrogênio em plantios mistos
de eucalipto e leguminosas arbóreas. Pesquisa Agropecuária
Brasileira, Brasília, v. 42, p. 759-768, 2007.
DEDECEK, R. A.; GAVA, J. L. Influência da compactação do solo
na produtividade da rebrota de eucalipto. Revista Árvore, Viçosa,
v. 29, n. 3, p. 383-390, 2005.
DE MARIA, I. C.; ROSSETO, R.; AMBROSANO, E. J.;
CASTRO, O. M. de. Efeito da adição de diferentes fontes de
cálcio no movimento de cátions em colunas de solo. Science
Agricola., Piracicaba, v. 50, n. 1, p. 87-98, 1993.
EMBRAPA. Centro Nacional de Pesquisa de Solos. Manual de
métodos de análises de solo. 2.ed. revista e atualizada. Rio de
Janeiro: EMBRAPA, 1997. 212p
EVANS, J. Sustainability of forest plantations: the evidence:
a review concerning the narrow-sense sustainability of planted
forests. London: UK Department for International Development,
1999. 64 p.
FARAWAY, J. J. Linear Models with R. Boca Raton: Chapman
& Hall/CRC, 2005. 240p.
FATOS e números do Brasil florestal. São Paulo: Sociedade
Brasileira de Silvicultura, 2008. 92 p. Disponível em: <http://
www.sbs.org.br/FatoseNumerosdoBrasilFlorestal.pdf>. Acesso
em: 11 set. 2009.
FOLSTER, H.; KHANNA, P. K. Dynamics of nutrient supply
in plantation soils. In: Nambiar, E.K.S. and Brown, A. G.
(eds.). Management of Soil, Nutrients and Water in Tropical
Plantation Forests. Canberra: Australian Centre for International
Agricultural Research, 1997, n. 43, p. 339-378.
FREITAS, R.; SCHUMACHER, M. V.; CALDEIRA, M. V. W.;
SPATHELF, P. Biomassa e conteúdo de nutrientes em povoamento
de Eucalyptus grandis W. Hill ex Maiden plantado em solo sujeito
à arenização, no município de Alegrete-RS. Biomassa & Energia,
Viçosa, v. 1, n. 1, p. 93-104, 2004.
GATTO, D. A.; SANTINI E. J.; HASEILEN, C. R.; DURLO, M.
A. Qualidade da madeira serrada na região da quarta colônia de
imigração italiana do Rio Grande do Sul. Ciência Florestal, Santa
Maria, v. 14, n. 1, p. 223-233, 2003.
GONÇALVES, J. L. M.; SERRANO, M. I. P.; MENDES, K. C. F.
S.; GAVA, J. L. Effects of site management in Eucalyptus grandis
plantation in the Humid Tropics: São Paulo-Brasil. Workshop
Proceedings (1999). In: Nambiar, E.K.S.; Tiarks, A; Cossalter, C.;
Ranger, J. (eds.). Workshop Site Management and Productivity
in Tropical Plantation Forests, Kerala, 1999. Bogor: Center for
International Forestry Research, 2000a, p.3-10.
Site evaluation and productivity of a 3-year old stand of Eucalyptus urograndis in São Paulo, Brazil
GONÇALVES, J. L. M.; STAPE, J. L.; BENEDETTI, V.;
FESSEL, V. A. G.; GAVA, J. L. 2000. Reflexos do cultivo mínimo
intensivo do solo em sua fertilidade e na nutrição das árvores. In:
Gonçalves, J.L. de M, Benedetti, V. (eds.). Nutrição e fertilização
florestal. Piracicaba: IPEF, 2000b. 427 p.
345
HUSCH, B.; MILLER, C. I.; BEERS, T. W. Forest mensuration.
3.ed. Florida: Krieger Publishing Company, 1993. 402 p.
O´CONNELL, A. M.; GROVE, T. S.; MENDHAM, D.; RANCE,
S. J. Effects of site management in Eucalypt plantation in the
Southwestern Australia. Workshop Proceedings (1999). In:
Nambiar, E.K.S.; Tiarks, A; Cossalter, C.; Ranger, J. (eds.).
Workshop Site Management and Productivity in Tropical
Plantation Forests, Kerala, 1999. Bogor: Center for international
Forestry Research, 2000. p. 61-72.
MARTINS, O. C. Construção da Fertilidade do Solo
em Solos Arenosos. In: SIMPÓSIO DISCUTE COMO
UTILIZAR INSUMOS E RECURSOS PARA OTIMIZAR A
PRODUTIVIDADE DO MILHO, 2008. Piracicaba, SP: IPNI,
2008. Informações Agronômicas, n. 122, p. 21-23, jun. 2008.
Disponível em: < http://www.potafos.org/ppiweb/BRAZIL.
NSF/$webindex/B1BC51CED77A1D6B0325747A0074A532>.
Acesso em 18 maio 2011.
OLIVEIRA, L. B. Determinação de macro e microporosidade pela
mesa de tensão em amostras de solo com estrutura indeformada.
Pesquisa Agropecuária Brasileira, Brasília, v. 3, p. 197-200,
1968.
PANDE, M.C., TANDON, V.N., SHANKER, P.P. Distribution
of nutrients in an age series of Eucalyptus and Acacia
auriculaeformis plantations in Bihar. Indian Forester, Dehra Dun,
v.113, p. 418-426, 1987.
JETTEN, V. G. Interception of tropical rain forest: performance
of a canopy water balance model. Hydrological Processes,
Chichester, v. 10, p. 671-85, 1996.
PAVAN, M. A; BINGHAM, F. T.; PRATT, P. F. Redistribution of
exchangeable calcium, magnesium and aluminium following lime
or gypsum applications to a Brazilian oxisol. Soil Science Society
of America Journal, Madison, v. 48, p.33-38, 1984.
JORGENSEN, S. R.; WELLS, C. G.; METZ, L. J. The nutrient
cycle: key to continuous forest production. Journal of Forestry,
Washington, v. 73, n.11, p. 400-405, nov.1975.
LACLAU, J. P.; RANGER, J.; NZILA, J. de D.; BOUILLET, J.
P. Nutrient cycling in a short rotation Eucalyptus plantation and
an adjacent savanna in Congo. Workshop Proceedings (1999).
In: Nambiar, E.K.S.; Tiarks, A; Cossalter, C.; Ranger, J. (eds.).
Workshop Site Management and Productivity in Tropical
Plantation Forests, Kerala, 1999. Bogor: Center for international
Forestry Research, 2000. p.95-99.
LEÃO, T. P.; SILVA, da A. P. A simplified Excel® algorithm
for estimating the least limiting water range of soils. Scientia
Agricola, Piracicaba, v. 61, n. 6, p.649-654, 2004.
MASON, R. L.; GUNST, R. F., HESS, J. L. Statistical design
and analysis of experiments with applications to engineering
and science, Willey- Interscience, 2003. 728p.
MASON, R. L.; GUNST, R. F.; HESS, J. L. Analysis of
designs with random factor levels, in statistical design and
analysis of experiments: with applications to engineering and
science. 2nd. ed. Hoboken, NJ: John Wiley & Sons, 2003. doi:
10.1002/0471458503.ch10
MENDHAM, D. S.; O’CONNELL, A. M., GROVE, T. S.;
RANCE, S. J. Residue management effects on soil carbon and
nutrient contents and growth of second rotation eucalypts, Forest
Ecology and Management, Amsterdam, 181, p. 357-372, 2003.
MELLO S. L. M; GONÇALVES, J. L. M.; GAVA, J. L. Pré- and
post harvest fine root growth in Eucalyptus grandis stands installed
in sandy and loamy soils. Forest Ecology and Management,
Amsterdam, v. 246, p. 186-195, 2007.
NAMBIAR, E. K. S. Sustained Productivity of Forests Is a
Continuing Challenge to Soil Science. Soil Science Society of
America Journal, v. 60, p. 1629-1642, 1996.
MÉSZÁROS, E.; VÁRHEGYI, G.; JAKAB, E.,
MAROSVÖLGYI. B. Thermogravimetric and reaction kinetic
analysis of biomass samples from an energy plantation. Energy
and Fuels, v. 18, n. 2, p. 497-507, 2004.
POGGIANI, F.; COUTO, H. T. Z.; SUITER FILHO, W. Biomass
and nutrient estimates in short rotation intensively cultured
plantation of Eucalytpus grandis. IPEF, Piracicaba, v. 23, p. 3742, 1983.
QUAGGIO, J. A.; DECHEN, A. R.; RAIJ, B. van. Efeitos da
aplicação de calcário e gesso sobre a produção de amendoim e
lixiviação de bases no solo. Revista Brasileira de Ciências do
Solo, Campinas, v. 6, p.189-194, 1982.
RAIJ, B. van. Melhoria do ambiente radicular do subsolo.
In: SIMPÓSIO AVANÇADO DE SOLO E NUTRIÇÃO DE
PLANTAS, 2., Piracicaba, Anais, Campinas, Fundação Cargill,
1989, p.117-118.
RODIGHERI, H. R. Rentabilidade econômica comparativa
entre plantios florestais e sistemas agroflorestais com erva-mate,
eucalipto e pinus e as culturas do feijão, milho, soja e trigo.
Colombo: EMBRAPA-CNPF, 1997. 36 p. (EMBRAPA-CNPF.
Circular técnica, 26)
SANDS, R; GREACEN, E. L.; GERARD, C. J. Compaction
of sandy soils in Radiata pine forests. I. A penetrometer study.
Australian Journal of Soil Research, Melbourne, v. 17, p. 101113, 1979.
SANKARAN, K. V.; CHACKO, K. C.; PANDALAI, R.
C.; KALLARACKAL, J.; SOMEN, C. K.; SHARMA,
J. K.; BALAGOPALAN, M.; BALASUNDARAN, M.;
KUMARASWAMY, S.; SANKAL, S.; GILKES, R. J.; GROVE,
T. S.; MENDHA, M. D.; O´CONNELL, A. M. Effects of site
management on Eucalyptus plantations in the monsoonal tropics
– Kerala, Índia. Workshop Proceedings (1999). In: Nambiar,
E.K.S.; Tiarks, A; Cossalter, C.; Ranger, J. (eds.). Workshop Site
Management and Productivity in Tropical Plantation Forests,
Kerala, 1999. Bogor: Center for International Forestry Research,
p. 51-60, 2000
SARRUGE, J. R; HAAG, H. P.; 1974. Análises químicas em
plantas. Piracicaba: ESALQ/USP, 1974. 56 p
Pesq. flor. bras., Colombo, v. 31, n. 68, p. 331-346, out./dez. 2011
346
G. de C. Andrade et al.
SIMON, A. A. A cadeia produtiva da acácia-negra, aspectos
econômicos, sociais e ambientais. In: STROHSCHOEN, A. G.;
REMPEL, C. Reflorestamento e recuperação ambiental: ambiente
e tecnologia: o desenvolvimento sustentável em foco. Lajeado:
Univates, 2005. p. 149-166.
VAN HOOK, R. I.; JOHNSON, D. C.; WEST, D. C.; MANN, L.
K. Environmental effects of harvesting forests for energy. Forest
Ecology and Management, Amsterdam, v. 4, p. 79-94, 1982.
SPANGENBERG, A.; GRIMM, U.; SILVA, J. R. S.; FÖLSTER,
H. Nutrient store and export rates of Eucalyptus urograndis
plantations in eastern Amazonia (Jari). Forest Ecolology
Management, Amsterdam, v. 80, p. 225-234, 1996.
VOORHEES, W. B.; JOHNSON, J. F.; RANDALL G. W.;
NELSON, W. W. Corn growth and yield as affected by surface
and subsoil compaction. Agronomy Journal, Madison, v. 81, p.
294-303, 1989.
STURION, J. A.; PEREIRA, J. C. D.; CHEMIN, M. S. Qualidade
da madeira de Eucalyptus viminalis para fins energéticos em
função do espaçamento e idade de corte. Boletim de Pesquisa
Florestal, Curitiba, n. 16, p. 55-59, 1988.
TONINI, H.; ARCO-VERDE, M. F.; SCHWENGBER, D.;
MOURÃO JÚNIOR, M. Avaliação de espécies florestais em área
de mata no estado de Roraima. Cerne, Lavras, v. 12, n. 1, p. 8-18,
2006.
TURNER, J.; LAMBERT, M. Nutrient cycling in a 27 year
old Eucalyptus grandis plantation in New South Wales. Forest
Ecology and Management, Amsterdam, v. 6, p. 155-168, 1983.
Pesq. flor. bras., Colombo, v. 31, n. 68, p. 331-346, out./dez. 2011
VITAL, B. R. Métodos de determinação da densidade da madeira.
Viçosa, MG: SIF, 21 p. 1984, (Boletim técnico, 1).
WATERLOO, M. J. Water and nutrient dynamics of Pinus
caribaea. plantation forests on degraded grassland soils in
Southwest Viti Levu, Fiji. 1994. 478 f. Ph.D. Dissertation - Vrije
Universiteit, Amsterdam.
YATIM, B. B.; KONG, H. W. The quality of Charcoal from
Various Types of Wood. Fuel, London, v. 66, n. 9, p. 1305-1306,
1987.
ZOU, C.; SANDS, R.; BUCHAN, G.; HUDSON, I. Least limiting
water range: A potential indicator of physical quality of forest
soils. Australian Journal of Soil Research, Collingwood, v. 38,
p. 947-958, 2000.
Download