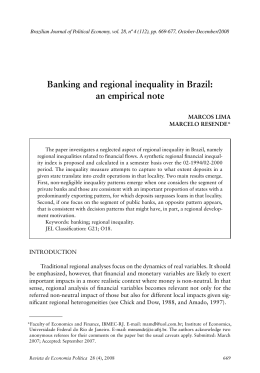
183
RESEARCH REPORT
Inequality, residential segregation by income, and
mortality in US cities
P Lobmayer, R G Wilkinson
.............................................................................................................................
J Epidemiol Community Health 2002;56:183–187
See end of article for
authors’ affiliations
.......................
Correspondence to:
Professor R G Wilkinson,
Division of Public Health
Sciences, University of
Nottingham Medical
School, Nottingham
NG7 2UH, UK;
Richard.Wilkinson@
Nottingham.ac.uk
Accepted for publication
25 May 2001
.......................
Study objective: This study was designed to discover whether the relation between income inequality
and population death rates within the United States was mediated by the degree of residential segregation between rich and poor.
Design: Using data for 276 metropolitan areas in the USA, residential segregation was defined as the
extent to which people with different levels of income live in the same or different census tracts. Two
segregation measures were used: the ratio of income inequality between household within tracts to the
inequality in average income between tracts, and the Jargowsky Neighbourhood Sorting Index.
Main results: Results suggest that segregation within urban areas is associated with an additional
mortality burden. However, the association between income inequality and mortality in these
metropolitan statistical areas was found to be independent of the degree of economic segregation
between their constituent neighbourhoods.
Conclusions: Most of the association between income inequality and mortality is not mediated by the
effects of greater residential segregation.
lthough numerous papers suggest that mortality rates
tend to be higher where income differences are larger,1–3
there is little agreement as to why this is so. The best evidence suggests that a tendency for more unequal areas to have
a larger proportion of poor people is not an adequate
explanation.4 Other suggested explanations have emphasised
the inadequacies of the material infrastructure in poorer areas 5
and the effects of more divisive social relations in less egalitarian places.6 7
Whether rich and poor live in the same or in different
neighbourhoods might also be expected to have a major influence on the effects of inequality. Analysing data from the 30
largest metropolitan areas in the United States, Waitzman and
Smith 8 reported that, after taking account of the effects of
individual incomes, greater economic segregation is associated with higher mortality rates, specially among the poor. As
they point out, “These results suggest that economic segregation in metropolitan areas might be a factor in the association
...between ...socioeconomic inequalities and mortality” (page
370).
Rather than looking merely at the health effects of
economic segregation in itself, we were primarily interested in
the question of whether economic segregation might mediate
the effects of income inequality. We therefore decided to see if
the relation between income inequality and mortality was
dependent on the effects of residential segregation by income.
Mortality has been found to be related to income inequality at
both the State and Metropolitan Statistical Area (MSA) levels
in the United States.2 9 As the concept of residential
segregation is normally applied only to urban areas and its
meaning is less clear in rural areas, we decided to examine the
ecological effects of residential segregation within the MSAs.
The inclusion of income data in the US Census makes it possible to examine the extent of segregation by income between
small areas within each metropolitan area.
A
years 1989, 1990, and 1991 to give more stable mortality rates.
The following six age standardised mortality rates were calculated for each sex separately: infant mortality, mortality 1–14
years, 15–34 years, 35–64 years, 65 years and over, and for all
ages combined. As a measure of all premature mortality we
also used potential years of life lost (PYLL) below age 65.11
Male and female PYLL and the all ages mortality rates were
standardised on the population of the whole United States in
1990. Our analysis covered 276 MSAs: official definitions
identified 281 MSAs in 1999 but CDC mortality data were
unavailable for five in Alaska and Puerto Rico.
Household income data were downloaded from the US
Census Bureau web site.12 Income recorded in the census is
total income (before taxation) from all sources, including
social security. We used income data from the 1990 US census
for each of the 45 563 populated census tracts situated within
the 276 MSAs (that is, about three quarters of all tracts in the
USA). The populations of these tracts ranged from 2 to 71 872,
with a mean of 4346. In taking census tracts as approximations of neighbourhoods we were following the precedent set
by other studies of residential segregation.8 13 14 MSA populations ranged from 57 000 in 22 627 households in Enid, Oklahoma, to 18 087 000 in 6 617 074 households in New York.
Income inequality was calculated for each MSA and for
each tract within an MSA. Taking each MSA as a whole, we
first calculated the overall inequality of all household incomes
in that MSA. Second, for each tract we calculated the within
tract income inequality (WTI). The WTI measures were then
grouped into the MSAs to which they belonged, and we calculated an average WTI for each MSA. Finally, we took the mean
incomes of each tract and calculated the average between tract
inequality (BTI) for each MSA. BTI was calculated for each
MSA as the variance of the logarithm of mean tract income
regardless of the proximity of tracts within each area. In
calculating the average WTI and BTI, each tract was weighted
METHODS
.............................................................
Mortality and population data were downloaded from the US
Center for Disease Control’s “Wonder” web site.10 We used
population data for 1990 and combined mortality for the three
Abbreviations: PYLL, potential years of life lost; MSA, Metropolitan
Statistical Area; WTI, within tract income inequality; BTI, between tract
inequality; JI, Jangowsky Index
www.jech.com
184
Lobmayer, Wilkinson
them. Higher values of this ratio therefore indicate greater
segregation: rich and poor are less likely to live in the same
tracts.
For comparison we also used the Jargowsky’s Neighbourhood Sorting Index.13 The formula for the Jargowsky Index
(JI) is the standard deviation of the mean incomes of
neighbourhoods (in this case tracts) divided by the standard
deviation of individual household income in the whole MSA.
To correspond with the denominator, each tract’s mean
income was weighted in the calculation of the numerator, by
the number of households it contained. The JI is then the ratio
of inequality between tracts to the total inequality, where
inequality is measured by the standard deviation of household
income. It is mathematically (but not necessarily empirically)
independent of the mean level of income and the magnitude
of overall inequality in the area. Higher values indicate more
segregation between rich and poor. Our two measures of segregation were then measures of average segregation by tract
within each MSA.
The statistical analysis used multiple regression. To see
whether the amount of residential segregation by income
affected the relation between mortality and overall MSA
income inequality, we regressed the mortality rates on overall
inequality and our two measures of residential segregation.
We included mean household income and mean household
size as covariates in all models. As populations in some of the
MSAs were as low as 60 000, analyses were weighted by
number of persons living in each.
Table 1 Means and standard deviations (SD) of
variables
Variables
Mean
SD
Overall inequality (log income variance)
Within tracts inequality (log income variance)
Between tracts inequality (log income variance)
Betweentract/within tract inequality ratio
Jargowsky segregation index
Mean household income
Household size
Male infant mortality*
Male mortality rate 1–14 years*
Male mortality rate 15–34 years*
Male mortality rate 35–64 years*
Male mortality rate 65 and over*
Male mortality rate all ages*
Male potential years of life lost < age 65
Female infant mortality rate*
Female mortality rate 1–14 years*
Female mortality rate 15–34 years*
Female mortality rate 35–64 years*
Female mortality rate 65 and over*
Female mortality rate all ages*
Female potential years of life lost < age 65
0.14
0.12
0.020
0.17
0.34
34481
2.70
1035
36.7
159.9
683.0
5826.8
914.6
69.3
804
26.4
60.4
384.7
4395.0
812.4
37.5
0.014
0.010
0.008
0.07
0.07
5169
0.20
230
9.12
43.6
122.1
611.1
104.5
13.3
190
8.0
15.7
59.6
360.8
72.8
6.6
*Death rates are per 100000.
according to its population. Thus, for each MSA, we had the
overall income inequality, the average WTI, and the BTI. At
each of these levels, inequality was measured by the variance
of logarithm of household income. We chose this inequality
measure because it enables a mathematically exact division of
the total inequality in each MSA into within tract and between
tract components. Summing the within tract and between
tract variance of log incomes in any state or MSA gives the
variance of log income in the whole MSA. (We are grateful to
Angus Deaton for advice on this point).
Our first measure of residential segregation by income in
each MSA was the ratio of BTI to WTI inequality (BTI/WTI).
Given some level of inequality in an MSA as a whole, if there
is less inequality within its tracts, there must be more between
RESULTS
Table 1 shows the means and standard deviations of all
dependent and independent variables. Among the MSAs the
correlation between overall inequality and its within tract and
between tract components was high (r=0.9 and r=0.8 respectively). However, when these two components were combined
to produce our BTI/WTI measure of segregation, the collinearity with overall inequality was reduced to an acceptable level:
BTI/WTI ratio and the JI showed correlations with overall
inequality of 0.60 and 0.65 respectively. The correlation
between our two measures of segregation BTI/WTI was so
Table 2 Results of regressions using inequality and segregation in separate
models: (i) The relation between income inequality and death rates, and (ii) The
relation between segregation and death rates
Death rates
Under 1 year
m
f
1–14 years
m
f
15–34 years
m
f
35–64 years
m
f
Over 65 years
m
f
All ages
m
f
PYLL
m
f
*Regression i Income inequality
*Regression ii Segregation (BTI/WTI)
β
p
Adj r
β
p
Adj r2
0.43
0.48
0.000
0.000
0.14
0.16
0.62
0.65
0.000
0.000
0.29
0.29
0.26
0.29
0.000
0.000
0.17
0.14
0.15
0.23
0.028
0.001
0.14
0.12
0.63
0.72
0.000
0.000
0.38
0.37
0.40
0.32
0.000
0.000
0.17
0.07
0.82
0.68
0.000
0.000
0.48
0.32
0.45
0.59
0.000
0.000
0.14
0.24
0.26
0.30
0.000
0.000
0.12
0.08
0.48
0.52
0.000
0.000
0.24
0.20
0.62
0.47
0.000
0.000
0.28
0.16
0.58
0.59
0.000
0.000
0.24
0.25
0.78
0.72
0.000
0.000
0.47
0.37
0.48
0.56
0.000
0.000
0.19
0.21
2
*The model using inequality does not include segregation, and the model using segregation does not include
inequality. Both models include mean household income and mean household size covariates, and both are
weighted by MSA populations.
www.jech.com
Inequality and segregation
185
Table 3 Regression of mortality rates using overall
inequality and residential segregation (BTI/WTI) in the
same model
*Regression results
Death rates
Under 1 year
m
f
1–14 years
m
f
15–34 years
m
f
35–64 years
m
f
Over 65 years
m
f
All ages
m
f
PYLL under 65
m
f
Overall inequality
Segregation
(BTI/WTI)
β
P
β
p
Adj r2
0.19
0.24
0.004
0.000
0.54
0.55
0.001
0.001
0.31
0.32
0.24
0.24
0.001
0.001
0.04
0.12
0.573
0.106
0.17
0.15
0.62
0.72
0.000
0.000
0.13
0.01
0.047
0.930
0.39
0.37
0.78
0.53
0.000
0.000
0.11
0.36
0.064
0.001
0.49
0.40
0.06
0.09
0.363
0.202
0.45
0.48
0.001
0.001
0.24
0.20
0.46
0.27
0.000
0.000
0.37
0.47
0.001
0.001
0.36
0.29
0.71
0.60
0.000
0.000
0.17
0.29
0.004
0.001
0.48
0.42
*The model includes mean household income and mean household
size covariates and is weighted by MSA populations.
high (r=0.91) that relations with mortality were essentially
the same throughout the analysis and for this reason we show
only the results using BTI/WTI.
We looked first at how mortality was related separately to
income inequality and then to residential segregation. Table 2
shows results of two different models: the first with income
inequality but not segregation, and the second with segregation but not inequality. Both models included mean household
income and household size and MSAs were weighted by their
populations. The results of the first model confirm the strong
associations previously reported 2 9 between income inequality
and mortality at the MSA level. PYLL and all ages mortality
rates for both men and women separately was strongly and
highly significantly related to the variance of log income (in all
cases p<0.001) (see table 2).
When the income inequality variable was replaced by our
measures of residential segregation (model ii. in table 2) the
regressions showed that segregation was positively and
significantly related to all the age specific mortality rates,
including PYLL and all ages mortality rates, for men and
women (in almost all cases p<0.001). Metropolitan areas in
which rich and poor tend to live in separate areas tend to have
higher mortality rates.
To discover how the association between mortality and
income inequality might be affected by the degree of residen-
Percentage of variance
35
MSA inequality
Mean income
BTI/WTI segregation
30
25
20
15
10
5
0
Men
Women
Figure 1 Percentage of variance in PYLL under 65 years of age
explained by each variable independently of the other two.
tial segregation, we put overall income inequality and
measures of residential segregation into the model at once
(including mean household income and mean household size
as before). The results of these regressions using the BTI/WTI
segregation measure are shown in table 3. PYLL and the all
ages mortality rates for both men and women remain significantly and independently related to income inequality. Among
the age specific death rates only the relations among men and
women over 65 years does not show significant independent
relations with income inequality.
The associations between mortality rates and residential
segregation, independent of MSA income inequality, are also
shown in table 3. Segregation was independently and
positively related to infant mortality and to mortality over 65
years in both sexes, and to death rates for women 35–64 years.
The relation between segregation and mortality among men
15–34 years old just reached statistical significance and with
men 35–64 years it just failed to reach significance. In short,
segregation, independent of inequality, was more closely
related to mortality at each end of life than to mortality among
children and younger adults. These age specific associations
were however enough to produce significant associations with
the all ages mortality rates and with PYLL for both sexes.
PYLL and all ages mortality rates for both sexes were then
independently and significantly related to both inequality and
segregation.
Using the JI instead of BTI/WTI measure of segregation to
repeat the analysis shown in table 3 showed no important differences between the two sets of results. MSA inequality continued to be independently related to all the death rates except
those for men and women over 65 years—though the association for women over 65 years bordered on statistical significance (p=0.06). The JI was again independently related to
death rates at each end of life though, among men, it was only
mortality in childhood which was not independently related
to segregation.
DISCUSSION
Income inequality seems to be related to mortality independently of the measures of economic segregation, and the segregation measures were related—independently of overall
inequality—to some of the age specific mortality rates, to PYLL
and to the all ages mortality rates. The sizes of the statistically
independent effects on male and female PYLL of overall
inequality, segregation, and mean income in MSAs is shown in
figure 1. Controlling for segregation attenuates the effect of
income inequality on infant mortality and removes the effect
on men and women over 65 years. However, after controlling
for residential segregation, mean income and household size,
substantial and significant relations remain between income
inequality and all the other death rates.
It might be expected that the degree of segregation between
income groups would be driven by the extent of overall income
inequality. Not only has residential segregation by income
increased in the USA as income differences have widened,13
but in this cross sectional analysis, both measures of segregation are strongly correlated with overall income inequality
(r=0.6). One effect of this is that, although we can establish
that they have independent effects, the apportionment of that
part of the mortality variance that is related to the covariance
between inequality and segregation is unreliable. Segregation
may be statistically related to mortality only because it is
closely associated with inequality.
In the hope of casting more light on these relations we ran
more multiple regressions, replacing overall inequality and
our segregation measures with WTI and BTI as two separate
variables. As before, the model included mean income and
mean household size. The results are shown in table 4. If segregation rather than inequality was regarded as the primary
variable, it might have been expected that within tract
www.jech.com
186
Lobmayer, Wilkinson
Key points
• The degree of residential segregation by income is closely
related to the extent of income inequality in US cities.
• Age specific mortality rates throughout life are associated
with both income inequality and residential segregation by
income.
• Infant mortality and mortality after age 65 are more
strongly associated with segregation than income inequality.
• After controlling for segregation, mortality at other ages,
and potential years of life lost before age 65 remain
strongly associated with income inequality.
Table 4 Mortality rates regressed on within tract
and between tract income inequality
*Regression results
Death rates
Under 1 year
m
f
1–14 years
m
f
15–34 years
m
f
35–64 years
m
f
Over 65 years
m
f
All ages
m
f
PYLL under 65
m
f
Within tract
inequality
Between tract
inequality
β
p
β
p
r2
−0.04
−0.02
0.420
0.750
0.70
0.73
0.001
0.001
0.31
0.33
0.15
0.12
0.016
0.061
0.18
0.27
0.016
0.000
0.17
0.15
0.36
0.45
0.000
0.000
0.48
0.42
0.000
0.000
0.39
0.37
0.47
0.23
0.000
0.000
0.55
0.68
0.000
0.000
0.49
0.40
−0.09
−0.08
0.120
0.155
0.52
0.57
0.000
0.000
0.23
0.20
0.19
0.03
0.000
0.600
0.66
0.66
0.000
0.000
0.36
0.29
0.40
0.29
0.000
0.000
0.58
0.66
0.000
0.000
0.49
0.42
*The model includes mean household income and mean household
size covariates and is weighted by MSA populations.
inequality (less segregation) would be negatively related to
mortality. However, both between tract and within tract
inequality are strongly related to many of the mortality rates
and all the statistically significant relations are positive. This
suggest that inequality is damaging whether it is within or
between tracts, and that any effect of segregation is of
secondary importance.
What light do these results cast on the nature of the relation
between income inequality and mortality? One way in which
inequality might be thought to influence mortality is through
the health effects of the inadequate infrastructure, schools,
and other services in poorer areas consequent on their reduced
local tax base and political influence. Such an affect should be
largely captured by the extent of residential segregation that
tends to accompany greater income inequality. While our
results show an independent association between residential
segregation and mortality that is consistent with such an
effect, it does not account for most of the association between
inequality and mortality. We had originally included in this
study an analysis of residential segregation by income in the
50 states as well as within the MSAs. We left it out of this
report partly because it was not clear what the concept of residential segregation would mean in rural areas (where
everyone might be regarded as spatially segregated from
everyone else) and partly at the suggestion of referees. The
www.jech.com
only substantial difference between the results for the State
and MSA level analyses was that at the State level residential
segregation between census tracts had no significant effects
on mortality which were independent of State income
inequality, on any of the mortality rates. Although both State
inequality and residential segregation within states were
related to mortality on their own, when both were entered into
the regression together, only State inequality had statistically
significant independent effects on mortality. This is worth
pointing out because, despite the difficulty in interpreting the
meaning of segregation in non-urban areas, rural areas with
concentrated poverty would still tend to suffer from less good
services and infrastructure. Therefore the fact that residential
segregation did not seem to contribute to the association
between State income inequality and mortality suggests that
poorer local services may have only a minor influence on mortality.
There is however some evidence that there may be
important exceptions to this last point. Table 2, in which mortality was regressed separately on inequality and segregation,
suggests a tendency for associations with segregation to be
strongest in the age groups where the relation with inequality
is weaker. In both sexes, infant mortality rates and mortality
over 65, are the only age specific mortality rates related more
closely to segregation than to inequality. The same pattern
recurs in table 3, in which inequality and segregation are
entered into the same equation to show their effects
independently of each other. In the MSAs, mortality at each
end of life is related more closely to segregation than to
inequality.
It is, however, among the old and the very young that we
might expect the impact of medical care to be greatest. Indeed,
a paper by Shi et al15 suggested that the relation between State
income inequality and mortality was partly attributable to
fewer primary care physicians per head of population in the
less egalitarian states. That paper reported that the provision
of primary care physicians was related most strongly to postneonatal and stroke mortality—which is of course most common in later life. If mortality at each end of life is influenced
by access to primary care, and access is—as the inverse care
law16 suggests—worse in the poorer areas, then segregation
may increase mortality by reducing access to primary care.
However, whether the impact of medical care is strong enough
to compete with the influence of social factors as a major
determinant of infant mortality remains controversial and
many of the social risk factors are likely to be increased by the
residential segregation of the poor in the inner cities.17 18
But although there is evidence that lends itself to such
interpretations among infants and the elderly, our data
suggest that rather than explaining the effect of inequality,
any such effect is statistically rather separate from the impact
of inequality. Mortality among children and people of working
age seems much more closely related to inequality than to
segregation. We suspect that the main effects of inequality in
these age groups are more likely to derive from aspects of the
experience of relative deprivation and low social status that
are not dependent on the degree of residential segregation by
income.
In conclusion, though residential segregation of rich and
poor is associated with higher mortality rates, both before and
after controlling for income inequality in US metropolitan
areas, it does not account for most of the association between
mortality and the overall income inequality in those areas.
ACKNOWLEDGEMENTS
The authors were supported by a grant from MRC. They are grateful to
Dr Mah-j Soobader and Dr Bruce Kennedy for advice on methods and
helpful comments on an earlier draft of this paper.
.....................
Authors’ affiliations
P Lobmayer, Institute of Public Health, Semmelweis University of
Medicine, Budapest, Hungary
Inequality and segregation
R G Wilkinson, Division of Public Health Sciences, University of
Nottingham Medical School and International Centre for Health and
Society, University College London, UK
REFERENCES
1 Kawachi I, Kennedy B, Wilkinson RG. eds. Income inequality and
health. The Society and Population Health Reader. Vol 1. New York:
New Press, 1999.
2 Lynch J, Kaplan GA, Pamuk ER, et al. Income inequality and mortality in
metropolitan areas of the United States. Am J Public Health
1998;88:1074–80.
3 Hales S, Howden-Chapman P, Salmond C, et al. National infant
mortality rates in relation to gross national product and distribution of
income. Lancet 1999;354:2047.
4 Wolfson M, Kaplan G, Lynch J, et al. The Relationship Between Income
Inequality and Mortality: an empirical demonstration. BMJ
1999;319:953–7.
5 Muntaner C, Lynch J. Income inequality, social cohesion and class
relations: A critique of Wilkinson’s neo-Durkheimian research program.
Int J Health Serv 1999;29:59–81.
6 Wilkinson RG. Inequality and the social environment: a reply to Lynch et
al. J Epidemiol Community Health 2000;54:411–13.
7 Marmot M, Wilkinson RG. Income and health: psychosocial and
material pathways: a reply to Lynch et al. BMJ 2001;322:1233–6.
187
8 Waitzman NJ, Smith KR. Separate but lethal: the effects of economic
segregation on mortality in metropolitan America. Milbank Memorial
Fund Q 1998;76:341–73.
9 Kennedy BP, Kawachi I, Prothrow-Stith D. Income distribution and
mortality: cross sectional ecological study of the Robin Hood index in the
United States. BMJ 1996;312:1004–7.
10 Center for Disease Control. http://wonder.cdc.gov/mortsql.shtml
11 Blane D, Davey Smith G, Bartley M. Social class differences in years of
potential life lost: size, trends, and principal causes. BMJ
1990;301:429–32.
12 US Census Bureau. http://www.census.gov/population/estimates/
metro-city/a99mfips.txt
13 Jargowsky P. Take the money and run: economic segregation in U.S.
metropolitan areas. American Sociological Review 1996;61:984–98.
14 White MJ. American neighborhoods and residential differentiation. New
York: Russel Sage Foundation (Census Monograph Series), 1987.
15 Shi L, Starfield B, Kennedy B, et al. Income inequality, primary care, and
health indicators. J Fam Pract 1999;48:275–84.
16 Hart JT. The inverse care law. Lancet 1971;i:405–12.
17 Sable MR, Wilkinson DS. Impact of perceived stress, major life events
and pregnancy attitudes on low birth weight. Fam Plann Perspect
2000;32:288–94.
18 Olson GL, Saade GR, Nagey DA. Active recruitment into health care
and its effect on birth weight and gestational age at delivery. J Matern
Fetal Investigation 1997;7:122–5.
www.jech.com
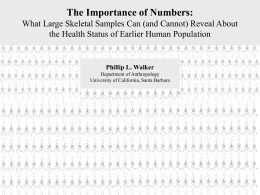
Download