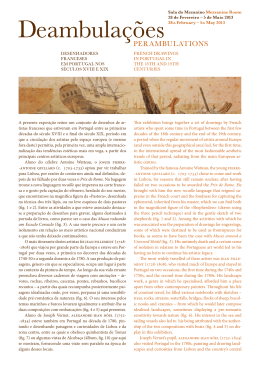
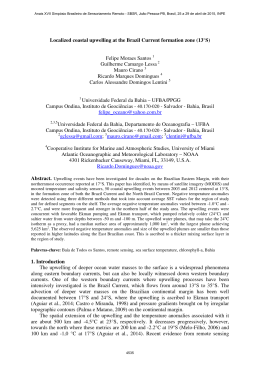
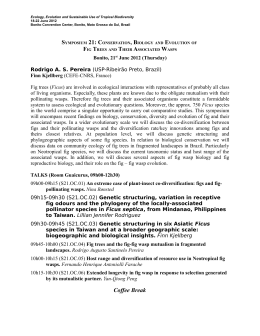
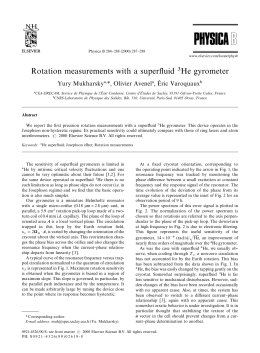
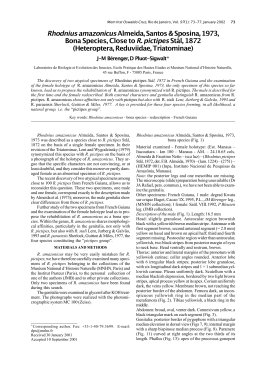
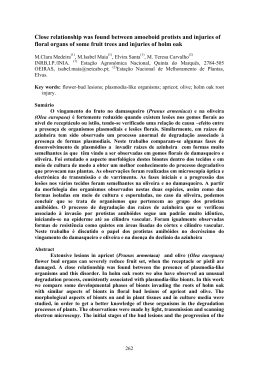
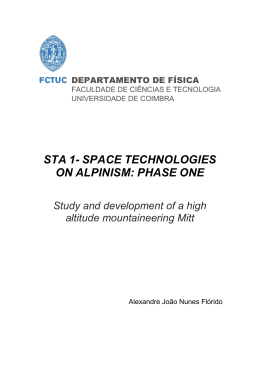
15 April 2015
Japan Meteorological Agency
Monthly Highlights on the Climate System (March 2015)
Highlights in March 2015
- Monthly mean temperatures were the highest on record for March in northern Japan.
- Monthly mean temperatures were extremely high from the western USA to northwestern Mexico.
- The Siberian High was weaker than normal, and the Aleutian Low was weaker than normal over the western part of its
normal position.
- Convective activity in the tropics was enhanced around the date line and Africa.
- Remarkably positive SST anomalies were observed near the date line in the equatorial Pacific.
Climate in Japan:
Developing low pressure systems passed around Japan
repeatedly and brought heavy rain and snow particularly
in northern Japan. Besides, because of warm southerly
wind brought by stationary high pressure systems on the
sea east of Japan, monthly mean temperatures were the
highest on record for March since 1946 in this region.
World Climate:
The monthly anomaly of the global average surface
temperature in March 2015 (i.e., the combined average of
the near-surface air temperature over land and the SST)
was +0.31 °C (the warmest since 1891) (preliminary
value) (Fig. 2). On a longer time scale, global average
surface temperatures have risen at a rate of about 0.83°C
per century in March (preliminary value).
Extreme climate events were as follows (Fig. 3).
- Monthly precipitation amounts were extremely heavy
around western India.
- Monthly mean temperatures were extremely high from
the western USA to northwestern Mexico.
- Monthly precipitation amounts were extremely heavy
around Mexico.
Extratropics:
In the 500-hPa height field (Fig.4), the polar vortices
were seen around Greenland and Central Siberia. Positive
anomalies were observed over the western USA, northern
Europe, and the area from the southern part of Eastern
Siberia to the east of Japan. The sub-tropical jet stream
shifted southward around northwestern India and
northward over southern China. The strong polar front jet
stream was observed over northern Eurasia (Fig. 5). The
Siberian High was weaker than normal, and the Aleutian
Low was weaker than normal over the western part of its
normal position.
Tropics:
Convective activity was enhanced around the dateline
and Africa, and was suppressed from the central Indian
Ocean to Indonesia and the eastern Pacific (Fig. 6). The
active phase of the Madden-Julian Oscillation (MJO)
propagated eastward over the western Pacific in early
March, from the eastern Pacific to the Atlantic Ocean in
mid-March, and over Africa in late March (Fig. 7). In the
equatorial lower troposphere, westerly wind anomalies
were dominant over the western Pacific, and easterly
anomalies were seen over the eastern Pacific in the first
half of March, while westerly wind anomalies were
dominant throughout the equatorial Pacific in the second
half of March (Fig. 7). In the upper troposphere, wave
trains were observed along the subtropical jet stream (Fig.
8). The Southern Oscillation Index value was -0.7 (Fig.
10).
Oceanographic Conditions:
Remarkably positive SST anomalies were observed
near the date line in the equatorial Pacific. The monthly
mean SST anomaly in the NINO.3 region was +0.1℃
and the SST deviation from the latest sliding 30-year
mean was +0.2℃. In the North Pacific, remarkably
positive SST anomalies were observed from far east of
Japan through the south of Alaska and the coast of North
America to near the date line in the equatorial region, and
remarkably negative SST anomalies were observed from
near 25˚N, 160˚E to near 30˚N, 155˚W. In the South
Pacific, remarkably positive SST anomalies were
observed from the eastern coast of Australia to near 15˚S,
160˚W, and from near 30˚S, 120˚W to near 40˚S, 80˚W,
and remarkably negative SST anomalies were observed
from near 20˚S, 125˚W to near 20˚S, 90˚W. In the Indian
Ocean, remarkably positive SST anomalies were
observed from the western coast of Australia to near 15˚S,
60˚E. In the North Atlantic, remarkably positive SST
anomalies were observed from near the eastern coast of
North America and the Gulf of Mexico to near 35˚N,
30˚W, and remarkably negative SST anomalies were
observed near the western coast of North Africa and south
of Greenland. These SST anomalies formed a tripole
pattern.
1
15 April 2015
Japan Meteorological Agency
Fig. 1 Monthly climate anomaly / ratio over Japan
(March 2015)
Top: temperature anomalies (oC)
Middle: precipitation ratio (%)
Bottom: sunshine duration ratio (%)
Anomalies are defined as the deviations from the normal
(1981-2010 average).
Fig. 2 Long-term change in monthly anomalies of
global average surface temperature in March
The thin black line indicates anomalies of the surface
temperature in each year. The blue line indicates five-year
running mean, and the red line indicates a long-term linear
trend. Anomalies are deviations from the 1981-2010
average.
Fig. 3
Distribution of extreme climate events (March 2015)
2
15 April 2015
Fig. 4
Japan Meteorological Agency
Monthly mean 500-hPa height and anomaly in
the Northern Hemisphere (March 2015)
The contours show heights at intervals of 60 m. The
shading indicates height anomalies. The base period for the
normal is 1981-2010.
Fig. 6
Fig. 5 Monthly mean 200-hPa wind speed and
vectors in the Northern Hemisphere (March
2015)
The black lines show wind speeds at intervals of 15 m/s.
The darkest blue shading shows values greater than 45 m/s.
The purple lines show normal wind speeds at intervals of
30 m/s. The base period for the normal is 1981-2010.
Monthly mean Outgoing Longwave Radiation (OLR) anomaly (March 2015)
The contour interval is 10 W/m2. The base period for the normal is 1981-2010. Original data provided by NOAA.
Fig. 7
Time-Longitude cross section (5°N-5°S) of five-day running mean 200-hPa velocity potential anomaly (left)
and 850-hPa zonal wind anomaly (right) (October 2014 - March 2015)
The contour intervals are 4x10⁶ m2/s (left) and 2 m/s (right). The base period for the normal is 1981-2010.
3
15 April 2015
Fig. 8
Japan Meteorological Agency
Monthly mean 200-hPa stream function and anomaly (March 2015)
The contour interval is 10x106 m2/s. The base period for the normal is 1981-2010.
Fig. 9
Monthly mean sea surface temperature anomaly (March 2015)
The contour interval is 0.5 oC. The base period for the normal is 1981-2010. Maximum coverage with sea ice is shaded in gray.
o
Fig. 10 Time series of monthly mean SST departure ( C) from the reference value defined as the immediate past
30-year mean SST averaged over the NINO.3 region (upper). Time series of the Southern Oscillation Index
with respect to the 1981-2010 base period (lower).
Thin blue lines represent monthly means and thick blue lines five-month running means. Periods of El Niño and La Niña events are
shown as red-colored and blue-colored boxes, respectively.
Detailed information on the climate system is available on the Tokyo Climate Center's website.
http://ds.data.jma.go.jp/tcc/tcc/index.html
This report is prepared by the Climate Prediction Division, Global Environment and Marine Department, Japan Meteorological
Agency.
4
Download