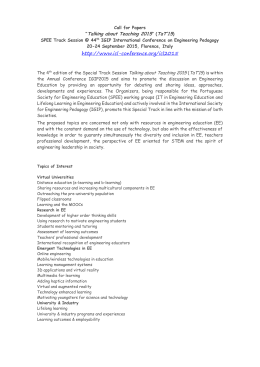
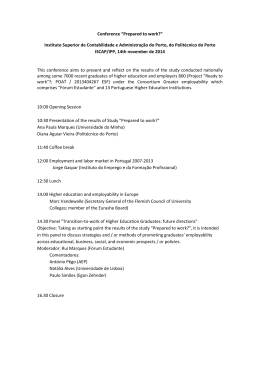
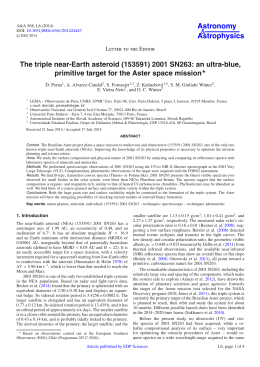
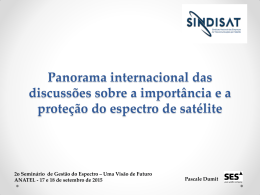
Versão online: http://www.lneg.pt/iedt/unidades/16/paginas/26/30/185
Comunicações Geológicas (2014) 101, Especial I, 191-194
IX CNG/2º CoGePLiP, Porto 2014
ISSN: 0873-948X; e-ISSN: 1647-581X
Cathodoluminescence (CL) spectroscopy: distinction of
generations of quartz based on its emission spectrum
Espetroscopia de catodoluminescência (CL): distinção de
gerações de quartzos com base no espetro de emissão
A. Santos1*, H. Couto1, C. Sá2
Artigo Curto
Short Article
© 2014 LNEG – Laboratório Nacional de Geologia e Energia IP
Abstract: The lattice defects causing different CL emissions in
quartz often reveal the specific physicochemical conditions of crystal
growth, providing a signature of genetic conditions of mineral
formation.
The cathodoluminescence spectroscopy was applied to some samples
of quartz from Durico-Beirão gold-antimony district, Panasqueira
mine, Migmatitic Belt of the NW coast of Portugal, a sample of
Porto´s Granite and a quartz crystal from granitic pegmatite from
Companheiro (Penalva do Castelo).
The aim of this work was to distinguish quartz generations based on
their Cathodoluminescence (CL) emission spectra and to demonstrate
and control the operability of the spectrometer (SP2300i and a CCD
Pixis 400B) coupled to the equipment HC3-LM belonging to the
Center of Geology of the University of Porto.
In general, hydrothermal quartz have three emission bands around
1.91, 2.5 and 2.8 eV. Igneous quartz presents more complex spectra
with less prominent bands, which are difficult to identify by visual
inspection. However four emission bands were determined around
1.8, 2.2, 2.5 and 2.8 eV by Gaussian modeling.
Nevertheless the emission bands in igneous quartz were not exactly
what was expected for this quartz type. It was possible to distinguish
them from the hydrothermal quartz as these had their own CL
emission spectra, with a particular behavior, a transient emission
band around 2.5 eV. This accords to published data.
Keywords: Cathodoluminescence, Spectroscopy, Quartz.
Resumo: Os defeitos estruturais que causam as diferentes emissões
de CL do quartzo, muitas vezes refletem as condições físicoquímicas específicas do crescimento dos cristais e por esta razão
podem constituir uma assinatura de condições genéticas de formação
do mineral.
A espetroscopia de catodoluminescência foi aplicada a quartzos do
distrito auri-antimonífero Dúrico-Beirão, da Mina da Panasqueira, da
Faixa Migmatítica da costa NW de Portugal, uma amostra de granito
do Porto e um cristal de quartzo do pegmatito granítico do
Companheiro (Penalva do Castelo).
O objetivo deste trabalho foi distinguir gerações de quartzo com base
nos espetros de emissão de Catodoluminescência (CL) e assim,
demonstrar e controlar a operacionalidade do espetrómetro (SP2300i
e CCD Pixis 400B) acoplado ao equipamento HC3-LM pertencente
ao Centro de Geologia da Universidade do Porto.
Os quartzos hidrotermais apresentaram geralmente três bandas de
emissão aos 1,91, 2,5 e 2,8 eV. Os quartzos ígneos apresentam um
espetro mais complexo, com bandas pouco distintas, difíceis de
identificar por inspeção visual. No entanto, através da modulação
foram determinadas quatro bandas de emissão em torno dos 1,8, 2,2,
2,5 e 2,8 eV.
Embora nos quartzos ígneos as bandas de emissão não
correspondessem exatamente às esperadas para este tipo de quartzo,
foi possível distingui-los dos quartzos hidrotermais, dado estes
últimos apresentarem um espetro de emissão de CL característico,
com um comportamento particular, uma banda de emissão transitória
em torno de 2,5 eV, coincidindo com os dados publicados.
Palavras-chave: Catodoluminescência, Espetroscopia, Quartzo.
1
Universidade do Porto, Faculdade de Ciências, Departamento de Geociências,
Ambiente e Ordenamento do Território, Rua do Campo Alegre 687, 4169-007
Porto, Portugal.
2
Centro de Materiais da Universidade do Porto, Rua do Campo Alegre, 823,
4150-180 Porto, Portugal.
*
Corresponding author / Autor correspondente: [email protected]
1. Introduction
The study of different samples of quartz by
Cathodoluminescence Spectroscopy was performed after
the operationalization process of the spectrometer
composed by a spectrograph SP2300i and a CCD Pixis
400B. The main objective was to demonstrate its
operability by distinguishing quartz generations based on
their Cathodoluminescence (CL) emission spectra.
After feldspar, quartz is the second most abundant
mineral in the Earth´s crust and is a common mineral in
many igneous, metamorphic and sedimentary rocks.
Therefore, the awareness of the properties of this mineral
is important for many geological investigations.
Cathodoluminescence is a common phenomenon in
solids that results from complex physical processes after
excitation by an electron beam. The emitted luminescence
can be studied by imaging or spectroscopy. Imaging
provides information on different phases, defects, zoning
and internal structure while spectroscopy provides
information for the characterization of the real structure of
minerals and detection of trace elements, their valence and
structural position.
Quartz CL spectrum has several emission bands which
are directly related to lattice defects. The type and
frequency of lattice defects are influenced by the
thermodynamic
conditions
during
mineralization.
However, post mineralization effects, such as
192
metamorphism, tempering or deformation can change the
structural properties (Götze et al., 2001). Thus, the current
structure of the mineral reflects the specific conditions of
its formation.
Several authors have demonstrated that the occurrence
of specific luminescence emissions bands in quartz can
often be related to the specific conditions of its formation
(Ramseyer et al., 1988; Ramseyer & Mullis; 1990; Götze
et al., 2001; Götze, 2009).
The most common CL emission bands in natural quartz
are 450 nm (2.8 eV) and 650 nm bands (1.91 eV) (Götze et
al., 2001). These are detectable in quartz crystals from
magmatic and metamorphic rocks as well as in authigenic
quartz from sedimentary environments (Götze, 2012). A
transient emission around 500 nm (2.45 eV) is typical of
quartz from pegmatite (Götze et al., 2005) but its
occurrence is also common in hydrothermal quartz. Also
in hydrothermal quartz it is typical to have a band around
390 nm (3.1 eV) (Ramseyer & Mullis, 1990; Perny et al.,
1992; Götze et al., 2001) with an unstable behavior.
Generally, the decrease of the blue CL emission during
electron bombardment have a simultaneous increase of the
650 nm emission. Lastly, there is a band around 580 nm
(2.1 eV) that has been detected only in natural
hydrothermal quartz, cryptocrystalline chalcedony and
agate (Götze et al., 1999; Götze, 2009).
2. Materials and methods
In this study, twenty-two samples of quartz, previously
studied by other authors, using other techniques, were
analyzed.
The samples are from the Dúrico-Beirão goldantimony mining district (Couto et al., 1990, 1999, 2010,
Couto, 1993; Couto & Borges, 2005), Panasqueira mine
(Lourenço, 2002), Migmatitic Belt of the NW coast of
Portugal (Areias et al., 2012a, 2012b, 2013), Porto Granite
(Almeida, 2001) and a quartz crystal from Companheiro
granitic pegmatite (Canhoto et al., 2012).
CL studies were carried out on polished thin sections
using a hot cathode CL microscope Lumic HC3-LM,
belonging to the Center of Geology of the University of
Porto (Couto, 2008). The system was operated at 14kV
with a filament current of 0.18 mA. The samples were
coated with a gold film using a Cressington 108Auto
device to prevent electrical charge build-up during the
analysis.
The acquisition of the spectral response was performed
using a triple-grating spectrograph SP2300i equipped with
the Pixis 400B CCD detector. The CL spectra were
measured with a 150 g/mm diffraction grating centered at
550 nm in standardized conditions (emission peaks of Hg)
and an acquisition time of 30 sec. Two spectra of each
quartz were acquired: one at the beginning of the analysis
and another at the end.
The spectra modeling with Gaussian peaks was done
using the software OpticalFit (Torpy & Wilson, 2011). The
bands were positioned by visual inspection and their nature
A. Santos et al. / Comunicações Geológicas (2014) 101, Especial I, 191-194
was evaluated by comparing the initial and final spectra of
each quartz.
3. Results and discussion
The Gaussian modelling of the spectra was performed on
fifteen of the twenty-two samples. In the remaining
samples, quartz spectra was disturbed by dispersed light
from strongly emitting minerals (apatite and K-feldspar), a
problem related to the low spatial resolution of HC3-LM
(Götze & Kempe, 2008).
The comparison between the initial and final spectra of
each quartz revealed a shift in the emission bands during
electron beam exposure. Generally, during electron
bombardment the blue CL emission decreased while there
was an increase of the red CL emission. The hydrothermal
quartz showed a more unstable behavior with larger
intensity variation in the blue CL region than igneous
quartz. These shown a more stable behavior, with less
variation of their intensities along the spectra (Santos,
2013) (Fig.1).
The Gaussian modeling of the spectra from the initial
CL spectra of quartz shows the presence of several
overlapping emission bands (Table 1).
Table 1. Emission bands determined by Gaussian modeling of the
spectra in OpticalFit software.
Tabela 1. Bandas de emissão determinadas por modelação Gaussiana
dos espetros no software OpticalFit.
Hydrothermal quartz (8B, Pan5O, Pan11O, Pan12O,
Pan200, Pan5S, Pan6S and Pan 163) has essentially three
bands around 1.91 (650 nm), 2.5 (500 nm) and 2.8 eV (450
nm) (Fig.2). Sample 8B shows a band around 1.97 eV (630
nm) that was considered in the modelling process but
doesn’t have a significant weight in the spectrum (Santos,
2013).
The results are consistent with published data (Götze,
2012 and references therein). The 1.91 (650 nm) and the
2.8 eV (450 nm) bands are the most common in quartz and
the 2.5 eV (500 nm) band is often observed on
hydrothermal quartz but is typical of quartz pegmatite. In
this type of quartz a transient band would be expected
around 3.1 eV (390 nm). However, due to the
configuration of the equipment, emissions below 3 eV
(400 nm) are absorbed by the optical glass (Götze &
Kempe, 2008).
Cathodoluminescence spectroscopy of quartz
Igneous quartz (60RS, VC45, VC27a, VC17 and 11)
have more complex spectra with more overlapping bands
leading to a greater difficulty for visual identification. Four
bands around 1.8 (680 nm), 2.2 (560 nm), 2.5 (500 nm)
and 2.8 eV (450 nm) were identified by modeling (Santos,
2013) (Fig.2). In this type of quartz the two more common
emission bands at 1.91 (650 nm) and 2.8 eV (450 nm)
were expected. However only the last one was found. The
absence of 1.91 eV (450 nm) band can be related to the
fitting process which causes a shift to the left due to the
opening of the spectrum in that area or to undistinguished
overlapping bands (1.75 and 1.91 eV / 705 and 650 nm)
that results in the 1.8 eV (680 nm) band.
Fig. 1. Comparison between the initial and final emission spectra. A –
Sample Pan 200 (hydrothermal quartz) with accentuated intensity
decrease in the blue region between the initial and the end of analysis. B
– Sample 11 (Granite of Porto-igneous quartz) with little intensity
variation between the initial and the end of the analysis.
Fig. 1. Comparação entre os espetros de emissão iniciais e finais dos
quartzos. A – Amostra Pan 200 (quartzo hidrotermal), com uma
diminuição acentuada de intensidade na região azul entre o início e o final
da análise. B – Amostra 11 (granito do Porto-quartzo ígneo) com uma
pequena variação de intensidade entre o início e o fim da análise.
Quartz crystal from Companheiro granitic pegmatite
shows a spectrum similar to the hydrothermal quartz which
is consistent with the evidence found by Canhoto et al.
(2012) indicating that deposition conditions in a
hydrothermal stage were important in the pegmatitic
structure history.
The quartz grains of Folgosa quartzite shows
similarities with the spectra of igneous quartz, evidencing
an igneous origin.
Fig. 2. Gaussian modulation of quartz initial spectra. A – Sample Pan 200
(hydrothermal quartz) emission spectra with two prominent emission
bands (1.88 and 2.49 eV) and one more discrete located at 2.88 eV. B –
Sample 11 (Granite of Porto - igneous quartz) with four broad bands not
discernible by visual inspection.
Fig. 2. Modelação Gaussiana dos espetros de emissão iniciais do quartzo.
A – Amostra Pan 200 (hydrothermal quartz) com duas bandas de emissão
evidentes (1.88 e 2.49) e uma mais discreta localizada aos 2.88 eV. B –
Amostra 11 (granito do Porto - quartzo ígneo) com quatro bandas de
emissão amplas dificilmente identificáveis por inspeção visual.
193
4. Conclusions
The application of Cathodoluminescence spectroscopy to
the quartz allowed the distinction of two generations and
demonstrate the operability of the spectrometer.
Igneous quartz shows a stable behavior with less
intensity variation during the analysis. Its spectra were more
complex with less prominent bands when visually analyzed,
generally requiring more bands for proper modeling. The
emission bands were not conclusive and it will be necessary
to try other complementary techniques to achieve a better
understanding of the results.
Hydrothermal quartz shows an unstable behavior with a
significant decrease of intensity in the blue region during the
exposure to the electron beam. Their spectra were less
complex than igneous quartz spectra, their emission bands
were easier to identify by visual check, and generally
required only three bands for proper modelling. The
identified emission bands match published data (Ramseyer
& Mullis, 1990; Perny et al., 1992; Götze et al., 2001,
Götze, 2009).
Several authors state that there is a relation between the
presence of certain emission bands and the origin of quartz
(Ramseyer et al., 1988; Ramseyer & Mullis; 1990; Götze et
al., 2001; Götze, 2009). However, this mineral’s
luminescence is caused by lattice defects and small
differences in those can produce variations in the emission
bands, making harder their identification and interpretation
using just CL spectroscopy.
Acknowledgements
We thank Angela Almeida, Alexandra Guedes, Alexandre
Lourenço, Maria dos Anjos Ribeiro and Maria Areias who
kindly provided samples for the present study. A special
thanks goes to Jens Götze for all the assistance provided
throughout the process of acquiring and interpreting all
data.
References
Almeida, A., 2001. Caracterização Geoquímica e Geocronológica do
Granito de duas micas Sintectónico do Porto (NW de Portugal).
Actas do III Congresso Ibérico de Geoquímica e VIII Congresso
de Geoquímica de Espanha, Zaragoza, 6p.
Areias, M., Ribeiro, M.A., Dória, A., 2012a. Caracterização da faixa
gnaissomigmatítica da zona costeira do NW de Portugal. Tema
GA01- Geodinâmica e evolução crustal. 46º Congresso Brasileiro
de Geologia/1º Congresso de Geologia dos Países de Língua
Portuguesa. Santos, Brasil.
Areias, M., Ribeiro, M.A., Dória, A., 2012b. Petrografia e
Geoquímica dos Resisters Calcossilicatados da Faixa Migmatítica
do NW de Portugal. I Congresso Internacional “Geociências na
CPLP”, Coimbra, Portugal, 1p.
Areias, M., Ribeiro, M.A., Dória, A., 2013. Trace Element
Composition in a Migmatite-Granite Complex (NW Portugal):
Protolith and Melting Process Constraints. Mineralogical
Magazine, 77(5), 611.
Canhoto, A., Carolino, A., Guedes, A., Noronha, F. 2012. Quartzo do
pegmatito granítico do Companheiro (Centro de Portugal):
caraterísticas dos fluidos e implicações para a formação do
quartzo hialino. XI Congresso de Geoquímica dos Países de
Língua Portuguesa, Luanda, Angola, 1p.
194
Couto, H., 1993. As mineralizações de Sb-Au da Região DúricoBeirã. PhD thesis, University of Porto (Unpublished), 481 p.
Couto, H., 2008. Catodoluminescência: Aplicações ao estudo das
Geociências. Curso "Técnicas aplicadas a análise Físico-química
de Minerais". Geologos, 7, 35-44.
Couto, H., Borges, F., 2005. Stratiform Sb and Au mineralizations in
the Hercynian Dúrico-Beirã area (North Portugal). Mineral
Deposit Research: Meeting the Global Challenge. Proceedings of
the Eighth Biennial SGA Meeting, China, Chapter 2 - 5, 3p.
Couto, H., Lourenço, A., Sodré Borges, F., 2010. Estudo de quartzos
em catodoluminescência. Revista Electrónica de Ciências da
Terra, 16(2), 4 p.
Couto, H., Roger, G., Fonteilles, M., 1999. Présence de sills de
roches ignées acides dans la mine Sb-Au Ribeiro da Sera, district
Dúrico-Beirão, Nord Portugal. Implications métallogéniques. C.R.
Acad.Sci Paris, Sciences de la terre et des planètes. Earth and
Planetary Sciences, 329, 713-719.
Couto, H., Roger, G., Moëlo, Y., Bril, H., 1990. Le district à
antimoine-or Dúrico-Beirão (Portugal): évolution paragénétique et
géochimique;
implications
métallogéniques.
Mineralium
Deposita, 25, 69-81.
Götze, J., 2009. Chemistry, textures and physical properties of
quartz-Geological interpretation and technical application.
Mineralogical Magazine, 73, 645–671.
Götze, J., 2012. Mineralogy, geochemistry and cathodoluminescence
of authigenic quartz from different sedimentary rocks. In: J.
Götze, R. Möckel, (Eds). Quartz: Deposits, Mineralogy and
Analytics, Berlin, Heidelberg: Springer, 287–306.
Götze, J., Kempe, U., 2008. A comparison of optical microscope
(OM) and scanning electron microscope (SEM) based
cathodoluminescence (CL) imaging and spectroscopy applied to
A. Santos et al. / Comunicações Geológicas (2014) 101, Especial I, 191-194
geosciences. Mineralogical Magazine, 72, 909–924.
Götze, J., Plötze, M., Fuchs, H., Habermann, D., 1999. Defect
structure and luminescence behaviour of agate - Results of
electron paramagnetic resonance (EPR) and cathodoluminescence
(CL) studies. Mineralogical Magazine, 63, 149–163.
Götze, J., Plötze, M., Habermann, D., 2001. Origin, spectral
characteristics
and
practical
applications
of
the
cathodoluminescence (CL) of quartz: A review. Mineralogy and
Petrology, 71, 225–250.
Götze, J., Plötze, M., Trautmann, T., 2005. Structure and
luminescence characteristics of quartz from pegmatites. American
Mineralogist, 90, 13–21.
Lourenço, A., 2002. Paleofluidos e mineralizações associadas às
fases tardias da Orogenia Hercínica. PhD thesis, University of
Porto (Unpublished), 303 p.
Perny, B., Eberhardt, P., Ramseyer, K., Mullis, J., 1992.
Microdistribution of aluminium, lithium and sodium in quartz:
Possible
causes
and
correlation
with
short-lived
cathodoluminescence. American Mineralogist, 77, 534–544.
Ramseyer, K., Baumann, J., Matter, A., Mullis, J., 1988.
Cathodoluminescence colors of alpha-quartz. Mineralogical
Magazine, 52, 669–677.
Ramseyer, K., Mullis, J., 1990. Factors influencing short-lived blue
cathodoluminescence of alpha-quartz. American Mineralogist, 75,
791–800.
Santos, A., 2013. Operacionalização da Técnica de
Catodoluminescência e Aplicação ao Estudo do Quartzo. Master
thesis, University of Porto (Unpublished), 154 p.
Torpy, A., Wilson N. C., 2011. OpticalFit spectral deconvolution
software by CSIRO Australia (version 13.06) [Computer
software].
Download