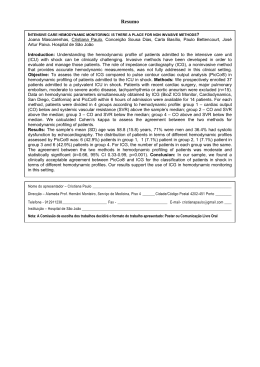
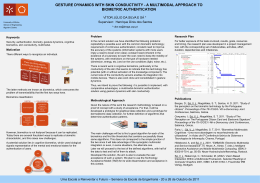
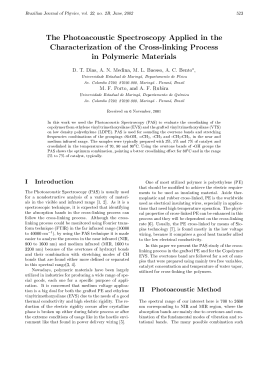
FACULDADE DE MEDICINA DA UNIVERSIDADE DE COIMBRA
TRABALHO FINAL DO 6º ANO MÉDICO COM VISTA À ATRIBUIÇÃO DO GRAU DE
MESTRE NO ÂMBITO DO CICLO DE ESTUDOS DE MESTRADO INTEGRADO EM
MEDICINA
MARIANA BEATRIZ NUNES CANELAS PAIS
MULTIMODAL IMAGE: ASSESSMENT OF RISK
FACTORS FOR THE DEVELOPMENT OF CHOROIDAL
NEOVASCULARISATION IN THE FELLOW EYE
ARTIGO CIENTÍFICO
ÁREA CIENTÍFICA DE OFTALMOLOGIA
TRABALHO REALIZADO SOB A ORIENTAÇÃO DE:
PROFESSOR DOUTOR RUFINO SILVA
MARÇO 2012
Multimodal image: assessment of risk factors for the
development of choroidal neovascularisation in the fellow eye
Mariana Beatriz Nunes Canelas Pais
Correio electrónico: [email protected]
Faculdade de Medicina da Universidade de Coimbra
Azinhaga de Santa Comba, Celas
3000-548 Coimbra
Trabalho realizado sob a orientação de:
Professor Doutor Rufino Silva
Março 2012
Índice
Multimodal Image: Assessment of Risk Factors for the Development of Choroidal Neovascularisation in the Fellow Eye
Índice
Agradecimentos .............................................................................................................. Pág. 2
Abstract .......................................................................................................................... Pág. 3
Resumo ........................................................................................................................... Pág. 5
Introduction .................................................................................................................... Pág. 7
Sample Description and Methods .................................................................................. Pág. 9
Results ............................................................................................................................ Pág. 15
Discussion ...................................................................................................................... Pág. 24
References ...................................................................................................................... Pág. 27
-1-
Agradecimentos
Multimodal Image: Assessment of Risk Factors for the Development of Choroidal Neovascularisation in the Fellow Eye
AGRADECIMENTOS
Quero em primeiro lugar agradecer ao meu orientador Professor Rufino Silva, por me
ter introduzido num tema fascinante, pela sua disponibilidade, pelo seu apoio e pelos seus
ensinamentos.
Agradeço também ao Diretor do AIBILI, Professor Doutor José Cunha Vaz, por ter
proporcionado as condições para a realização deste trabalho.
Gostaria ainda de agradecer à Diretora Executiva Dra. Maria Cecília Martinho, por me
ter facilitado o processo de integração no Instituto.
Uma palavra também para a secretária do CORC, Joana Ecsodi, pela sua
disponibilidade e simpatia e à Dra. Catarina Neves, secretária da Administração do AIBILI,
pelo seu acompanhamento nos procedimentos administrativos.
Agradeço ainda à secretária dos serviços administrativos Maria do Céu Fidalgo por
expeditar o processo que me permitiu efetuar o estágio no AIBILI, com protocolo com a
Universidade de Coimbra.
Queria também referir o Eng. Frederico Teles da Critical Software, pelo apoio na
utilização e atualização do software Retmarker.
Uma palavra ainda à grader Ana Paula Pascoal, pelo companheirismo e apoio nas
tarefas de grading.
Em especial gostaria de agradecer à minha família, e em particular aos meus pais, pelo
apoio incondicional e por sempre acreditarem em mim.
Por último, uma palavra especial aos meus amigos, pela compreensão, pela motivação e
pela amizade com que sempre suportaram as más disposições e nervosismo de tantas horas.
-2-
Abstract
Multimodal Image: Assessment of Risk Factors for the Development of Choroidal Neovascularisation in the Fellow Eye
ABSTRACT
Objectives
To characterize the progression of eye fundus changes by multimodal imaging and to
identify morphological and/or functional predictors of conversion in wet AMD in the fellow
eyes of patients with exudative AMD.
Sample Description and Methods
Single-center, prospective, observational, longitudinal 2-year study. Sixty-two patients
were enrolled in the study, with diagnosis of neovascular age-related macular degeneration in
one eye and age-related maculopathy in the fellow eye. Each patient underwent a detailed
ocular and medical history, a complete ophthalmologic examination with color fundus
photography, fluorescein angiography, indocyanine green angiography and fundus
autofluorescence imaging at baseline and repeated at six-month intervals. CFP images were
graded resorting to the RetmarkerAMD (Critical Health SA) software, a computer assisted
grading system based on the International Classification Grading System guidelines (Bird,
Bressler et al., 1995).
Results
Fifty-three patients completed the two-year follow-up period, eighteen of which
converted to the exudative form in the fellow eye during the study period. No measurable
evolution was found in consecutive fundus autofluorescence and indocyanine green
angiography images. Total drusen area in CFP images presented no significant increase
between each visit and the subsequent (p=0.100), but significant increase was found between
the first and the last (p=0.048). IGC images: 23% of patients presented a normal exam;
observations have shown that the hot spots or areas and the hypofluorescent spots or areas
where either attributable to drusens or drusenoid pigmentary epitelium dettachments or did
not correspond to any lesion visible in the CFP images; the sensitivity of the overall exam
result was 88% and the specificity of presence of early hot spots or areas was 97%. FAF
-3-
Abstract
Multimodal Image: Assessment of Risk Factors for the Development of Choroidal Neovascularisation in the Fellow Eye
images: the distribution of patterns for the cases that converted and those that did not is
significantly different. CFP images: drusen area was significantly higher in the group of
patients which did not convert when considering total area (p=0.012), sub-field 4 (p=0.020)
and sub-field 5 (p=0.039); two main groups were identified by hierarchical cluster analysis,
with Ward's linkage, when considering total area of drusens of the last visit available;
principal component analysis identified total area as the most characterizing feature; no
significant differences were found between the groups in what concerns the areas of drusen
with specific sizes (C1: p=0.28; C2: p=0.11; C3: p=0.31); no correlation was found between
age or total drusen area and conversion, and these two variables are not correlated.
Conclusion
The percentage of patients which converted during the study (34%) exceeds the
expected rate for this time period. In what concerns evolution, further study including a longer
follow-up period is suggested as it was only apparent for total drusen area calculated in CFP
images between the first and last visits available. FAF images: FAF may be an interesting
exam for predicting AMD progression but further studies are necessary to pinpoint the
characterizing patterns. ICG images: the most characterizing features for conversion were the
overall exam result and the presence of early hot spots or areas. CFP images: in this sample
conversion does not occur for patients with the higher extension of lesions; no relation was
found between conversion and patient’s age or drusen of specific sizes.
Key-words: choroidal neovascularization, exudative age-related macular degeneration,
age-related maculopathy.
-4-
Resumo
Multimodal Image: Assessment of Risk Factors for the Development of Choroidal Neovascularisation in the Fellow Eye
Resumo
Objetivos
Estudar a progressão das alterações do fundo ocular através de imagem multimodal e
identificar os fatores de risco para conversão em degenerescência macular relacionada com a
idade (DMRI) neovascular no olho contra-lateral de doentes com DMRI exsudativa.
Descrição da Amostra e Métodos
Estudo de centro único, prospetivo, observacional, longitudinal com a duração de dois
anos. Foram incluídos no estudo 62 doentes com o diagnóstico de DMRI neovascular num
dos olhos e maculopatia relacionada com a idade no outro. Cada doente foi submetido a uma
história médica e ocular detalhada, um exame oftalmológico completo com retinografia a
cores (CFP), angiografia fluoresceínica (FA), angiografia com verde de indocianina (ICG) e
imagem de autofluorescência do fundo na linha de base e repetidos com intervalos de seis
meses. As CFP foram classificadas com recurso ao software RetmarkerAMD (Critical
Software SA), um sistema de classificação assistida por computador baseado nas linhas guias
do sistema de classificação internacional (Bird, Bressler et al., 1995).
Resultados
Cinquenta e três doentes completaram o período de seguimento de dois anos, dezoito
dos quais converteram para a forma exsudativa no olho em estudo durante a duração do
estudo. Não foi encontrada evolução mensurável em imagens consecutivas de angiografia
com verde de indocianina e imagem de autofluorescência do fundo. A área total de drusens
nas CFP não revelou aumento significativo entre visitas subsequentes (p=0,100), mas
verificou-se a existência de aumento significativo de área entre a primeira e a última
(p=0,048). Imagens de ICG: 23% dos casos apresentavam um exame normal; as zonas de
hiperfluorescência e hipofluorescência foram atribuídas a drusens ou descolamentos
drusenoides do epitélio pigmentar da retina ou não correspondiam a nenhuma lesão
identificável nas imagens de CFP; a sensibilidade do resultado global do exame é de 88% e a
-5-
Resumo
Multimodal Image: Assessment of Risk Factors for the Development of Choroidal Neovascularisation in the Fellow Eye
especificidade da presença de hiperfluorescências é de 97%. Imagens de FAF: foram
encontradas diferenças significativas entre a distribuição de padrões de cada grupo (doentes
que converteram e doentes que não converteram). Imagens de CFP: a área de drusens é
significativamente maior no grupo de doentes que não converteu quando se considera a área
total (p=0,012), sub-área 4 (p=0,020) e sub-área 5 (p=0,039); foram identificados dois
grandes grupos através da análise hierárquica de agrupamentos, com ligação de Ward, quando
se considera a área total de drusens da última visita disponível; a análise de componentes
principais identificou a área total como a variável mais caracterizadora; não foram
encontradas diferenças significativas entre os grupos no que diz respeito à área de drusens
com tamanhos específicos (C1: p=0,28; C2: p=0,11; C3: p=0,31);
não se encontrou
correlação entre a idade ou a área total de drusens e a conversão e estas duas variáveis não
estão correlacionadas entre si.
Conclusão
A percentagem de doentes que converteu durante o estudo (33%) é superior à esperada
para este período de tempo. No que diz respeito à evolução, parece pertinente realizar estudos
com período de seguimento mais alargado uma vez que esta só foi manifesta para a área total
de drusens calculada através das imagens de CFP entre a primeira e a última visitas
disponíveis. Imagens de FAF: a imagem de FAF pode ser interessante para prever a
progressão da DMRI mas são necessários mais estudos para determinar os padrões
caracterizadores. Imagens de ICG: os achados mais caracterizadores para a conversão são o
resultado global do exame e a presença de hiperfluorescências precoces. Imagens de CFP:
nesta amostra a conversão não ocorre nos doentes com extensão de lesões superior; não se
encontrou relação entre a conversão e a idade ou drusens de tamanhos específicos.
Palavras-chave: neovascularização coroidal, degenerescência macular relacionada com
a idade exsudativa, maculopatia relacionada com a idade.
-6-
Introduction
Multimodal Image: Assessment of Risk Factors for the Development of Choroidal Neovascularisation in the Fellow Eye
INTRODUCTION
Age-related macular degeneration (AMD) is a degenerative disorder of the macula that
affects people over 50 years old (Bird, Bressler et al., 1995). It is the leading cause of
irreversible severe loss of sight in elderly populations in the developed world (Coleman, Chan
et al., 2008 and references therein).
The pathogenesis of the disease is not currently fully established (Coleman, Chan et al.,
2008) but it is believed that it involves aging changes as well as additional pathological
changes that result in injury to the retina, choriocapillaris and Bruch’s membrane (Zarbin,
2004).
Age, family history and smoking are the most consistent relationships of systemic risk
factors to AMD (Jennifer R, 2001; Klein, Peto et al., 2004; Donoso, Kim et al., 2006).
The early manifestations of AMD include hard and soft “drusens”, areas of increased
pigment or hyperpigmentation (in the outer retina or choroid) and areas of depigmentation or
hypopigmentation of the retinal pigment epithelium (RPE).
There are two morphologic forms recognized in the late stages of AMD: (1) the “dry”
AMD or geographic atrophy and the (2) “wet”, “neovascular” or “exudative” AMD (Bird,
Bressler et al., 1995). These morphologic forms of AMD are interrelated (Green and Enger,
1999). It is the exudative form that is responsible for most of the central visual impairment
attributed to this disease (Bressler, Bressler et al., 1988).
Approximately 10 to 20% of the patients with early AMD will develop the wet form of
the disease (Pauleikhoff, Radermacher et al., 2002 and references therein). The presence of
soft drusen, macular pigmentary change, and choroidal neovascularisation in the other eye are
accepted as ocular risk factors for the development of exudative AMD in the fellow eye
(Jennifer and Shirley, 2000). Large drusen (≥125µm), soft indistinct drusen and any pigment
-7-
Introduction
Multimodal Image: Assessment of Risk Factors for the Development of Choroidal Neovascularisation in the Fellow Eye
changes were found to be particularly predictive of developing the exudative form (Ferris,
Davis et al., 2005; Klein, Klein et al., 2002).
AMD is a bilateral disease and, in patients with unilateral late exudative AMD, the risk
of visual loss in the second eye was estimated at 12 to 15% per year (Holz, Wolfensberger et
al., 1994) and 42-58% develop bilateral CNV within 5 years (MPSG1, 1993; MPSG, 1997).
The objective of our study was to characterize the progression of eye fundus changes
during a 2 year follow-up period, by multimodal imaging during the two-year follow-up
period and to identify morphological and/or functional predictors of conversion in wet AMD
in the fellow eyes of patients with exudative AMD.
1
Macular Photocoagulation Study Group
-8-
Sample Description and Methods
Multimodal Image: Assessment of Risk Factors for the Development of Choroidal Neovascularisation in the Fellow Eye
SAMPLE DESCRIPTION AND METHODS
This is a single-center, prospective, observational, longitudinal two-year study of 62
patients with neovascular AMD in one eye (the non-study eye) and early ARM in the fellow
eye (study eye) at risk for the development of CNV. The visits and image acquisition were
held from August, 2006, to December, 2008.
The methodology, as well as inclusion and exclusion criteria, was previously described
in Silva, Cachulo et al., 2011 and Cachulo, Silva et al., 2011 and is briefly summarized in
what follows. Eligibility included the following criteria: (a) older than 50 years of age, (b) any
race and either sex, (c) signed informed consent, (d) ability to attend the required visits, (e)
clinical diagnosis of wet AMD in one eye (non-study eye) and the presence of the following
characteristics in the second eye (study eye): 1) at least 5 or more intermediate drusen (≥63
μm and <125 μm, and/or confluent drusen, within 3000 μm of the foveal center; 2) with or
without pigmentary changes. Criteria for exclusion incuded: (a) other fundus disease like
vascular retinopathy, central serous chorioretinopathy, inflammation or non-AMD choroidal
neovascularization, (b) current or past history of a medical condition that would preclude
scheduled study visits or completion of the study, (c) clinical signs of myopic rethinophaty or
refractive power of ≥8 diopters or fundoscopic evidence of degenerative myopia, (d) past
history of intraocular surgery within 60 days prior to enrolling in the study, and (e) evidence
of past or present CNV in the study eye.
A detailed ocular and medical history and a complete ophthalmologic examination were
preformed. Each patient underwent a best corrected Early Treatment Diabetic Retinopathy
Study (ETDRS) visual acuity measurement (BCVA), fluorescein angiography (FA),
indocyanine green angiography (ICG), color fundus photograph (CFP) and fundus
autofluorescence imaging (FAF) at baseline and at 6-month intervals until a total of 5 visits
-9-
Sample Description and Methods
Multimodal Image: Assessment of Risk Factors for the Development of Choroidal Neovascularisation in the Fellow Eye
(24 months) or up to 6 months after conversion to wet AMD in the study eye. FA images
were used as the gold standard exam for defining conversion from early to late exudative
AMD. The study design was approved by the ethics committee at AIBILI and informed
consent was obtained from all patients before enrollment in the study.
FA and ICG Acquisition and Grading
Simultaneous FA and ICG were acquired using the HRA II (Heidelberg Retina
Angiograph – Heidelberg Engineering, Dossenheim, Germany) with the 30o field of view
centered on the macula. The ICG images were inspected for hyperfluorescent and
hypofluorescent spots and areas at early arterial and late venous phases. Only spots larger
than 750 μm (approximately half the diameter of the optical disc) were considered. The
findings were then compared to the CFP images and classified accordingly, by translating the
hyperfluorescent and hypofluorescent spots and areas found in the ICG to drusen, subfoveal
drusenoid pigment epithelial detachment (PED) or other types of lesions found in the CFP.
CFP Acquisition and Grading
A digital color fundus photography was performed using a Zeiss FF450 fundus camera
with a Nikon high-resolution camera to produce a 30o field of view, centered both on the
macula and optic disk. The grading of CFP images was done resorting to the software
RetmarkerAMD (Critical Health SA), a computer assisted grading system based on the
International Classification Grading System guidelines (Bird, Bressler et al., 1995). This
software allows to: i) track graded/non-graded images; ii) display and grade images in full
screen view; iii) draw free forms of all the lesions’ types over the images; iv) draw preset
circular objects of different color codes and sizes (ranging from 63 μm to 500 μm) to
represent various lesions (namely drusen, hyperpigmentation and hypopigmentation); v) mark
- 10 -
Sample Description and Methods
Multimodal Image: Assessment of Risk Factors for the Development of Choroidal Neovascularisation in the Fellow Eye
drusens that are confluent; vi) zoom in/out the image or display an image area with a higher
or lower degree of magnification; vii) measure distances in the image; viii) control RGB
channels as well as brightness and contrast of the images; ix) superimpose a standard grid to
identify eye sub-fields; x) manually enter data for study protocol questionnaire. Before
grading each image was calibrated within RetmarkerAMD itself by using the optic disc
diameter (which corresponds roughly to 1.5 mm) as a reference. By manually referencing the
fovea the software can then overlay the reference grid that allows identify the eye sub-fields.
This grid (Figure 1) consists of three concentric circles and a right angled cross at 45 o and
135o to the horizontal. The central, inner and outer circles are respectively 1000 μm, 3000 μm
and 6000 μm in diameter and represent the central, middle and outer subfields. The
specifications for this grid are identical to those described by the International Classification
System (Bird, Bressler et al., 1995). Using this semiautomated grading system some results
are displayed onscreen in real time (Figure 2), namely: i) the number of drusen of each size;
ii) a semi quantitative indication of the total area occupied by drusen and hyperpigmentation
and/or hypopigmentation of the retinal pigment epithelium (for central, inner and outer circle
separately); iii) the cumulative real area by drusen and area in each subfield; iv) a semi
quantitative indication of the degree of confluence of drusen; v) the presence of atrophic or
neovascular AMD. The final characterization of the predominant type of drusen (hard; soft
distinct; soft indistinct: semisolid, serogranular, crystalline) is then adjusted manually.
Preliminary results from comparative tests have shown that RetmarkerAMD is more
effective than 35-mm film manual grading allowing significant time savings (overall, it is
35% faster) and is more accurate (improved accuracy: overall 32% more lesions identified)
(Silva, 2010).
The use of digital images implies that, depending of the screen resolution, a pixel may
be equivalent to several micrometers which means that, when converting between these units,
- 11 -
Sample Description and Methods
Multimodal Image: Assessment of Risk Factors for the Development of Choroidal Neovascularisation in the Fellow Eye
approximations must be made. However, the data obtained in testing indicates that these
deviations are less than 0.1%. In this grading process we used a screen resolution of 1920 x
1080 pixels in a poorly lit room.
Data was then exported, compiled in a datasheet and analyzed.
Figure 1: Representation of the overlaid reference grid that
defines the eye sub-fields
Figure 2: Screenshot of the results displayed onscreen in real
time.
- 12 -
Sample Description and Methods
Multimodal Image: Assessment of Risk Factors for the Development of Choroidal Neovascularisation in the Fellow Eye
FAF Acquisition and Grading
FAF imaging was performed with the same retina angiograph scanning laser
ophthalmoscope following a standard protocol. For the acquisition of the FAF film, the
ametropic corrector of the angiograph was first adjusted to focus on the macula and sensitivity
was altered until clear images of the macula and optic nerve were obtained. An argon laser
(488 nm) was used to excite and a barrier filter enabled the detection of light above 500 nm.
Multiple single 30o autofluorescence images were acquired, aligned and averaged. The
composite images obtained were then graded for their predominant FAF pattern according to
the Fundus Autofluorescence Classification Group (Bindewald, Bird et al., 2005).
Statistical Analysis
Paired t-tests, one-tailed, were used to assess the evolution of the total drusen area, from
each visit to the subsequent one, and also from the first visit to the last.
Mean comparisons for two samples were performed between the area of drusens for
converted and non-converted patients. These comparisons included total area, and sub-fields
1-5, for the last recorded visit. Each of the two samples was firstly subjected to a two-tailed Ftest, to assess homo- or heterocedasticity, followed by a corresponding one-tailed t-test with
the purpose of finding whether the means can be considered equal or if the mean area
corresponding to the non-converted patients exceeds that of the converted.
Data structure analysis resorted to standard multivariate techniques, including
hierarchical cluster analysis (HCA), with Ward’s linkage, for exploratory assessment of the
data structure (Ward, 1963) and principal component analysis (PCA), for data visualization
and variable selection, on the variance-covariance matrix (Brereton, 2003). The software code
was developed in Octave.
- 13 -
Sample Description and Methods
Multimodal Image: Assessment of Risk Factors for the Development of Choroidal Neovascularisation in the Fellow Eye
The main goal of clustering algorithms is to group the data into a number of sensible
clusters according to their similarities. In the exploratory data analysis, hierarchical cluster
analysis (HCA) was used, for which a recent review can be found in reference Almeida,
Barbosa et al., 2007. Ward’s method is a standard procedure for such analysis, and will be the
one selected for the present study. In this method the distance between objects or groups is
established based on minimizing the within cluster variance, when each new cluster is
constructed (Ward, 1963).
The HCA procedure is graphically represented by a dendrogram, which consists of a
cluster structure and illustrates the fusions or divisions made at each successive stage of the
analysis. It allows inspecting the overall structure of the data, and estimate the number of
clusters.
In turn, PCA allows compressing the data by reducing the number of dimensions, with a
minimized loss of information. The most influential variables in the system are highlighted,
and underlying factors may be identified.
Based on an orthogonal linear transformation, PCA defines a lower dimensionality
system, such that the highest variance of the data comes projected on the first principal
component (PC1), the second largest on the second coordinate (PC2), and so on (Brereton,
2003). PCA requires the solution of an eigenvalue problem, either based on the correlation or
variance/covariance matrices of the original variables. In this work we present results based
on the variance/covariance approach.
- 14 -
Results
Multimodal Image: Assessment of Risk Factors for the Development of Choroidal Neovascularisation in the Fellow Eye
RESULTS
Characterization of the Sample
Sixty-two patients were initially enrolled in the study but only fifty-three patients (24
men and 29 women) completed the two-year study follow-up. The mean age of the patients
included in the study was 77, ranging from 56 to 93 years.
The drop-outs from the study were due to death (4 cases), withdrawal of informed
consent (4 cases) and worsening of health conditions (1 case).
Of the total fifty-three patients, eighteen converted during the two-year follow-up
period. The comparative age distribution in all cases and for the groups of patients which
converted and which did not convert is represented in Figure 3, presented in percentage
relative to the total of cases in each group. The mean age of patients which converted was 78
and that of the patients which did not convert was 77. The difference between these two
averages is not significant (p=0.50).
35
30
25
20
%
15
10
5
0
All cases
Converted
Did not convert
< 55
56 - 60
61 - 65
66 - 70
71 - 75
76 - 80
81 - 85
86 - 90
91 - 95
Years of age
Figure 3: Comparative age distribution for all cases and for the groups “converted”
and “did not convert”.
We now present the results obtained from the CFP, FAF and ICG images. Figure 4
presents an example of each.
- 15 -
Results
Multimodal Image: Assessment of Risk Factors for the Development of Choroidal Neovascularisation in the Fellow Eye
Figure 4: Examples of images obtained by the different techniques. A: CFP; B: FAF;
C: early (left) and late phases (right) of ICG.
ICG Findings
Data Overview
We were able to obtain ICG images for all fifty-three patients. Only 23% of all patients
had a normal ICG exam (no early or late hot spots/areas or hypofluorescent spots/areas).
The hot spots/areas, when coincident with lesions visible in CFP images, were
attributed to either drusen or subfoveal drusenoid PED. In 50% of the cases no correspondent
lesion was found in the CFP image. A similar distribution was found regarding the
hypofluorescent spots/areas, in which 38% in early phase and 47% in late phase did not
correspond to any lesion visible in CFP images, as can be seen in Figure 5.
- 16 -
Results
Multimodal Image: Assessment of Risk Factors for the Development of Choroidal Neovascularisation in the Fellow Eye
100,00
80,00
33
60,00
17
50
38
23
30
Drusen
25
%
Subfoveal drusenoid PED
40,00
20,00
50
50
Early
Late
Other
37
47
0,00
Hot Spots
Early
Late
Hypofluorescence
Figure 5: Hot spots/areas and hypofluorescent spots/areas in ICG and the
correspondent lesions found in CFP images.
Table I shows the statistical measures sensitivity, specificity, positive predictive value
and negative predictive value for presence/absence of certain findings in ICG images. In the
first row we consider the exam negative when there are no hot spots/areas or hypofluorescent
spots/areas on both early and late phases.
Table I – Sensitivity, specificity, positive predictive value (PPV) and negative predictive
value (NPV) for ICG findings.
Overall
Hot Spots/areas
Early Hot Spots/areas
Late Hot Spots/areas
Hypofluorescence
Early Hypofluorescence
Late Hypofluorescence
Sensitivity (%) Specificity (%)
88
29
35
86
29
97
23
89
76
34
59
37
71
49
PPV (%)
38
55
83
50
36
31
40
NPV (%)
83
73
74
70
75
65
77
Evolution
In what concerns the ICG images, no evolution was found regarding the existence or
absence of either early or late hot spots/areas and hypofluorescence areas, their correspondent
lesions (as observed in the CFP images) or predominant location.
- 17 -
Results
Multimodal Image: Assessment of Risk Factors for the Development of Choroidal Neovascularisation in the Fellow Eye
FAF Findings
Data Overview
Of the total fifty-three patients we obtained gradable FAF images for forty-six. The
number of patients who displayed each overall pattern is shown in Table II.
Table II – Number of cases that presented each pattern at the last available visit.
Did not convert
Converted
All cases
Normal
Minimal
Change
Focal
Increase
Patchy
Linear
Lacelike
Reticular
Speckled
0
4
1
1
0
0
6
1
1
12
2
6
0
0
11
1
1
16
3
7
0
0
17
2
When comparing the distributions of the patterns displayed by the group of cases which
converted and those which did not convert, the chi-squared test shows that there is a
significant difference between the groups (Chi Square value determined = 3,54; table value
for Chi Square= 0,62 for a 95% confidence level with 5 degrees of freedom).
Evolution
In all but four cases the overall pattern observed was the same throughout the visits in
the 2-year follow-up period. In two of the patients which did not convert and in one which did
convert the initial minimal change pattern was replaced by a reticular pattern. In another
patient, which converted, the initial minimal change pattern was replaced by a focal increased
pattern.
It also appears interesting to point out that approximately 35% of the eyes that presented
reticular pattern at some point during the two-year follow-up period, converted. This
compares to a conversion rate of 20% for those that displayed minimal change throughout the
study. However, due to the size of the sample, definite conclusions cannot be drawn.
- 18 -
Results
Multimodal Image: Assessment of Risk Factors for the Development of Choroidal Neovascularisation in the Fellow Eye
CFP Findings
Data Overview
Table III – Summary of results pertaining to average drusen area and number.
Total
Number
Did not convert
Converted
150
103
Total Area Subfield 1
2
2
(μm )
(μm )
3028678
1217022
Subfield 2
2
(μm )
Subfield 3
2
(μm )
Subfield 4
2
(μm )
Subfield 5
2
(μm )
173671
101005
174920
5791
259098
102351
260573
125914
119863
50499
Table III shows the average total area of drusen and number of drusens specifying for
the former values pertaining to subfields 1 to 5. A test conducted on combination of drusen
area with age, illustrated in Figure 6, has indicated that these variables possess no
discriminantion power between cases that converted and those that did not.
Figure 6: Representation in the plane age/total drusen area of the cases that converted
(x) and those that did not convert (+)
- 19 -
Results
Multimodal Image: Assessment of Risk Factors for the Development of Choroidal Neovascularisation in the Fellow Eye
Evolution
We now remark on the evolution of the lesions, as assessed by the CFP measurements
over the sequence of visits. It is seen that, for the whole set of visits in contiguous and
subsequent time points, 49% correspond to a decrease in the total area of drusen and 51% to
an increase in area. In the same way, if only the first and last visit is considered for each
patient, drusen area decreased in 43% of the cases and increased in 57%.
Paired t-tests, one tailed, indicate that there is no significant increase in the drusen area
between each visit and the subsequent (p= 0.100), while this may be present between the first
and the last one (p=0.048).
Group Comparison
The comparisons of the means of the drusen area between converted and non-converted
patients indicate that the drusen areas are similar for sub-fields 1 (p=0.065), 2 (p=0.266) and 3
(p=0.067).
On the contrary, we found that the drusen area of the non-converted patients probably
exceeds that of the converted for total area (p=0.012) and sub-fields 4 (p=0.020) and 5
(p=0.039).
Table IV – Summary of results pertaining to average drusen area of specific sizes.
Values are indicated in μm2.
2
2
C1: ≥63 μm , <125 μm
C2: ≥125 μm2, <175 μm2
C3: ≥175 μm 2, <250 μm2
Did not convert
378582
269079
174920
Converted
321903
166709
122573
Table IV displays the average area of drusens with specific sizes which were found to
be similar between these groups of cases (C1: p= p=0.28; C2: p=0.11; C3: p=0.31).
- 20 -
Results
Multimodal Image: Assessment of Risk Factors for the Development of Choroidal Neovascularisation in the Fellow Eye
We also found that the number of drusens is not significantly higher for the group of
patients which converted during the two-year follow-up (p=0.112).
Structure of the Data
In Figure 7 we depict the dendrogram obtained from Ward's linkage using the CFP
results for the last visit. Each case was described by the total area and all the subareas relative
to the last visit.
Figure 7: Dendrogram obtained from Ward's linkage on the areas, total and relative to
each subsection, found for each patient on the last considered visit. The cases
undergoing conversion are duly indicated.
- 21 -
Results
Multimodal Image: Assessment of Risk Factors for the Development of Choroidal Neovascularisation in the Fellow Eye
It is seen that the data is composed of two main groups, one found to the top of the
dendrogram, the other in its lower part. The latter contains all the cases that have undergone
conversion. These two groups are well separated as can be seen by the high value of the
linkage distance that connects them.
Further insight in the data can be obtained by PCA. Only one axis, PC1, recovers most
of the information but, for clarity, Figure 8 provides a PC1/PC2 two-dimensional picture.
Figure 8: Representation of the cases, as observed in the last visit, in the PC1/PC2
plane. Conversions are indicated by arrows.
A compact group, to the left, gives way to gradually more distant objects as we advance
towards the right side of the image. The PC1 axis is directly linked to the extent of the
drusens: the compact group that contains most of the cases is, thus, characterized by less
extensive drusen areas.
It should be noted that results obtained removing the total area from the description of
each case, and using only the subareas, are very similar to those described above.
- 22 -
Results
Multimodal Image: Assessment of Risk Factors for the Development of Choroidal Neovascularisation in the Fellow Eye
In Figure 9 is represented the total area of drusen, along the PC1 axis.
Figure 9: Total drusen area in the last visit considered, for cases in the order they
appear along the PC1 axis. Cases that converted are indicated by an “x”.
As previously indicated, this area grows along the axis. The main feature in this Figure
seems to be the slope change, close to the 35th case as arranged in increasing order, after
which the area increases drastically. The cases found for the highest area correspond to those
in the more disperse group in the PC1/PC2 plane. It is also interesting to note that all the
patients that displayed conversion are found in the low area region.
- 23 -
Discussion
Multimodal Image: Assessment of Risk Factors for the Development of Choroidal Neovascularisation in the Fellow Eye
DISCUSSION
In this study we define two groups: the group of patients which did not convert to the
exsudative form during the two-year follow-up period and the group of patients that
converted. A total of eighteen patients converted, representing 34% of the total enrolled in the
study, which exceeds the rate previously suggested (MPSG, 1993; Holz, Wolfensberger et al.,
1994; MPSG, 1997). The age distribution between the groups is not significantly different,
which fails to support the generally accepted notion of age as a major risk factor for
conversion (Jennifer R, 2001; Klein, Peto et al., 2004).
We now remark on the evolution, as perceived by the different exams, comparing the
results obtained in successive visits separated by a six-month interval. The ICG and FAF
observations indicate very little evolution, not only between visits 6 months apart but also
when we consider the whole 2-year follow-up period. The fact that the results were obtained
in the form of qualitative or, at most, semi-quantitave data may be part of the explanation for
this lack of perceivable evolution. Also, the small sample size and the short follow-up period
may also have contributed. In what concerns the CFP findings, no evolution of drusen area
was found between successive visits. However, it was possible to observe an increase in
average drusen area between the first and last visits, for each case. A possible explanation is
that a six-month interval is not long enough to allow a significant evolution, considering
possible operator-dependant and/or method-dependant grading fluctuations. It is, however,
interesting to point out that positive and negative evolutions of the area of drusens are similar
in number. This also indicates that the follow-up period should be increased.
For the ICG findings, our option was to study the importance of hot spots/areas and
hypofluorescent spots/areas as possible predictors of conversion, and to evaluate whether
these findings can be attributed to drusens or other lesions. We found that the hot spots/areas
as well as the hypofluorescent spots/areas were either related to drusens or subfoveal
- 24 -
Discussion
Multimodal Image: Assessment of Risk Factors for the Development of Choroidal Neovascularisation in the Fellow Eye
drusenoid PED, or they did not correspond to any detectable anomaly observed in the ICG
images. The limited number of patients enrolled in the study conditions our ability to further
detect trends concerning the type of lesions related to ICG finding. Nonetheless, when
focusing on the ICG findings alone, we were able to draw some conclusions. Eyes with no
ICG abnormality were significantly less prone to develop the exudative form during the
period of study. This translates into a high sensitivity (88%) and high negative predictive
value (83%). However, a significant number of eyes possessed ICG abnormalities but did not
convert, which explains the very low values of the statistical measures specificity (29%) and
positive predictive value (38%). If only the hot spots/areas are considered, different
information is obtained. Hot spots/areas, particularly early hot spots/areas, were very specific
predictors of conversion (achieving specificity above 97%). This is consistent with the
previous findings that related the presence of ICG hyperfluorescent drusens to a higher
chance of developing exsudative changes (Hanutsaha, Guyer et al., 1998). As for the
hypofluorescent spots/areas, they appear not to add any valuable information.
As for the FAF results, the pattern distribution between the patients that converted and
those that did not was found to be, overall, different. A previous study by Einbock, Moessner
et al., 2005 suggested that the patchy pattern was associated with a relatively high risk of
progression to the exudative form, observation that was not confirmed in our sample..
Another study by Smith, Chan et al., 2006 indicated that the reticular pattern, an indicator of
widespread inflammatory damage to the RPE, was strongly associated with the development
of the exsudative form. In spite of the fact that it is difficult to pinpoint the factors responsible
for the difference between the groups, the high rate of conversion observed in patients
displaying the reticular pattern is probably one of them. Further inspection is advisable.
The CFP results have shown that the cases which did not convert present a wide range
of drusen area. They appear to be organized in two groups, one of which is characterized a
- 25 -
Discussion
Multimodal Image: Assessment of Risk Factors for the Development of Choroidal Neovascularisation in the Fellow Eye
much lower average area occupied by drusens. The drusen areas of the cases which converted
all fall within the range presented by this group with lower average area. Statistical tests
reveal that the average area occupied by drusens of the cases which did not convert is
essentially higher than that of the cases which converted, observations compatible with the
aforementioned hierarchical structure of the data. The generally accepted notion that macular
area covered by drusen and presence of large sized drusen are predictive of conversion was
not verified in the sample we studied, even when the possible confounding factor of patient’s
age was taken into account (Jennifer and Shirley, 2000; Klein, Klein et al., 2002; Ferris,
Davis et al., 2005). No correlation was found between age and total drusen area, and these
variable are not related to conversion. All these unexpected findings may be explained both
by the small sample size and the short follow-up period.
In conclusion, this study has shown that evolution of lesions is not perceivable between
FAF, ICG and CFP images acquired at six-month intervals but it was found in CFP images
between the first and last visits available. It also indicated that the presence of early hot
spots/areas in ICG imaging has a high specificity for predicting conversion. Conversion
occurred independently from patient’s age and area of drusen with specific sizes (as measured
by CFP imaging).
- 26 -
References
Multimodal Image: Assessment of Risk Factors for the Development of Choroidal Neovascularisation in the Fellow Eye
REFERENCES
Almeida, J., L. Barbosa, et al. (2007). "Improving hierarchical cluster analysis: A new method with
outlier detection and automatic clustering." Chemometrics and Intelligent Laboratory
Systems 87: 208–217.
Bindewald, A., A. C. Bird, et al. (2005). "Classification of fundus autofluorescence patterns in early
age-related macular disease." Investigative Ophthalmology & Visual Science 46: 3309-3314.
Bird, A. C., N. M. Bressler, et al. (1995). "An international classification and grading system for agerelated maculopathy and age-related macular degeneration." Survey of Ophthalmology 39:
367-374.
Brereton, R. (2003). Data analysis for the laboratory and chemical plant, Wiley.
Bressler, N. M., S. B. Bressler, et al. (1988). "Age-related macular degeneration." Survey of
Ophthalmology 32: 375-413.
Cachulo, L., R. Silva, et al. (2011). "Early markers of choroidal neovascularization in the fellow eye of
patients with unilateral exudative age-related macular degeneration." Ophthalmologica 225:
144-149.
Coleman, H. R., C.-C. Chan, et al. (2008). "Age-related macular degeneration." The Lancet 372: 18351845.
Donoso, L. A., D. Kim, et al. (2006). "The Role of Inflammation in the Pathogenesis of Age-related
Macular Degeneration." Survey of Ophthalmology 51: 137-152.
Einbock, W., A. Moessner, et al. (2005). "Changes in fundus autofluorescence in patients with agerelated maculopathy. Correlation to visual function: a prospective study." Graefes Archive for
Clinical and Experimental Ophthalmology 243: 300-305.
Ferris, F. L., M. D. Davis, et al. (2005). "A simplified severity scale for age-related macular
degeneration - AREDS report no. 18." Archives of Ophthalmology 123: 1570-1574.
Green, W. and C. Enger (1999). "Histopathology of age-related macular degeneration."
- 27 -
References
Multimodal Image: Assessment of Risk Factors for the Development of Choroidal Neovascularisation in the Fellow Eye
Hanutsaha, P., D. R. Guyer, et al. (1998). "Indocyanine-green videoangiography of drusen as a
possible predictive indicator of exudative maculopathy." Ophthalmology: 1632-1636.
Holz, F. G., T. J. Wolfensberger, et al. (1994). "Bilateral Macular Drusen in Age-related Macular
Degeneration - Prognosis and Risk-Factors." Ophthalmology 101: 1522-1528.
Jennifer, J. A. and H. S. Shirley (2000). "Age related macular degeneration." BMJ 321: 741-744.
Jennifer R, E. (2001). "Risk Factors for Age-related Macular Degeneration." Progress in Retinal and
Eye Research 20: 227-253.
Klein, R., B. E. K. Klein, et al. (2002). "Ten-year incidence and progression of age-related
maculopathy." Ophthalmology 109: 1767-1779.
Klein, R., T. Peto, et al. (2004). "The epidemiology of age-related macular degeneration." American
Journal of Ophthalmology 137: 486-495.
MPSG (1993). "Macular Photocoagulation Study Group: Five-year follow-up of fellow eyes of patients
with
age-related
macular
degeneration
and
unilateral
extrafoveal
choroidal
neovascularization." Arch Ophthalmol: 1189–1199.
MPSG (1997). "Macular Photocoagulation Study Group: Risk factors for choroidal neovascularization
in the second eye of patients with juxtafoveal or subfoveal choroidal neovascularization
secondary to age-related macular degeneration." Arch Ophthalmol: 741–747.
Pauleikhoff, D., M. Radermacher, et al. (2002). "Visual prognosis of second eyes in patients with
unilateral late exudative age-related macular degeneration." Graefe's Archive for Clinical and
Experimental Ophthalmology 240: 539-542.
Silva, R. (2010). Euretina (Oral Comunication).
Silva, R., M. L. Cachulo, et al. (2011). "Age-Related Macular Degeneration and Risk Factors for the
Development of Choroidal Neovascularisation in the Fellow Eye: A 3-Year Follow-Up Study."
Ophthalmologica: 110-118.
- 28 -
References
Multimodal Image: Assessment of Risk Factors for the Development of Choroidal Neovascularisation in the Fellow Eye
Smith, R. T., J. K. Chan, et al. (2006). "Autofluorescence characteristics of early, atrophic, and highrisk fellow eyes in age-related macular degeneration." Investigative Ophthalmology & Visual
Science 47: 5495-5504.
Ward, J. (1963). "Hierarchical grouping to optimize an objective function." Journal of the American
Statistical Association 58: 236–244.
Zarbin, M. A. (2004). "Current Concepts in the Pathogenesis of Age-Related Macular Degeneration."
Arch Ophthalmol 122: 598-614.
- 29 -
Download