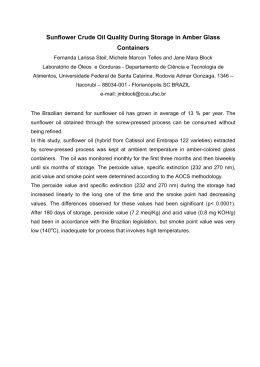
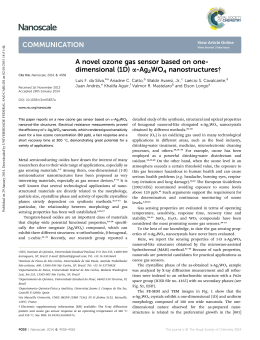
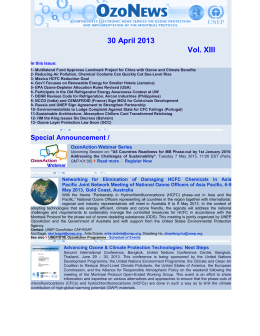
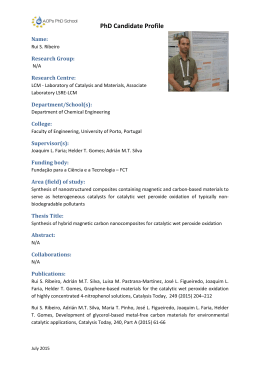
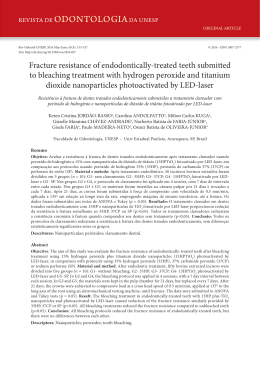
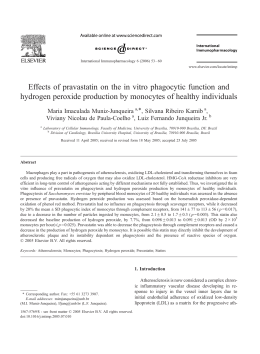
RCT24.book Page 39 Thursday, January 12, 2006 4:22 PM
RCT24.book Page 39 Thursday, January 12, 2006 4:22 PM
Experimental Study Using Ozone:
applicability of DPD Method and
interference in analytic methods for
hydrogen peroxide
Experimental Study Using Ozone:
applicability of DPD Method and
interference in analytic methods for
hydrogen peroxide
Estudo Experimental Usando Ozônio: aplicabilidade do método DPD
e interferência na determinação de peróxido de hidrogênio
Estudo Experimental Usando Ozônio: aplicabilidade do método DPD
e interferência na determinação de peróxido de hidrogênio
HERLANE DOS SANTOS COSTA
HERLANE DOS SANTOS COSTA
Universidade Federal de Itajubá (Itajubá, MG, Brasil)
[email protected]
Universidade Federal de Itajubá (Itajubá, MG, Brasil)
[email protected]
LUIZ ANTONIO DANIEL
LUIZ ANTONIO DANIEL
Universidade de São Paulo (São Carlos, SP, Brasil)
[email protected]
Universidade de São Paulo (São Carlos, SP, Brasil)
[email protected]
ABSTRACT This paper focuses on the interference of ozone in conventional analytic methods and in the determination of
hydrogen peroxide and to discuss the results of tests carried out using the DPD (N, N-diethyl-p-phenylenediamine)
method to determine dissolved residual ozone. The interference of ozone in the determination of hydrogen peroxide for
DMP (2.9-dimethyl-1.10-phenanthroline) and titanium oxalate was verified making tests with distilled and deionized
water. The results showed that the DMP method detected the presence of ozone, while the titanium oxalate method did
not. It was verified that the DPD method is not suitable for determining ozone due to its low precision and accuracy and
the great instability of the DPD reagent prepared according to Standard Methods. Therefore, the titanium oxalate
method showed to be adequate to determine the residual hydrogen peroxide concentration in the presence of ozone and
the use of the DPD method is not recommended for determining dissolved residual ozone. The ozone interferes in conventional analytic methods, such as: Biochemical Oxygen Demand (BOD) and Chemical Oxygen Demand (COD),
decreasing BOD and increasing COD values. These interferences can be minimized destroying the residual dissolved
ozone before the analyses take place.
Keywords OZONE – ANALYTICAL METHODS INTERFERENCE – HYDROGEN PEROXIDE.
Keywords OZONE – ANALYTICAL METHODS INTERFERENCE – HYDROGEN PEROXIDE.
RESUMO Este artigo tem como foco a interferência do ozônio em métodos analíticos convencionais e na determinação de
peróxido de hidrogênio. Discute, também, os resultados dos testes realizados usando o método de DPD (N, N-dietil-pfenilenediamina) para determinar ozônio residual dissolvido. A intervenção do ozônio na determinação do peróxido de
hidrogênio pelos métodos DMP (2.9-dimetil-1.10-fenantrolina) e oxalato de titânio foi verificada por meio de testes com
água destilada e deionizada. Os resultados mostraram que o DMP detectou a presença do ozônio, ao passo que o oxalato
de titânio não o detectou. Verificou-se que o DPD não é adequado para a determinação de ozônio residual dissolvido em
razão de sua baixa precisão e acuracidade, além da elevada instabilidade do reagente DPD. Por sua vez, o oxalato de
titânio mostrou-se adequado para definir a concentração de peróxido de hidrogênio residual em presença de ozônio. O
ozônio interfere em métodos analíticos convencionais, como: Demanda Bioquímica de Oxigênio (DBO) e Demanda
Química de Oxigênio (DQO), diminuindo a primeira e aumentando a segunda. Essas interferências podem ser minimizadas destruindo o ozônio dissolvido residual antes de se realizarem as análises.
Palavras-chave OZÔNIO – INTERFERÊNCIA EM MÉTODOS ANALÍTICOS – PERÓXIDO DE HIDROGÊNIO.
Palavras-chave OZÔNIO – INTERFERÊNCIA EM MÉTODOS ANALÍTICOS – PERÓXIDO DE HIDROGÊNIO.
REVISTA DE CIÊNCIA & TECNOLOGIA • V. 12, Nº 24 – pp. 39-47
39
REVISTA DE CIÊNCIA & TECNOLOGIA • V. 12, Nº 24 – pp. 39-47
39
RCT24.book Page 40 Thursday, January 12, 2006 4:22 PM
RCT24.book Page 40 Thursday, January 12, 2006 4:22 PM
INTRODUCTION
INTRODUCTION
he use of ozone has grown a lot in the last few years, mainly in some European countries and Japan,
being used in a variety of finalities. A great number of research proves its efficacy to destroy algae
(Langlais et al., 1992; Plummer & Edzwald, 1998); metal oxidation (iron, manganese and others)
(Shambaugh & Melnyk, 1978); organic compound oxidation (Moerman et al., 1994; Zoungrana et al.,
1998; Drewes & Jekel, 1998; Berger et al., 1999; Ito et al., 1998); color removal (Matsuda et al., 1993;
Volk et al., 1997; Chen, 2000); nitrification (Beltran et al., 1999); virus (Roy, 1982), protozoa (Newton &
Jones, 1949; Lazarova et al., 1998), and bacteria inactivation (Hunt & Mariñas, 1997; Labatiuk et al.,
1994; Labatiuk et al., 1992; Finch et al., 1992; Bancroft et al., 1984) and also toxicity reduction (Monarca
et al., 2000).
When unsaturated organic compounds are ozonized, by-products, such as hydroxyl radicals, hydrogen
peroxide, oxygen atoms, among others, can be produced and easily oxidize a lot of reagents used in a variety
of analytical determinations. Due to the presence of these secondary oxidants, the ozone determination
methods will be able to include total residual oxidants present instead of just molecular ozone.
According to Baga et al. (1988), the DMP method (2.9-dimethyl-1.10- phenanthroline) can be used to
determine hydrogen peroxide (H2O2) concentration. However, it’s not known if the ozone residuals present in the sample are detected by the DMP method. For this reasons tests were carried out to verify if ozone
interferes in hydrogen peroxide determination by the DMP method.
Another analytical method to determine the concentration of hydrogen peroxide in aqueous solution is
the titanium oxalate method. According to Schick et al. (1997), ozone does not interfere in hydrogen peroxide determination in this method, however, the lowest concentration that can be determined is of 0.02 mg/
L. To verify if this is really valid, the titanium oxalate method was tested.
Like most ozone determination methods, the DPD (N, N-diethyl-p-phenylenediamine) method is a
modification from a chlorine residual determination method that determines the total contents of oxidants
present in the solution. It’s known that the DPD method is subject to interferences that compromise its precision, for example Palin and Derreumaux (1977) related some interferences that can be suffered by the
method if ozone decomposition products, dissolved organic carbon, halogenated compounds and manganese oxides are present in the analyzed samples. Even though, the DPD method is one of the most used
methods to determine the dissolved residual ozone content.
The objective of this work was to discuss the ozone interference in conventional analytical and hydrogen peroxide determination methods and also the DPD method to determine dissolved residual ozone. For
this, the ACCUVAC HACH and Merck Chlor-Test (1.14803.0001) reagents were tested (using reagents of
the Merck kit and prepared 7 and 24 days before in agreement with the Standard Methods of the Examination of Water and Wastewater – AWWA, 1985), comparing one another with standard solutions.
T
he use of ozone has grown a lot in the last few years, mainly in some European countries and Japan,
being used in a variety of finalities. A great number of research proves its efficacy to destroy algae
(Langlais et al., 1992; Plummer & Edzwald, 1998); metal oxidation (iron, manganese and others)
(Shambaugh & Melnyk, 1978); organic compound oxidation (Moerman et al., 1994; Zoungrana et al.,
1998; Drewes & Jekel, 1998; Berger et al., 1999; Ito et al., 1998); color removal (Matsuda et al., 1993;
Volk et al., 1997; Chen, 2000); nitrification (Beltran et al., 1999); virus (Roy, 1982), protozoa (Newton &
Jones, 1949; Lazarova et al., 1998), and bacteria inactivation (Hunt & Mariñas, 1997; Labatiuk et al.,
1994; Labatiuk et al., 1992; Finch et al., 1992; Bancroft et al., 1984) and also toxicity reduction (Monarca
et al., 2000).
When unsaturated organic compounds are ozonized, by-products, such as hydroxyl radicals, hydrogen
peroxide, oxygen atoms, among others, can be produced and easily oxidize a lot of reagents used in a variety
of analytical determinations. Due to the presence of these secondary oxidants, the ozone determination
methods will be able to include total residual oxidants present instead of just molecular ozone.
According to Baga et al. (1988), the DMP method (2.9-dimethyl-1.10- phenanthroline) can be used to
determine hydrogen peroxide (H2O2) concentration. However, it’s not known if the ozone residuals present in the sample are detected by the DMP method. For this reasons tests were carried out to verify if ozone
interferes in hydrogen peroxide determination by the DMP method.
Another analytical method to determine the concentration of hydrogen peroxide in aqueous solution is
the titanium oxalate method. According to Schick et al. (1997), ozone does not interfere in hydrogen peroxide determination in this method, however, the lowest concentration that can be determined is of 0.02 mg/
L. To verify if this is really valid, the titanium oxalate method was tested.
Like most ozone determination methods, the DPD (N, N-diethyl-p-phenylenediamine) method is a
modification from a chlorine residual determination method that determines the total contents of oxidants
present in the solution. It’s known that the DPD method is subject to interferences that compromise its precision, for example Palin and Derreumaux (1977) related some interferences that can be suffered by the
method if ozone decomposition products, dissolved organic carbon, halogenated compounds and manganese oxides are present in the analyzed samples. Even though, the DPD method is one of the most used
methods to determine the dissolved residual ozone content.
The objective of this work was to discuss the ozone interference in conventional analytical and hydrogen peroxide determination methods and also the DPD method to determine dissolved residual ozone. For
this, the ACCUVAC HACH and Merck Chlor-Test (1.14803.0001) reagents were tested (using reagents of
the Merck kit and prepared 7 and 24 days before in agreement with the Standard Methods of the Examination of Water and Wastewater – AWWA, 1985), comparing one another with standard solutions.
MATERIAL AND METHODS
MATERIAL AND METHODS
To verify if ozone interferes in hydrogen peroxide determination the DMP and titanium oxalate
methods tests with distilled and deionized water samples were carried out. A 10 min. ozonized sample was
compared to a sample which 1.34 mg/L of hydrogen was added. An absorbance reading in wavelength of
454 nm and 385 nm was made with the samples.
To verify the reliability in the oxidant content reading of a sample from the DPD method, a comparison between the DPD ACCUVAC HACH (spectrofotometer Hach DR4000U) and Merck Chlor-Test
(spectrofotometer Dulcotest DT11 – Prominent) methods were made using reagents prepared 7 and 24
days before in agreement with the Standard Methods of the Examination of Water and Wastewater – AWWA
(1985) and the two spectrofotometers . Chlorine samples were used instead of ozone due to ozone’s instability.
40
40
jul./dez. • 2004
T
jul./dez. • 2004
RCT24.book Page 41 Thursday, January 12, 2006 4:22 PM
RCT24.book Page 41 Thursday, January 12, 2006 4:22 PM
DMP Method Principle:
DMP Method Principle:
The base of this study is cooper ions (II) reduction to cooper ions (I) by hydrogen peroxide in excess presence of 2.9-dimethyl-1.10phenanthroline (DMP), forming the cooper (I) – DMP complex. The cooper (I) –
DMP complex is directly determined by a spectrometry measure at 454 nm. The spectrometry reaction is:
2Cu2+ + 4DMP + H2O2 2Cu(DMP)2+ + O2 + 2H+
(1)
+
The Cu(DMP)2 is a light yellow complex with maximum absorbance at 454 nm; its stable in the visible range and it possesses a molar extinction coefficient ( ε ) of 15 x 103L.mol-1.cm-1. The Cu(DMP)2+ is stable
in saturated solutions of air and oxygen.
Titanium Oxalate Method Principle:
Titanium Oxalate Method Principle:
It is based on the reaction of hydrogen peroxide with titanium compounds forming the H2O2 titanium
complex. According to Wagner & Ruck (1984) this complex is determined by spectrometry measure at 385
nm and it has a molar extinction coefficient ( ε ) of 1005L.mol-1.cm-1.
It is based on the reaction of hydrogen peroxide with titanium compounds forming the H2O2 titanium
complex. According to Wagner & Ruck (1984) this complex is determined by spectrometry measure at 385
nm and it has a molar extinction coefficient ( ε ) of 1005L.mol-1.cm-1.
DPD Method Principle:
DPD Method Principle:
The oxidant contained in the sample immediately reacts with the DPD indicator (N, N-Diethyl-p-Pheenylenediamine) forming a pink color, with proportional intensity to the oxidant concentration in the sample. Then, the oxidant concentration is read in the spectrophotometer in a wavelength of 515nm or in the
PROMINENT spectrophotometer (wavelength of 528nm).
Instruments and Reagents:
Instruments and Reagents:
The Hach DR/4000U spectrophotometer was used. The solution was prepared with distilled and deionized water, produced in the Milli – Q system and used a short time after it was prepared. The hydrogen
peroxide solution (Synth) was standardized by potassium permanganate titration. The residual ozone concentration of the samples was done by the DPD method (Palin, 1975). The cooper sulfate solution (II), 0.01
mol/L in aqueous solution, was prepared with 2.5 g/L of CuSO4.5H2O and standardized by iodine titration
(AWWA, 1985). The DMP solution was prepared dissolving 1g of 2.9-dimethyl-1.10-phenanthroline P.A.
(Sigma) in 100 ml of ethanol. The titanium oxalate solution was prepared dissolving 30g of dihydrated oxalic
acid P.A. (Synth) ((COOH)2.2H2O) and 20g of crystals of K2TiO(C2O4)2.2H2O P.A. (Mallinckrodt) in 1L of
water.
Chlorine solutions were prepared diluted from a mother-solution with around 0.40% of chlorine. The
mother-solution was standardized by 0.1 N sodium tiosulfate titration. The chlorine solutions were prepared
using deionized distilled water.
RESULTS AND DISCUSSION
RESULTS AND DISCUSSION
Tab. 1. Results using the DMP method.
Sample
1
2
H2O2 content applied
(mg/L)
0
1,34
Tab. 1. Results using the DMP method.
Ozone conten applied
(mg/L)
3,33
0
454nm absorbance
(1cm cubit)
0,217
0,458
H2O2 Content read
(mg/L)
0,61
1,30
Sample
1
2
Tab. 2. Result applying the titanium oxalate method.
Sample
1
2
H2O2 content applied
(mg/L)
0
1,34
REVISTA DE CIÊNCIA & TECNOLOGIA • V. 12, Nº 24 – pp. 39-47
H2O2 content applied
(mg/L)
0
1,34
Ozone conten applied
(mg/L)
3,33
0
454nm absorbance
(1cm cubit)
0,217
0,458
H2O2 Content read
(mg/L)
0,61
1,30
Ozone conten applied
(mg/L)
0,52
0,00
385nm absorbance
(1cm cubit)
0,000
0,038
H2O2 Content read
(mg/L)
0,00
1,35
Tab. 2. Result applying the titanium oxalate method.
Ozone conten applied
(mg/L)
0,52
0,00
385nm absorbance
(1cm cubit)
0,000
0,038
H2O2 Content read
(mg/L)
0,00
1,35
Sample
1
2
41
H2O2 content applied
(mg/L)
0
1,34
REVISTA DE CIÊNCIA & TECNOLOGIA • V. 12, Nº 24 – pp. 39-47
41
RCT24.book Page 42 Thursday, January 12, 2006 4:22 PM
RCT24.book Page 42 Thursday, January 12, 2006 4:22 PM
Table 1 shows the results using the DMP method. The spectrophotometer was reset with deionized
distilled water added with reagent used in the DMP method, to eliminate the interference of these reagents.
If there wasn’t any ozone interference in hydrogen peroxide determination by the DMP method, the
absorbance reading for sample n.˚ 1 would be zero. However, the DMP method detected the presence of
ozone. Therefore, the DMP method will not be able to be applied to determine the hydrogen peroxide concentration in the sample; all the ozone residual should be removed from this sample before the essay takes
place.
Table 2 shows the results applying the titanium oxalate method. The spectrophotometer was reset with
deionized distilled water added with reagents used in the titanium oxalate method, to eliminate the interference of these reagents.
It was seen that the titanium oxalate method could be used to determine residual hydrogen peroxide
concentrations with the presence of ozone, since it does not detect ozone.
Ozone as well as hydrogen peroxide interferes in the conventional analytical methods, due to its properties. They’re oxidant reagents, therefore they affect procedures that a) are based on redox reactions (e.g.,
iodine titration, barium reactions); b) use sensitive indicator to oxidant (e.g., methylene blue); or that c) use
microorganisms that are affected by oxidants (e.g., bioassays). They liberate oxygen, affecting results of
methods such as Biochemical Oxygen Demand (BOD).
Therefore, ozone and hydrogen peroxide interfere in biochemical oxygen demand (BOD) decreasing
its value, and in chemical oxygen demand (COD), increasing its value. To minimize these interferences it is
necessary to destroy them before carrying the essays out. They can be removed from the samples by decomposition or neutralization. The most common procedures used to oxidant removal are: increasing pH and
temperature; using catalase enzymes or chemical reagents and activated carbon. The most simple and practical way is chemical neutralization. For example, using bisulfite or sodium sulfite. However, for not knowing
the exact content of residual ozone and/or hydrogen peroxide contained in the sample, there is a risk of erroneously dosing the neutralizing agent and this come to interfere in the analyses. The ozone residual can also
be removed by volatilization, aerating the sample with air or nitrogen.
Table 3 presents the statistical analyses of the data obtained by the DPD method using reagents from
the Merck kit and by the DPD method using reagents prepared in different dates following the Standard
Methods of the Examination of Water and Wastewater – AWWA (1985).
Tab. 3. Residual chlorine concentration determined by the standard DPD method and Merck kit.
Tab. 3. Residual chlorine concentration determined by the standard DPD method and Merck kit.
Expected
content 0,03
(mgCl2/l)
0,07
0,10
0,13
0,20
0,26
0,33
0,52
0,66
0,98
1,31
1,64
Expected
content 0,03
(mgCl2/l)
0,07
0,10
0,13
Merck Reagente
Average
(mgCl2/l)
Median
(mgCl2/l)
S2
(mg/L)2
0,16
0,13
0,14
0,19
0,25
0,29
0,47
0,55
0,85
1,12
1,35
0,09
0,15
0,13
0,13
0,19
0,25
0,28
0,48
0,57
0,84
1,10
1,35
1,05
x10-4
1,03
S (mgCl2/l)
x10-2
V
10,88
(%)
2,73
x10-3
5,23
x10-2
7,01
x10-5
8,37
x10-3
7,01
x10-5
8,37
x10-3
8,41
x10-4
2,90
x10-2
2,10
x10-4
1,45
x10-2
2,80
x10-4
1,67
x10-2
7,01
x10-5
8,37
x10-3
1,47
x10-3
3,84
x10-2
2,59
x10-3
5,09
x10-2
7,85
x10-3
8,86
x10-2
8,90
x10-3
9,43
x10-2
32,78
6,66
6,19
15,38
5,88
5,87
1,77
6,96
6,02
7,90
6,97
Average
(mgCl2/l)
Median
(mgCl2/l)
S2
(mg/L)2
42
0,02
0,04
0,07
0,12
0,16
0,21
0,33
0,52
0,66
0,98
1,31
1,64
0,09
0,16
0,13
0,14
0,19
0,25
0,29
0,47
0,55
0,85
1,12
1,35
0,09
0,15
0,13
0,13
0,19
0,25
0,28
0,48
0,57
0,84
1,10
1,35
1,05
x10-4
1,03
S (mgCl2/l)
x10-2
V
10,88
(%)
2,73
x10-3
5,23
x10-2
7,01
x10-5
8,37
x10-3
7,01
x10-5
8,37
x10-3
8,41
x10-4
2,90
x10-2
2,10
x10-4
1,45
x10-2
2,80
x10-4
1,67
x10-2
7,01
x10-5
8,37
x10-3
1,47
x10-3
3,84
x10-2
2,59
x10-3
5,09
x10-2
7,85
x10-3
8,86
x10-2
8,90
x10-3
9,43
x10-2
32,78
6,66
6,19
15,38
5,88
5,87
1,77
6,96
6,02
7,90
6,97
0,44
0,69
0,78
0,91
Reagent 1 prepared 7 days before
0,00
0,26
Merck Reagente
0,09
Average
(mgCl2/l)
0,20
0,38
Reagent 1 prepared 7 days before
0,44
0,69
0,78
0,91
jul./dez. • 2004
Average
(mgCl2/l)
42
0,00
0,02
0,04
0,07
0,12
0,16
0,21
0,38
jul./dez. • 2004
RCT24.book Page 43 Thursday, January 12, 2006 4:22 PM
Expected
content 0,03
(mgCl2/l)
Median
0,00
(mgCl2/l)
2
S
0,00
(mg/L)2
S (mgCl2/l) 0,00
V
(%)
0,00
RCT24.book Page 43 Thursday, January 12, 2006 4:22 PM
0,07
0,10
0,13
0,20
0,26
0,33
0,52
0,66
0,98
1,31
1,64
0,03
0,04
0,06
0,12
0,16
0,22
0,36
0,44
0,67
0,80
0,88
2,10
x10-4
1,45
x10-2
4,91
x10-4
2,21
x10-2
1,12
x10-3
3,35
x10-2
1,96
x10-3
4,43
x10-2
3,64
x10-3
6,04
x10-2
1,73
x10-2
1,32
x10-1
1,77
x10-2
1,33
x10-1
9,09
10,41
8,77
9,96
8,80
16,91
14,55
7,01
x10-5
8,37
x10-3
34,64
0,00
0,00
0,00
2,80
x10-4
1,67
x10-2
24,74
0,00
0,00
0,00
Expected
content 0,03
(mgCl2/l)
Median
0,00
(mgCl2/l)
2
S
0,00
(mg/L)2
S (mgCl2/l) 0,00
V
(%)
0,00
0,07
0,10
0,13
0,20
0,26
0,33
0,52
0,66
0,98
1,31
1,64
0,03
0,04
0,06
0,12
0,16
0,22
0,36
0,44
0,67
0,80
0,88
2,10
x10-4
1,45
x10-2
4,91
x10-4
2,21
x10-2
1,12
x10-3
3,35
x10-2
1,96
x10-3
4,43
x10-2
3,64
x10-3
6,04
x10-2
1,73
x10-2
1,32
x10-1
1,77
x10-2
1,33
x10-1
9,09
10,41
8,77
9,96
8,80
16,91
14,55
7,01
x10-5
8,37
x10-3
34,64
0,00
0,00
0,00
Reagent 2 prepared 24 days before
Average
(mgCl2/l)
Median
(mgCl2/l)
S2
(mg/L)2
0,13
0,12
0,13
0,17
0,19
0,23
0,30
0,35
0,47
0,58
0,65
0,09
0,13
0,12
0,13
0,17
0,19
0,22
0,30
0,35
0,48
0,57
0,62
1,05
x10-4
1,03
S (mgCl2/l)
x10-2
V
10,88
(%)
4,91
x10-4
2,21
x10-2
7,01
x10-5
8,37
x10-3
2,10
x10-4
1,45
x10-2
7,01
x10-5
8,37
x10-3
2,80
x10-4
1,67
x10-2
2,10
x10-4
1,45
x10-2
2,10
x10-4
1,45
x10-2
7,01
x10-5
8,37
x10-3
9,11
x10-4
3,02
x10-2
3,99
x10-3
6,32
x10-2
6,66
8,33
4,33
7,37
4,76
4,17
1,77
5,25
9,69
17,63
0,00
0,00
24,74
0,00
0,00
0,00
Reagent 2 prepared 24 days before
0,09
0,00
2,80
x10-4
1,67
x10-2
Average
(mgCl2/l)
Median
(mgCl2/l)
S2
(mg/L)2
0,09
0,13
0,12
0,13
0,17
0,19
0,23
0,30
0,35
0,47
0,58
0,65
0,09
0,13
0,12
0,13
0,17
0,19
0,22
0,30
0,35
0,48
0,57
0,62
1,05
x10-4
1,03
S (mgCl2/l)
x10-2
V
10,88
(%)
4,91
x10-4
2,21
x10-2
7,01
x10-5
8,37
x10-3
2,10
x10-4
1,45
x10-2
7,01
x10-5
8,37
x10-3
2,80
x10-4
1,67
x10-2
2,10
x10-4
1,45
x10-2
2,10
x10-4
1,45
x10-2
7,01
x10-5
8,37
x10-3
9,11
x10-4
3,02
x10-2
3,99
x10-3
6,32
x10-2
6,66
8,33
4,33
7,37
4,76
4,17
1,77
5,25
9,69
17,63
0,00
0,00
0,00
S2: variance; S: desviation standard; V: variation coefficient
S2: variance; S: desviation standard; V: variation coefficient
Table 4 shows the deviation of the reagents regarding expected chlorine concentration and Table 5, the
deviation of the reagents prepared according to the concentration of chlorine read using the Merck kit reagents.
Table 4 shows the deviation of the reagents regarding expected chlorine concentration and Table 5, the
deviation of the reagents prepared according to the concentration of chlorine read using the Merck kit reagents.
Tab. 4. DPD method deviation using different reagents regarding the expected chlorine content.
Tab. 4. DPD method deviation using different reagents regarding the expected chlorine content.
Expected content
(mgCl2/L)
0,03
0,07
0,10
0,13
0,20
0,26
0,33
0,52
0,66
0,98
1,31
1,64
Merck reagents
(mgCl2/L)
± 0,067 (216,7%)
± 0,093 (132,9%)
± 0,027 (27,0%)
± 0,007 (5,4%)
± 0,010 (5,0%)
± 0,013 (5,0%)
± 0,043 (13,0%)
± 0,047 (9,0%)
± 0,107 (16,2%)
± 0,133 (13,6%)
± 0,190 (14,5%)
± 0,287 (17,5%)
Reagent 1*
(mgCl2/L)
± 0,030 (100,0%)
± 0,047 (0,3%)
± 0,060 (60,0%)
± 0,060 (46,2%)
± 0,080 (40,0%)
± 0,100 (38,5%)
± 0,117 (35,5%)
± 0,140 (26,9%)
± 0,213 (32,3%)
± 0,293 (29,9%)
± 0,530 (40,5%)
± 0,727 (44,3%)
Reagent 2**
(mgCl2/L)
± 0,067 (216,7%)
± 0,057 (81,4%)
± 0,020 (20,0%)
± 0,003 (2,3%)
± 0,027 (13,5%)
± 0,067 (25,8%)
± 0,100 (30,3%)
± 0,217 (41,7%)
± 0,313 (47,4%)
± 0,507 (51,7%)
± 0,733 (56,0%)
± 0,987 (60,2%)
Expected content
(mgCl2/L)
0,03
0,07
0,10
0,13
0,20
0,26
0,33
0,52
0,66
0,98
1,31
1,64
*Reagent 1 prepared 7 days before; **Reagent 2 prepared 24 days before.
REVISTA DE CIÊNCIA & TECNOLOGIA • V. 12, Nº 24 – pp. 39-47
Merck reagents
(mgCl2/L)
± 0,067 (216,7%)
± 0,093 (132,9%)
± 0,027 (27,0%)
± 0,007 (5,4%)
± 0,010 (5,0%)
± 0,013 (5,0%)
± 0,043 (13,0%)
± 0,047 (9,0%)
± 0,107 (16,2%)
± 0,133 (13,6%)
± 0,190 (14,5%)
± 0,287 (17,5%)
Reagent 1*
(mgCl2/L)
± 0,030 (100,0%)
± 0,047 (0,3%)
± 0,060 (60,0%)
± 0,060 (46,2%)
± 0,080 (40,0%)
± 0,100 (38,5%)
± 0,117 (35,5%)
± 0,140 (26,9%)
± 0,213 (32,3%)
± 0,293 (29,9%)
± 0,530 (40,5%)
± 0,727 (44,3%)
Reagent 2**
(mgCl2/L)
± 0,067 (216,7%)
± 0,057 (81,4%)
± 0,020 (20,0%)
± 0,003 (2,3%)
± 0,027 (13,5%)
± 0,067 (25,8%)
± 0,100 (30,3%)
± 0,217 (41,7%)
± 0,313 (47,4%)
± 0,507 (51,7%)
± 0,733 (56,0%)
± 0,987 (60,2%)
*Reagent 1 prepared 7 days before; **Reagent 2 prepared 24 days before.
43
REVISTA DE CIÊNCIA & TECNOLOGIA • V. 12, Nº 24 – pp. 39-47
43
RCT24.book Page 44 Thursday, January 12, 2006 4:22 PM
RCT24.book Page 44 Thursday, January 12, 2006 4:22 PM
Tab. 5. Deviation of the experimental points with the prepared reagents in comparison to the Merck reagents.
Expected chlorine content
Merck chlorine content
Reagent 1 deviation*
(mgCl2/L)
(mgCl2/L)
(mg/L)
%
(mg/L)
0,03
0,07
0,10
0,13
0,20
0,26
0,33
0,52
0,66
0,98
1,31
1,64
0,095
0,163
0,127
0,137
0,190
0,247
0,287
0,473
0,553
0,847
1,120
1,353
± 0,095
± 0,140
± 0,087
± 0,067
± 0,070
± 0,087
± 0,074
± 0,093
± 0,106
± 0,160
± 0,340
± 0,440
100,0
85,9
68,5
48,9
36,8
35,2
25,8
19,7
19,2
18,9
30,4
32,5
± 0,000
± 0,036
± 0,007
± 0,010
± 0,017
± 0,054
± 0,057
± 0,170
± 0,206
± 0,374
± 0,543
± 0,700
Tab. 5. Deviation of the experimental points with the prepared reagents in comparison to the Merck reagents.
Reagent 2 deviation**
Expected chlorine content
Merck chlorine content
Reagent 1 deviation*
Reagent 2 deviation**
%
(mgCl2/L)
(mgCl2/L)
(mg/L)
%
(mg/L)
%
0,0
22,1
5,5
7,3
8,9
21,9
19,9
35,9
37,3
44,2
48,5
51,7
0,03
0,07
0,10
0,13
0,20
0,26
0,33
0,52
0,66
0,98
1,31
1,64
0,095
0,163
0,127
0,137
0,190
0,247
0,287
0,473
0,553
0,847
1,120
1,353
± 0,095
± 0,140
± 0,087
± 0,067
± 0,070
± 0,087
± 0,074
± 0,093
± 0,106
± 0,160
± 0,340
± 0,440
100,0
85,9
68,5
48,9
36,8
35,2
25,8
19,7
19,2
18,9
30,4
32,5
± 0,000
± 0,036
± 0,007
± 0,010
± 0,017
± 0,054
± 0,057
± 0,170
± 0,206
± 0,374
± 0,543
± 0,700
0,0
22,1
5,5
7,3
8,9
21,9
19,9
35,9
37,3
44,2
48,5
51,7
*Reagent 1 prepared 7 days before; **Reagent 2 prepared 24 days before.
*Reagent 1 prepared 7 days before; **Reagent 2 prepared 24 days before.
Figure 1 shows a graphic scheme of the results obtained by the ACCUVAC and Merck reagents. Figures 2 and 3 show the chlorine concentration achieved by the DPD method using Merck reagents prepared in
different dates.
Figure 1 shows a graphic scheme of the results obtained by the ACCUVAC and Merck reagents. Figures 2 and 3 show the chlorine concentration achieved by the DPD method using Merck reagents prepared in
different dates.
Fig. 1. Chlorine content curves by the DPD ACCUVAC and DPD Merck reagents.
Fig. 1. Chlorine content curves by the DPD ACCUVAC and DPD Merck reagents.
44
jul./dez. • 2004
44
jul./dez. • 2004
RCT24.book Page 45 Thursday, January 12, 2006 4:22 PM
RCT24.book Page 45 Thursday, January 12, 2006 4:22 PM
Fig. 2. Chlorine content curves smaller than 0.20 mg/L using Merck reagents, reagent 1 (prepared 7 days before) and reagent 2 (prepared 24 days before) versus expected chlorine content.
Fig. 2. Chlorine content curves smaller than 0.20 mg/L using Merck reagents, reagent 1 (prepared 7 days before) and reagent 2 (prepared 24 days before) versus expected chlorine content.
Fig. 3. Chlorine content curves bigger than 0.20 mg/L and smaller than 1.00 mg/L using Merck reagents, reagent 1 (prepared
7 days before) and reagent 2 (prepared 24 days before) versus expected chlorine content (curves adjusted linearly).
Fig. 3. Chlorine content curves bigger than 0.20 mg/L and smaller than 1.00 mg/L using Merck reagents, reagent 1 (prepared
7 days before) and reagent 2 (prepared 24 days before) versus expected chlorine content (curves adjusted linearly).
Fig. 4. Chlorine content curves using reagent 1 (prepared 7 days before) and reagent 2 (prepared 24 days before) versus
chlorine content obtained using Merck reagents.
Fig. 4. Chlorine content curves using reagent 1 (prepared 7 days before) and reagent 2 (prepared 24 days before) versus
chlorine content obtained using Merck reagents.
REVISTA DE CIÊNCIA & TECNOLOGIA • V. 12, Nº 24 – pp. 39-47
REVISTA DE CIÊNCIA & TECNOLOGIA • V. 12, Nº 24 – pp. 39-47
45
45
RCT24.book Page 46 Thursday, January 12, 2006 4:22 PM
RCT24.book Page 46 Thursday, January 12, 2006 4:22 PM
CONCLUSION
CONCLUSION
Ozone and its oxidant sub products interfere in conventional analytical methods, such as Biochemical
Oxygen Demand (BOD), Chemical Oxygen Demand (COD) and sulfate (SO42-), lowering BOD and sulfate
content values and increasing COD values. To minimize these interferences it is necessary to destroy the dissolved residual oxidants before the analyses are carried out. Ozone as well as hydrogen peroxide can be
removed from the samples by decomposition and neutralization.
It was seen that there was no ozone interference in determining hydrogen peroxide by the titanium
oxalate method. In other words, the titanium oxalate method did not detect the presence of ozone. Therefore, the titanium oxalate method can be used for determining residual hydrogen peroxide concentration
with the presence of ozone; the same cannot be said for the DMP method.
Before the obtained results, it is safe to say that the prepared reagent should not be used to substitute
the Merck reagent, since it needs to be used a few days after it has been prepared.
Due to a low precision of the DPD method to determine dissolved residual ozone and a high instability
of the DPD reagent prepared according to Standard Methods of the Examination of Water and Wastewater
(1995), it was seen that this method is not adequate to determine ozone.
ACKNOWLEDGEMENTS
The authors acknowledge FAPESP for its financial
support, process n.˚ 98/071 64-7 (PhD Scholarship).
ACKNOWLEDGEMENTS
The authors acknowledge FAPESP for its financial
support, process n.˚ 98/071 64-7 (PhD Scholarship).
REFERENCES
REFERENCES
AWWA - AMERICAN WATER WORKS ASSOCIATION. Standard Methods for the Examination of Water and Wastewater.
16.ª ed., New York: AWWA, 1985.
BAGA, A.N. et al. A Simple Spectrophotometric Determination of Hydrogen Peroxide at Low Concentrations in Aqueous Solution. Analytica Chimica Acta, 204: 349-353, 1988.
BANCROFT, K. et al. Ozonation and Oxidation Competiton Values. Water Research, 18: 473-478, 1984.
BELTRAN, F.J. et al. Integration of Continuous Biological and Chemical (Ozone) Treatment of Domestic Wastewater: 1. Biodegradation and Post-Ozonation. Journal of Chemical Technology and Biotechnology, 74 (9): 877-883, 1999.
BERGER, P. et al. Ozone and Hydroxyl Radicals Induced Oxidation of Glycine. Water Research, 33 (2): 433-441, 1999.
CHEN, L.C. Effects of Factors and Interacted Factors on the Optimal Decolorization Process of Methyl Orange by Ozone.
Water Research, 34 (3): 974-982, 2000.
DREWES, J.E. & JEKEL, M. Behavior of DOC And AOX Using Advanced Treated Wastewater for Groundwater Recharge.
Water Research, 32 (10): 3125-3133, 1998.
FINCH, G.R. et al. Inactivation of Escherichia Coli Using Ozone and Ozone-Hydrogen Peroxide. Environmental Technology, /
Abstract/ 13: 571-578, 1992.
GORDON, G. et al. Methods of Measuring Disinfectant Residuals. Journal AWWA, set., 94-108, 1988.
HUNT, N.K. & MARIÑAS, B.J. Kinetics of Escherichia Coli Inactivation With Ozone. Water Research, 31, (6): 1355-62, 1997.
ITO, K. et al. Comparison of Ozonation and AOPs Combined With Biodegradation for Removal of Thm Precursors in Treated
Sewage Effluents. Water Science and Technology, 38 (7/6): 179-186, 1998.
LABATIUK, C.W. et al. Inactivation of Giardia Muris Using Ozone and Ozone-Hydrogen Peroxide. Ozone Science Engineering,
/Abstract/ 16: 67-78, 1994.
LABATIUK, C.W. et al. Fators Influencing the Infectivity of Giardia Muris Cysts Following Ozone Inactivation in Laboratory
and Natural Waters. Water Research, 26: 733-743, 1992.
LANGLAIS, B. et al. Study of the Nature of the By-Products Formed and the Risks of Toxicity When Disinfecting a Secondary
Effluent With Ozone. Water Science and Technology, 25 (12): 135-143, 1992.
LAZAROVA, V. et al. Advanced Wastewater Disinfection Technologies: Short and Long Term Efficiency. Water Science and
Technology, 38 (12): 109-117, 1998.
MATSUDA, H. et al. Mutagenicity of Ozonated and Chlorinated Humic Substances. Environmental Science and Engineering,
28 (4): 821-837, 1993.
MOERMAN, W.H. et al. Ozonation of Activated Sludge Treated Carbonization Wastewater. Water Research, 28 (8): 17911798, 1994.
46
46
jul./dez. • 2004
jul./dez. • 2004
RCT24.book Page 47 Thursday, January 12, 2006 4:22 PM
RCT24.book Page 47 Thursday, January 12, 2006 4:22 PM
MONARCA, S. et al. Influence of Different Disinfectants on Mutagenicity and Toxicity of Urban Wastewater. Water Research,
34 (17): 4261-4269, 2000.
NEWTON, W.L & JONES, M.F. Effect of Ozone in Water on Cysts of Endamoeba Histolytic. Am. J. Trop. Med. 29: 669-681,
1949.
PALIN, A.T. Current DPD Methods for Residual Halogen Compounds and Ozone in Water. Journal AWWA, 67 (1): 32, 1975.
PLUMMER, J.D. & EDZWALD, J.K. Effect of Ozone on Disinfection By-Product Formation of Algae. Water Science and Technology, 37 (2): 49-55, 1998.
ROY, D. Comparative Inactivation of Six Enteroviruses by Ozone. Journal American Water Works Association, 74, (12): 660664, 1982.
SCHICK, R.; et al. Fluorometric Determination of Low Concentrations of H2o2 in Water: Comparison With Two Other
Methods and Application to Environmental Samples and Drinking-Water Treatment. Water Research, 31 (6): 1371-1378,
1997.
SHAMBAUGH, R.L. & MELNYK, P.B. Removal of Heavy Metals via Ozonation. Journal WPCF, 50 (1): 113-121, 1978.
VOLK, C. et al. Comparison of the Effect of Ozone, Ozone-Hydrogen Peroxide System and Catalytic Ozone on The Biodegradable Organic Matter of a Fulvic Acid Solution. Water Research, 31 (3): 650-656, 1997.
WAGNER, V.R. & RUCK, W. Die Bestimmung von Wasserstoffperoxid und anderen Peroxyverbindungen. Z. Wasser- Abwasser-Forsch, 17: 262-267, 1984.
ZOUNGRANA, C.J.O et al. Influence de la Reminéralisation sur L'évolution de la Biodégradabilité de la Matière Organique
Naturelle au Cours de L'ozonation. Water Research, 32 (6): 1743-1752, 1998.
REVISTA DE CIÊNCIA & TECNOLOGIA • V. 12, Nº 24 – pp. 39-47
MONARCA, S. et al. Influence of Different Disinfectants on Mutagenicity and Toxicity of Urban Wastewater. Water Research,
34 (17): 4261-4269, 2000.
NEWTON, W.L & JONES, M.F. Effect of Ozone in Water on Cysts of Endamoeba Histolytic. Am. J. Trop. Med. 29: 669-681,
1949.
PALIN, A.T. Current DPD Methods for Residual Halogen Compounds and Ozone in Water. Journal AWWA, 67 (1): 32, 1975.
PLUMMER, J.D. & EDZWALD, J.K. Effect of Ozone on Disinfection By-Product Formation of Algae. Water Science and Technology, 37 (2): 49-55, 1998.
ROY, D. Comparative Inactivation of Six Enteroviruses by Ozone. Journal American Water Works Association, 74, (12): 660664, 1982.
SCHICK, R.; et al. Fluorometric Determination of Low Concentrations of H2o2 in Water: Comparison With Two Other
Methods and Application to Environmental Samples and Drinking-Water Treatment. Water Research, 31 (6): 1371-1378,
1997.
SHAMBAUGH, R.L. & MELNYK, P.B. Removal of Heavy Metals via Ozonation. Journal WPCF, 50 (1): 113-121, 1978.
VOLK, C. et al. Comparison of the Effect of Ozone, Ozone-Hydrogen Peroxide System and Catalytic Ozone on The Biodegradable Organic Matter of a Fulvic Acid Solution. Water Research, 31 (3): 650-656, 1997.
WAGNER, V.R. & RUCK, W. Die Bestimmung von Wasserstoffperoxid und anderen Peroxyverbindungen. Z. Wasser- Abwasser-Forsch, 17: 262-267, 1984.
ZOUNGRANA, C.J.O et al. Influence de la Reminéralisation sur L'évolution de la Biodégradabilité de la Matière Organique
Naturelle au Cours de L'ozonation. Water Research, 32 (6): 1743-1752, 1998.
Dados dos autores
Dados dos autores
HERLANE DOS SANTOS COSTA
HERLANE DOS SANTOS COSTA
Graduação em engenharia civil pela Universidade Federal do
Espírito Santo (UFES), mestrado e doutorado em engenharia civil
(hidráulica e saneamento) pela Universidade de São Paulo
(EESC/USP). Professora da Universidade Federal de Itajubá (Unifei).
Graduação em engenharia civil pela Universidade Federal do
Espírito Santo (UFES), mestrado e doutorado em engenharia civil
(hidráulica e saneamento) pela Universidade de São Paulo
(EESC/USP). Professora da Universidade Federal de Itajubá (Unifei).
LUIZ ANTONIO DANIEL
LUIZ ANTONIO DANIEL
Graduação, mestrado e doutorado em engenharia civil pela
Universidade de São Paulo (ESSC/USP). Professor da
Universidade de São Paulo (EESC/USP).
Graduação, mestrado e doutorado em engenharia civil pela
Universidade de São Paulo (ESSC/USP). Professor da
Universidade de São Paulo (EESC/USP).
Recebimento do artigo: 25/ago./04
Aprovado: 28/jun./05
Recebimento do artigo: 25/ago./04
Aprovado: 28/jun./05
47
REVISTA DE CIÊNCIA & TECNOLOGIA • V. 12, Nº 24 – pp. 39-47
47
Download