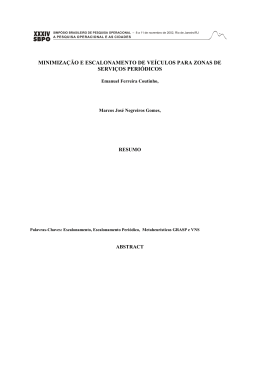
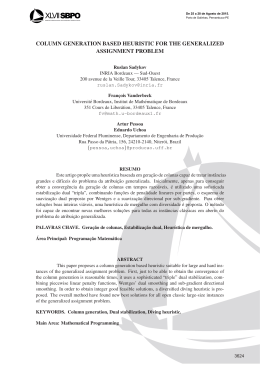
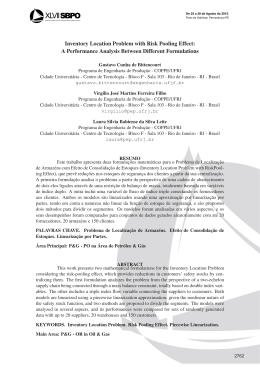
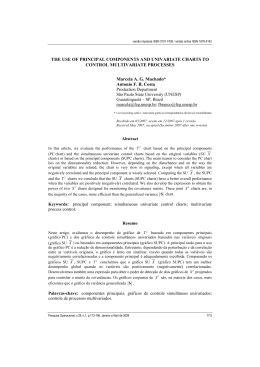
Simpósio Brasileiro de Pesquisa Operacional
XLVSBPO
A Pesquisa Operacional na busca de eficiência nos
serviços públicos e/ou privados
16 a 19
Setembro de 2013
Natal/RN
THE SIDE-SENSITIVE SYNTHETIC MEDIAN CHART
Antonio F. B. Costa
São Paulo State University (UNESP)
Av. Ariberto Pereira da Cunha, 333, Guaratinguetá, SP
[email protected]
Marcela A. G. Machado
São Paulo State University (UNESP)
Av. Ariberto Pereira da Cunha, 333, Guaratinguetá, SP
[email protected]
ABSTRACT
The synthetic chart signals when a second sample point falls beyond the control limits
and it is not far from the first one, that is, the maximum sample points between them cannot
exceed a threshold L. The side-sensitive synthetic (SSSyn) chart signals when these two points
beyond the control limits are close from each other and on the same side of the centerline. The
side-sensitive feature enhances the ability of the chart to signal. When the samples are small,
two or three units per sample, the SSSyn Median chart competes with the standard X chart in
terms of the speed they detect changes in the process mean. Devices, such as go-no-go gauges,
allow monitoring processes without the need to measure any unit of the samples. With a go-nogo gauge device it is possible to know the position of the sample median; if above the upper
control limit, if below the lower control limit, or if in the central region. The right value of the
sample median is not necessary to to run the SSSyn Median chart. When the operator is in
charge of the control, inspection by attribute, instead of by variable, is highly recommended.
Stationary properties of the Markov chain were used to obtain the steady-state average run
length (SSARL). The SSARL measures the speed with which the control chart signals processs
changes under the assumption that the process starts adjusted and remains unaltereded until
the occurrence of an unpredictable change in the process mean.
KEYWORDS. Median Chart; Side-sensitive Chart; Steady-state Average Run Length.
Main area (EST – Estatística - Statistics)
1301
Simpósio Brasileiro de Pesquisa Operacional
XLVSBPO
A Pesquisa Operacional na busca de eficiência nos
serviços públicos e/ou privados
16 a 19
Setembro de 2013
Natal/RN
1. Introduction
The X charts detect mean changes faster than the median charts; because of that, the
articles dealing with median charts are rare; see Park (2009) and Koo (2005). In this article,
we consider the side sensitive synthetic signaling rule to improve the median chart
performance.
The synthetic chart proposed by Wu and Spedding (2000) requires two points beyond
the control limits to signal. The maximum sample points between them cannot exceed a
threshold L, otherwise the synthetic chart doesn’t signal. Wu et al. (2001), Huang and Chen
(2005), and Chen and Huang (2005) studied the properties of the synthetic np, S and R charts,
respectively. Costa and Rahim (2006) proposed a synthetic chart based on noncentral chisquare statistics. Costa et al. (2009) evaluated the properties of a synthetic chart with twostage testing that is able to signal changes in the process mean and in the process variance.
Machado et al. (2009) introduced a synthetic chart based on two sample variances for
monitoring the covariance matrix of bivariate processes. Wu et al. (2010) proposed a X chart
that signals when a sample point falls beyond control limits or when a second point, not far
from the first, falls beyond warning limits. Khoo et al. (2010) proposed a synthetic double
sampling chart. More recently, Zhang et al. (2011) evaluated the properties of the synthetic
X chart when the process parameters are estimated. The growing interest in synthetic charts
may be explained by the fact that many practitioners prefer waiting until the occurrence of a
second point beyond the control limits before looking for an assignable cause.
Davis and Woodall (2002) introduced the side-sensitive version of the synthetic chart
where the two points beyond the control limits should be not only close from each other but
also on the same side of the centerline. Costa and Machado (2012) presented a Markov chain
model of the side sensitive synthetic X chart and used it to evaluate the steady-stage average
run length (ARL) performance. The side-sensitive feature enhances the ability of the synthetic
chart to signal.
2. The Markov Chain Model of the Side-Sensitive Synthetic Chart
The following transition matrix of the Markov chain is used to obtain the steady-state
ARLs of the side-sensitive synthetic median chart.
1302
16 a 19
Simpósio Brasileiro de Pesquisa Operacional
XLVSBPO
Setembro de 2013
A Pesquisa Operacional na busca de eficiência nos
serviços públicos e/ou privados
Natal/RN
100..0 010..0 ... 0..010 0..001 00..00 0..001 0..010 0..100 ... 100..0 Signal
100..0
0
0
...
0
0
0
0
...
0
A
B
B
010..0
B
B
0
0
...
0
0
0
...
...
0
...
0
...
...
...
...
0
0
0
...
0
B
B
...
0
...
0
0
0
001..0
A
0
A
...
0
0
0
...
0..001
...
0
...
0
...
...
...
...
0
...
0
B
00..00
0
0
...
B
A
0
B
0
A
0
...
0
B
0
0
0
...
0
...
...
...
A
...
...
...
B
...
0
0
0
0
...
A
B
0..001
0
0
...
A
0
0
0..010
0
0
...
0
...
...
...
...
...
B
B
...
B
0
(1)
010..0
0
0
...
0
B
100..0
0
0
...
0
B
A
0
0
0
...
0
B
Signal
0
0
...
0
0
0
0
0
0
...
0
1
The transient states describe the position of the last L sample points; “1” means that
the sample point fell below the lower control limit, “0” means that the sample point fell in the
central region, and “1” means that the sample point fell above the upper control limit. For
instance, the transient state (010..0) is reached when the second of the last L points falls below
the lower control limit and all others points fall in the central region. If the current state is state
(00...01), (0…010)…(001...0), (010…0), or (100…0) and the next sample point falls below the
lower control limit, the Markov chain moves to state 00...01. Similarly, if the current state is
state (00...01), (0…010)…(001...0), (010…0), or (100…0) and the next sample point falls above
the upper control limit, the Markov chain moves to state 00...01. The events “1”, “0”, and “1”
occur with probabilities B , A, and B , respectively. If Xi ~ N(P, 1), with i=1, 2… n, are the
sample observations, Zm the median of the sample observations, UCL the upper control limit of
the median chart, and LCL the lower control limit of the median chart, follows that:
B Pr[Z m LCL] , B Pr[Z m ! UCL] and A 1 B B .
The steady-state ARL is given by S ' ARL , where S is the vector with the stationary
probabilities of being in each nonabsorbing state and ARL is the vector of ARLs taking each
nonabsorbing state as the initial state. The ARL (I R) 1 1 , where I is an (2L+1) by (2L+1)
identity matrix, R is the transition matrix given in (2) with the last row and column removed,
and 1 is an (2L+1) by one vector of ones.
1303
16 a 19
Simpósio Brasileiro de Pesquisa Operacional
XLVSBPO
Setembro de 2013
A Pesquisa Operacional na busca de eficiência nos
serviços públicos e/ou privados
§A
¨
¨0
¨0
¨
¨ ...
¨0
¨
¨0
¨
©1
Natal/RN
B
0
0 ... 0
0
1
0 ... 0
0
0
1 ... 0
... ... ... ... ...
0 0 0 ... 1
0
0
0 ... 0
0
0
0 ... 0
0·
¸
0¸
0¸
¸
...¸
0 ¸¸
1¸
¸
0¹
(2)
The S vector, with the stationary probabilities of being in each nonabsorbing state, is
given by D 1S C .
S 'C (C L1 , C L2 ,..., C 0 ,2C L (1 A) 1 , C 0 ,..., C L2 , C L1 ) , D=2+2C+2C2+
…+2CL-1+2CL (1-A)-1, and C=2A/ (1+A), with A
Pr[| Z | k Z ~ N (0;1)] . It was obtained with
the process mean adjusted (P by solving the system of linear equations S ' R adj
S,
constrained to S ' 1 1 . The matrix R adj is an adjusted version of R, where all nonzero cells are
divided by (1-B), with B B B , except the nonzero cells in the “00...00” row that are kept
unaltered. The matrix R adj is as follows:
§0
¨
¨A
¨0
¨
¨ ..
¨0
1 ¨
¨0
1 B ¨
¨0
¨0
¨
¨ ...
¨0
¨¨
©0
0 ... 0
0
A
B
0
0 ... 0
A ... 0
0
0
0
0
B
B
0
0
... ... ...
...
...
...
...
0 ... A
0
0
B
0
0 ... 0
B B 2
A(1 B )
B B 2
0
0 ... 0
B
0
0
A
0 ... 0
B
0
0
0
... ... ...
...
...
...
...
0 ... 0
B
0
0
0
0 ... 0
B
A
0
0
0 ... 0 ·
¸
0 ... 0 ¸
0 ... 0 ¸
¸
... ... ... ¸
0 ... 0 ¸¸
0 ... 0 ¸
¸
0 ... 0 ¸
A ... 0 ¸
¸
... ... ... ¸
0 ... A ¸
¸
0 ... 0 ¸¹
(3)
1304
Simpósio Brasileiro de Pesquisa Operacional
XLVSBPO
A Pesquisa Operacional na busca de eficiência nos
serviços públicos e/ou privados
16 a 19
Setembro de 2013
Natal/RN
Figures 1 through 4 show the SSARLs for the X charts and the side-sensitive
synthetic median chart considering different shifts in the process mean, expressed in units of V,
the standard deviation of the observations. The control charts were designed fixing
SSARL0=370.4 or 1000. The SSARL0 measures the incidence of false alarms; it is the SSARL
computed with the process mean adjusted (P=0).
The SSSyn median chart signals larger
shifts faster the X chart. In terms of the overall performance - considering different mean
shifts, the SSSyn median chart is better than the X chart, especially when the SSARL0 is large
(=1000). When n is even, the median is the mean of the two middle X values. To avoid the
mean computation, we might run the SSSyn chart considering the position of the two middle
values. For instance, when n=2, a sample point is plotted below the lower control limit (above
the upper control limit) if the diameter of both units are smaller than the LCL (bigger than the
UCL). Otherwise, the sample point is plotted in the central region.
Figure 1: SSARLs for the SSSyn Median chart and X chart (L=3, n=3)
1305
Simpósio Brasileiro de Pesquisa Operacional
XLVSBPO
A Pesquisa Operacional na busca de eficiência nos
serviços públicos e/ou privados
16 a 19
Setembro de 2013
Natal/RN
Figure 2: SSARLs for the SSSyn Median chart and X chart (L=3, n=3)
Figure 3: SSARLs for the SSSyn Median chart and X chart (L=3, n=2)
1306
Simpósio Brasileiro de Pesquisa Operacional
XLVSBPO
A Pesquisa Operacional na busca de eficiência nos
serviços públicos e/ou privados
16 a 19
Setembro de 2013
Natal/RN
Figure 4: SSARLs for the SSSyn Median chart and X chart (L=3, n=2)
4. Conclusions
In this article, we considered the side-sensitive synthetic signaling rule to improve the
median chart performance. When the samples are small, two or three units per sample, the
SSSyn Median chart has a better overall performance than the standard X chart in terms of the
speed they detect changes in the process mean. When the operator is in charge of the control,
inspection by attribute, instead of by variable, is highly recommended.
Acknowledgements
This work was supported by CNPq – National Council for Scientific and Technological
Development, Projects 307744/2006-0 and 306189/2011-9.
References
Chen, F. L., Huang, H. J. (2005), A synthetic chart for monitoring process dispersion with
sample range, International Journal of Advanced Manufacturing Technology, 26, 842-851.
Costa, A. F. B., Machado, M. A. G., (2012) The side-sensitive synthetic X chart, XLIV Simpósio
Brasileiro de Pesquisa Operacional, EST.
Costa, A. F. B., Rahim, M. A. (2006), A synthetic chart for monitoring the process mean and
variance, International Journal of Quality in Maintenance Engineering, 18, 5067-5086.
Costa, A. F. B., De Magalhaes, M. S., Epprecht, E. (2009), Monitoring the process mean and
variance using a synthetic control chart with two-stage testing, International Journal of
Production Research, 18, 5067-5086.
1307
Simpósio Brasileiro de Pesquisa Operacional
XLVSBPO
A Pesquisa Operacional na busca de eficiência nos
serviços públicos e/ou privados
16 a 19
Setembro de 2013
Natal/RN
Davis, R. B., Woodall, W. H. (2002), Evaluating and improving the synthetic control chart,
Journal of Quality Technology, 34, 200-208.
Huang, H. J., Chen, F. L., (2005), A synthetic chart for monitoring process dispersion with
sample standard deviation, Computers & Industrial Engineering, 49, 221-240.
Khoo, M.B.C., (2005) A control chart based on sample median for the detection of a permanent shift
in the process mean, Qualityu Engineering,17,243-57.
Khoo, M. B. C., Lee, H. C., Wu, Z., Castagliola, P. (2010), A synthetic double sampling chart for
the process mean, IIE Transactions, 43, 23-38.
Machado, M. A. G., Costa, A. F. B., Rahim, M. A. (2009), The synthetic control chart based on
two sample variances for monitoring the covariance matrix, Quality and Reliability Engineering
International, 25, 595-606.
Park, H. (2009) Median control chart based on bootstrap method, Communications in StatisticsSimulation and Computation, 38, 558-570.
Wu, Z., Ou, Y., Castagliola, P., Khoo, M. B. C. (2010), A combined synthetic & X chart for
monitoring the process mean, International Journal of Production Research, 48, 7423-7436.
Zhang, Y., Castagliola, P., Wu, Z., Khoo, M. B. C. (2011), The synthetic X chart with estimated
parameters, IIE Transactions, 43: 676-687.
Wu, Z., Spedding, T. A. (2000a), A synthetic control chart for detecting small shifts in the
process mean, Journal of Quality Technology, 32:32-38.
Wu, Z., Yeo, S. H. Spedding, T. A. (2001), A synthetic control chart for detecting fraction
nonconforming increases, Journal of Quality Technology, 33, 104-111.
1308
Download