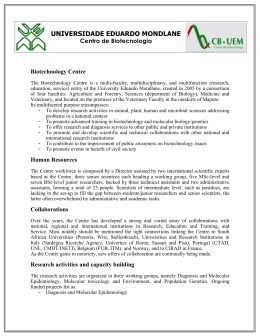
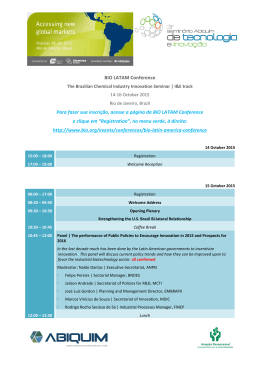
Building the Bioeconomy
Examining National Biotechnology Industry
Development Strategies
A Briefing Paper, April 2014
1
This report was commissioned by the Biotechnology Industry
Organization (BIO). The views represented here are those of
the authors only.
Copyright © Pugatch Consilium 2014
The moral right of the authors has been asserted.
All rights reserved. Without limiting the rights under copyright
reserved above, no part of this publication may be reproduced,
stored or introduced into a retrieval system, or transmitted, in any
form or by any means (electronic, mechanical, photocopying,
recording or otherwise), without the prior written permission of
both the copyright owner and the publisher.
Building the Bioeconomy Examining National Biotechnology Industry Development Strategies
Contents
List of Abbreviations
5
Executive Summary
7
1 Introduction 11
1.1 The future is Bio 11
1.2 Paper overview 12
2 Biotechnology innovation 15
2.1 Developing biotechnologies 15
2.2 R&D vs. manufacturing 16
3 National strategies to encourage
biotechnology activity
19
3.1 What is a National Innovation Strategy? 19
3.2 Promoting biotech innovation: Seven enabling factors
19
4 Mapping national innovation strategies 25
4.1 Brazil
26
4.2 China
28
4.3 India
30
4.4 Korea
32
4.5 Russia
34
4.6 Singapore
36
4.7 Switzerland
38
4.8 United States
40
5 Recommendations 43
3
Contents
Contents (cont.)
Appendix I – Detailed discussion: The enabling factors and country case studies
45
Brazil China India Korea Russia Singapore Switzerland United States Notes 69
Tables and figures 4
Figure 1: The biopharmaceutical R&D process
16
Table 1: Enabling factors
20
Figure 2: Scientific American Worldview Scorecard 2013, countries sampled
25
Table 2: Enabling factors in Brazil
27
Table 3: Enabling factors in China
29
Table 4: Enabling factors in India
31
Table 5: Enabling factors in Korea
33
Table 6: Enabling factors in Russia 35
Table 7: Enabling factors in Singapore
37
Table 8: Enabling factors in Switzerland
39
Table 9: Summary, National Bioeconomy Blueprint
41
Table 10: Enabling factors in the US
41
Building the Bioeconomy Examining National Biotechnology Industry Development Strategies
List of Abbreviations
ANVISA
Brazilian National Health Surveillance Agency
API
Active Pharmaceutical Ingredient
A*STARAgency for Science, Technology and Research (Singapore)
BNDES Brazilian Development Bank
CDSC
Central Drugs Standard Control (India)
CLs
Compulsory Licenses
CTNBio
Brazilian Biosafety Technical Commission
EMBRAPA Brazilian Agricultural Research Corporation
EPA
US Environmental Protection Agency
FINEP Funding Authority for Studies and Projects (Brazil)
FDA
US Food and Drug Administration
FDI
Foreign direct investment
GCP
Good Clinical Practices
GMP
Good Manufacturing Practices
GM
Genetically Modified
GMO
Genetically Modified Organism
ICT
Information and Communications Technologies
INPI
Brazilian Patent Office
IP
Intellectual Property
IPRs
Intellectual Property Rights
IRP
International Reference Pricing
NGO
Non-Governmental Organization
NIH
US National Institutes of Health
OECDOrganisation for Economic Co-operation and Development
PE
Private Equity
PCT
Patent Cooperation Treaty
PRO
Public Research Organization
RDP
Regulatory Data Protection
R&D
Research and Development
SFDA
State Food and Drug Administration (China)
SME
Small and Medium Enterprises
TRIPS
Trade-Related Aspects of Intellectual Property Rights
USDA
US Department of Agriculture
USTR
US Trade Representative
VC
Venture Capital
WHO
World Health Organization
WIPO
World Intellectual Property Organization
WTO
World Trade Organization
5
Building the Bioeconomy Examining National Biotechnology Industry Development Strategies
Executive Summary
This paper provides an overview of national innovation strategies,
policies and best practices that relate to the building of a world-class
biotechnology sector. It identifies key enabling policy input factors
ranging from human capital, protection of intellectual property to
infrastructure for research and development.
Through case study analysis the paper focuses
on the biotechnology strategies of a sample
of eight countries. The country sample is
geographically and economically diverse with
a mix of high-income mature OECD economies
and middle income and emerging markets. The
countries mapped are Brazil, China, India, Korea,
Russia, Singapore, Switzerland and the United
States. The point of reference for this overview
is the development of a globally competitive
biotech sector in which local biotech actors and
stakeholders aim to and can compete globally.
Advances in biotechnology – which encompass
health, food and agriculture, industrial and
environmental segments – are at the heart
of human society, both scientifically and
economically. In 2009 the OECD predicted
that by 2030 biotechnology could make up to
2.7% of member state GDP. The importance of
biotechnology to future social and economic
development is illustrated by almost every
country today – both mature and emerging
market – identifying and defining the field of
biotechnology as a strategic priority to their
national interest. And why wouldn’t they?
Breakthroughs and the increased use of
agricultural biotechnology over the past few
decades have allowed farmers to produce
increasing amounts of crops and foods to feed
a growing proportion of the world’s population.
In 2013 a record 175 million biotech hectares
were grown globally. Significantly 54% of this
production was concentrated in developing
and emerging markets in Latin America, Asia
and Africa. In Brazil, Argentina, India, China and
South Africa biotech crops make up a growing
(if not the biggest) form of crops. Similarly, in the
health sector the importance of biotechnology
cannot be overstated. Biologic medicines and
technologies are increasingly being used in
the treatment of patients with the most difficult
conditions as well as in cutting-edge
medical research.
This paper identifies seven enabling factors
that together create an environment conducive
to biotech innovation. The factors range from
the institutional and eco-system level (such as
levels of tertiary education and IP environment)
to the more biotech specific (such as what type
of biomedical and biotech R&D infrastructure
does a country have in place and availability of
technology transfer laws and mechanisms). The
enabling factors are listed below together with a
brief outline of the importance of each factor:
1. Human capital – A basic and fundamental
building block for the biotech sector is the
availability of high skilled and technically
trained human capital.
2. Infrastructure for R&D – R&D infrastructure
and capacity is critical to fostering innovation
and activity in high tech sectors including
biotechnology and is reflected by a number
of country-level indicators including total R&D
expenditure; patenting intensity; biotech R&D
expenditure; life science investment levels;
public-private partnerships; and academic
and scientific citations.
3. Intellectual property protection –
Intellectual property rights such as patents
and regulatory data protection are historically
of real importance to the biotech and
biopharmaceutical innovation process as
they incentivise and support the research and
development of new biological technologies
and products.
7
Executive Summary
4. The regulatory environment – The
regulatory and clinical environment in a
given country or region plays a significant
role in shaping incentives for innovation
and establishing adequate levels of quality
and safety for biotech products, particularly
biopharmaceuticals.
5. Technology transfer frameworks –
Technology transfer is an important
mechanism for commercialising and
transferring research from public and
governmental bodies to private entities
and private to private entities for the purpose
of developing usable and commercially
available technologies.
6. Market and commercial incentives – Market
and commercial incentives can come through
a number of different formats such as tax
incentives, general support for basic research
and R&D credits for investments in plant,
equipment and other R&D infrastructure.
For the biopharmaceutical sector market
and commercial incentives are primarily
determined by the existing pricing and
reimbursement systems for medicines and
health technologies. The manner and extent
to which these policies are put in place can
have a profound impact on the commercial
and market incentives for innovation more
broadly in the health sector as well as for
biotechnology R&D and particularly in the
biopharmaceutical sector.
7. Legal certainty (including the rule of law)
– The general legal environment including
as it relates to the rule of law and the rule
of law within a business context is crucial to
commercialization and business activities.
8
Based on the analysis identification of the
enabling factors and country mapping the
paper provides six recommendations and steps
for countries to take. They are:
1. Identify the biotechnology sector as an
area of strategic importance – Identifying
the biotechnology sector as an area of
strategic importance is the first step in
successfully building a national biotechnology
policy. By and large most countries included
in this paper have directly or indirectly
targeted biotechnology as a technology and
industry of strategic importance to national
economic development and growth.
2. Create a national blueprint – The existence
and creation of a blueprint of national
biotechnology strategy can be a powerful
tool in creating a vision and setting a goal
for national aspirations. There are many
ways in which governments can provide
leadership and direction for the building of
a biotechnology capacity. In some countries
a more de-centralized, indirect approach
has proven to be effective, such as in the
US, whereas in others direct government
leadership has been instrumental in creating
the conditions for success. Examples include
Korea and, certainly in the ag-biotech and
biofuels sector, Brazil. Regardless of the
type of governmental leadership strong
governmental inter-agency and departmental
coordination is required.
3. Measure performance – The measuring of
performance of the biotechnology sector
in a transparent and systematic fashion is of
real importance to understanding progress
made and challenges remaining in order to
allow for mid-course corrections that may
be necessary. This can be conducted either
through recurring government review or
independently through private, academic and
non-governmental actors.
Building the Bioeconomy Examining National Biotechnology Industry Development Strategies
4. Recognize and use existing best practices
– Although no two countries are the same
and all face different circumstances, countries
can learn from the experiences of each other.
International best practices should be shared
and repositories of information and resource
sharing are all positive and worthwhile
undertakings.
5. Leverage national capabilities –
Understanding and focusing on one’s
comparative and competitive advantage
can lead to the most effective allocation
of resources. Country size, scientific
and research strengths, geography and
biodiversity are all important attributes. Some
countries have natural strengths in some
biotech sectors whereas others can compete
and develop across the board.
6. Enhance local and international
cooperation – Cooperation and partnerships
between public and private, national and
international stakeholders can be key in
attracting investment and building up a
world-class biotech industry. Singapore
is a good example of a country which by
leveraging its strengths and fully engaging
in partnerships between government and
the multi-national industry and between the
public and private sectors has been able to
in a relatively short time span build a cutting
edge biomedical and biotech R&D capacity.
9
Building the Bioeconomy Examining National Biotechnology Industry Development Strategies
1
Introduction
That innovation is central to economic development is something
few economists would dispute. Indeed, Joseph Schumpeter’s 1939
declaration that “innovation is the outstanding fact in the economic
history of capitalist society” is probably even truer today than it was
when he first made it on the eve of World War II.1
In essence, innovation is the ability to create
new uses, functions, processes and products
from either existing products or processes or
completely novel ones. Increasing economic
productivity is fundamentally about innovating
or displacing existing means and processes
of economic production. From basic
manufacturing to the provision of high-tech
cutting edge services, innovation is central to
growth and commercial success.
Firms, businesses and whole economies now
face more than simply competitors from within
their own national or regional markets; instead
competition is both international and transnational. Indeed, governments of all colors
talk incessantly of the need to continue to
innovate and build a 21st century knowledge
economy. Examples include President Obama
in his State of the Union message in 2011
when he emphasized the need for America
to “out-innovate, out-educate, and out-build
the rest of the world”. Similarly, Britain’s
Conservative-Liberal government early on
in their parliamentary term made increasing
innovation a key part of their economic policy.
In the BRIC economies innovation is also viewed
as key to continued prosperity and economic
development. Former Chinese Premier Wen
Jianbao frequently spoke about the need for
China to focus on science and innovation and
become an innovation-driven economy and
today innovation remains a key part of China’s
current economic policy and five year plan. In
Brazil, the government has launched a number
of policies aiming to stimulate innovation under
both the “Competitive Development Policy”
and the more recent Brasil Maior initiative.
And while the Lisbon Agenda has quietly been
dropped, in the EU the old innovation warhorse
has been trotted out yet again. This time in
the guise of the Europe 2020 strategy with an
“Innovation Union” being one of the hallmark
initiatives.2
But pursuing public innovation policies in more
than name can be rather expensive. Given the
devastating impact of the financial crisis of 20078, the subsequent global economic downturn
and sovereign debt crises, public spending
and investment in many economies are being
squeezed. Yet while investment and funding
remain fundamental to the success of innovation
policies, apart from having the right amount of
investment and funding, having the right kind
of policies in place to promote innovation is
absolutely crucial. Nowhere is this clearer than
in the field of biotechnology.
1.1 The future is Bio
Advances in biotechnology – which encompass
health, food and agriculture, industrial and
environmental segments – are at the heart
of human society, both scientifically and
economically. In 2009 the OECD projected that
the importance of biotechnology would only
grow over time and that in the areas of health
care, agricultural production and industry,
biotechnologies would have a massive socioeconomic impact. Apart from the social benefits
of being able to feed and treat the world’s
growing population, the economic contribution
of biotechnology and biotechnology intensive
sectors was only expected to increase. The
OECD predicted that by 2030 biotechnology
could make up to 2.7% of member state
GDP.3 And more recently in 2012, in the
National Bioeconomy Blueprint, the Obama
administration and US Government argued that
the bioeconomy would “allow Americans to live
longer, healthier lives, reduce our dependence
on oil, address key environmental challenges,
transform manufacturing processes, and
11
1 Introduction
increase the productivity and scope of the
agricultural sector while growing new jobs
and industries.”4
This importance of biotechnology to future
social and economic development is illustrated
by almost every country today – both mature
and emerging market – identifying and
defining the field of biotechnology as a strategic
priority to their national interest. And why
wouldn’t they?
Breakthroughs and the increased use of
agricultural biotechnology over the past few
decades have allowed farmers to produce
increasing amounts of crops and foods to feed
a growing proportion of the world’s population.
In 2013 a record 175 million biotech hectares
were grown globally.5 Significantly 54% of this
production was concentrated in developing and
emerging markets in Latin America, Asia and
Africa.6 In Brazil, Argentina, India, China and
South Africa biotech crops make up a growing
(if not the biggest) form of crops.
Similarly, in the health sector the importance of
biotechnology cannot be overstated. Biologic
medicines and technologies are increasingly
being used in the treatment of patients with
the most difficult conditions as well as in
cutting-edge medical research. For example,
biotechnologies are increasingly part of the
discovery, clinical and pre-marketing studies on
traditional small molecule drugs. This includes
biotech processes such as pharmacogenetics,
gene sequencing and diagnostics through the
identification of biomarkers. The path to new
types of clinical and therapeutic environment
– based on the personalization of medicines
and medical treatments – is in large measure
based on advances in biotechnology. Here
pharmacogenetics and gene sequencing play a
crucial role.
At the same time as the appreciation and
recognition of the importance of biotechnology
continues to increase, developing a
sophisticated national biotechnology capacity
has become a much riskier, more complex and
costly endeavor.
Consequently, policymakers and stakeholders
have an intensified interest in understanding
12
and identifying the desired set of national policy
tools needed to encourage the growth and
development of the biotechnology industry
from the most basic level of research to fullblown commercialized products.
1.2 Paper overview
The purpose of this briefing paper is to provide
an overview of some of the best practices in
place internationally that support and enhance
biotechnology inputs and outputs.
The paper takes into account the specific
requirements of the biotechnology sector and
how biotech R&D takes place. It identifies key
enabling policy input factors ranging from
human capital, protection of IP to infrastructure
for R&D.
The point of reference for this assessment is the
development of a globally competitive sector;
countries that wish only to develop a sector
that is nationally competitive could in principle
adopt a more protectionist set of policies. The
consequence of such a strategy would however
be to limit the ability of local players to succeed
in world markets.
Through case study analysis the paper focuses
on the biotechnology strategies of a sample
of eight countries. The country sample is
geographically and economically diverse with
a mix of high-income mature OECD economies
and middle income and emerging markets.
The countries analyzed are Brazil, China, India,
Korea, Russia, Singapore, Switzerland and the
United States.
In addition to this Introduction the paper
contains the following sections.
Section 2 looks at the importance of
biotechnology innovation to future economic
development and growth and provides a
thorough discussion of the specific processes
related to research, development and
commercialization of biotechnologies and
products. The section provides a spotlight on
the biotechnology R&D process; how it has
changed over the years; and what some of
the challenges and opportunities associated
with contemporary biotechnology research
Building the Bioeconomy Examining National Biotechnology Industry Development Strategies
are. The biotechnology R&D process is highly
technical and specialized requiring advanced
technological and human capital capabilities.
Section 3 describes the rationale and upto-date thinking that underline national
biotechnology strategies. It identifies seven
enabling input and output factors that are
of the most importance to making these
strategies successful.
Section 4 discusses the national innovation and
biotechnology strategies in eight countries:
Brazil, China, India, Korea, Russia, Singapore,
Switzerland and the United States.
For each country, this section provides:
• An introduction and general economic
country overview;
• A description of the national innovation
strategy and biotechnology strategy; and
• A table summarizing the key policies and
initiatives in place for each of the seven
enabling factors identified in section 3
organized around two themes:
– Success stories; and
– Stumbling blocks.
A deeper discussion and analysis of all seven of
the enabling factors for each country included
in the study are provided in Appendix I.
Based on this analysis section 5 provides
recommendations.
13
Building the Bioeconomy Examining National Biotechnology Industry Development Strategies
2
Biotechnology innovation
This section provides a discussion of the specific processes related
to research, development and commercialization of biotechnologies
and products. The section provides a spotlight on the biotechnology
R&D process; how it has changed over the years; and what some
of the challenges and opportunities associated with contemporary
biotechnology research are.
2.1 Developing biotechnologies
Biotechnologies are today used in a wide
variety of sectors and industries to produce
everything from advanced biopharmaceutical
medicines, genetically modified crops to
household goods such as enzyme-based
cleaning detergents. While these products
and technologies share the characteristics
of having been developed through or are
the result of a biotech process, the R&D
requirements to develop, commercialise,
manufacture and maintain a product in
the market can vary from one product
or technology to another. For instance,
manufacturers of biofuels face a different set of
R&D challenges and set of regulations than do
companies in the seed industry. Nevertheless,
there are some important similarities that are
shared across most biotech sectors. Most
notable is the cost and complexity of the R&D
required to develop a biological product or
technology.
For instance, research, development and
eventual commercialization of new biofuels
require considerable time and capital.7 The
estimated cost of a biofuel processing facility
is USD350 million per plant and the estimated
period of time to move from a pilot phase to
full commercialization is 12 years.8 Similarly,
within the crop protection sector (in which a
number of companies increasingly integrate
and make use of biotechnologies in their R&D
activities) the cost of bringing a new product to
market has increased significantly over the past
two decades. According to research by the
USDA, in 1995 the total cost from the research
and discovery phase to registration and
market approval was USD162 million.9 By
2005 this had increased by close to two-thirds
to USD254 million.
Looking at other biotech sectors one can
see similar trends. For example, in the
biopharmaceutical industry the cost of research
and development has risen considerably over
the last few decades. In 1979, the total cost of
developing and approving a new drug stood at
USD138 million. Almost 25 years later, in 2003,
this figure was estimated to have rocketed to
USD802 million.10 A more recent estimate points
to the total cost of drug development being
approximately USD1.5 billion.11 Significantly,
different stages of R&D do not contribute
equally to the composition of total cost. For
biopharmaceuticals it is the clinical component
which is the most costly and has increased the
most. For example, clinical trials from Phase I to
III account for approximately two thirds of the
total cost of bringing a medicine to the market,
even though they do not represent the longest
period of drug development.12 In addition to
cost there is also the challenge of successfully
developing new medicines and technologies
and the length of time spent on developing
a drug. On average, only one to two of every
10,000 synthesized, examined and screened
compounds in basic research will successfully
pass through all stages of R&D and go on to
become a marketable drug. Furthermore, it
takes between 10 and 15 years from the filing of
a new patent to the day when a new medicine
finally becomes available for patients to use.13
Below Figure 1 provides a basic overview of the
biopharmaceutical R&D process, with a particular
focus on the stages of clinical research.
15
2 The Benefits of Cross-Border Data
Figure 1: The biopharmaceutical R&D process
Research and discovery: Scientists attempt to isolate
new chemical or biological entities using advanced
screening and synthesising techniques.
Pre-clinical development: Initial safety tests and
assessment studies, such as toxicology, are performed
on animals.
Clinical development:
Phase 1: Initial phase tests a drug candidate in 20-100
healthy volunteers to assess how the body processes
it and what side effects manifest themselves. A drug
must show a minimum level of safety in order to move
to the next phase of studies.
Phase 2: Examines a drug candidate’s effectiveness in
treating a targeted disease relative to other existing
drugs or to a placebo. It explores whether the
candidate acts against the disease and if it causes any
adverse reactions in patients, and how this measures
up to existing treatments. Studies involve 100 to
500 volunteers, all of whom experience the targeted
disease or condition.
Phase 3: If the candidate is proven safe and effective
in the first two phases, the study is shifted to a far
larger scale, from 1,000 to 5,000 subjects. Studies test
the safety and effectiveness of the drug candidate
in different populations and conditions. This phase
generates a large amount of data on the candidate in
order to understand as clearly as possible the safety
risks associated with the drug and to identify the
right dosage and mode of use. Due to the scale of
operations, Phase 3 studies are the most costly and
time-consuming trials.
Registration: Results of pre-clinical and clinical
studies and proof of meeting international standards
are submitted to drug regulatory authorities for
their review.
Phase 4: Biopharmaceutical companies must submit
a plan for on-going monitoring and study of the drug
as part of its approval for marketing. These studies are
intended to safeguard larger scale use of the drug by
monitoring any adverse effects that become evident
as well as identifying what appears to be the most
appropriate and effective manner of use.
2.2 R&D vs. manufacturing
Developing high technology processes
and/or products such as bio-crops and
biopharmaceuticals is not an easy task. As
section 3 details below this involves highly
specialised and expensive R&D infrastructure,
trained and skilled human capital as well as a
host of other physical and non-physical enabling
factors. The R&D required to bring high-tech
products to market is the most complex and
demanding part of the development cycle.
Manufacturing, on the other hand, can in some
cases by comparison be less demanding.
Often this basic fact and distinction between
the demands of developing a national or
regional R&D capability for high-tech products
versus developing a manufacturing capability
is overlooked in policy discussions. The
manufacturing process can be confused with
the R&D process. Yet it is important to note the
distinction between the two.
For example, traditional “small molecule”
pharmaceutical drugs (which are chemical and
16
manufactured through a process known as
chemical synthesis) are very difficult and costly
to research and develop requiring high levels
of technical infrastructure and skilled human
capital. By comparison the manufacturing of
such pharmaceutical drugs can be much less
technically challenging depending on the
specific composition of the pharmaceutical
drug. Consequently, a small molecule
pharmaceutical drug can be developed in one
country yet it or its key constituent parts (such
as the API) can be manufactured in a different
location and by a different entity. Indeed, the
outsourcing of pharmaceutical manufacturing
and the manufacturing of APIs has been a
common practice within the pharmaceutical
industry for years.14
With regards to the development and
manufacture of biological technologies
and products there is, however, less of a
distinction between the requirements of
manufacturing and product development.
While developing a biological product or
technology also requires high levels of expertise
Building the Bioeconomy Examining National Biotechnology Industry Development Strategies
and advanced technical infrastructure, given
the size, complexity and inherent instability
of a biologic, the manufacturing process
also requires a considerable level of stability
and technical capacity.15 Specifically, the
manufacturing process must be consistent
and not changed with new parts or processes
introduced. Otherwise there is a risk that
the quality and purity of the manufactured
product is compromised.16 These challenges
– of maintaining stability, consistency to
ensure a high quality product – are unique to
the manufacturing of biologics and make the
outsourcing of this manufacturing difficult and
technically testing.17
In this respect developing a sophisticated
biotechnology capacity can be considered as
providing even more of a technical challenge
than other high-tech products. Section 3
examines just how difficult this is and the
challenges of making sure that all physical
and non-physical enabling factors are in
place to successfully build a world-class
biotechnology capability.
17
Building the Bioeconomy Examining National Biotechnology Industry Development Strategies
3
National strategies to encourage
biotechnology activity
This section describes the rationale and up-to-date thinking that
underline national biotechnology strategies. It identifies seven
enabling input and output factors that are of the most importance to
making these strategies successful.
3.1 What is a National
Innovation Strategy?
In essence, a national innovation strategy or
system refers to the measures that state actors
or regions (such as the EU) take in seeking to
promote innovation in general or in a particular
sector. Former PC hardware producers and
now management and information systems
consultants IBM provide a succinct description:
National innovation policy centers on a
broad agenda to fuel a nation’s innovative
capacity and it seeks action from government,
industry, academia and workers. A national
innovation strategy builds on a contemporary
understanding of innovation and tries to create
a consensus to act on the changes required to
establish an effective national framework.18
Fundamentally, national innovation strategies
are a set of policies and initiatives aimed at
encouraging innovation on or at a macro or
micro level. They can be coherent, synergistic
plans for interconnected action or a laundry
list of disparate initiatives that on their own
promote innovation. Indeed, they can consist
of both generic policies (those that generally
address factors of innovation) and specific
policies (those that address components
specific to innovation in the targeted field, say
biotechnology). The type of policy pursued and
the prospective effect (negative or positive)
is largely a result of what type of innovation
infrastructure and factors are already in
place.19 For example, it is difficult to produce
an effective specific policy encouraging
biotech innovation, if the basic educational
infrastructure of educating and training
scientists and researchers is not in place.
While a national innovation strategy is shaped
by various elements and no two national
strategies can be identical, there are a number
of components or best practices which are
necessary for putting in place and executing
a national innovation strategy. Given the
unique characteristics of biotech research and
development outlined above in section 2, a
number of key components can be identified
that are essential in order to successfully
promote biotech innovation in a given country.
3.2 Promoting biotech
innovation: Seven enabling
factors
Designing an environment that is conducive
to the innovation, research, commercialisation
and marketing of biological products and
technologies is not an exact science. There are
a myriad of factors that potentially can affect,
encourage or discourage rates of biotech
innovation. Relevant policies and factors range
from those specific to the biotechnology sector
and the life sciences to more general ones
affecting broader levels of innovation and
economic activity. Moreover, every situation,
country or region is different. Depending on the
structure of a particular economy and levels of
overall socio-economic development, different
countries have greater or lesser needs in
specific policy areas.
19
3 National strategies to encourage biotechnology activity
Still, putting these considerations aside, it is
possible to piece together a framework and
identify a number of enabling factors that
together create an environment conducive to
biotech innovation. Table 1 summarizes
these factors:
Table 1: Enabling factors
• Human capital
• Infrastructure for R&D
• Intellectual property protection
• The regulatory environment
Infrastructure for R&D
Combined with having adequate, educated and
technically proficient levels of human capital,
R&D infrastructure and capacity is critical to
successfully fostering innovation and activity in
high tech sectors including biotechnology.22
A country’s R&D capacity and available
infrastructure for R&D is reflected by a number
of different indicators including total R&D
expenditure; patenting intensity; biotech R&D
expenditure; life science investment levels;
public-private partnerships; and academic and
scientific citations.
• Technology transfer frameworks
• Market and commercial incentives
• Legal certainty (including the rule of law)
The following pages provide a description of
each enabling factor and its importance in
contributing to an environment that encourages
and promotes biotech innovation and research.
Human capital
High skilled and technically trained human
capital is one of the most fundamental features
that successful biotech innovation is reliant
upon. A number of general and biotech specific
studies have found that without the right human
capital it is virtually impossible to create the
conditions in which biotech innovation can
take place. For example, a 2006 OECD study of
biopharmaceutical innovation emphasized the
importance of human capital and availability
of skilled and trained scientists, researchers
and technicians.20 Similarly, the National
Science Foundation’s Science and Engineering
Indicators place a strong emphasis on levels
of education, strength of higher education
and number and quality of researchers when
compiling its indicators.21
Human capital refers to and can be measured
by: higher education rankings, life science and
medical college rankings, life science graduates,
number of life science, biotech/or biomedical
professionals and researchers, education levels,
and researchers and scientists.
20
In the biopharmaceutical sectors clinical
regulation is of particular importance in
attracting investment and clinical trials. A 2012
study by Charles River Associates found that
clinical regulations and the regulation of clinical
research activities played an important role in
determining clinical trial location.23
What types of policies are in place to encourage
the building and introduction of these types
of facilities and initiatives? Governments and
countries can on the one hand support the
building of R&D infrastructure through direct
support and government funded and operated
facilities and also through public-private
partnership.
Intellectual property protection
IPRs are historically of real importance to the
biotech and biopharmaceutical innovation
process. For biopharmaceutical as well as
non-pharmaceutical biological products and
technologies the evidence suggests that IPRs
incentivise and support the research and
development of new biological technologies
and products.24 In particular patents and other
forms of exclusivity for biopharmaceuticals
such as regulatory data protection and special
exclusivity incentives for the protection and
production of orphan drugs provide researchbased companies with an incentive to invest vast
sums in R&D and the discovery of new biotech
drugs, products and therapies. As noted above,
the research process for biopharmaceuticals
(and many other biotech products) is unique in
its time, cost and high rate of failure. The market
exclusivity period provided by IPRs give firms
the protection and incentive needed to recoup
Building the Bioeconomy Examining National Biotechnology Industry Development Strategies
R&D investments made. Evidence suggests that
many drugs and therapies would not have been
discovered had it not been for the incentive and
protection provided by these IPRs. For instance,
analysis of market exclusivity periods and
legislation finds that the combination of market
exclusivity and income from patent protection
drives private investment in innovation, which
contributes to new drug development.25 Older
studies have estimated that between 6065% of pharmaceutical products would not
have been introduced or developed in the
absence of patent protection.26 For biologics
exclusivity periods under RDP are of particular
importance as there may be a so-called ‘gap’
in patent protection between a biosimilar and
the innovator, reference product. Because of
the inherent characteristics of large molecule
biologics a biosimilar can be approved for
marketing – based on a comparison to a
reference product – yet not directly infringe
any existing, in force patents for the reference
product due to differences in structure,
administration, or mechanism of action. Under
this scenario the exclusivity provided by a RDP
term is critical to a biotech innovator.
The regulatory environment
The regulatory and clinical environment in a
given country or region plays an important
role in shaping incentives for innovation
and establishing adequate levels of quality
and safety for biotech products, particularly
biopharmaceuticals. A strong regulatory
environment creates the conditions for the
production and sale of high quality products
and technologies.27
Procedures, standards and conditions are to
a large extent dependent on the regulatory
framework and regulations in place. Different
biotech sectors have different needs and
regulatory structures in place. The regulation
of GM crops, for example, may be carried out
by a separate entity from that which regulates
biopharmaceuticals. This is often the case with
other biotech products as well such as biofuels.
Depending on the product there may be some
regulatory overlap and more than one agency
or body may be involved. For example, in the
US divisions within the USDA, FDA and other
federal agencies, including the EPA, regulate
different biological products and technologies.28
Overall the most advanced and innovative
biotech markets in the world are also those
which have the highest levels of clinical
and regulatory standards. Looking at
biopharmaceuticals this is achieved through
setting and imposing high clinical and
manufacturing standards through GCPs and
GMPs as well as post-marketing surveillance
through pharmacovigilance programs. A country
which wishes to develop an industry that is
competitive in international markets (as opposed
to simply dominant in its home market) needs
to develop a regulatory system that is aligned
with international best practice. This is illustrated
by, for example, the growing focus of major
drug authorities, such as the FDA, on ensuring
that international manufacturers and nonUS manufacturing adheres to FDA standards
and the establishment of foreign offices and
increased inspections of foreign manufacturers
and suppliers.29
While it may impose substantial costs on
manufacturers to comply with these standards
they also give patients confidence in new
biomedical products being safe and effective.
There are a number of efforts both at the
national and international level to minimise
the cost of these high standards through the
coordination and harmonisation of clinical and
regulatory standards. In the biopharmaceutical
sector, for instance, this includes the
International Conference on Harmonisation
of Technical Requirements for Registration of
Pharmaceuticals for Human Use.
Technology transfer frameworks
Technology transfer is a critical mechanism for
commercialising and transferring research from
public and governmental bodies to private
entities and private to private entities for the
purpose of developing usable and commercially
available technologies. Technology transfer
activities that are based on academic-industry
and public-private sector collaborations
provide a significant and distinct contribution
to the economic strength and well-being of
countries in which such activities take place. The
process enables public research institutions to
obtain access to commercial research funds,
state-of-the-art equipment and leading-edge
technologies, while allowing industry to benefit
from the extensive knowledge and ingenuity of
21
3 National strategies to encourage biotechnology activity
academic researchers. To better understand
the potential impact of technology transfer on
innovation and economic development it is
worth considering the US which has become
regarded as a pioneer and leader in this field.
In the 1980s the US passed two path-breaking
pieces of legislation: the Patent and Trademark
Law Amendments Act of 1984 and 1986 (the
Bayh-Dole Act) and the Stevenson-Wydler
Technology Innovation Act, which was later
amended by the Federal Technology Transfer
Act of 1986 and the Technology Transfer
Commercialisation Act in 20003. This legislation
attempted to supply federal laboratories
(e.g. the NIH) and universities using federal
funds with the incentives needed to work with
industry for the purpose of translating early
stage research into usable products in the
market place for the benefit of the wider public.
The legislation sought to secure the above
goals through three major changes to the IP
system. First, they allowed universities and
federally funded bodies to retain ownership
of the proprietary knowledge stemming out
of the research and daily activities of these
institutions, including the ability to own patents
on their inventions. Second, they encouraged
these institutions to become much more
proactive and professional in the management
and exploitation of their IPRs by creating
professional technology transfer offices.
Finally, the legislation sought to stimulate the
commercial and financial aspects of public-
private collaboration, with the intention of
creating new businesses (such as spin-off
companies) and generating income for the
institutions, as well as for the researchers.
The new laws led to a flood of technology
transfer activities based on the exploitation and
commercialization of IPRs. A decade after the
legislation was passed the combined campuses
of the University of California became the top
recipient in the US of biotechnology patents;
a position formally held by the pharmaceutical
company Merck.30 Indeed, The Economist called
Bayh-Dole “Possibly the most inspired piece
of legislation to be enacted in America in the
last half-century”.31 More recent analysis shows
the significant economic contributions that the
non-profit and university sector has made. For
example, using fifteen years of data from the
annual Association of University Technology
Managers survey a 2012 study estimating the
economic contribution of licensing activity by
academic institutions found that in the US the
contribution of academic licensing to gross
industry output ranged from USD199-836 billion
(2005 USD).32 Contributions to GDP were equally
significant estimated at between USD86-388
billion (2005 USD).33
University technology transfer activity has
increasingly become recognized by policymakers in a growing number of countries as
a powerful driver of economic growth and
innovation. Since the US technology transfer
system of public-private partnerships was
put in place many countries have sought to
emulate it. Canada (1985), Japan (1998), UK
(1998), Germany (1998, 2001), France (1999),
Austria (2002), Italy (2001), Belgium (1999), Spain
(1986), Denmark (2000), Switzerland (2002),
Netherlands (1998) and Korea (1998, 2000 and
2001) have all adopted frameworks aimed at
promoting technology transfer between public
private partnerships through the exploitation of
IPRs.34 As will be discussed in below for the case
study countries the evidence suggests that in
countries that have adopted these frameworks,
technology transfer activity has steadily
increased.
Although primarily considered within a publicprivate, academic-industry context, it is also
worth mentioning that in many countries it is not
22
Building the Bioeconomy Examining National Biotechnology Industry Development Strategies
only the regulatory and legislative framework
for technology transfer from public to private
entities that can be challenging, but also for
transfer activities between private entities.
But developing successful technology transfer
platforms is not a simple task, even in mature
markets where such activities have long been
established. An effective technology transfer
platform depends on a wide range of factors,
such as the establishment of a technology
transfer offices which employs IP experts and
marketing professionals; industry oriented
scientists; entrepreneurs and companies
seeking seed technologies to license from the
university and then develop; governmental
grants to support the process and a strong
national IP system that allows a university/
academic institution to protect and license
its inventions.
The availability of technology transfer
frameworks can be measured by examining
the existence of relevant policies, laws and/
or frameworks as well as their actual use
through university patenting rates, licensing
agreements and commercialisation activities in
all sectors and between all relevant entities.
Market and commercial incentives
Market and commercial incentives can come
through a number of different formats. These
include tax incentives, general support for
basic research and R&D credits for investments
in plant, equipment and other R&D
infrastructure.
For the biopharmaceutical sector market and
commercial incentives are primarily determined
by the existing pricing and reimbursement
systems for medicines and health technologies.
Most health care systems have in place either
direct or indirect mechanisms for regulating
and adjusting the pricing and reimbursement
of medicines. In Europe this is frequently done
directly through pricing and reimbursement
negotiations between health ministries or
government agencies and biopharmaceutical
manufacturers. Prices are often determined
through complicated formulas of internal and
external reference pricing that compare the
cost of medicines in a number of countries.
Many countries have also adopted advanced
systems of pharmaco-economic and costeffectiveness analysis and comparisons. In
other more diversified systems such as in
the US, the price and cost of medicines is to
a greater extent influenced by pure market
factors. However, payers – be they public
bodies such as Medicare and Medicaid or
private health insurers – still set formularies
and reimbursement guidelines.
The continued rise of health care costs in
mature and emerging markets has put more
pressure on health authorities and payers to
limit future increases in health spending. The
manner and extent to which these policies
are put in place can have a profound impact
on the commercial and market incentives
for innovation more broadly in the health
sector as well as for biotechnology R&D and
particularly in the biopharmaceutical sector.35
Academic research and modelling suggests
that for biopharmaceutical products restrictive
pricing and reimbursement policies limit and
delay new product launches. For example, a
2007 study investigating the impact of price
controls on product launches in several OECD
and middle-income economies found that
price controls (and other supply side controls)
have a significant impact on potential product
entry, reducing the likelihood of entry by
roughly 75% compared with a market having
no price controls.36
Legal certainty (including the rule of law)
The general legal environment including
as it relates to the rule of law and the rule
of law within a business context is crucial to
commercialization and business activities.37
A sound and predictable legal and
administrative framework contributes to an
environment in which research and ideas
can be more successfully commercialized,
licensed and marketed. Countries in which
administrative and legal justice is harder
to attain and in which dispute resolution
and enforcement of contracts and rights
is a challenge are less likely to encourage
general entrepreneurial activity including in
the biotech sector. The legal and business
environment of a given country can be
mapped through existing international indices
such as the World Justice Project’s Rule of
Law Index.
23
24
Building the Bioeconomy Examining National Biotechnology Industry Development Strategies
4
Mapping national innovation strategies
The following section will map the national innovation strategies and
policies in place for biotech innovation for eight mature and emerging
market economies: Brazil, China, India, Korea, Russia, Singapore,
Switzerland and the US.
Using the seven enabling factors outlined
above in section 3 as reference points this
section will map the policies, factors and best
practices that are in place in each of the studied
countries. For each country an overview of the
NIS and biotechnology policies will be provided
together with a table summarizing the key
policies and initiatives in place for each of the
seven enabling factors including the type of
best practices that are in place as well as areas
in which there is room for improvement. For
the sake of conciseness this section does not
include a detailed discussion of each enabling
factor for each country. Instead, a deeper
discussion and analysis of all seven of the
enabling factors for each country included in
the study is provided below in Appendix I.
As mentioned above these countries provide
a good sample for a number for reasons. First,
together they make up a substantial share of
world economic output with all, bar Singapore
and Switzerland, in the top-15 of the world’s
Source: Scientific
American (2013)
Figure 2: Scientific American Worldview Scorecard 2013,
countries sampled41
50%
45%
40%
largest economies measured by purchasing
power parity per the latest figures from the
World Bank.38 Second, in terms of level of
development, they are a good mix of, on the
one hand, mature economies that rely on
innovation to drive economic growth with a
number of emerging markets that increasingly
are looking for innovation and knowledgebased activities to drive their own economic
development. Third, all countries have policies
in place and have expressed a desire to develop
their respective biotechnology sectors. Finally,
there are some notable differences between
the countries in terms of their capabilities and
specifically their rate of innovativeness. To
begin with on a macro basis some countries
are considered as being more proficient in
promoting and generating both general rates
of innovation as well as biotech innovation. At
a more granular level some countries also have
strengths in particular areas of biotechnology.
For example, Brazil has for many years been a
pioneer in using and developing GM crops and
developing agricultural biotechnology. In 2013
Brazil had 40.3 million hectares of biotech crops
under cultivation growing maize, soybeans and
cotton; second in the world only to the US.39
And as will be discussed in more detail below
the Brazilian Government through EMBRAPA
has for decades been closely involved in the
R&D and commercialisation of agricultural
biotechnologies.
35%
30%
25%
20%
15%
10%
5%
0%
USA itzerland gapore th Korea
Sin
Sw
Sou
Brazil
a
Chin
ia
Russ
India
A good place to start and get a sense of the
general level of the biotechnology sector
in each country is the Scientific American
Worldview Scorecard. Published annually
since the late 2000s the Scorecard provides
an assessment of countries’ relative innovative
capabilities and successes as they relate to
biotechnology.40 Opposite Figure 2 provides
the 2013 Scorecard country scores for the eight
countries examined in this briefing paper. The
25
4 Mapping national innovation strategies
maximum available score in the Scorecard is
50 and is calculated on the basis of performance
in a range of biotech related categories
and factors.
As would be expected the countries with the
highest overall scores are relatively mature
markets with well-established life sciences and
biotech sectors. Indeed, the US, Switzerland and
Singapore were all in the top five for the entire
Scorecard and not just in this comparison.
The below discussion echoes one of the
broader findings and points made in Scientific
American’s research and Scorecard: that is,
while the overall level of biotech innovation can
grow in all the BRICS, interestingly each country
already has strengths in specific policy areas
and specific enabling factors.
4.1 Brazil
Together with China and India, the emergence
of Brazil has been one of the major economic
stories of the first decade of the 21st century.
The Brazilian economy is now considered one
of the most important in the world. Since the
late 1990s it has recorded steady GDP growth at
just under 3% per year, with a slight dip in 2012
when growth was 0.9%.42 The latest World Bank
national accounts figures from 2012 show total
Brazilian GDP at PPP just over USD 2.3trillion.43
Brazil is a middle income country with an
estimated 2012 GDP per capita of USD11,340
per the World Bank.44 Increased Brazilian
economic competitiveness is also reflected in
its global economic competitiveness ranking.
The World Economic Forum’s 2013-14 Global
Competitiveness rankings ranked the Brazil
as the 56th most competitive economy in
the world.45
Brazil has a number of innovation policies in
place both at the federal and state level with
some form of national innovation policies and
frameworks having been in place for decades.
A number of important government institutions
and agencies such as BNDES, FINEP and
others have been supporting innovation and
investment in Brazil since the 1970s.46 (The
work and role of both FINEP and BNDES
are discussed in more detail in Appendix I.)
In recent years there have been a number
26
of specific innovation national policies and
initiatives introduced. In 2004 the National
Innovation Law was passed. This legislation
sought to incentivise innovation within the
public sector (particularly at universities) and
innovation partnerships between academic
institutions and the private sector.47 In 2011
the Brazilian Government launched the Brasil
Maior plan a, socio-economic development
initiative in response to the financial crisis and
global economic downturn. This plan places
an emphasis on promoting innovation and
focuses on developing a number of high tech
sectors including ICT, aerospace, biofuels and
health care.48 The Brazilian Ministry of Science,
Technology and Innovation has a long standing
and active involvement in guiding national
innovation policy as does the Ministry of
Development, Industry, and Foreign Trade.
With regards to the use and development of
biotechnology this has been a part of Brazilian
public policy for many years. As mentioned in
the Introduction EMBRAPA has long supported
the use of biotechnology in agricultural
production. Brazil has also relied on biofuels
(sugar-cane ethanol) as a primary source of
transportation energy since 1975 and the
introduction of the Brazilian National Alcohol
Program (Proalcool).49
Most recently biotechnology was identified as
a national strategic priority in 2003 culminating
in the 2007 decree No. 6,041 (Política de
Desenvolvimento da Biotecnologia). This
decree focused on building the international
competitiveness of Brazilian biotechnology
and contains policies relating to direct support
for R&D, the building of R&D infrastructure,
human capital training and development as
well as improvements to the existing regulatory
framework and other policies.50 The decree
also established the National Biotechnology
Committee (Comitê Nacional de Biotecnologia)
to coordinate the implementation of the
Government’s biotechnology policies. The
Committee is comprised of 23 Federallevel agencies and ministries all devoted to
growing Brazil’s biotech sectors. Although the
Committee is still in its formative stages in terms
of practical application and so far results have
been limited, in many ways the Committee can
be viewed as a model for other countries trying
Building the Bioeconomy Examining National Biotechnology Industry Development Strategies
to coordinate biotechnology policy right across
the government. It provides stakeholders and
government officials with a potential central
meeting point and body to discuss
and coordinate biotechnology policy right
across government.
where there is still room for improvement.
The purpose of this table is to give readers a
sense for what policies are in place and some
of the outputs they have produced. A more
detailed discussion of the enabling factors is
provided in Appendix I.
Below Table 2 provides an overview of the best
practices in place for the seven enabling factors.
It lists policy areas of best practice and areas
Table 2: Enabling factors in Brazil
Enabling factors
Success stories
Stumbling blocks
Human capital
• Growing research workforce; doubling in size
since 2000
• Lack of a skilled work force
• Ciência sem Fronteiras (Science Without
Borders) – promising program to build
human capital
Infrastructure for R&D
• Relatively high level of R&D spending
• Successful ag-biotech and biofuels
partnership programs e.g. BNDES/FINAP
PAISS and EMBRAPA-BASF Cultivance
Intellectual property
protection
• WTO member and TRIPS signatory
• 20 year patent term protection provided
• 10 year minimum patent term period
Regulatory environment
Market and commercial
incentives
• Health biotech sector capacity less mature than
ag-biotech and biofuels
• Funding conditions from government agencies
• Challenging regulatory environment for clinical trials
• ANVISA involvement in pharmaceutical patent
examination process
• RDP not available for biopharmaceuticals for human use
• RDP in place for agrochemicals
• No patentability for isolated microorganisms, (e.g.
bacteria and yeast) in industrial and environmental biotech
• Biosimilar pathway introduced
• INPI long processing times and large backlog
(estimated at 8-10 years)
• Relatively clear regulatory regime in
place: ANVISA responsible for regulation
of biologics and biosimilars and CTNBio
responsible for biotech and GM products
Technology transfer
frameworks
• Low % of population in tertiary education
• Framework in place through 2004
Innovation Law
• Tech transfer and commercialization still by international
comparisons low
• Patenting and licensing activities at
universities and PROs increased sine 2004
• Universities have limited tech-transfer capacity
• R&D tax credits are in place through
Law No. 11.196
• Some R&D tax credits limited through being contingent
on issuing of patent – long backlogs at INPI reduce
attractiveness
• Publication requirements and registration of licensing fees
• Strict biopharmaceutical pricing environment
• Extensive use of IRP
Legal certainty (including
the rule of law)
• Government anti-corruption push;
new anti-corruption law introduced 2014
• Independent judiciary
• Patent disputes are resolved relatively quickly and
preliminary injunctions are also granted, but overall
the judiciary and many administrative bodies are
over-burdened
27
4 Mapping national innovation strategies
4.2 China
China is the 2nd largest economy in the
world with an estimated 2012 total national
output of USD12.3 trillion measured on a PPP
basis.51 However, measured on a GDP per
head basis China is a middle income country
with a per capita income of USD6,091 for
2012 at current USD.52 China is the world’s
29th most competitive economy according
to the World Economic Forum 2013-14 Global
Competitiveness rankings.53
Chinese policymakers have for a number
of years made innovation a central part of
economic and industrial policymaking. The
main policy instruments and planning tools
include the “Medium- and Long-term Plan for
Science and Technology Development 200620” launched in 2006 and the more recent
Twelfth Five-Year Plan, 2011-2015”.54 Both
plans emphasize the need for China to grow
its innovation capacity and have set ambitious
general targets and sector specific ones,
including for biotechnology. For example, the
former set as a target the increase of R&D
spending as a percentage of GDP to 2% by 2010
and 2.5% at a minimum by 2020.55 The plan also
included economic growth targets linked to
technological advances as well as emphasizing
the need for the development of an indigenous
high-tech capability through a policy of
“indigenous innovation”.
28
Within both the Medium- and Long-term Plan
for Science and Technology Development
and the Twelfth Five-Year Plan biotechnology
figures prominently. For example, in the
latter the “biological industry” is identified
as one of seven strategic industries to be
developed and invested in.56 Specifically,
developing an advanced R&D, manufacturing
and industrialization capability is outlined as
priorities. In terms of concrete investment and
size of funds the development of a biotech
capacity is set to receive a share of the USD1.7
trillion Chinese policymakers have allocated to
the implementation of the plan.57 The Chinese
Government has also made additional pledges
of close to USD12 billion for the next five-year
plan to the biotechnology sector.58
Opposite Table 3 provides an overview of the
best practices in place for the seven enabling
factors. It lists policy areas of best practice and
areas where there is still room for improvement.
The purpose of this table is to give readers a
sense for what policies are in place and some
of the outputs they have produced. A more
detailed discussion of the enabling factors is
provided in Appendix I.
Building the Bioeconomy Examining National Biotechnology Industry Development Strategies
Table 3: Enabling factors in China
Enabling factors
Success stories
Stumbling blocks
Human capital
• Chinese universities becoming more
competitive internationally e.g. Peking
and Tsinghua
• Relatively low level of researchers as a proportion of
total workforce
• Highest number of university science and
technology graduates in the world
Infrastructure for R&D
• High level of R&D spending – absolute
and % of GDP
• World leader in patenting activity
Intellectual property
protection
Regulatory environment
• WTO member and TRIPS signatory
• 20 year patent term protection provided
• Low level of tertiary education as % of population
• Limited R&D clinical capacity: low levels of clinical trials
• Low levels of basic and translational research investment
• Challenging enforcement environment: High rates of
counterfeit medicines
• RDP in place NCEs
• No availability of RDP for biologics
• SFDA has by comparison to other emerging
markets extensive regulatory framework
• No biosimilar pathway
• Narrow patent protection for biologics
• Regulation of non-innovative biologics outside
international best practices
• Regulatory requirements and procedures for clinical trials
are onerous and delay product registration
• Barriers for ag-biotech: i) product must be registered and
approved in country of export prior to application for
approval in China; and ii) import applications must include
viable seeds
• Indigenous innovation policies
Technology transfer
frameworks
• Legal framework in place since early 2000s
• Quality of patent applications
• University patenting increases by almost
50% per year
• Universities have limited capacity to fully
commercialize innovations
• Increased tech transfer, licensing and
spin-offs
Market and commercial
incentives
• R&D tax credit available and reduced rates
of corporation tax and VAT for qualifying
high-technology enterprises
• Strict reimbursement policies have limited the number
of biological drugs available
Legal certainty (including
the rule of law)
• New government led anti-corruption push
• Legal redress, enforcement of contracts and administrative
justice inconsistently available or applied
29
4 Mapping national innovation strategies
4.3 India
India is the third largest economy in the world
with an estimated 2012 total national output
of USD4.8 trillion measured on a PPP basis.59
However, measured on a GDP per head
basis India is a lower middle income country
with a per capita income of USD1,489 for
2012 at current USD.60 India is the 60th most
competitive economy in the world according
to the World Economic Forum 2013-14 Global
Competitiveness rankings.61
India is in the midst of an ambitious ten-year
plan launched in 2010 as the “Decade of
Innovation”. The plan is characterised by what
Indian policymakers have stressed as the need
for Indian innovation and growth to be socially
inclusive.62 In particular a point of emphasis
has been on defining and aiming policies at
frugal innovation targeting services, products
and developments for low income individuals.
The over-riding theme of India’s innovation
framework has been the need for innovation
to be conducted within a specific Indian/
developing world socio-economic context.63
A number of specific policy documents and
institutions have been set up to monitor the
progress of the plan and outline areas and
sectors of strategic interest and priority. They
include the National Innovation Council whose
role it is to guide Indian innovation and help
shape government policies. This Council also
has a role as a general voice for and promoter
of innovation activities in India and by Indian
institutions including higher education and
research institutions.
In terms of concrete goals the plan set as
a target raising total spending on R&D
as a percentage of GDP to 2% with the
contribution of industry and private sector
spending to double.64 More recently a
government supported venture capital fund,
the India Inclusive Innovation Fund, was
established.65 The purpose of the fund is
to provide seed capital and investments in
small, medium and micro size businesses that
specialise in socially needed innovation. The
announced budget for the fund is INR5 billion
(500 crores).66
30
Looking at biotechnology the Indian
biotechnology sector is by international
standards and compared to other countries
well-developed. The sector has grown
considerably over the past decade from a total
estimated market size of USD1.1 billion in 2005
to USD4.3 billion in 2013.67 Biopharmaceuticals
constituted the largest value share of the Indian
biotechnology industry making up just under
two-thirds of total 2013 value. But India is also a
large producer of GM crops: the country is the
fourth largest grower of ag-biotech crops in the
world with 11million hectares of cotton under
cultivation in 2013.68
In terms of biotechnology specific policies
India has had a national biotechnology plan
in place for a number of years. As mentioned,
biotechnology was included as a strategic
priority in the “Decade of Innovation” plan
together with other sectors such as the nuclear
and defence industries, ICT software and
space technology.69 India has had a separate
Department of Biotechnology since the mid1980s and biotechnology retains a prominent
place in national policymaking. For example, in
2007 a “National Biotechnology Development
Strategy” was released. This Strategy identified
a number of areas for targeted investment and
expansion. They included launching public
private partnerships with 30% of the total
departmental budget allocated to this goal;
the expansion of existing university programs;
expansion of doctoral and post-doctoral
programs; international training programs; the
creation of 50 biotech centers for excellence;
building of biotech incubators and parks; and a
host of other initiatives.70
In 2014 a new draft National Biotechnology
Strategy was issued building on the 2007 draft.
This Draft Strategy hopes to further develop
India’s biotech capacity by continuing the work
commissioned and begun in the 2007 plan
as well as targeting specific sub-sectors such
as agricultural biotechnology which are now
recognised as a priority.71 Overall the 2014
Strategy shifts the focus to the translational
and developmental elements of biotech R&D.
Out of the 10 guiding principles identified in
the Strategy, four relate to translating R&D into
tangible products and services and the targeting
of areas of need in the Indian bioeconomy.72
Building the Bioeconomy Examining National Biotechnology Industry Development Strategies
The Indian Government also has in place a
“National Biofuels Policy”. The aim of this policy
is to reduce dependence on fossil fuels and shift
Indian transportation fuels towards renewable
sources.73
where there is still room for improvement. The
purpose of this table is to give readers a sense
for what policies are in place and some of the
outputs they have produced. A more detailed
discussion of the enabling factors is provided in
Appendix I.
Below Table 4 provides an overview of the best
practices in place for the seven enabling factors.
It lists policy areas of best practice and areas
Table 4: Enabling factors in India
Enabling factors
Success stories
Stumbling blocks
Human capital
• High total number of academic
papers published
• Low university rankings; outside top 200 generally
and 100 for life sciences
• Low rate of researchers as a percentage of population;
lowest among the BRICs
Infrastructure for R&D
Intellectual property
protection
• Targeted biotech initiatives in place:
Biotechnology Industry Partnership
Programme and Small Business Innovation
Research Initiative
• Low levels of R&D spending - 0.76% of GDP
• WTO member and TRIPS signatory
• Section 3(d) and patentability requirements outside
international best practice
• Limited R&D clinical capacity: low levels of clinical trials
• Low levels of basic and translational research investment
• Limited R&D biopharma investment
• No RDP
• Use of compulsory licenses and patent revocations
• Limited protection of plant varieties
Regulatory environment
• Biosimilar guidelines introduced in 2012
• High rates of counterfeit and substandard drugs
• Regulatory authority for biopharmaceuticals and ag-bio
is spread out over various layers of the Indian central
and state government
• Since 2011 no applications for field trials or
commercialization of GM seeds approved
Technology transfer
frameworks
• Incubators and tech transfer offices in place
in some institutions
• Low rates of university patenting
• Low rates of tech transfer
• Not passed a Bayh-Dole type bill
Market and commercial
incentives
• R&D tax credits and credits for special
economic zones in place
• New 2013 Drug (Prices Control) Order place strict price
controls on large number of biopharmaceuticals
Legal certainty (including
the rule of law)
• New 2013 anti-corruption law, Lokpal Act
• Legal redress, enforcement of contracts and administrative
justice inconsistently available or applied
31
4 Mapping national innovation strategies
4.4 The Republic of Korea
The Republic of Korea (henceforth Korea) is
the 12th largest economy in the world with
an estimated 2012 total national output of
USD1,540 billion measured on a PPP basis.74
However, measured on a GDP per head basis
Korea drops to 31st place with a per capita
income of USD22,590 for 2012 at current
USD.75 Korea is the world’s 25th most open
and competitive economy according to
the World Economic Forum 2013-14 Global
Competitiveness rankings.76
Korea has a number of government bodies
that oversee and direct national research and
innovation policies. The most important are
the Presidential Advisory Council on Science
& Technology and the National Science and
Technology Council. The latter has been the
highest decision-making body on innovation
and technology issues since the late 1990s.77
This National Science and Technology Council
is made up of five different committees, each
responsible for a specific aspect of national
innovation. Additionally, ministries with a
science and technology mandate have their
own advisory committees to help them
formulate policy.78
Government research institutes have been
critical in the development of the Korean
biotech sector as well as science and
technology industries in general in research in
the public sector. These are semi-autonomous
research centres established and funded
by the Government, yet independent, nongovernmental organisations. Even though their
position has been progressively challenged by
universities, these institutes were crucial in the
technological development of Korean industries
over the last four decades.79
32
The Korean Government began promoting
biotechnology in the 1980s. After establishing a
basic plan for the promotion of biotechnology
(Biotech 2000 in 1994) the Government
started to coordinate policies and expand its
investment in R&D.80
Korea has a number of specific biotech policies
in place. These range from direct support for
R&D activities, to biotech networks, technology
transfer and commercialisation bodies. Indeed,
the building of the Korean biotechnology
industry has benefited immensely from
government-backed initiatives through the
Law for the Creation and Promotion of the
Government Research Institutes enacted
in 1999. This program sought to promote
technology transfer and the commercialisation
of biotechnology through start-ups, venture
capital partnerships and spin-offs. As of August
2007, 1,386 ventures had been spun off from
these institutes and 482 from universities.81
The success of this initiative and of the Korean
biotechnology sector in general is reflected by
the 612 publications and 277 patents issued in
2012 alone.82
Korea is targeting the top biotech economies
through its Bio-Vision 2016 plan. By 2016,
Korea expects to move from 12th place to
7th worldwide in terms of science-technology
published papers, and from 15th to 7th
with regards to competiveness in patented
technology.83 Further, it seeks to increase its
biotech number of R&D manpower from 9,500
to 17,300, and the industrialized market value
of the biotechnology market from KRW2.7
trillion to KRW60 trillion.84 The Bio-Vision 2016 is
based on four main pillars: (1) achieving multiministerial coordination and an efficient budget
allocation system, (2) facilitating overall R&D
activities, (3) realigning industrial systems and
securing commercialization infrastructures, and
(4) acquiring social consent for safety ethics. 85
Building the Bioeconomy Examining National Biotechnology Industry Development Strategies
Below Table 5 provides an overview of the best
practices in place for the seven enabling factors.
It lists policy areas of best practice and areas
where there is still room for improvement. The
purpose of this table is to give readers a sense
for what policies are in place and some of the
outputs they have produced. A more detailed
discussion of the enabling factors is provided in
Appendix I.
Table 5: Enabling factors in Korea
Enabling factors
Success stories
Stumbling blocks
Human capital
• High level of tertiary education in population
• Only two universities in top 100 for life sciences
• Strong growth in life science graduates
since 2000
• High level of researchers as % of workforce
Infrastructure for R&D
• Highest level of R&D spending % of
GDP in OECD
• Outside top-10 in ranking of venture capital attractiveness
• High level of biotech R&D spending
• High level of clinical trials
Intellectual property
protection
Regulatory environment
• Strong IP environment
• Patent enforcement at borders can be challenging
• RDP available
• PTE available
• Data requirements for pharmaceutical patent applications
exceeds international best practices
• Biosimilar guidelines introduced in 2009
• Negative public attitudes towards GM foods
• Uncertainty over implementation of patent linkage
regulations
• Biopharmaceutical and biotech regulators
generally highly regarded
Technology transfer
frameworks
• High rates of tech transfer – Strong growth in
licensing income, patenting since 2000
• Licensing and royalty income still behind the US and
other high performing countries
• Comprehensive legal framework in place
• Number of government initiatives and
institutes in place to provide help
and support
Market and commercial
incentives
• High tech investment tax credits available
Legal certainty (including
the rule of law)
• Legal environment is generally considered
stable and certain
• Strict pricing and reimbursement policies in place with
annual price cuts
33
4 Mapping national innovation strategies
4.5 Russia
Russia is the 6th largest economy in the world
with an estimated 2012 total national output
of USD3.373 trillion measured on a PPP basis.86
However, measured on a GDP per head basis
Russia ranks near the bottom quarter of
countries worldwide with a per capita income of
USD14,037 for 2012 at current USD. 87
Looking at the competitiveness of the
economy, Russia trails many industrialized and
emerging economies at 64th place according
to the World Economic Forum 2013-14 Global
Competitiveness rankings.88 Recent figures on
GDP growth indicate a significant slow-down,
dropping from 3.4% in 2012 to 1.8% in 2013.89
Current international circumstances may have
a negative short- to mid-term impact on the
Russian economy.90
Since the financial crisis in 2008-9, the Russian
government has targeted innovation and the
development of its science and technology
capabilities as a main impetus behind
diversifying and modernizing the economy. The
government’s innovation strategy is focused
mainly on enhancing and transforming its
basic research capabilities into commercial
activities, both in traditionally strong fields
such as aerospace and nuclear energy as well
as new fields such as nanotechnology, medical
technologies and alternative fuels.91
The Ministry of Education and Science and
the Ministry of Economic Development are
the primary bodies charged with overseeing
new initiatives on innovation, supported
in specific areas and with distinct budgets
by several other entities. For example, the
President’s Commission for Modernization
and Technological Development and the
Parliamentary High Technology and Innovation
Commission are responsible for directing and
coordinating R&D policies, with several different
agencies controlling the actual allocation of
funding.92 Currently R&D mainly takes place in
public research institutions and state-owned
enterprises and the large majority of funding
has traditionally targeted these bodies, but in
the most recent initiatives enhancing academic
and private sector R&D has become a
major priority.93
34
The Strategy for Innovative Development of
the Russian Federation 2020 (2020 Strategy),
introduced in 2011, is the main document
guiding innovation policy in Russia today.94 The
2020 Strategy sets out several benchmarks and
targets in relation to science and technology
indicators including the development of
human capital and private sector innovation,
promoting of a favorable environment in the
public sector and building of international
science and technology cooperation.95 Under
the 2020 Strategy umbrella, the Development
of Science and Technology Program 2013-2020
is aimed at bolstering basic research capacities
and infrastructure needed across key sectors
and promoting applied research in cooperation
with industry through a combination of public
and private funding and fiscal incentives.96 The
measure was developed in cooperation with
academia and business representatives.
Biotechnology is one of the Russian
government’s strategic innovation priorities
under the 2020 Strategy. The State Coordination
Program for the Development of Biotechnology
(BIO 2020) and the Strategy of Development
of the Pharmaceutical and Medical Industries
(Pharma 2020) are among several policy
instruments aimed at building a bio-industry
in Russia, starting with creating the necessary
human and physical capital.97 The bulk
of the funding is aimed at the bioenergy,
biopharmaceuticals, agriculture and food
biotechnology and industrial biotechnology
fields, relying on a mix of government funding
and FDI.98 The field of biotechnology is also
a key focus in research programs of the
Russian Academy for Sciences, the Russian
Academy of Medical Sciences and the Russian
Agriculture Academy. In addition, state-owned
enterprise, Rusnano, focused on developing the
nanotechnology industry in Russia, co-finances
R&D projects and infrastructure building
including in the field of biotechnology.99
The Russian Foundation for Basic Research
provides direct grants to researchers and
scientists in basic research.100 The Foundation
for Assistance to Small Innovative Enterprises
provides grants and loans to innovative SMEs
seeking to commercialize basic research,
including in the seed and start-up phases.101
The Russian Foundation for Technological
Building the Bioeconomy Examining National Biotechnology Industry Development Strategies
Development also offers loans to public-private
ventures aimed at bringing to market new
technologies.102
Below Table 6 provides an overview of the best
practices in place for the seven enabling factors.
It lists policy areas of best practice and areas
where there is still room for improvement. The
purpose of this table is to give readers a sense
for what policies are in place and some of the
outputs they have produced. A more detailed
discussion of the enabling factors is provided in
Appendix I.
Table 6: Enabling factors in Russia
Enabling factors
Success stories
Stumbling blocks
Human capital
• Strong tertiary education enrolment
• University publications
• Relatively large research workforce
• Life sciences graduates and publications
• Development of ‘bio-clusters’ e.g. Skolkovo
Innovation Center
• Academic and private sector (not state-owned) R&D
• Wide range of tax incentives for
R&D companies
• Patenting activity by R&D entities
Infrastructure for R&D
Intellectual property
protection
• Expenditure on biotech R&D across all sectors
• FDI by research-based companies
• WTO member and TRIPS signatory
• Enforcement of biopharmaceutical patents
• Patents available for biologic compounds
• Implementation of RDP in relation to biologics
• RDP regime in place
Regulatory environment
• Ongoing process of GMP implementation
• Biopharmaceutical and biosimilars approval pathways
• Planned introduction of pathway for
domestic cultivation of GM crops
• Regulatory burden, i.e. local clinical trials, and
registration delays
• Proposed ban on all GM crops (locally produced
and imported)
Technology transfer
frameworks
• Framework and funding for university-private
sector spin-offs
• Patenting by individual universities and public
research organizations
• Funding for high-tech companiesuniversities’ shared R&D facilities
• Significant private sector efforts to link
research institutions with firms, e.g. Russian
Technology Transfer Network
Market and commercial
incentives
Legal certainty (including
the rule of law)
• Fiscal incentives for establishing
local presence
• Preferential treatment for locally manufactured products in
biopharmaceutical pricing and procurement policies
• Listing of biopharmaceutical products
on reimbursement list by brand name in
addition to generic name
• Unaccompanied by other framework conditions sufficient
to stimulate investment in production and R&D facilities
• Challenging environment
• Problem areas include corruption and availability of
legal redress
35
4 Mapping national innovation strategies
4.6 Singapore
Singapore is the 42nd largest economy in the
world with an estimated 2012 total national
output of USD323 billion measured on a PPP
basis.103 However, measured on a GDP per head
basis Singapore is one of the richest countries in
the world with a per capita income of USD51,709
for 2012 at current USD.104 Singapore is the
world’s second most open and competitive
economy according to the World Economic
Forum 2013-14 Global Competitiveness rankings
and has held this position for years.105
Singapore recognized the economic
significance of expanding and developing a
high tech R&D capacity in the late 1980s and
early 1990s. Through a number of initiatives
the Government targeted the development of
an R&D capability specific to high-technology
niches in order to promote the advancement
of Singapore to a level similar to more mature
economies.
Today the Ministry of Trade and Industry is
responsible for the coordination of science and
technology policies and for the formulation
of key economic policies. The Ministry has
three main statutory bodies focusing on the
implementation of science, technology and
innovation policies. The Economic Development
Board is the lead government agency that
promotes inward FDI and the promotion of
the knowledge-based industries. The board
focuses on raising the level of private-sector
R&D in Singapore by attracting multinational
companies to base their corporate R&D
activities there.106 A*STAR focuses on the
development of domestic R&D capabilities,
which includes the overseeing of public research
institutes. Under the A*STAR, the Bio-Medical
Research Council promotes R&D and develops
human capital in the life sciences, the Science
and Engineering Research Council promotes
similar outcomes but targets science and
engineering. A*STAR at present oversees 21
research institutes, centers and consortia.107
The Standard Productivity and Innovation Board
focuses on promoting entrepreneurship and
growth of SMEs through financing.
36
In terms of biotechnology and the biomedical
field the Biopolis initiative started in the early
2000s has fostered regular and engaging
public-private partnerships leading to
advanced R&D. Singapore is widely viewed as
having successfully developed a competitive
advantage in the sector of biomedical sciences
and accordingly has focused on this sector
to promote future growth. The Biomedical
Sciences Industry Partnership Office serves as
a contact point and acts to match companies’
R&D needs to expertise that can be found
in research hospitals, academic research
institutions and public research institutions in
Singapore.108 Singapore has developed worldclass R&D and manufacturing capabilities
and has seen tremendous growth in the
presence and investment by multinational,
research-based companies. Today a number of
products are manufactured for global markets
in Singapore with government estimates of
this manufacturing at circa SGD23 billion.109
Examples of biological products being
manufactured in Singapore include Roche’s
Lucentis, Avastin and Herceptin.110
Opposite Table 7 provides an overview of the
best practices in place for the seven enabling
factors. It lists policy areas of best practice and
areas where there is still room for improvement.
The purpose of this table is to give readers a
sense for what policies are in place and some
of the outputs they have produced. A more
detailed discussion of the enabling factors is
provided in Appendix I.
Building the Bioeconomy Examining National Biotechnology Industry Development Strategies
Table 7: Enabling factors in Singapore
Enabling factors
Success stories
Stumbling blocks
Human capital
• High ranking for National University
of Singapore
• Relatively low level of biotech patenting by National
University of Singapore compared to overall rankings
• High level of researchers as % of workforce
Infrastructure for R&D
• Well-developed biomedical R&D
infrastructure e.g. Biopolis
• Below OECD average on R&D spending as % of GDP
• High level of biomedical R&D spending
• High level of clinical trials
Intellectual property
protection
• Strong IP environment
• RDP available
• PTE available
Regulatory environment
• Biosimilar guidelines introduced in 2009
• Biopharmaceutical and biotech regulators
generally highly regarded
Technology transfer
frameworks
• High rates of tech transfer
Market and commercial
incentives
• Generous tax credits available for
qualifying R&D
Legal certainty (including
the rule of law)
• Legal environment is generally considered
stable and certain
• Innovative biopharma products are generally not
approved without prior approval in other jurisdictions
• Licensing income still behind top US institutions
• Government initiatives in place
e.g. Biomedical Sciences Industry
Partnership Office
37
4 Mapping national innovation strategies
4.7 Switzerland
Switzerland is the 29th largest economy
in the world with an estimated 2012 total
national output of USD426 billion measured
on a PPP basis.111 However, measured on
a GDP per head basis Switzerland is one
of the richest countries in the world with a
per capita income of USD78,295 for 2012 at
current USD.112 Switzerland is the world’s most
open and competitive economy according to
the World Economic Forum 2013-14 Global
Competitiveness rankings and has dominated
these rankings for years.113
Switzerland has a number of government bodies
that oversee and direct national research and
innovation policies. The Federal Department
of Home Affairs is responsible for the support
of basic research and higher education.114 It
has several agencies responsible for various
aspects of national innovation. For example, the
State Secretariat for Education and Research
is responsible for drafting policy in the areas
of science, research and universities.115 In
addition, there is the Swiss National Science
Foundation, the country’s biggest supporter
of basic research; the Board of the Federal
Institutes of Technology which oversees and
sets policy for federal institutes of technology;
and the national innovation promotion agency
KTI which is the main public funding source for
applied R&D. The KTI is of particular importance
as it backs and promotes joint R&D projects
between private and public sector institutes.
The quadrennial Education, Research and
Technology parliamentary bill outlines the
Swiss Governments’ blueprint and views
for innovation policy.116 This bill is produced
through a lengthy consultation and review
process involving all private industry and public
stakeholders.117 Indeed, Switzerland has a
tradition of close cooperation between industry
and private sector institutions with all of the
above public bodies in shaping and developing
national innovation policy.
38
In the biotechnology field Switzerland has a
number of specific policies in place. These
range from direct support for R&D activities,
to biotech networks, technology transfer and
commercialisation bodies as well as direct help
for start-ups from the federal government.
Indeed, the building of the Swiss biotechnology
industry has benefited immensely from
government-backed initiatives through the
National Sciences Foundation and its SPP
BioTech program launched in 1992. This
program sought to promote technology transfer
and the commercialisation of biotechnology
through start-ups, venture capital partnerships
and spin-offs.118 The success of this initiative and
of the Swiss biotechnology sector in general is
reflected in the increased number of patents
per capita. Since 2001 Switzerland has seen its
patents per capita increase by over 300%; far
higher than other top biotech countries.119
The Swiss National Science Foundation provides
direct grants to researchers and scientists in
basic research. The Commission for Technology
and Innovation – the federal body responsible
for innovation – provides direct assistance to
start-ups and small businesses. The Commission
assists with technology transfer and linking
universities and Swiss start-ups to promote and
commercialise new products and technologies.
Below Table 8 provides an overview of the best
practices in place for the seven enabling factors.
It lists policy areas of best practice and areas
where there is still room for improvement. The
purpose of this table is to give readers a sense
for what policies are in place and some of the
outputs they have produced. A more detailed
discussion of the enabling factors is provided in
Appendix I.
Building the Bioeconomy Examining National Biotechnology Industry Development Strategies
Table 8: Enabling factors in Switzerland
Enabling factors
Success stories
Stumbling blocks
Human capital
• High ranking for universities in life sciences –
2 in top 15
• Below OECD average on number of researchers in relation
to the total work force
• Doubling in no. of life science graduates
since 2000
Infrastructure for R&D
• High level of R&D spending as % of GDP
• Well-developed biomedical R&D
infrastructure
• Biomedical R&D spending concentrated in national giants
e.g. Novartis, Roche
• High level of biotech R&D – 13% of total
• High level of clinical trials
Intellectual property
protection
• Strong IP environment
• RDP available
• PTE available
Regulatory environment
• Biopharmaceutical regulators
highly regarded
• Since 2005 moratorium on the use of GM crops
Technology transfer
frameworks
• High rates of tech transfer
• Successful commercialization rates still behind US
Market and commercial
incentives
• Relatively relaxed P&R policies for non-basic
list pharmaceuticals
• Strict P&R policies for biopharmaceuticals on basic
insurance list
• Tax relief available for biofuels
• Limited amount of general R&D tax credits
Legal certainty (including
the rule of law)
• Number of government initiatives and
institutes in place to provide help and
support e.g. KTI
• Legal environment considered highly stable
and certain
39
4 Mapping national innovation strategies
4.8 United States
The United States is the world’s largest and most
dynamic economy. Even in light of the recent
financial crisis and recession, in which GDP fell
by close to 6%, the US is the biggest economy
in the world measured by total output. The
latest World Bank national accounts figures from
2012 show total US GDP at PPP just over USD16
trillion.120 The US is also one of the world’s richest
economies in terms of per capita income with
an estimated 2012 GDP per capita of USD51,749
per the World Bank.121 The US economy is also
one of the world’s most open and innovative.
The World Economic Forum’s 2013-14 Global
Competitiveness rankings ranked the US
economy as the fifth most competitive economy
in the world.122
The Federal Government under President
Obama has published a number of strategy
documents to promote long-term innovation
and strengthen the economy. They include
the 2009 document, A Strategy for American
Innovation: Driving Towards Sustainable Growth
and Quality Jobs, and the 2011 follow-up, A
Strategy for American Innovation: Securing
our Economic Growth and Prosperity. Both of
these include specific policies on encouraging
innovation in the fields of alternative energy,
basic research, ICT, health and education.
The first strategy document was released within
the first year of the Obama administration and
drew heavily on the American Recovery and
Reinvestment Act of 2009 and the President’s
first budget. Both the 2009 stimulus package
and budget contained substantial increases in
funding for health IT and biomedical research.123
Specifically, the stimulus, according to one
estimate, provided over USD150 billion in new
funds for health care.124 In terms of life sciences
innovation and research, USD19.2 billion of this
money was devoted to promote the use of
health information technology through direct
grants and financial incentives through Medicare
and Medicaid.125 In addition, the legislation
provided an additional USD10 billion (of which
USD8.2 billion was for direct research grants) to
the NIH.
40
The second document, released in February
2011, builds on the first strategy paper by
proposing both new policies as well as
expanding existing ones. For example, the
2011 patent reform (America Invents Act) was
part of the “New Initiatives” section.126 Aside
from these two quite recent documents, the US
Government has a long tradition of supporting
basic as well as applied research in the life
sciences and biotech field.
There are also state level initiatives that, while
not formally part of a national innovation
strategy, nevertheless contribute to the
strengths of the enabling categories and
to the overall capability to perform biotech
innovation. In some states, such as California
and Massachusetts, these efforts have been real
drivers in encouraging biotechnology innovation
(discussed in Appendix I).
With regards to biotechnology specific
innovation policies the most recent initiative is
the President’s National Bioeconomy Blueprint.
This document outlined a range of Federal
policy initiatives aimed at furthering the building
and development of the biotech sector in the
US. The document was organized around five
strategic objectives each of which included a
range of policies. Opposite Table 9 provides
an overview of the five objectives and the
major policy areas and/or policy changes each
addressed.
Opposite Table 10 provides an overview of the
best practices in place for the seven enabling
factors. It lists policy areas of best practice and
areas where there is still room for improvement.
The purpose of this table is to give readers a
sense for what policies are in place and some
of the outputs they have produced. A more
detailed discussion of the enabling factors is
provided in Appendix I.
Building the Bioeconomy Examining National Biotechnology Industry Development Strategies
Table 9: Summary, National Bioeconomy Blueprint127
Strategic Objective
Policy Examples
Support R&D investments that will provide
the foundation for the future bioeconomy
• Increased coordination and focus by federal agencies on strategic biotech R&D support
• Greater emphasis on developing foundational technologies
• Increased focus on promoting and supporting interdisciplinary research through NSF
and other federal bodies
• Use of creative research funding mechanisms such as prizes
Facilitate the transition of bioinventions
from research lab to market, including
an increased focus on translational and
regulatory sciences
• Strategic focus on translating basic research into commercialized products and services
• NIH work through National Center for Advancing Translational Sciences and FDA-NIH
partnership in research into regulatory sciences
• Greater focus by federal agencies in procuring bio-based products
• Improved technology transfer frameworks through the NIH, improvements to the Small
Business Innovation Research programs and tech transfer from Federal laboratories
Develop and reform regulations to
reduce barriers, increase the speed and
predictability of regulatory processes, and
reduce costs while protecting human and
environmental health
• FDA will reform drug and medical device regulatory framework
• Parallel review of new products and technologies by FDA and Centers for Medicare &
Medicaid Services
• USDA reform of regulatory review process
Update training programs and align
academic institution incentives with student
training for national workforce needs
• Increased focus by Federal Government through academic and jobs training programs
on specialized skills including life sciences, bioengineering and biotechnology
• Emphasis on job and careers preparation for life science graduates outside academia
Identify and support opportunities for the
development of public-private partnerships
and precompetitive collaborations – where
competitors pool resources, knowledge,
and expertise to learn from successes
and failures
• Increased emphasis on collaboration between public and private entities
• NIH will work with manufacturers and innovators to develop pharmaceutical compounds
not in use and using approved and existing therapies for new indications
• Public-private partnerships on variety of issues from standardization of protein
measurements to food security to development of a genetically modified sugar cane crop
Table 10: Enabling factors in the US
Enabling factors
Success stories
Stumbling blocks
Human capital
• Highest performing higher education system in the world
• Strongest human capital in life sciences in the world e.g. no.
of graduates, institutional rankings etc.
• Below highest performing countries on
number of researchers in relation to the
total work force
Infrastructure for R&D
• Largest absolute spender on R&D in the world
• State of the art biomedical R&D infrastructure
• Highest level of patenting in the world – general
and biotech
• Highest level of clinical trials in the world
• Level of R&D spending as % of GDP below
highest performing countries in OECD
Intellectual property
protection
• Strong IP environment
• RDP available
• PTE available
• Uncertainties over patentability of basic
biotech inventions e.g. 2013 Molecular
Pathology v Myriad Genetics and 2012
Prometheus Laboratories, Inc v Mayo
Collaborative Services
Regulatory environment
• Biopharmaceutical regulators highly regarded
• Coordinated Framework for Regulation of Biotechnology
viewed as successful in promoting biotech sector
• Long processing times at FDA and USDA
Technology transfer
frameworks
• Bayh-Dole framework widely viewed as successful in
promoting tech transfer
• Highest rates of licensing, patenting by universities in world
Market and commercial
incentives
• Relatively free market for pricing of pharmaceuticals
• R&D tax credits not permanent; currently
expired
Legal certainty (including
the rule of law)
• Legal environment considered stable and certain
• Ranked 19th on Rule of Law Index 2014
41
42
Building the Bioeconomy Examining National Biotechnology Industry Development Strategies
5
Recommendations
Creating an environment that promotes creativity, innovation and
actual real-life economic gains is not an easy task regardless which
sector or industry it is. It requires putting in place a host of enabling
factors at the general, more macro level, as well as those that are
more specific and targeted at the micro level. This is no different for
the biotechnology sector.
The purpose of this paper has been to give
an overview of some of the best practices in
place internationally that support and enhance
biotechnology inputs and outputs. The paper
has identified seven enabling factors ranging
from the institutional and eco-system level,
such as levels of tertiary education and IP
environment, to the more biotech specific, such
as what type of biomedical and biotech R&D
infrastructure does a country have in place
and availability of technology transfer laws and
mechanisms. Through mapping the policies,
factors and best practices that are in place in
each of the studied countries the paper has
provided an overview of which factors are in
place, examples of success stories and where
there have been stumbling blocks in each
country. It is important to reiterate that the
point of reference for this assessment is the
development of a globally competitive sector;
countries that wish only to develop a sector
that is nationally competitive could in principle
adopt a more protectionist set of policies. The
consequence of such a strategy would however
be to limit the ability of local players to succeed
in world markets.
For the sake of conciseness the preceding
sections have not included a detailed discussion
of each enabling factor. Instead, a deeper
discussion and analysis of all seven of the
enabling factors for each country included in
the study is provided below in Appendix I.
Based on the analysis and mapping of the
national innovation systems and biotechnology
policies and enabling factors in place in the
eight case study countries it is possible to piece
together six recommendations. They are:
1. Identify the biotechnology sector as an
area of strategic importance – Identifying
the biotechnology sector as an area of
strategic importance is the first step in
successfully building a national biotechnology
policy. By and large most countries studied in
this paper have directly or indirectly targeted
biotechnology as a technology and industry
of strategic importance to national economic
development and growth.
2. Create a national blueprint – The existence
and creation of a blueprint of national
biotechnology strategy can be a powerful
tool in creating a vision and setting a goal
for national aspirations. There are many
ways in which governments can provide
leadership and direction for the building of
a biotechnology capacity. In some countries
a more de-centralized, indirect approach
has proven to be effective, such as in the
US, whereas in others direct government
leadership has been instrumental in creating
the conditions for success. Examples include
Korea and, certainly in the ag-biotech and
biofuels sector, Brazil. Regardless of the
type of governmental leadership strong
governmental inter-agency and departmental
coordination is required.
3. Measure performance – The measuring of
performance of the biotechnology sector
in a transparent and systematic fashion is of
real importance to understanding progress
made challenges remaining in order to
allow for mid-course corrections that may
be necessary. This can be conducted either
through recurring government review or
independently through private, academic
and non-governmental actors.
43
5 Recommendations
4. Recognize and use existing best practices
– Although no two countries are the same
and all face different circumstances, countries
can learn from the experiences of each other.
International best practices should be shared
and repositories of information and resource
sharing are all positive and worthwhile
undertakings.
5. Leverage national capabilities –
Understanding and focusing on one’s
comparative and competitive advantage
can lead to the most effective allocation
of resources. Country size, scientific
and research strengths, geography and
biodiversity are all important attributes.
Some countries have natural strengths in
some biotech sectors whereas others can
compete and develop across the board.
44
6. Local and international cooperation –
Cooperation and partnerships between
public and private, national and international
stakeholders can be key in attracting
investment and building up a world-class
biotech industry. Singapore is a good
example of a country which by leveraging its
strengths and fully engaging in partnerships
between government and the multi-national
industry and between the public and private
sectors has been able to in a relatively short
time span build a cutting edge biomedical
and biotech R&D capacity.
Building the Bioeconomy Examining National Biotechnology Industry Development Strategies
I
Appendix I – Detailed discussion:
The enabling factors and country
case studies
Brazilian universities are not widely recognized
in general international rankings. No Brazilian
university is included on the 2013-14 Times
Higher Education rankings. However, looking
at the life sciences the University of São Paulo
is included in the top 100 at 93rd place.128 In
terms of academic and research publications,
Brazil has a relatively high number of scientific
and technical journal articles published. Data
from the World Bank shows that for the latest
available year (2009) 12,306 such articles were
published.129 This is an increase of almost 100%
since 2000 when 6,407 articles were published.
has seen a steady increase in the last decade.
In the latest year for which comparable data is
available (2011) Brazil had a total of 11 million
people in the age group 25-64 attaining some
level of tertiary education.130 As a percentage of
the total population in the age group 25-64 that
has attained some level of tertiary education,
this was a rate of 12%.131 This is higher than
that of China at 4% but behind that of Russia at
53%. Looking at number of researchers in the
population the latest (2010) data from the World
Bank shows that Brazil had 703 researchers per
million people.132 This is almost a doubling of
researchers since 2000 when the equivalent
figure per million population was 423. Other
economies, such as Russia, during the same
time period actually saw their number of
researchers shrink.
Examining the number of graduates in higher
education and number of researchers Brazil
In terms of promising policy initiatives relating
to the building of human capital Brazil in 2011
Brazil
Human capital
45
Appendix I – Detailed discussion: The enabling factors and country case studies
introduced an international student exchange
program Ciência sem Fronteiras (Science
Without Borders). This program seeks to:
• place Brazilian science and technology
students at international universities and
research institutions;
• attract foreign science and technology
students to study in Brazil;
• internationalize Brazilian higher education
institutions by promoting partnerships
and collaboration with institutions in other
countries; and
• promote the return of Brazilian scientists and
graduates to Brazil.133
Infrastructure for R&D
Brazil is a major investor in research and
development in Latin America. In 2011, Brazilian
gross domestic R&D spending totalled USD25.3
billion at PPP.134 Brazil also has a relatively
competitive level of R&D spending as a
percentage of GDP in comparison to other
BRICS and middle income countries. 2011
figures show R&D spending as a percentage
of GDP at 1.16%.135 This is lower than the OECD
average of 2.40%, but higher than Russia,
India and Poland and roughly on par with Italy
and Spain.136
Looking at rates of patenting Brazil is on
absolute and per capita terms not a prolific
patenting country. In 2010 residents of Brazil
were part of the filing of 0.56 patents under
the triadic patents family.137 Similarly, looking at
biotechnology patenting rates filed under
PCT Brazilian residents were part of 25.9 filings
in 2011.138
R&D infrastructure and capacity varies from
biotech to biotech sector. As explained,
while Brazil has traditional strengths in
biofuels and agricultural biotech it has a less
developed capacity in health biotech. For
example, EMBRAPA has through a number of
private-public partnerships developed and
brought to market new ag-biotech products
and technologies. In 2010, for instance, the
Cultivance-e soybean was approved for market
46
by CTNBio. This herbicide-tolerant soybean was
developed jointly by BASF and EMBRAPA in
Brazil all the way from the R&D and laboratory
stages to a commercial phase.139 Similarly for
biofuels BNDES and FINEP are supporting the
growth and development of the biofuels and
sugar-cane ethanol industry through the PAISS
plan, an initiative to develop second generation
bio-ethanol and new uses of sugarcane
biomass.140
These partnerships are also growing in
importance in the health biotech sector. For
example, BNDES has provided direct support
and grants for the building and development
of R&D and biotechnology manufacturing sites
with domestic as well as international private
sector partners. In 2013 BNDES in partnership
with Novartis began to build a biotechnology
plant in the Northeast of Brazil (Pernambuco).141
Although there are still challenges in translating
this support into concrete biopharmaceutical
products and fully commercialized technologies
(discussed below), nevertheless this is an area
of increasing prioritization for the Brazilian
Government. BNDES provides a significant
amount of funding for biomedical and
biopharmaceutical research, manufacturing and
innovation. The agency provides direct funding,
loans and seed capital. For example, under its
Profarma program (in 2013 the third phase of the
program was renewed) a BRL5 billion budget
has been allocated to the pharmaceutical health
sector till 2017.142 In 2013 the agency announced
the funding of a separate stream specifically
for biotechnology, Profarma-Biotechnology,
which will target health biotechnology and the
furthering of a domestic R&D capacity.143 FINEP
is also a major provider of research grants to
biotech companies and has been providing
support for the biotech sector since 2001.144
Through the INOVAR program it also acts as
a source of venture capital, seed and private
equity capital.145
Brazilian biotech companies appear to be
welcoming this support but are also asking
for important changes in program rules.
For example, in a 2008 survey by Nature
Biotechnology support from government
agencies and development banks such as
BNDES and FINEP was significant with over
half of the firms surveyed citing them as
Building the Bioeconomy Examining National Biotechnology Industry Development Strategies
major funding sources.146 Although reliant
on these sources of funding a number of the
firms surveyed pointed to some challenges
in accepting this funding. In particular, they
cited requirements to seek approval for the
licensing of a technology developed through
partial funding from the funding agency and
the conditioning of funding on the work being
carried out in Brazil even though the technical
capacity may not always be present.147
With regards to clinical trials although the
total number of trials in Brazil is relatively high
with currently 3,804 trials being conducted in
Brazil out of a regional total of 5,606 in Latin
America, Brazil is still behind other markets
on an absolute and per capita basis.148 Overall
the clinical trials environment is challenging
and clinical research in Brazil is below levels
expected. Brazil has less than 2% of the clinical
centers in the world performing research and
according to local scientists and clinicians it is
losing potential trials to other countries due
to its regulatory requirements.149 Approval
for clinical research needs to go through
two separate bodies (CONEP, the National
Commission for Ethics in Research, and ANVISA)
and can stretch to over one year compared to
three months in the US and EU.150
Intellectual property protection
The protection and enforcement of intellectual
property rights in Brazil is challenging,
particularly in the biopharmaceutical space.
Brazil is a signatory of the TRIPS agreement
and provides standard 20 year patent
protection. Brazil also has a 10 year minimum
patent term. However, ANVISA has the right
to provide prior consent to pharmaceutical
patents that are being examined by the INPI.
Consequently, decisions on whether to grant
a pharmaceutical patent are not solely based
on the examination by patent specialists and
officials at INPI, but also by ANVISA. Brazil also
does not allow patents for secondary claims
for novel uses. With regards to biotechnology
patentability rules for biotech are narrow
by international comparisons. For example,
fundamental research areas in industrial
and environmental biotech such as isolated
microorganisms (including bacteria and yeast)
are not patentable.151 Existing patent law only
allows patents for transgenic microorganisms
even though the use of all microorganisms in
biotech R&D is increasing and leading to new
innovations.152
Unlike many OECD economies and a growing
number of middle income countries Brazil
only provides regulatory data protection of
submitted clinical test data for fertilizers,
agrochemical products, and pharmaceuticals for
veterinary use. Pharmaceuticals for human use
are not covered by existing regulations.
The regulatory environment
Biotechnology in Brazil is regulated primarily by
ANVISA and CTNBio. ANVISA is responsible for
the regulation of biologics as well as biosimilars
(a pathway was introduced in 2010/11).153 CTNBio
is responsible for the regulation of all activities
(including research and commercialization) of
biotech and GM products or technologies.154
With regards to the processing of patent
applications the INPI continues to have a large
backlog of patents (estimated at 8-10 years) and
processing times are quite long.155
Technology transfer
Brazil has a number of policies and regulations
in place to promote the transfer of technology.
For instance, a key tenet of the 2004 Innovation
Law was to encourage the transfer and
commercialization of technologies through
incubation services for public researchers and
greater encouragement of start-up activities.156
The law provides incentives including royalty
guarantees to inventors. Since 2004 and
passage of the law Brazilian universities have
increased both their patenting and licensing
activities. Although by international comparison
still quite limited, there has been growth in the
use of IPRs by Brazilian universities and public
research bodies. For example, between 2000
and 2007 patenting by universities more than
quintupled, from 60 patents to 325.157 During the
same time period, patenting by public research
organizations increased from 20 to 39. Similarly,
a 2011 survey of 7 universities in Brazil found
that patenting, licensing and collaboration was
taking place between universities and industry
but that this was still at an incipient stage.158
47
Appendix I – Detailed discussion: The enabling factors and country case studies
Still, there are regulatory and formal
requirements in place that limit the
attractiveness of licensing. For example, to
become effective and binding on third parties
licensing agreements must be published in
the INPI’s Official Gazette.159 Agreements must
also be approved by INPI. In addition, there are
limitations on feeds and payments between
the contracting parties.160 Exclusive licensing
agreements are also subject to more onerous
publication requirements than non-exclusive
licenses making this process more timeconsuming.161
Market and commercial incentives
With regards to the biopharmaceutical market
relatively strict price controls are in place. IRP
is used extensively and is calculated on the
lowest average ex-manufacturing price of
the biopharmaceutical product in a basket of
countries. Countries included in the basket are
Australia, Canada, Spain, US, France, Greece,
Italy, New Zealand and Portugal as well as the
country of origin of the drug. In addition, there
is a separate price calculation for “exceptional
medicines” to which a “Coefficient Adequacy
Price” (Coeficiente de Adequação de Preço)
or CAP is applied.162 The CAP is calculated
comparing Brazil’s GDP with the GDP of the
selected reference country. CAP calculation can
be applied when the product being priced is
not on the market in at least 3 countries in the
IRP basket.
Brazil has R&D tax credits in place under Law
No. 11.196. These include a potential 60%
deduction on corporation tax liability and
social contributions.163 This deduction can also
escalate if there is a year-on-year cumulative
increase in R&D spending. There is an additional
20% deduction provided once an invention has
been patented. However, this is available only
once a patent has been issued.
Brazil also has in place policies and laws
encouraging local manufacturing in a number
of industries including biopharmaceuticals.
The 2010 law 12,349 established preferences
for businesses producing goods in Brazil with
a local preference margin of up to 25% over an
equivalent bid from an importing company.164
As part of the Brasil Maior initiative these
48
preference margins were extended to the
pharmaceutical industry in 2012 under decrees
7709 and 7713 with margins ranging from 8 or
20 percent.165
Legal certainty (including the rule of law)
The Brazilian judiciary is independent although
the courts are overburdened and the resolution
of contract disputes can be a lengthy process.166
These challenges are reflected in Brazil’s ranking
on international indices measuring the rule of
law. For example, in the 2014 Rule of Law Index
Brazil ranked 42nd out of 99 countries mapped.167
A major anti-corruption law came into effect in
2014 and although the effects remain uncertain
it is regarded as having the potential to improve
the legal and business environment in Brazil.168
China
Human capital
Chinese universities are becoming more
competitive internationally. In the 2013-14 Times
Higher Education rankings Peking University is
ranked 45th overall and Tsinghua University is
ranked 50th.169 Looking at academic and
research publications, China has a high number
of scientific and technical journal articles
published. Data from the World Bank shows that
for the latest available year (2009) over 74,000
articles were published.170 This is almost a fourfold increase since 2000 when 18,478 articles
were published.
The past decade China has seen tremendous
growth in the number of university graduates
particularly in science and engineering. The
total number of natural science and engineering
graduates has jumped from just under 240,000
in 1998 to over 1.1million in 2010 and China
produces by far the greatest absolute number
of these graduates in the world.171 China also
produces a very high number of doctoral
degrees in science and engineering. In 2010 this
was close to 31,000 degrees with only the US, at
just over 33,000, having a higher rate.172
Similarly, a growing share of China’s workforce
consists of researchers. Looking at the number
Building the Bioeconomy Examining National Biotechnology Industry Development Strategies
of researchers in the population the latest (2010)
data from the World Bank shows that China had
863 researchers per million people.173 This is an
increase of close to 60% since 2000 when the
equivalent figure per million population was 547.
Infrastructure for R&D
China is a leading investor in research and
development. In 2008, gross domestic R&D
spending totalled USD208 billion at PPP.174 In
absolute terms this is the second highest level in
the world behind only the US. As a percentage
of GDP R&D spending in China is quite high
compared to other countries. 2012 figures show
R&D spending as a percentage of GDP at 1.98%,
which is greater than many higher income
countries such as Spain (1.30%) and the UK
(1.72%) as well as the estimated EU28 average
(1.97%).175 Chinese R&D spending is largely made
up of industry spending. The latest data from
2012 show industry expenditure on R&D at 74%
of the national total.176
Chinese patenting activity has grown
tremendously in the past decades. Looking
at high-quality patents filed under triadic
patenting, the Chinese share of the global total
is 2.13% at 2011 figures.177 This is a significant
increase from levels in 2000 when China had a
global share of 0.16%. Looking at biotechnology
patents China is now one of the top patenting
countries in the world. In 2011 the number of
patents filed by Chinese residents under the
PCT was 443.178
China’s biomedical and biotech R&D capabilities
have expanded and are increasing by the year.
For example, in the biopharmaceutical space
a growing number of multinational innovators
are conducting R&D and investing in R&D
facilities in China.179 Still, despite this growing
investment and the obvious appeal of the
Chinese biopharmaceutical and biotech market
significant challenges remain in the available
infrastructure and incentives to conduct
research. In particular there are barriers in the
regulatory, market and commercial environment
which are detailed below.180 This is reflected in
the number of clinical trials conducted in China
which is on an absolute and per capita basis
small. China currently has 4,793 registered trials
in operation.181
In terms of direct government funding for
science and technology 2012 figures show that
central government spending was just over
USD36 billion.182 However, of this less than
15% went towards basic research.183 Indeed,
compared with more mature markets China
spends proportionately less of its total R&D
budget on research and translational research.
Estimates by Battelle and R&D Magazine
suggest that funding for basic and applied
research is less than a quarter of total R&D
spending. In contrast in Europe and the US the
proportion is well over a third of the total.184
Intellectual property protection
Although improving, the protection of IP and
enforcement of IPRs in China has long been a
challenge to innovators. In particular, while
China has some of the legal and regulatory
framework to protect IP, the enforcement of IPRs
has long been difficult with the counterfeiting of
goods (including pharmaceuticals) rife.
As a WTO member China offers standard 20 year
patent protection. However, while this protection
has been available for biopharmaceuticals
the patent examination practice and basis for
awarding patents has been out of line with
international best practices. First, with regards
to biologics the scope of patent protection is
narrower in China than in other countries. As a
result, it is possible to gain patent protection
for only small changes to protein sequences
which in other jurisdictions would not be
granted.185 Second, patent examiners commonly
require a significant amount of biological data,
with examinations often ending in the denial
of patents for pharmaceutical products and
technologies that have been granted in other
jurisdictions. Recent steps, including a change
in the interpretation of patent examination
guidelines to allow for supplementation of data
during patent prosecution, may help resolve this.
Under its WTO commitments and article 35
of the regulations implementing the Drug
Administration Law China offers regulatory data
protection for submitted test and clinical data
for pharmaceutical or agricultural chemical
products which utilize new chemical entities.
However, it is not clear whether this period of
exclusivity also applies to biologics.186
49
Appendix I – Detailed discussion: The enabling factors and country case studies
The regulatory environment
China’s regulatory capabilities are expanding
and evolving although a number of challenges
remain for all biotech sectors. For example,
in the biopharmaceutical space the Chinese
drug regulatory authority, the SFDA, has by
comparison to many middle income countries
a relatively elaborate and detailed regulatory
structure in place.187 Still, a number of barriers
remain. First, there is currently no biosimilar
pathway in China.188 Existing regulatory
requirements do not consistently condition
marketing approval on the submission of
complete clinical trials test data showing
biosimilarity.189 Consequently, the regulation
of non-innovative biologics is not in line with
international best practices. Second, current
regulatory requirements and procedures for
clinical trials are by international comparisons
onerous and delay product registration.
Finally, there are also challenges in existing
pharmacovigilance programs with reporting
requirements for ADRs by manufacturers being
an area in need of reform and enforcement.190
With regards to agricultural biotechnology
the Ministry of Agriculture and the National
Biosafety Committee are responsible for the
regulation and approval of imported agricultural
GM products and/or the domestic production of
GM products in China.191 However, for this sector
there are a number of regulatory related barriers
to market entry. They include: the requirement
that a product must be registered and approved
in the country of export prior to an application
for approval can be made in China; and a
requirement that import applications include
viable seeds.192 The latter requirement has raised
concerns among manufacturers about the
protection of their IP.193
Finally and more broadly, since the mid-2000s,
China has introduced and implemented a range
of policies making access to the Chinese market
conditional on the sharing of technology and IP
with domestic entities. These policies include
the transfer of proprietary technologies in
procurement, joint ventures, and standardization
processes; local manufacturing requirements;
and limitations on investment by foreign entities,
without guarantee they will be protected
from unauthorized disclosure, duplication,
50
distribution, and use. Although some policies
have been revoked at the central level at the
provincial and local level these policies are still
in place and continue to be introduced.
Technology transfer
With regards to technology transfer and IP
commercialization, Chinese universities have
been encouraged since the mid-1980s to
manage and use inventions produced by their
researchers, although formal ownership was
retained by the state. This was changed through
a number of reform initiatives culminating
in the 2002 “Opinion on Exerting the Role
of Universities in Science and Technological
Innovation”.194 Combined with the overall growth
and development of the Chinese economy, the
result of this relative freedom for universities and
researchers to pursue commercial ventures has
been a sharp increase in university patenting,
patent and technology transfers and number
of spin-offs. University patenting has increased
dramatically and been a major contributor to
China’s rise as one of the world’s top patenting
nations. In 2006, resident university patent
applications totaled 17,312, representing just
under 15% of total resident applications.195 Since
2000, university patenting has increased by
almost 50% per year. Technology transfer has
also increased. The number of patent transfers
rose from 298 in 1999 to 532 in 2002. During the
same period technology transfers also increased
from about 4,000 to 5,600.196 In addition,
university spin-offs have increased in large
part due to an incentive structure that allows
researchers to retain at least 50% of income from
commercialized technologies.197
Nevertheless there remain important challenges.
First, many Chinese universities and research
institutes have explicitly had a policy of
promotion and evaluation based in part on
number of patent applications. According to
some studies patenting has become a substitute
for peer-reviewed publications.198 Second, there
is still a lack of experience and tradition with
regards to commercialization activities especially
in the life sciences. According to industry
sources Chinese universities and research
institutions (with a few exceptions) do not have
the institutional and professional experience to
fully commercialise their research.199
Building the Bioeconomy Examining National Biotechnology Industry Development Strategies
Market and commercial incentives
With regards to the biopharmaceutical market
relatively strict reimbursement policies have
limited the number of biological drugs available
on the market. For example, the National
Reimbursement Drug List does not include
any monoclonal antibodies (used for example
in cancer treatment) and there is also limited
availability on provincial drugs lists.200
More generally, China does have a number of
tax incentives in place to encourage R&D and
high technology manufacturing. For example,
since 2010 a R&D tax credit is in place and
special, reduced rates of corporation tax and
VAT are available for qualifying high-technology
enterprises.201
Legal certainty (including the rule of law)
The Chinese legal environment can be
challenging generally and for specific industries
and sectors. Legal redress, enforcement of
contracts and administrative justice can be
difficult and inconsistently available or applied.
In the 2013-14 Global Rule of Law Index China
was ranked 76th out of 99 countries.
from the World Bank (2005) show that India
had 135 researchers per million population.206
This is the lowest rate among the BRICS and
significantly behind other developed OECD
economies.
Infrastructure for R&D
On an absolute basis India is a relatively big
investor in research and development on
par with spending in Italy, Spain, Brazil and
Canada.207 In 2007 Indian gross domestic
R&D spending totalled USD24.3billion at
PPP.208 However, on a per capita basis and as
a percentage of GDP Indian R&D spending is
low. 2007 figures show total R&D expenditure
at 0.76% of GDP.209 This is significantly behind
the other BRIC economies and mature OECD
economies. Moreover, the majority of this
R&D is government funded at 66% which is
the inverse to spending patterns in other
countries.210
Human capital
Looking at rates of general as well as
biotechnology specific patenting as an indicator
of R&D activity, India is more competitive
in some areas than others. For example,
examining high-quality patents filed under
triadic patenting, Indian residents filed 27 such
patents in 2010 out of a global total of 3,017.211
In the biotechnology field Indian inventors filed
70 patents under the PCT route in 2011 which
compares favorably with both Russia
and Brazil.212
Indian universities are not part of the top
ranked universities in the world. For example,
in the 2013-14 Times Higher Education
rankings no Indian university is ranked in the
top 200 universities generally or in the top
100 universities for life sciences.202 Looking at
academic publications India is ranked 11th on
the total number of academic papers published
in Thomson Reuters-indexed journals from
January 2001 through August 31, 2011.203
However, looking at citations per paper – which
implies impact of academic work – India is
ranked outside of the top 20 with 5.9 citations
per paper.204
In terms of biotech infrastructure and R&D
capacity, the Department of Biotechnology
has through its policy initiatives expanded
and increased India’s biotech capacity and
infrastructure. For example, through the
Biotechnology Industry Partnership Programme
partnerships have been developed and
agreements signed with close to 100 companies
with a budget of INR8 billion (797 crore).213
Similarly, the Small Business Innovation
Research Initiative provides grants to SMEs with
134 such projects being funded since 2007.214 In
both these programs the private sector financial
contribution has been significant.
In terms of number of researchers per million
population India is not a top performer.205 There
is a paucity of data but the most recent figures
However, while these initiatives are promising
they are still quite small. Relatively speaking
India does not have an advanced R&D
India
51
Appendix I – Detailed discussion: The enabling factors and country case studies
infrastructure and does not attract the type
of investment required to build this capacity.
Looking for example at biopharmaceutical
investment and R&D funding by multinationals,
the percentage of R&D budgets being
spent in India is small. In 2010 India attracted
USD0.7 billion in pharmaceutical R&D and
USD0.8 billion in 2011.215 The main investors in
biopharmaceutical R&D in India are domestic
generic companies. However, a significant
proportion of their investments are not in
developing new innovative products and
technologies but on developing generic
drugs.216
Similarly, when looking more specifically at the
advanced manufacturing and R&D facilities
required for biologics, the latest survey
evidence suggests that India’s attractiveness
has dropped since 2012.217 Levels of clinical
trials are also quite low on both a relative
and absolute basis. As of 2014 2,407 clinical
trials were being conducted in India.218 This is
behind all other BRICS as well as more mature
economies such as Korea.
Intellectual property protection
The protection of IP and enforcement of
IPRs in India has long been a challenge to
innovators. Although India provides standard
patent protection under TRIPS recent policies
have undermined the actual availability of this
protection. For example, patent protection in
India has not been awarded to products that
enjoy protection in most countries around the
world. At the time the Indian Supreme Court
denied a patent for Novartis’ Glivec, the drug
enjoyed patent protection in nearly 40 countries
including other BRICS like China and Russia.219
Indian patent law has in place an additional
requirement to the international norms of
patentability that goes beyond the required
novelty, inventive step and industrial
applicability requirements. Under Section 3(d)
of the Indian Patent Act, there is an additional
“fourth hurdle” with regards to inventive step
and enhanced efficacy that limits patentability
for certain types of pharmaceutical inventions
and chemical compounds. This has led to
a number of patent revocations in recent
years. India has also made use of the threat
52
and actual issuing of compulsory licenses
for biopharmaceutical products. Since 2006
India has been involved in almost half of all
major international CL disputes. In 2012 Bayer
was instructed by the Indian patent office to
agree to have Bayer’s cancer drug, Nexavar,
duplicated by a local generic company through
a CL. With regards to patent revocations Roche
in 2012 had its patent for the hepatitis C drug,
Pegasys, retracted by the Intellectual Property
Appellate Board of India due to a simple
design that could be copied rather easily by
competitors. Similarly, the Delhi Patent Office
also revoked the patent for the drug Sutent in
2012. This revocation was in response to a postgrant opposition and based on an alleged lack
of inventive step. The drug is currently under
patent in the US.220
Furthermore, India does not offer regulatory
data protection for clinical test data submitted
during market authorization applications.
With regards to ag-biotech India’s current
legal framework on the protection of plant
varieties differs from international best
practices as found with the International
Union for the Protection of New Varieties of
Plants. Specifically, requirements relating to
the submission process, compulsory deposit
of parental lines to a public gene bank,
and potential claims of benefit sharing and
compensation if crop performance is less than
expected make this framework less attractive
than in other countries.221
The regulatory environment
India’s regulatory environment faces a
number of critical challenges, to begin
with biopharmaceuticals. To begin with
biopharmaceuticals. The availability of
counterfeit and substandard medicines is by
many estimates the highest in the world. For
instance, in 2008 the OECD estimated that 75%
of the world’s total supply of counterfeited and/
or substandard drugs came from India.222 Indian
drug regulations have not been developed
in a centralized and deliberate fashion. There
exists no equivalent to the Chinese SFDA, the
US FDA or the EU’s EMA. Instead, authority
over medicines and pharmaceutical drugs is
spread out over various layers of the Indian
Building the Bioeconomy Examining National Biotechnology Industry Development Strategies
central government and state governments.
On many critical issues of quality and safety
regulations, there is divided authority between
Central Government and the governments
of individual Indian States. For example,
while the CSDC is charged with laying down
standards of drugs and approving new drugs,
State governments have the responsibility for
approving drug formulations. That is, State
governments approve what substances (for
example, excipients in generic drugs) go into
the manufacturing process and medicines.
Similarly, while the central authorities are
responsible for regulating clinical research
and the testing of drugs in Central Drug Labs,
they are only in charge of approving licenses
for the manufacture of specific categories of
drugs: blood banks, large volume parenterals
and vaccine and sera. State governments
hold responsibility for, firstly, the majority of
licensing of drug manufacturing and sales;
secondly, licensing drug testing laboratories;
and, finally, pre- and post- licensing inspection.
State governments have the ultimate
responsibility when it comes to ensuring that
good GMP practices and safety and quality
procedures are in place and are being followed
by manufacturers, sellers and distributors of
medicines and pharmaceuticals. While some
state governments have good inspection
methods and rates, others do not. Standards
invariably vary and with it the quality and safety
of medicines in India.223
With regards to agricultural biotechnology
the current regulatory structure involves
both central government institutions and
state governments.224 At the central level the
Genetic Engineering Appraisal Committee is
responsible for product approval for imports of
biotech products and commercialization. State
governments are involved in the regulation of
field trials in their respective states by the need
to consent to trials taking place. Since 2011 no
applications for field trials or commercialization
have been approved by the Genetic
Engineering Appraisal Committee. Attempts
have been made to create a centralized
biotechnology and biosafety authority replacing
the existing structure. This was first pronounced
in the 2007 National Biotechnology Plan and
was reiterated in the draft 2014 plan.225
India introduced biosimilar guidelines in 2012.
These guidelines incorporate elements of the
pathways in place in the US and EU. However,
a key difference is the lack of market exclusivity
provided through regulatory data protection.226
Moreover, prior to the publication of these
guidelines India had approved a number of noninnovative biologics under its old regulatory
structure.227
Technology transfer
Technology transfer in India is still in many
respects at the early stages. While universities
and public research organizations are much
more prolific than they were in the past,
the successful transfer of technologies is
still relatively low. For example, measured
by university patent applications under the
PCT by a range of middle- and low-income
countries between 1980 and 2010, India had
a share of 7%.228 This puts India in third place,
just behind Brazil at 8%, but far below China,
which dominates patenting by middle- and
low-income countries at 64% of the total.229
However, with regard to public research
organizations, India is much closer to China’s
share, measured as a percentage of the total
PCT university patent applications for lowand middle-income countries. Between 1980
and 2010, India had a share of 36%, just under
China’s 41%.230 The majority of these patent
applications were tied to just one organization:
the Council of Scientific and Industrial Research.
This Council was the largest domestic patentee
and has since the early 1990s accounted for 80%
of public sector patents.231
As these figures suggest, technology transfer
and university patenting rates are still relatively
low. Indeed, very few Indian universities have
functioning TTOs. The institutions with the
most advanced and developed technology
transfer capabilities are the Indian Institutes
for Technology. The institutes in Madras
and Mumbai have technology and startup incubators in place and have produced
a growing number of start-ups in the past
few years.232 To encourage greater rates of
technology transfer and commercialization India
has since the mid-2000s explored developing
its own private-public technology transfer
framework, the Protection and Utilisation
53
Appendix I – Detailed discussion: The enabling factors and country case studies
of Public Funded Intellectual Property Bill,
introduced in 2008.233 Although a step in
the right direction the draft bill contained a
number of potentially challenging aspects.
This includes uncertainties over ownership
of the IP generated and the Government’s
ability to refuse title to the IP on grounds
of a “public interest” case which was not
adequately defined.234 The bill was reported
out of committee in 2010, but actual legislation
is still not in place. In fact introduction and
passage of the bill and corresponding
legislation is included in the draft 2014 National
Biotechnology Plan.235
Market and commercial incentives
With regards to the biopharmaceutical market
relatively strict price controls are in place for
drugs and pharmaceuticals available through
the National List of Essential Medicines. New
price calculations through a Drug (Prices
Control) Order were released by the National
Pharmaceutical Pricing Authority in May 2013.236
These calculations expand the number of
biopharmaceuticals subject to price controls
to 652.237
Legal certainty (including the rule of law)
The Indian legal environment presents a number
of challenges. Legal redress, enforcement of
contracts and administrative justice are not
always available or consistently applied. In
the 2013-14 Global Rule of Law Index India
was ranked 66th out of 99 countries. A widespanning anti-corruption law, the Lokpal Act,
was passed in 2013 with high hopes for reducing
corruption and graft.238
Korea
Human capital
Korean universities are relatively well regarded,
particularly in the biomedical and life science
fields. For example, in the Times Higher
Education rankings the Seoul National University
and the Pohang University of Science and
Technology (Postech) are respectively ranked
80th and 83th in the life sciences ranking.239 As
54
a percentage of the total population in the age
group 25-64 that has attained some level of
tertiary education, Korea had a 2011 rate of 40%
which is above the OECD average of 32%.240 In
terms of the life sciences, Korea had 12,466 life
sciences graduates in 2011 which is an increase
of 136% since 2000.241
In terms of number of researchers in full-time
equivalent Korea had 288,901 in 2011 the latest
year for which OECD figures are available.242
Looking at the number of researchers in relation
to the total work force, Korea was ahead of the
OECD average of 7.7. In 2011 Korea had 11.9
total researchers in full-time equivalent per
thousand of total employment.243
Infrastructure for R&D
Korea is a leading investor in research and
development. In 2011, Korean gross domestic
R&D spending totalled roughly USD60 billion at
PPP.244 In absolute terms this represents a worldleading number (5th place). When measured
as a percentage of GDP 2012 figures show
R&D spending at 4.36%.245 This is the highest
figure in the OECD.246 Korean R&D spending is
largely made up of private sector and industry
spending. The latest data from 2011 show
industry expenditure on R&D at 74% of the
national total.247 Biotech R&D accounted for
2.72% of overall industry R&D spending.248
Korea has quite advanced medical and
biomedical research facilities. As mentioned,
two of its life science and medical universities
are ranked in the global top-100. Also indicative
of the competitive clinical environment is the
high level of clinical trials. Korea currently has
5,241 clinical trials in operation.249
Korean patenting activity is substantially higher
than other larger countries. Looking at highquality patents filed under triadic patenting,
the Korean share of the global total is 4.00% at
2011 figures.250 More significantly, Koreans have
a high level of patenting intensity: between
2007 and 2009 40 patents were filed per
million people.251 This was slightly above the
average rate of 38 in the OECD. With regards
to biotechnology patenting activity in 2011 the
number of patents filed by Korean residents
under the PCT was 477.252
Building the Bioeconomy Examining National Biotechnology Industry Development Strategies
Pharmaceutical research by the Korean
pharmaceutical industry made up 2.26% of total
R&D expenditure at KRW863 million in 2011.253
The share of biopharmaceutical products as a
total percentage of pharmaceuticals went up
from 6.5% in 2007 to 9.3% in 2010.254 In 2009, it
was estimated that there were more than 600
biotechnology companies in Korea. Of these,
61% operate in biopharmaceuticals with the
remaining being dedicated to areas such as
bio-foods, bio-chemicals, bio-environments,
bio-energy and resources, bio-process and
bio-equipment, and bio-electronics and bioinformatics.255
Biotech R&D is receiving a huge boost from
the 2010 “Life Industry 2020 Development
Strategy”. Under this program the Korean
Government will invest approximately
USD6.5 billion over 10 years in building up life
sciences infrastructure.256
Venture capital in Korea is relatively wellestablished. In particular, the percentage of
GDP going to both early and late stage venture
capital investment was one of the highest in
the world at 0.054% of GDP in 2011.257 However,
Korea could be more attractive as a VC
market. According to the IESE 2013 VC and
PE Attractiveness Index, Korea is outside the
top-10 in the world (ranked 15th).258
Intellectual property protection
Overall, Korea has a strong system of protecting
IP and enforcing IPRs. Korea provides a
standard 20 year term of protection for patents
as well as a 5 year term of patent restoration
for pharmaceuticals. In conjunction with the
US-Korea Free Trade Agreement, Korea also
introduced a 5 year regulatory data protection
period similar to that in the US.
Korea introduced legislation relating to
the development of orphan drugs in 2003.
Incentives include marketing rights for 6 years
and nationally funded research programs along
with support from the Ministry of Family Affairs,
Health and Welfare and the Korean Centers
for Disease Control and Prevention to
encourage the research and development of
orphan drugs.259
Still, there remain some important challenges.
For example, with regards to biopharmaceutical
patents Korean patent law and examiners require
vast amounts of pharmacological data to be
submitted in the original patent application, not,
as is the more common international practice,
of submitting such data during either patent
prosecution or post-grant validity proceedings.260
There also remains uncertainty over the
implementation of the patent linkage system
agreed between the US and Korea. Specifically,
the requirements on innovators to provide
lengthy descriptions of the patent and patent
claims in question raises uncertainty for
innovators and generics alike.261
Finally, there are some challenges with regards
to the enforcement of IPRs, particularly patent
rights. For example, rights-holders cannot
apply directly to Korean customs authorities for
the suspension of suspected patent infringing
goods entering Korea as they can with copyright
and trademark infringing goods. Instead, an
application must be lodged with the Korean
Trade Commission which can order a suspension.
Evidence suggests that the Commission has
investigated relatively few such applications
and that, consequently, the patent enforcement
environment in Korea could be improved.262
The regulatory environment
Korea has a relatively strong clinical and
regulatory environment. For biopharmaceuticals
the Ministry of Food and Drug Safety (formerly
the Korean Food and Drug Administration) is
responsible for the authorisation and safety
supervision of pharmaceuticals. The agency is
highly regarded internationally and has been
recently praised by the FDA.263 Korea introduced
a biosimilar pathway in 2009.
Korea has ratified the Cartagena Protocol on
Biosafety in 2007 and implemented this through
the Living Modified Organism Act in 2008.
Imports of biotech grains as well as genetically
engineered animals are regulated under this
Act. Korea does not commercially produce any
biotech crops and most research is still at the
laboratory stage.264 Further, commercialization
is expected to take some extra time, as it will be
entirely dependent on getting Korean farmers
55
Appendix I – Detailed discussion: The enabling factors and country case studies
to first recognize the benefits and adopt this
technology.265 Public attitudes towards biotech
are somewhat contradictory. The public
is favourable to the use of biotechnology
in human and animal research and in the
treatment of disease, while they tend to have
negative views towards the use of biotech in
the production of food. As a consequence, the
majority of public funding for biotechnology
R&D is directed towards non-agricultural
projects in the fields of biomedicine, stem cell
research, cloning, and gene therapy.266
Technology transfer
Korea early on recognized the importance of
closer working relations between universities
and businesses in building an innovation and
knowledge based economy. The legislative
framework has been changed, with new laws
and regulations introduced to encourage
technology transfer, commercialization
and collaboration between universities
and businesses.267 These include the 2000
Technology Transfer Promotion Act as well
as more recent laws such as the Technology
Transfer and Commercialization Promotion
Act. These acts provide direct support,
opportunities and incentives for universities and
research institutions to engage in technology
transfer and commercialization activities. This
includes support for tech transfer infrastructure,
financial support through investment and loans
to help small and medium enterprises and
concessions with regards to state property
and IP. There are also legal provisions for
facilitating international cooperation and mutual
tech transfer and commercialization between
national and foreign governments, enterprises,
colleges and universities, research institutes,
and organizations.268 Since the early 2000s and
the initial interest in developing technology
transfer Korea has seen a steady growth in
university licensing income and patent rates.269
There are also a range of schemes in place
in order to improve knowledge flow and
commercialization from public sector research.
Examples include the Technology Holding
Company system (which seeks to promote
spin-offs of venture capital businesses from
universities and research institutes); the Leaders
in Industry-University Programme and the
56
Brain Korea Programme, which are aimed at
promoting collaboration between industry and
academia.270
Examples of government tech transfer
institutions include the Korea Institute for
Advancement of Technology which is a
public institute founded in 2009. Its activities
include developing a national technology
strategy, supporting technology transfer and
commercialization, and fostering international
technological cooperation. In 2012, the institute
had an annual budget of USD1.17 billion and
257 employees.271
Market and commercial incentives
Korea has relatively strict biopharmaceutical
pricing and reimbursement policies in place. A
positive list system was introduced in December
2006. Price negotiations are used for drugs
and pharmaceuticals available through basic
insurance. There have been cuts for a number
of years and cost containment policies are in
place.272
Korea offers tax reductions for investments in
sectors involving high technology that fulfil the
following requirements: (1) the technology shall
have a profound economic or technological
impact on the national economy, and be
essential to improving the industrial structure
and strengthening industrial competitiveness;
(2) the technology shall have been introduced
to the country less than 3 years prior, or shall be
economically and technologically superior to
already introduced technologies even though
it was introduced more than 3 years ago; and
(3) most of the processes using the actual
technology shall be carried out domestically.
The products and technology items falling
under the above category are listed by the
Ministry of Strategy and Finance.273
Legal certainty (including the rule of law)
The Korean legal environment is generally
considered stable and certain. Legal redress,
enforcement of contracts and administrative
justice are generally available and viewed as
effective. Korea ranked 14th overall in the WJP
Rule of Law Index 2014 and was among the most
improved countries during the past year.274
Building the Bioeconomy Examining National Biotechnology Industry Development Strategies
Russia
Human capital
Russian universities are not widely recognized in
international rankings. For example, no Russian
university is included on the 2013/14 Times
Higher Education rankings, both generally
and in terms of the life sciences. Looking
at academic and research publications, the
number of scientific and technical journal articles
published in Russia has dropped since 2000.
Data from the World Bank shows that for the
latest available year (2009) only 14,106 articles
were published, while in 2000 the number
was 17,180.275 This is in contrast to other major
emerging economies which all experienced
at least a two-fold increase during the same
period. Russia has also seen little growth in the
number of science and engineering graduates,
particularly in the life sciences. During 20012010, the number of doctoral degrees in natural
sciences and engineering remained about
10,000, which is on par with Germany and the
UK, but lower than China and the US.276
In terms of biotech specifically, although not
included on certain leading rankings such as
the Milken Institute’s biotechnology publication
and patent rankings, Russia ranks 13th out
of 147 countries on the Thomson Reuters
“Essential Science Indicators”, with over 265,000
publications in accredited journals over the
period 2001-2011.281
Infrastructure for R&D
However, Russians have traditionally had a high
level of enrolment in tertiary education. As a
percentage of the total population in the age
group 25-64 that has attained some level of
tertiary education, Russia had a 2011 rate of
53%, which is higher than any OECD country
and well above the OECD average of 32%.277
Similarly, although the number has dropped
somewhat in the last decade, Russia has a high
number of researchers in the population. The
latest data (2010) from the World Bank shows
that Russia had 3,092 researchers per million
people, in comparison to 703 in Brazil and 863 in
China (in 2009).278
Among developing countries, while Russia
is a significant investor in research and
development, important gaps exist. In 2012,
gross domestic R&D spending totaled USD37.8
billion at PPP.282 Nevertheless, although in
absolute terms this is a fairly high number
relative to other emerging economies (with
the exception of China), when measured as a
percentage of GDP Russia’s spending on R&D
appears to be much lower. 2012 figures show
R&D spending as a percentage of GDP at
1.12%.283 This is well behind Brazil (1.16%) and
China (1.98%) as well as the OECD average of
2.40%.284 Russian R&D spending is largely made
up of government spending – the latest data
from 2012 show government expenditure on
R&D at 67.8% of the national total, while industry
expenditure was at only 27.2%.285 However,
among government-funded R&D only 9.3%
is performed by universities, reflecting the
emphasis on basic research conducted in public
research institutions as opposed to academic
institutions.286 According to 2011 OECD data,
biotechnological R&D accounted for only a small
percentage of business enterprise R&D (under
1%).287 In relation to government and higher
education R&D expenditure, though somewhat
higher biotech R&D still only represented a
little over 7% of total government and higher
education sectors R&D spending.288
Moreover, one of the aims of the 2020
Strategy is, apart from existing public research
institutions, to build world class science and
technology universities. Programs and funding
have focused on creating a network of 27
research universities and attracting leading
international scientists.279 In addition, the
Innovative Universities program provides
grants to close to 60 Russian universities for
strengthening and training infrastructure and
staff.280
Russian patenting activity has remained at a
relatively low level for the last decade. Looking
at high-quality patents filed under triadic
patenting, the Russian share of the global
total is 0.11% at 2011 figures.289 With regards to
biotechnology patenting activity in 2011 the
number of patents filed by Russian residents
under the PCT was 38, very low in comparison
to developed countries and key emerging
economies such as China (with 443 biotech
patents filed in 2011).290
57
Appendix I – Detailed discussion: The enabling factors and country case studies
Russia’s biomedical and biotechnological
R&D capabilities are in the initial stages of
development. Despite the market potential in
Russia and the government’s desire to attract
investment in R&D in recent years, these
factors have not yet generated significant
investment in biotech R&D in Russia. For
example, the biopharmaceutical space has
seen a few large investments by international
research-based companies, such as in the St.
Petersburg pharmaceutical ‘cluster’, as well as a
special fund of RUB500 million – RUB1.5 billion
devoted to bio-clusters and biotech start-ups
established by the Russian Venture Company,
a government fund of funds.291 However, on
the whole significant challenges remain in
terms of incentives for foreign companies with
R&D capabilities and know-how to invest in
facilities and conduct biopharmaceutical R&D
in Russia. In particular, government policies
providing preferential treatment to domestic
manufacturers and locally-produced products,
which are detailed in below sections, have made
it difficult for companies to establish more
than manufacturing and production facilities in
Russia. For instance, the number of clinical trials
conducted in Russia is still on an absolute and
per capita basis fairly small. Russia currently has
2,661 registered trials in operation.292
One significant effort to attract and stimulate
investment in R&D is the Skolkovo Innovation
Center outside of Moscow, including a planned
‘biomedical cluster’ and R&D center involving
international and local scientists, companies
and venture capital funds. In the early stages
of development, the cluster has reportedly
established strategic partnerships with over
100 companies including Johnson & Johnson
and EMC and several world-class research
universities.293 In terms of the entire Innovation
Center, partners have committed to R&D
centers worth USD 420million and involving over
1,100 researchers.294
Russia has a number of tax incentives in place
to encourage R&D and high technology
manufacturing. For example, since 2008 all
funding towards R&D projects is exempt from
taxes.295 In addition, companies located in
one of Russia’s Special Economic Zones (St.
Petersburg, Tomsk and outside Moscow) as well
as in the Skolkovo Innovation Center are exempt
58
from property and land taxes for a 5 year term
and pay a reduced rate of income tax.296
Intellectual property protection
Russia’s environment for the protection of IP and
enforcement of IPRs has improved in the last
few years but on the whole continues to act as
a deterrent for innovators. Although a signatory
to several key IP-related international treaties
including the TRIPS Agreement, Russia’s legal
and regulatory framework for the protection of
IP, as well as enforcement of IPRs in practice, in
many ways still falls short of its commitments.
As a WTO member Russia offers a standard
20 year patent protection term. However,
while the protection has been available for
biotechnological and biopharmaceutical
inventions (with the exception of biological
processes), the actual protection afforded
to biopharmaceutical inventions is at times
uncertain.297 For example, there is no guarantee
that the drug regulator will not approve a
biosimilar product for market despite an active
patent on the reference biopharmaceutical, and
remedies through the judicial system are slow
and ineffective.298
Under its WTO commitments and article 18.6 of
the Law on the Circulation of Medicines, Russia
offers 6 years of regulatory data protection for
submitted test and clinical data for medicinal
products.299 However, it is not clear whether
this period of exclusivity applies to biologics as
well as how the protection would actually be
applied to biosimilar applications for market
authorization in a way that ensures that this
protection is not violated.
The regulatory environment
Russia’s regulatory system is evolving towards a
system in line with international standards but a
number of challenges remain for many biotech
sectors.
First, the market approval process in relation to
biopharmaceuticals is quite onerous and lacks
transparency. There are currently no specific
regulations for registering both biologics
and biosimilars in Russia. The registration
process is the same for chemical-based and
Building the Bioeconomy Examining National Biotechnology Industry Development Strategies
biologic products, and higher standards for
the approval of biosimilars are not necessarily
applied. Moreover, since 2010 registration
of biopharmaceuticals is dependent on the
submission of locally-conducted clinical trial
data. These factors have resulted in significant
registration delays and costs for foreign
innovative companies.
Second, with regards to agricultural
biotechnology several challenges exist. The
Ministry of Agriculture is responsible for the
regulation and approval of agricultural GM
products. Up until July 2014, only imported
GM crops may be registered and marketed;
this represents a de facto ban on cultivation of
GM seeds and products in Russia.300 However,
effective July 1, 2014, all GM organisms and
GMO-containing crops may be authorized
for market. Still, this pathway will have to go
through a process of implementation and
industry sources expect the registration process
to take 2-3 years initially.301 In addition, technical
regulations governing the Eurasian Customs
Union, of which Russia is a member, that came
into force in 2013 require all food products with
over 0.9% of GM lines to be labeled as such.302
Nevertheless, both the Russian government and
Russian policymakers are considering reversing
this approach and tightening controls on GMOs.
The Ministry of Agriculture is conducting a
review of existing regulations on GMOs in light
of international practices which the government
considers to be more stringent than in Russia.303
Also, amendments to the Law On Safety and
Quality of Alimentary Products that would ban
local production and some imports of GMOcontaining foods have been submitted to both
houses of parliament as of February 2014.304
One positive step involves efforts to ensure
all biopharmaceutical, biomedical and
microbiology production facilities comply with
Good Manufacturing Practices (GMP). Although
still in the process of implementation – the
deadline for compliance is now reportedly set at
2016 – mandatory GMP and similar international
standards in the regulatory process will help
drive improvements to R&D and manufacturing
sites in Russia, enabling further innovative
activities by both multinational and local
companies.305
Technology transfer
The central legislative framework for technology
transfer in Russia is somewhat unique in that it
focuses mainly on enterprise partnerships as
opposed to patenting and licensing agreements
as platforms for technology transfer. Federal
Law 217-FZ on the Commercialization of
University Research (2009) provides universities
with the exclusive right to market their
research through launching their own SMEs
or obtaining stock in companies that rely on
their research. Specifically, Law 217 requires
that universities have at least a 25-33% share in
spin-offs, depending on the type of company,
in exchange for the right to use the university
invention.306
In 2010, the Russian government also approved
Decree 218 “On measures of state support for
the development of cooperation of Russian
higher education institutions and organizations
implementing complex projects on hightech production”.307 The measure provides
competitive subsidies (up to RUB100 million) to
high-tech companies seeking to establish R&D
and manufacturing facilities in Russia that would
be operated jointly with a Russian university.308
In 2010-2012, a total of RUB19 billion was
allocated to the initiative. In return the university
obtains equity in the company equal to the
amount of the subsidy. At least 20% of the funds
are required to go towards R&D.
Private efforts at technology transfer are also
ongoing, including the Russian Technology
Transfer Network, which involves 60 R&D
organizations and innovation centers and
is aimed at linking potential academic and
industry partners including from the biotech
and biomedical sectors.309
Data on patenting activities by universities
and public research organizations confirms
that patenting has not been a priority for
Russian publicly funded research institutions;
as of 2011 Russia represented only 4% of PCT
applications by universities and 2% of public
research organizations among middle-income
and selected low-income countries.310 However,
reflecting the emphasis on direct university
participation in spin-offs, joint university-firm
PCT applications represent a relatively large
59
Appendix I – Detailed discussion: The enabling factors and country case studies
portion of total university applications in
comparison with other leading countries. At
30% of total university PCT applications, Russia
is on par with China and only behind Japan visà-vis other high and middle-income countries.311
areas include corruption in the government
and judicial system, civil conflict and protection
of property rights and privacy. In the 2013-14
Global Rule of Law Index Russia was ranked 80th
out of 99 countries.312
Market and commercial incentives
With regards to the biopharmaceutical market
in the last few years Russia has introduced
several policies that provide preferential
treatment to local companies at the expense
of foreign companies. Broadly speaking, the
Pharma 2020 Strategy has as one of the key
goals to increase local companies’ share of the
total biopharmaceutical market value to 50% by
2020 (in 2012, the share was about 20%). Several
measures, including the 2010 Law on Circulation
of Medicines, introduce a range of conditions
intended to drive local manufacturing of
pharmaceuticals.
These conditions effectively represent indirect
requirements for foreign companies to invest
in local production in order to gain access to
the market. For example, local products are
given an up to 15% higher price in government
tenders. In addition, in cases where two or more
local manufacturers are registered for the same
molecular entity, a proposed measure would
restrict state purchases to locally produced
drugs. In terms of pricing, for products on the
Essential Drugs List locally manufactured drugs
are annually adjusted for inflation, whereas
prices are frozen on imported products. A
policy that would introduce import tariffs on
off-patent products if a stage is reached where
market demand can be fully be satisfied with
locally produced medicines has also been
discussed.
As mentioned, these policies on their
own are inadequate to attract FDI in the
biopharmaceutical sector, with many other
framework conditions discussed above lacking
in Russia. Instead, such policies mainly represent
barriers to entry for many multinational
research-based companies.
Legal certainty (including the rule of law)
The Russian legal environment can be
challenging and several barriers exist. Problem
60
Singapore
Human capital
The National University of Singapore is
generally highly regarded, particularly in the
biomedical and life sciences. For example, in
the 2013-14 Times Higher Education rankings
it ranked 26th overall and 31st for the life
sciences.313 Looking at some biotech specific
indicators linked to higher education Singapore
does well. For example, according to the Milken
Institute’s 2006 “Biotech Patent Rankings” the
National University of Singapore was in the
lower quintile at 76th place.314
In terms of the number of researchers in fulltime employment, Singapore in 2011 had over
32,000 researchers, scientists and engineers
(excluding full-time postgraduate research
students).315 Out of this number, 26% of those
employed had obtained doctoral degrees and
24% had obtained Master’s degrees.316 Looking
at the proportion of researchers in relation to
the total work force Singapore has one of the
highest rates in the world. In 2011 Singapore
had 10.4 total researchers in full-time equivalent
per thousand of total employment.317 This is
considerably higher than the OECD average
of 7.7.
Infrastructure for R&D
Singapore is a big investor in research and
development. In 2011, gross domestic R&D
spending in Singapore totalled USD7.1 billion at
PPP.318 Measured as a percentage of GDP 2011
R&D spending was 2.23%.319 Internationally, this
is just below the 2012 OECD average of 2.40%,
and still behind the biggest R&D spenders
such as Korea and Israel.320 R&D spending
in Singapore is made up slightly more of the
private sector than government. The latest data
from 2011 shows industry expenditure on R&D at
55.3% of the national total.321
Building the Bioeconomy Examining National Biotechnology Industry Development Strategies
Singapore’s innovation infrastructure and
services is extremely well developed. The
Government’s One North infrastructure
initiatives, which comprise R&D facilities,
campuses for new higher education
institutions, living amenities for researchers
and offices for VCs and IP law firms, have been
extremely successful and are highly regarded
internationally.322 The initiative consists of two
major research hubs or clusters. Biopolis is the
biomedical hub and Fusionopolis is aimed at
ICT, engineering and the physical sciences.
Looking at high-quality patents filed under
triadic patenting, the share of the global total
is 0.17% at 2011 figures which is considerably
higher on an absolute and per capita basis than
many OECD economies as well as the BRICS.323
With regards to biotechnology patenting
activity in 2011 the number of patents filed by
Singaporean residents under the PCT was 64.324
Biomedical research makes up a substantial part
of the overall R&D expenditure in Singapore.
In 2011 Biomedical Sciences R&D accounted
for SGD1,509 million of which SGD573.8 million
came from the private sector and SGD 935.2
million from the public sector.325
Singapore’s high level of biomedical R&D
capability is also illustrated by the number
of researchers and scientists employed in
the biomedical sector. In 2011 biomedical
researchers and scientists (private and public
sectors including in A*STAR) made up 22%
of the overall number of researchers and
scientists.326
Biopharmaceutical R&D has been supported
by public-private partnerships promoted by
A*STAR in order to accelerate drug discovery
and development. Some concrete results and
examples include Bayer Healthcare partnership
with five research institutions in Singapore in
order to set up a new Translational Oncology
Network to target R&D aimed at the growing
cancer burden in Asia.327 There is also the
example of Menicon which developed the
world’s thinnest one-day disposable contact
lens in Singapore.328
Singapore is an attractive market for venture
capital and private equity. According to the IESE
2013 VC and PE Attractiveness Index, Singapore
ranked 5th.329
Intellectual property protection
Singapore has a robust system of IPRs. Standard
patent terms are issued for 20 years and
Singapore also provides for a five-year patent
term extension.330 In addition, Singapore offers
a five year term of regulatory data protection.
Additionally, Singapore introduced legislation
relating to the development of orphan drugs
in 1991, which includes marketing exclusivity
and subsidies as incentives for orphan drug
development.331
The regulatory environment
Singapore has a strong clinical and regulatory
environment administered by the Health
Sciences Authority. For biopharmaceuticals the
Health Products Regulation Group is responsible
for the authorisation and safety supervision of
pharmaceuticals. Additionally, this agency is
responsible for clinical trials in Singapore. The
agency is highly regarded and is involved in
the regulation of western medicinal products
as well as Chinese proprietary medicines and
cosmetic products.332 However, generally
speaking the regulatory authorities in Singapore
require new products and technologies to be
approved in other jurisdictions prior to approval
in Singapore.333
GM foods are regulated by the Genetic
Modification Advisory Committee. This
committee regulates the import and
commercialization of biotech products and
services. Singapore’s regulations are sciencebased and the registration process is generally
viewed as efficient. Approval for food imports
(GM and non-GM) is contingent on the product
having been approved as safe in the exporting
country.334
Technology transfer
Singapore has a strong tradition of technology
transfer with governmental bodies as well as
academic institutions being closely involved in
transfer activities. For example, the Biomedical
Sciences Industry Partnership Office liaises
61
Appendix I – Detailed discussion: The enabling factors and country case studies
between universities, public research institutes
and industry. It promotes partnerships and links
commercialization partners with public sector
research.335
Singapore’s main bioclusters host domestic
and international firms and biomedical research
institutions and are integrating governmental
R&D bodies. Technology transfer is also being
promoted and is made accessible by the close
proximity of these bioclusters to the Singapore
Science Park and the National University of
Singapore.336 In 2011, Singapore set up the
Intellectual Property Intermediary to help
local enterprises enhance innovation capacity
through technology transfer. This initiative is
backed by collaboration and support from the
Government. From 2011 to 2012, the IPI had
engaged 95 companies.337
From the technology transfer office
administered by the National University of
Singapore, over 700 patent applications, 84
licensing agreements and equity in lieu of
royalties reaching USD4.85 million had been
managed from the period of its inception in
1990 till the mid-2000s.338
Market and commercial incentives
With regards to the biopharmaceutical market
this is relatively free with government subsidies
in place only for pharmaceuticals included on
the Standard Drug List.
Singapore offers a generous R&D tax credit of
up to 400% on qualifying R&D expenditure.339
The majority of this relief is available on R&D
performed in Singapore.
Legal certainty (including the rule of law)
The legal environment in Singapore is
considered stable and certain. Legal redress,
enforcement of contracts and administrative
justice are generally available and viewed as
effective. Singapore is ranked 10th on the
Global Rule of Law Index of the World Justice
Project 2014.340
62
Switzerland
Human capital
Swiss universities are generally highly regarded,
particularly in the biomedical and life sciences
fields. For example, in the Times Higher
Education rankings the Swiss Federal Institute
of Technology Zürich is ranked 14th overall and
15th in the life sciences.341
Moreover, looking at some biotech specific
indicators linked to higher education Swiss
universities are prominent. For example,
with regards to publications in the biotech
sector according to the Milken Institute’s
“Biotechnology Publication Ranking” compiled
in 2006, three Swiss universities were in the top
fifty.342 And according to their “Biotech Patent
Rankings” Switzerland had one university (Zurich
University) in the top 100 at 83rd place.343
As a percentage of the total population in the
age group 25-64 that has attained some level of
tertiary education, Switzerland had a 2011 rate of
35% which is slightly above the OECD average of
32%.344 In terms of the life sciences, Switzerland
had 1,830 life sciences graduates in 2011 which is
an increase of over 100% since 2000.345
In terms of number of researchers in full-time
equivalent Switzerland had over 25,000 in
2008 the latest year for which OECD figures
are available.346 Looking at the number of
researchers in relation to the total work force,
Switzerland was behind the OECD average of
7.7. In 2008 it had 5.5 total researchers in full-time
equivalent per thousand of total employment.347
Infrastructure for R&D
Switzerland is a leading investor in research and
development. In 2008, Swiss gross domestic
R&D spending totalled USD10.5 billion at PPP.348
While in absolute terms not a world-leading
number Switzerland has a relatively high level of
R&D spending when measured as a percentage
of GDP. 2008 figures show R&D spending as a
percentage of GDP at 2.87%.349 Internationally,
this is higher than the OECD average of 2.40%,
but still behind the biggest R&D spenders such
as Korea and Israel.350 Swiss R&D spending is
largely made up of private sector and industry
Building the Bioeconomy Examining National Biotechnology Industry Development Strategies
spending. The latest data from 2008 show
industry expenditure on R&D at 68% of the
national total.351 According to the Swiss biotech
industry, biotech R&D accounted for 13% of
overall industry R&D spending.352
Switzerland has quite advanced medical and
biomedical research facilities. As mentioned,
one of its life science and medical universities
is ranked as among the best in the world.
Switzerland punches above its weight in terms
of clinical trials and currently has 3,412 in
operation.353
Swiss patenting activity is substantially higher
than other larger countries. Looking at highquality patents filed under triadic patenting, the
Swiss share of the global total is 1.59% at 2011
figures.354 More significantly, the Swiss have one
of the highest levels of patenting intensity in
the world: between 2007 and 2009 115 patents
were filed per million people.355 This was one of
the highest rates in the OECD, well above the
average of 38. With regards to biotechnology
patenting activity in 2011 the number of patents
filed by Swiss residents under the PCT was
131.356
Biomedical research makes up a substantial
part of overall R&D expenditure. Led by its
two dominant national champions, Roche
and Novartis, R&D expenditure by the Swiss
pharmaceutical industry made up over onethird of total private sector R&D expenditure
at CHF4.6 billion in 2008.357 This was the fourth
highest total pharmaceutical R&D expenditure
in Europe just behind the UK, France, and
Germany.358 Biopharmaceutical research
represents a large share of the Swiss economy
with pharmaceutical exports for 2011 estimated
at an excess of USD40 billion.359 Switzerland’s
high level of biomedical R&D capability is also
illustrated by over 35,000 people with direct
employment in the industry and an estimated
further 120,000 in related and downstream
industries.360 While there are a number of SMEs
and smaller Swiss biomedical manufacturers the
industry is dominated by Roche and Novartis.
Both companies employ over 10,000 staff
each and invest either the majority or a large
portion of their R&D expenditure in Switzerland.
Novartis, for instance, spent over half of its total
R&D budget of EUR5.1 billion in Switzerland.361
Roche spent just under EUR2 billion of its total
global R&D expenditure in Switzerland.362
In terms of public funding, the Swiss National
Science Foundation provided CHF755 million
in funding for basic research in 2012.363 41% of
this was dedicated to biological and medical
research.364 Out of this close to 60% was for
basic biological and medical research.
Venture capital in Switzerland is relatively
well-established. In particular, the percentage
of GDP going to early stage venture capital
investment was the highest in the world at
close to 0.06% of GDP in 2008.365 Switzerland
is also an attractive VC market. According to
the IESE 2013 VC and PE Attractiveness Index,
Switzerland ranked 10th.366
Intellectual property protection
Switzerland has a very strong system and
history of IPRs. Switzerland is a member of the
EPO and a signatory party to the European
Patent Convention. Standard patent terms are
issued for 20 years. Switzerland also provides a
Supplementary Protection Certificate (SPC)
of five years.367 RDP is also available at a 10
year term.
Switzerland introduced legislation relating to
the development of orphan drugs in 2006. This
is similar to Regulation 2000 operating within
the EU. Incentives include scientific advice and
tax relief on qualifying expenditures.368
The regulatory environment
Switzerland has a strong clinical and regulatory
environment. For biopharmaceuticals the drug
regulatory authority Swissmedic is responsible
for the authorisation and safety supervision of
pharmaceuticals. The agency is highly regarded
internationally.369
With regards to the use of biotechnology in
agriculture the Swiss public in 2005 voted for a
five-year moratorium on the use of GM crops
in Switzerland.370 This was later extended by
the Swiss Parliament in 2010 to the end of 2013
and was recently extended again till 2017. The
extensions come despite a number of scientific
reports being commissioned by the Swiss
63
Appendix I – Detailed discussion: The enabling factors and country case studies
Government finding that GM crops present no
clear danger to human or plant health.
Technology transfer
Switzerland has a strong tradition of technology
transfer with governmental bodies as well as
academic institutions being closely involved in
transfer activities. For example, the Commission
for Technology and Innovation (KTI) has as one
of its core goals to promote technology transfer
between universities and industry. Here KTI
uses physical and web-based platforms to link
potential partners, support so-called “National
Thematic Networks” (including the Swiss
Biotech Association) and provide innovation
mentors.371
Academic institutions and professionals have
their own technology transfer association
through swiTT (Swiss Technology Transfer
Association).372 The association provides
support services and has its mission to help
facilitate technology transfer between public
institutions and private companies. A 2012
survey of 14 major universities and research
institutions found that: “3,323 new research
projects with economic partners were initiated;
519 invention disclosures were registered; 297
priority patent applications were filed; 174
license and option agreements were executed;
and 62 start-up companies were created.”373
Nevertheless, Switzerland faces some
challenges. For example, like other European
countries both the number of licenses agreed
to and issued as well as licensing income is
generally lower than in the US.374 A 2008 survey
of high performing academic institutions in
Europe and the US found that the proportion of
universities with high-income (EUR1 million+) vs
lower income (EUR0-30,000) licensing revenue
was inverse between the surveyed institutions:
in the US the majority of surveyed institutions
were most likely to have high licensing income
while the European institutions were most
likely to have lower levels of income.375 Swiss
institutions performed better than the European
average but still appear to be behind the US.
Market and commercial incentives
With regards to the biopharmaceutical market
64
relatively strict pricing policies are in place for
drugs and pharmaceuticals available through
basic insurance. There are consequently a
limited number of market incentives for these
products which total over 2,500 medicines.376
However, for both supplementary insurance
and all medicines not listed on the public
reimbursement list there is free pricing and a
relative free market.
In terms of tax credits, Switzerland offers only
a moderate amount of R&D tax incentives.
Overall its tax scheme is not very favourable
in comparison to other OECD countries.377
There are tax incentives in place for the use
of biofuels. Qualifying biofuels are partially or
wholly exempt from “mineral oil tax” which can
make up a significant portion of the per litre
cost of fuel.378
Legal certainty (including the rule of law)
The Swiss legal environment is generally
considered stable and certain. Legal redress,
enforcement of contracts and administrative
justice are generally available and viewed as
effective.
United States
Human capital
American universities consistently top world
rankings in almost all subject fields and the
US remains the top destination for foreign
students.379 In the life sciences the US dominates
most rankings. For example, in the Times
Higher Education 2013-14 rankings American
universities make up 15 out of the top 20
universities in the life sciences sector.380
Moreover, looking at some biotech specific
indicators linked to higher education American
universities dominate. For example, with regards
to publications in the biotech sector according
to the Milken Institute’s “Biotechnology
Publication Ranking” compiled in 2006, US
universities accounted for 46% of worldwide
scientific biotech publications between 1998
and 2002.381 Out of the top 20 universities 14
were American. Similarly, the Milken Institute
Building the Bioeconomy Examining National Biotechnology Industry Development Strategies
also found that American universities were the
most prolific when it comes to biotechnology
patenting. According to their “Biotech Patent
Rankings” nine of the top ten performing
universities were American.382
As a share of the total number of tertiary
education students in the world the US has
maintained its position as a world leader. In
the latest year for which comparable data is
available (2011) the US had a total of 70 million
people in the age group 25-64 attaining some
level of tertiary education.383 Similarly, as a
percentage of the total population in the age
group 25-64 that has attained some level of
tertiary education, the US has one of the highest
rates in the world at 42%.384
Looking specifically at science and engineering
the US produces the second largest number
of natural science and engineering university
graduates in the world at almost 250,000 per
year.385 While considerably less than China
in which the total number of graduates has
jumped from just under 240,000 in 1998 to over
1.1million in 2010, it is substantially higher than
other countries like Japan, the UK and Korea.386
Similarly, in the life sciences the US produced
the highest number of graduates in the OECD
at 109,023 for 2011.387
Furthermore, the US produces the highest
number of doctoral degrees in science and
engineering. In 2010 this was close to 33,000
degrees.388
In terms of number of researchers the US
has the second highest total of researchers
in full-time equivalent at close to 1.3 million
researchers in 2011.389 In relation to the total
work force, however, the US is above the OECD
average but behind countries such as Finland,
Denmark and Israel. In 2011 the US had 8.8 total
researchers in full-time equivalent per thousand
of total employment.390
Infrastructure for R&D
The US is a leading investor in research and
development. In 2011, US gross domestic R&D
spending totalled USD429 billion at PPP.391
This was the highest total rate in the world
making up close to one-third of global total
R&D spending. The US also has a relatively
high level of R&D spending when measured as
a percentage of GDP. 2011 figures show R&D
spending as a percentage of GDP at 2.79%.392
Internationally, this is higher than the OECD
average of 2.40%, but still behind the biggest
R&D spenders such as Korea and Israel.393
US R&D spending is largely made up of private
sector and industry spending. The latest data
from 2012 show industry expenditure on R&D at
59% of the national total.394
The US has some of the best and most
advanced medical and biomedical research
facilities in the world as indicated by the fact
that the US has by far the highest absolute
number of clinical trials in operation globally.395
As of March 2014 close to 76,000 out of a global
total of circa 163,000 clinical trials were being
carried out in the US.396
American patenting activity is a substantial
share of global patenting. Looking at highquality patents filed under triadic patenting,
the US share of the global total is the biggest
at 29.35% at 2011 figures.397 With regards to
biotechnology patenting activity US residents
file more biotechnology patents than any other
country. In 2011 the number of patents filed
under the PCT were 3,907 which was close to
half of the OECD total.398
Government funding and support for
biomedical and biotech R&D comes through
both direct support and tax credits. (Direct
support will be discussed here whereas support
through R&D credits will be discussed below.)
At the federal level the NIH is one of the main
sources of funding for biotech and biomedical
research in the United States. The NIH funds
over 300,000 researchers at 2,500 universities,
medical schools and research institutes in
the US and abroad.399 NIH’s current budget
is just over USD31 billion.400 Historically, the
NIH has allocated over 50% of its budget to
basic fundamental research with translational
and advanced research being pursued by
biopharmaceutical and biomedical companies.
Many commentators have noted that this has,
by and large, been a successful combination.401
The US has a large number of biotech and
65
Appendix I – Detailed discussion: The enabling factors and country case studies
biomedical clusters. In particular, California and
Massachusetts are home to a number of worldleading clusters. In California there are four
major clusters that employ more than 20,000
people in biotech and biomedical research: the
Bay Area, Los Angeles County, Orange County
and San Diego County. Together these four
areas employ over half of the 268,000 (2009
figures) Californians who work in the biomedical
industry.402 The total number of biomedical
companies in the state is 2,244 with estimated
revenues of USD114 billion.403
The Massachusetts biotech cluster, located
primarily in the Greater Boston area, is one of
the oldest biomedical clusters. The surrounding
122 colleges and universities and top research
hospitals, as well as a healthy inflow of public
seed money (via federal Small Business
Innovation Research grants) and venture capital
(it captures just over 18% of all US biotech VC
investment) has contributed to the success of
this region.404 This cluster has grown to contain
over 430 biotech companies.
Like many American states, both California and
Massachusetts offer tax credits to biotech and
biomedical companies as an incentive to both
start up and run their businesses.405
The US has a separate and distinct term of
protection for biologics. The Biologics Price
Competition and Innovation Act of 2009 (BPCIA)
provides 12 years of data protection to biologics
(i.e. 12 years until a biosimilar can be approved),
with no filing of biosimilar applications for the
first four years and an extra six months (added
to both the four years and the 12 years) for
submission of studies on paediatric use.
Most recently the 2011 patent reforms and
the change from a first-to-invent to a firstto-file system of patenting were greeted by
many innovators as a positive enhancement of
existing patent protection.409
The importance of America’s strong IP
protection in encouraging biotechnology and
biomedical innovation is illustrated by surveys
of biomedical corporations and their leaders.
For instance, when asked about the importance
of IP protection, 98% of biomedical company
CEOs in California stated that international and
domestic IP protection were either somewhat
or extremely important issues affecting their
industry.410
The US also has strong and well-established
orphan drug legislation which has promoted
innovation and the development of several
Finally, the US is home to the largest private
new orphan drugs. Between 1973 and 1983
venture capital market in the world. While the
fewer than 10 products treating rare diseases
market has decreased substantially since the
were produced; in the 16-year period following
pre-financial crisis highs of 2007, in 2013 the total the introduction of the US Orphan Drug Act
size of venture capital investment in the US was
in 1983 over 200 products were introduced.411
USD29.4 billion.406 Surveys and indexes of the top Similarly, the provisions for marketing exclusivity
venture capital markets in the world frequently
and tax incentives in the Orphan Drug Act are
find the US as being the most attractive and
associated with a significant and sustained
dynamic place for venture capital investing. See increase (69%) in new clinical trials for drugs
for example the IESE’s 2013 Venture Capital and treating rare diseases.412
Private Equity Country Attractiveness Index
which ranked the US first in the world.407
Still, challenges remain even in the US. In
particular in the biotech sector question marks
Intellectual property protection
have been raised over the patentability of basic
biotech inventions due to the Supreme Court
The US has one of the most sophisticated and
decisions in the 2013 Molecular Pathology
elaborate forms of IP protection in the world.
v Myriad Genetics and 2012 Prometheus
It offers standard patenting exclusivity of 20
Laboratories, Inc v Mayo Collaborative Services
years with data exclusivity provisions of up to
cases. The former ruling has raised uncertainties
5 years for new chemical entities and 3 years for
over the patentability of DNA molecules that
new indications of existing drugs.408 Patent term mimic naturally-occurring sequences as well
restoration is also offered for up to a period of
as other patented products and technologies
5 years.
isolated from natural sources.413 The latter ruling
66
Building the Bioeconomy Examining National Biotechnology Industry Development Strategies
has made the field of personalized medicines
and the patentability of biotechnologies and
products that make use of the application of
natural laws highly uncertain.414
The regulatory environment
The American clinical and regulatory
environment is highly regarded and
internationally well recognised. With regards
to the regulation of products and technologies
developed using modern biotechnology, the
Coordinated Framework for Regulation of
Biotechnology is generally viewed as being
successful. Since its announcement in 1986
the policy and subsequent sector-specific
regulations are seen as having been instrumental
in promoting the development of the American
biotechnology industry and bringing a
wide array of biotechnology products and
technologies to consumers.
With regards to biopharmaceuticals the FDA
sets and enforces rigorous standards of both
GMP and GCL and frequently inspects drug
manufacturing sites in the US and abroad.
The agency also has an advanced system of
pharmacovigilance. MedWatch is the FDA’s
Safety Information and Adverse Event Reporting
Program. It serves both healthcare professionals
and consumers. The international high standing
of the FDA is most obviously reflected by its
leading role in efforts to harmonise regulatory
standards through the International Conference
on Harmonisation. Moreover, the regulatory
standards of the FDA are frequently emulated
and recognised as a gold standard amongst
clinicians, health economists and the academic
community.415
Nevertheless, the FDA is not immune to
criticism. Biomedical companies frequently
point to deficiencies in the approval system and
specifically time spent on approvals. Recent
data suggests that FDA approval times have
increased substantially. For example, for new
molecular entities/new biologic agents the
average number of months to approval has
jumped by 28% from 14.68 months in the period
2003-7, to 18.85 in 2008.416 Similarly, the average
number of months to clearance of 510(k)s (an
approval application for medical devices) has
also increased from 3.14 months in 2003-7 to
4.45 months in 2010 – a jump of 43%.417 And for
pre-market approval (PMA) of medical devices
the increase has been from an average time
of 15.48 months in 2003-7 to 27.08 months
in 2010; an increase of 75%.418 According to
local industry associations, these increases in
processing times risk putting the US biomedical
industry at a competitive disadvantage. Other
regulatory agencies (particularly in Europe)
have changed their approval processes with a
view to attracting more manufacturers to both
perform their clinical trials and launch their
products there first. Indeed, in California the
increase in FDA processing time was viewed as
being a serious issue by a majority of biomedical
CEOs. When asked to rate the influence of
federal policy issues on the industry’s ability to
advance biomedical research, innovation and
investment in California, the mandate, processes
and resources of the FDA were listed as being
of extreme importance by 80% or more of
respondents. Furthermore, 80% of respondents
listed the scope of the FDA mandate as being
extremely important and 85% of respondents
said FDA resources and/or processes were
extremely important.419
With regards to the regulation of biotechnology
crops, the USDA has in recent years taken steps
to cut the approval time by half for petitions for
nonregulated status for genetically engineered
organisms including biocrops.420 Approval times
have increased from six months to three to five
years since the mid-1990s. Key changes include
streamlining internal USDA review processes,
setting timeframes for the completion of specific
review steps, and expedited internal review and
decision-making procedures.421 These changes
were announced in 2012.
Technology transfer
One of the key drivers of American biotech
innovation and commercialisation has been
the success of technology transfer in the US.
The Patent and Trademark Law Amendments
Act of 1984 and 1986 (commonly referred to as
the Bayh-Dole Act) and the Stevenson-Wydler
Technology Innovation Act, which was later
amended by the Federal Technology Transfer
Act of 1986 and the Technology Transfer
Commercialization Act in 2003 have all been
instrumental in incentivizing technology transfer.
67
Appendix I – Detailed discussion: The enabling factors and country case studies
These laws gave institutions that received
federal support (such as American universities,
small businesses and non-profits) control and
the rights to any resulting intellectual property
of their inventions or research.
68
Arguably, one of the strongest drivers of
biopharmaceutical innovation in the US has
been the existence of this relatively free market
in the pricing of pharmaceuticals. For example,
a 2004 study of 11 OECD countries by the US
Chamber of Commerce and the International
Trade Administration found that under market
conditions similar to those in the US, global
R&D by biopharmaceutical corporations would
increase by 11-16% and would result in the
development of 3-4 new molecular entities
annually.426
Studies have found a significant correlation
between increased patenting activities at US
universities following the Act. For example, a
2004 study found that university share of total
patenting in the US increased from 0.69% of
total patents at the time of legislation to just
under 5% in 1996. Moreover, in a range of 117
industries (including drugs) the increase was
from a decrease of 87% in 1969 to an increase
of 1,648% in 1996.422 Using fifteen years of
data from the annual Association of University
Technology Managers (AUTM) survey a 2012
study estimating the economic contribution of
licensing activity by academic institutions found
that in the US the contribution of academic
licensing to gross industry output ranged from
USD199-836 billion (2005 USD).423 Contributions
to GDP were equally significant estimated
at between USD86-388 billion (2005 USD).424
Even under the post-2007 adverse economic
conditions, the positive effects of Bayh Dole are
being felt. In 2012 university related patenting,
licensing, and start-ups were still strong with
over 22,000 patent applications filed, over 5,000
licenses executed, and 705 start-ups formed.425
In addition, 38 US states offer R&D tax credits at
varying rates; Iowa, for instance, offers a credit
of up to 6.5% of qualifying expenditure, which
may be doubled for bioscience firms.428 Many
states also offer additional incentives and tax
credits such as seed capital tax credits, state
venture capital investments and state sales tax
exemptions for R&D equipment.429
Market and commercial incentives
Legal certainty (including the rule of law)
By international standards, the US has a
relatively free market in the purchase and
sale of biopharmaceutical products. There
are no national price regulations or national
reimbursement agencies. Instead, private health
insurers and public payers (such as Medicare, the
Veterans Health Administration and Medicaid)
negotiate prices with manufacturers and only
indirectly set reimbursement limits and influence
prescribing and patient usage through the use
of formularies. Drug formularies (which often
include therapeutic interchange or so-called
switching mechanisms) and differential costsharing (such as tiered co-payments) are two
of the more commonly used techniques to
influence prescribing practices.
The US legal environment is generally
considered stable and certain. Legal redress,
enforcement of contracts and administrative
justice are generally available and viewed as
effective. However, the US faces challenges
as is reflected in its ranking on a number of
international indices measuring the rule of law.
In the 2014 Rule of Law Index the US ranked
19th.
The US also provides a number of R&D tax
credits, both at the federal and state level. The
federal Research and Experimentation Tax
Credit allows companies to claim a tax credit of
between 14-20% of qualifying amounts.427 This
credit is not permanent and currently expired at
the end of 2013. The Obama administration has
proposed to both simplify and make permanent
this rather convoluted and complicated credit.
Building the Bioeconomy Examining National Biotechnology Industry Development Strategies
Notes
1
J Schumpeter
(1939), Business Cycles: A Theoretical, Historical,
and Statistical Analysis of the Capitalist Process (1939), New York
1939, p. 86. From: http://dallasfed.org/research/ei/ei0103.html
(Accessed September 2011)
2
See: Barack Obama, Remarks by the President in State of Union
Address, January 25 2011, www.whitehouse.gov/the-pressoffice/2011/01/25/remarks-president-state-union-address; The
Daily Telegraph, October 25 2010, www.telegraph.co.uk/finance/
economics/8085093/David-Cameron-promises-new-economicdynamism.html; People’s Daily Online, January 12 2010, http://
english.peopledaily.com.cn/90001/90776/90785/6865920.html;
Sourcing Brazil, July 25 2011, www.sourcingbrazil.com/brazilsnew-it-innovation-technology-policy/ ; and EU, http://ec.europa.
eu/europe2020/tools/flagship-initiatives/index_en.htm
(All accessed August 2011).
3
OECD (2009), The Bioeconomy to 2030: designing a
policy agenda
4
The White House (2012), National Bioeconomy Blueprint,
Washington DC 2012, p.1.
5
ISAAA (2013), “Brief 46-2013: Executive Summary”, p. 1.
6
Ibid.
7
KO Fuglie et al (2011), Research Investments and Market
Structure in the Food Processing, Agricultural Input, and Biofuel
Industries Worldwide. ERR-130. U.S. Dept. of Agriculture, Econ.
Res. Serv. December 2011, p 134.
8
Ibid.
9
Ibid. p. 58.
10
JA DiMasi et al (2003). “The price of innovation: new estimates
of drug development costs.” Journal of health economics
22.2 (2003): 151-185.
11
D Mestre-Ferrandiz et al (2012), “The R&D cost of a new
medicine.” London: Office of Health Economics p. v.
12
Ibid.
13
WHO (2006), “The pharmaceutical industry in Europe, key data”,
PowerPoint
14
Thomson Reuters (2012), “The Pharmaceutical Supply Chain”,
August 2 2012.
15
BIO (2010), “How do Drugs and Biologics Differ?”,
November 10 2010.
16
Ibid.
17
K Hamer (2010), “Biotech Outsourcing Strategies cmc –
Biologics stream”, Meeting Report, mAbs 2:5, 461-465;
September/October 2010; Landes Bioscience, pp. 462-3.
18
IBM, “National innovation policy”: www.ibm.com/ibm/
governmentalprograms/innovissue.html#position
19
Innovation infrastructure includes all of the items and policies
that, together, encourage or discourage innovation such as
regional or national pools of scientists and engineers; excellence
in basic research; protection of intellectual property; tax-based
incentives; anti-trust enforcement that encourages innovationbased competition; and an economy’s relative openness.
20
OECD (2006), Innovation in Pharmaceutical Biotechnology:
Comparing National Innovation Systems at the Sectoral Level,
Paris: OECD, 2006, p.171
21
National Science Foundation (2014), Science and Engineering
Indicators 2014, Washington DC 2014, chapters 2-4.
22
OECD (2006), p. 167.
23
T Wilsdon et al (2012), Policies that encourage innovation in
middle-income countries, CRA, pp. 60-2.
24
M Pugatch et al (2012), Taking Stock: How Global Biotechnology
Benefits from Intellectual Property Rights, The contribution of
IPRs to the biotechnology ecosystem and economic growth in
developed and emerging economies: examining the literature
and evidence, BIO 2012.
25
A. Kesselheim, (2010), “Using Market-Exclusivity Incentives to
Promote Pharmaceutical Innovation”, New England Journal of
Medicine, Vol.363, No.19 pp.1855-1862
26
E Mansfield (1986), “Patents and Innovation: An Empirical Study”,
Management Science, (February, 1986), pp. 173-181
27
D
Torstensson & M Pugatch (2010), Keeping Medicines Safe –
A Study of the Regulations Guiding the Approval of Medicines in
Emerging Markets, Stockholm Network London
28
USDA, Plant and Animal Health Inspection Service, Regulations
(Accessed March 2014): www.aphis.usda.gov/wps/portal/
aphis/ourfocus/biotechnology?1dmy&urile=wcm%3apath%
3a%2FAPHIS_Content_Library%2FSA_Our_Focus%2FSA_
Biotechnology%2FSA_Regulations
29
FDA, FDA’s International Posts: Improving the Safety of
Imported Food and Medical Products: www.fda.gov/
forconsumers/consumerupdates/ucm185769.htm See also the
international cooperation agreement and pilot API inspection
program between European regulators, the FDA and Australian
drug regulatory authorities. EMA et al (2011), “Final report on
the International API inspection Pilot Programme”, 16 June 2011,
EMA/453741/2011.
30
USPTO, (2006), Technology Profile Report: Patenting Examining
Technology Center Groups 1630-1660, Biotechnology,
Washington, 2006
31
The Economist (2002), “Innovation’s Golden Goose”,
Technology Quarterly Section, p. 3. December 14, 2002
32
L Pressman et al (2012), The Economic Contribution of University/
Nonprofit Inventions in the United States: 1996-2010: Measures
of Economic Impact of Licensed Inventions Commercialized by
Licensees of U.S. Respondents to the AUTM Survey 1996-2010,
BIO 2012, p. 3.
33
Ibid.
34
OECD, (2003), Turning Science into Business – Patenting and
Licensing at Public Research Organisations, Paris, 2003.
35
The Economist (2014), “Fever rising”, February 15 2014
36
M. Kyle (2007), “Pharmaceutical price controls and entry
strategies”, Review of Economics and Statistics, Vol. 89, No. 1,
February 2007, pp. 88-99
37
Heritage Foundation (2013), 2013 Index of Economic Freedom,
chapters 2 and 6.
38
World Bank (2013), “Gross domestic product 2012, PPP”, Last
updated December 18 2013
39
ISAAA (2013), p. 2.
40
Scientific American Worldview (2013), “Measuring Innovation”,
New York 2013, p. 36.
41
Ibid. p. 48-9.
42
Torstensson and Pugatch, (2010), p. 33, CIA Factbook, Brazil,
World Bank data bank, GDP growth (annual %), 2012
43
World Bank (2013)
44
World Bank, Data bank, GDP per capita (current US$), Brazil
45
World Economic Forum (2013), The Global Competitiveness
Index 2013–2014, p. 15.
46
Finep, A Empresa: www.finep.gov.br/pagina.
asp?pag=institucional_empresa
47 Science
and Development Network (2006), “Brazil’s innovation
law: lessons for Latin America”, August 3 2006.
48
Brasil Maior, Inicio / O Plano / Dimensão Setorial:
www.brasilmaior.mdic.gov.br/conteudo/153
49
C Soccol (2005), “Brazilian biofuel program: an overview”,
Journal of Scientific and Industrial Research, Vol 64, Nov 2005,
pp. 897-904.
50
DECRETO Nº 6.041, DE 8 DE FEVEREIRO DE 2007
51
World Bank (2013)
52
World Bank, Data bank, GDP per capita (current US$), China
53
World Economic Forum (2013), p. 15.
54
OECD (2012), OECD Science, Technology and Industry Outlook
2012, OECD Publishing China chapter, p. 264.
55
M. Schaaper (2009), Measuring China’s Innovation System, OECD
Science, Technology and Industry Working Papers 2009/01, p. 3.
56
People’s Republic of China, 12th Five Year Plan, English
translation, British Chamber China, chapter 10, s 2.
57
JC Greenwood (2013), “Biotech in China”, European
Biopharmaceutical Review, January 2013, p. 62.
58
Ibid.
59
World Bank (2013)
69
Notes
Bank, Data bank, GDP per capita (current US$), India
Economic Forum (2013), p. 15.
62
See for example: Office of Adviser to the Prime Minister (2011),
“Creating a Roadmap for a ‘Decade of Innovation”, STRATEGY
PAPER MARCH 2011, p. 6.
63
Ibid. pp. 14-5.
64
OECD (2012), p. 312.
65
National Innovation Council, Government to Launch India
Inclusive Innovation Fund - Press Note, January 27 2014:
www.innovationcouncil.gov.in/index.php?option=com_conten
t&view=article&id=356:government-to-launch-india-inclusiveinnovation-fund-press-note&catid=14:news&Itemid=13
66
Ibid.
67
IBEF, Biotechnology Industry in India, Trends, Market Size,
Scope of Biotechnology:
www.ibef.org/industry/biotechnology-india.aspx
68
ISAAA (2013)
69
OECD (2012), p. 312.
70
Department of Biotechnology (2007), National Biotechnology
Development Strategy, The Future Bioeconomy: Translating
Life Sciences knowledge into socially relevant, eco friendly and
competitive products, Government of India
71
Department of Biotechnology (2014), National Biotechnology
Development Strategy 2014, Government of India Pp. 4-5.
72
Ibid. pp. 5-16
73
USDA (2013), “India, Biofuels Annual”, September 4 2013, p. 5.
74
World Bank (2013)
75
World Bank, Data bank, GDP per capita (current US$),
Korea, Rep.
76
World Economic Forum (2013), p. 15.
77
OECD (2009i), OECD Reviews of Innovation Policy: Korea,
pp. 179-80.
78
Ibid.
79
Ibid.
80
OSEC Business Network Switzerland (2011), South Korea:
Bio Technology Industry in Korea
81
OECD (2009i), p. 117.
82
Korea Research Institute of Bioscience & Biotechnology,
Annual Report 2012, p. 14.
83
OSEC (2011)
84
Ibid.
85
Ibid.
86
World Bank (2013)
87
World Bank, Data bank, GDP per capita (current US$), Russia
88
World Economic Forum (2013), p. 15.
89
World Bank, Data bank, GDP annual growth, Russia
90
Bloomberg, “Russia Facing Recession as Sanctions Likely to
Intensify”, March 24 2014, www.bloomberg.com/news/201403-23/russia-staring-at-recession-on-sanctions-that-could-gettougher.html
91
Ministry of Economic Development (2011), Strategy for Innovative
Development of the Russian Federation 2020, 12/8/2011
92
OECD (2012), “Russian Federation”
93
Ibid.
94
Ministry of Economic Development (2011), Strategy for Innovative
Development…
95
ERAWATCH, “Russian Federation: Policy Documents”,
http://erawatch.jrc.ec.europa.eu/erawatch/opencms/
information/country_pages/ru/policydocument/policydoc_0007
96
Ministry of Education and Science (MON), The Government
Program “Development of Science and Technology in 2013-2020,
2/25/2013; see also: Federal Targeted Programme for Research
and Development in Priority Areas of Development of the
Russian Scientific and Technological Complex for 2014-2020,
5/2/2013, http://government.ru/en/docs/2129
97
Embassy of Switzerland in Russia, “Pharma 2020: The Strategy
of Development of the Pharmaceutical Industry of the Russian
Federation – Analytical Summary”, www.s-ge.com/de/filefieldprivate/files/25703/field_blog_public_files/5244; Russian
Government, State Coordination Program for the Development
of Biotechnology in the Russian Federation until 2020: Summary,
http://owwz.de/fileadmin/Biotechnologie/Information_Biotech/
BIO_Booklet_Block_A4_CS4.pdf
98
Ibid., p.12
70
60
World
99
Rusnano,
61
World
100Russian
“Rusnano Corporation”, http://en.rusnano.com/about
Foundation for Basic Research, www.rfbr.ru/rffi/ru/
101Foundation for Assistance to Small Enterprises (FASIE),
www.fasie.ru/
102Russian Foundation for Technological Development,
www.rftr.ru/
103World Bank (2013)
104World Bank, Data bank, GDP per capita (current US$), Singapore
105World Economic Forum (2013), p. 15.
106OECD (2013iii), “Singapore: innovation profile”, in Innovation in
Southeast Asia, OECD Publishing, pp. 237-8.
107Ibid.
108EDB (2014), Biomedical Sciences Singapore The Biopolis of Asia,
EDB Singapore.
109EDB (2013), Singapore Biotech Guide 2012/2013, p. 15.
110Ibid.
111
World Bank (2013)
112World Bank, Data bank, GDP per capita (current US$),
Switzerland
113World Economic Forum (2013), p. 15.
114Proneos GmbH, in collaboration with IKU Innovation
Research Centre, Corvinus University of Budapest; Institute of
International Relations and Approximation of Law, Comenius
University, Bratislava; Observatoire des Sciences et des
Techniques, Paris, (2010a), “Private Sector Interaction in
the Decision-making Process of Public research Policies”,
Switzerland, 2010
115Ibid.
116Ibid.
117Ibid.
118Swiss Biotech (2010), Report 2010. p. 6.
119Ibid. p. 10.
120World Bank (2013)
121World Bank, Data bank, GDP per capita (current US$),
United States
122World Economic Forum (2013), p. 15.
123Executive Office of the President, National Economic Council,
Office of Science and Technology Policy, (2009), A Strategy for
American Innovation: Driving Towards Sustainable Growth and
Quality Jobs, September 2009, p. 9.
124R. Steinbrook (2009), “Health Care and the American Recovery
and Reinvestment Act”, N Engl J Med 2009; 360:1057-1060,
p. 1057.
125Ibid.
126Executive Office of the President, National Economic Council,
Office of Science and Technology Policy, (2011), A Strategy
for American Innovation: Securing our Economic Growth and
Prosperity, February 2011, p. 2.
127White House (2012). Strategic objectives cited verbatim from
National Bioeconomy Blueprint.
128Ibid. Life Sciences
129World Bank, Data bank, Scientific and technical journal articles,
IP.JRN.ARTC.SC. “Scientific and technical journal articles refer
to the number of scientific and engineering articles published
in the following fields: physics, biology, chemistry, mathematics,
clinical medicine, biomedical research, engineering and
technology, and earth and space sciences.”
130OECD (2013i), Education at a Glance 2013: OECD Indicators,
OECD Paris, p. 37.
131Ibid.
132World Bank data bank, Researchers in R&D (per million people),
SP.POP.SCIE.RD.P6
133Ciência sem Fronteiras, The program, Goals:
www.cienciasemfronteiras.gov.br/web/csf-eng/goals
134National Science Foundation (2014), ch. 4, p. 19.
135OECD (2014), Main Science and Technology Indicators,
Volume 2013 Issue 2, OECD Publishing p. 21.
136Ibid.
137OECDstat, Inventor(s)’s country(ies) of residence,
Total PatentsTriadic Patent families.
138Ibid. Patent applications filed under the PCT, Biotechnology
139BASF, EMBRAPA (2010), “BASF and Embrapa’s Cultivance ®
soybeans receive approval for commercial cultivation in Brazil”,
Joint Press Release, February 5, 2010.
Building the Bioeconomy Examining National Biotechnology Industry Development Strategies
140BNDES,
BNDES, FINEP Joint Support Plan for Industrial
Technological Innovation Sectors Sugarcane and Sucroquímico
– PAISS: www.bndes.gov.br/SiteBNDES/bndes/bndes_pt/
Areas_de_Atuacao/Inovacao/paiss
141thepharmaletter (2013), “BNDES invests 804 million real in
Novartis’ new Brazil biotechnology unit”, December 7 2013.
142BNDES, Press Room, News, “BNDES renews Profarma and
expands support to biotechnology”, November 4 2011.
143Ibid.
144R. Rezaie et al (2008), “Brazilian health biotech – fostering
crosstalk between public and private sectors”, Nature
Biotechnology, VOLUME 26 NUMBER 6 JUNE 2008
145FINEP, Inovar: www.finep.gov.br/pagina.asp?pag=inovar
146R. Rezaie et al (2008), p. 634.
147Ibid. p. 634-36.
148Clinicaltrials.gov, Home, Find Studies, See Studies on a Map:
www.clinicaltrials.gov/ct2/search/map?map=SA
149Folha de S. Paulo (2014), “Grupo lanca iniciativa para fomentar
testes clinicos no Brasil”, April 10 2014: www1.folha.uol.com.br/
ciencia/2014/04/1438426-grupo-lanca-iniciativa-para-fomentartestes-clinicos-no-brasil.shtml
150Ibid. See also T Wilsdon et al (2012), p. 60.
151BIO (2012), “Proposal for Reform of Brazil’s Bioprospecting and
Genetic Resources, Regulations 18 November 2013”, p. 24.
152Ibid.
153T Kirchlechner (2013), “Biosimilar Regulatory Overview ANVISA
biosimilars workshop”, Brasilia, 25 June 2013, Sandoz, slide
presentation, slide
154CTNBio, Perguntas mais Frequentes (novo):
www.ctnbio.gov.br/index.php/content/view/18677.html
155C. Israel (2012), “INTERNATIONAL PATENT ISSUES:
PROMOTING A LEVEL PLAYING FIELD FOR AMERICAN
INDUSTRY ABROAD”, Statement before the HOUSE
COMMITTEE ON THE JUDICIARY SUBCOMMITTEE ON
INTELLECTUAL PROPERTY, COMPETITIONAND THE
INTERNET, US Congress, April 26 2012.
156 OECD (2012), p. 254.
157WIPO, (2011), World Intellectual Property Report 2011,
The Changing Face of Innovation, WIPO Geneva p. 151.
158G Dalmarco (2011), “Universities’ Intellectual Property: Path
for Innovation or Patent Competition?”, Journal of Technology
Management & Innovation, 2011, Volume 6, Issue 3.
159See: AH Oikawa (2013), “IP licensing in Brazil: what you need to
know”, World Intellectual Property Review, 1 June 2011; and F
Oliveira do Prado et al (2010), “Technology transfer in a public
Brazilian university”, Triple Helix in the Development of Cities of
Knowledge, Expanding Communities and Connecting Regions,
conference proceedings, 20-22 October 2010.
160Ibid.
161F Oliveira do Prado et al (2010), p. 12.
162See: Resolução CMED nº 4, de 15 de junho de 2005, publicada
no DOU, de 07/10/2005)
163PwC (2012), “Research and development in the BRICS”,
Global R&D Tax News, Issue No. 5, April 2012 p. 3
164US State Department (2013), “2013 Investment Climate
Statement – Brazil”, February 2013.
165Ibid.
166Ibid.
167World Justice Project (2014), Rule of Law Index 2014, p. 16.
168The Economist (2014), “Brazil’s new anti-corruption law,
Hard to read”, January 29 2014: www.economist.com/blogs/
schumpeter/2014/01/brazil-s-new-anti-corruption-law
169Times Higher Education World University Rankings 2013-2014
170World Bank, Data bank, Scientific and technical journal articles,
IP.JRN.ARTC.SC. “Scientific and technical journal articles refer
to the number of scientific and engineering articles published
in the following fields: physics, biology, chemistry, mathematics,
clinical medicine, biomedical research, engineering and
technology, and earth and space sciences.”
171National Science Foundation (2014), chapter 2, p. 39.
172Ibid.
173World Bank data bank, Researchers in R&D (per million people),
SP.POP.SCIE.RD.P6
174National Science Foundation (2014), ch. 4, p. 19.
175OECD
(2014), p. 21.
p. 32.
177OECD (2014), p. 83. Triadic patenting is generally considered to
be the best indicator of the perceived overall value and quality
of a patent. The patent application is filed in three separate
locations and filing costs are quite high. The three major
patenting offices in which protection is sought are: the European
Patent Office (EPO), the US Patent Office (USPTO) and the
Japanese Patent Office (JPO)
178Ibid. p. 85.
179J Carroll (2013), “Plotting Asia expansion, Amgen blueprints
plans for Shanghai research center”, fiercebiotech.com,
September 25, 2013.
180RDPAC and BIO (2013), Building a World-Class Innovative
Therapeutic Biologics Industry in China, p. 14-30.
181US National Institute of Health, clinicaltrials.gov
182 Nature,
“China’s budget backs science”, NATURE | VOL 483 |
15 MARCH 2012
183Ibid.
184Battelle and R&D Magazine (2013), 2014 GLOBAL R&D FUNDING
FORECAST, December 2013, p. 13.
185RDPAC and BIO (2013), p. 18.
186Ibid. p. 19.
187M Pugatch & D Torstensson (2010), Keeping Medicines Safe –
A Study of the Regulations Guiding the Approval of Medicines in
Emerging Markets, Stockholm Network London, pp. 22-5.
188GE Parker (2014), “Regulatory Approval of Biosimilars: a Global
Perspective”, Regulatory Focus, 16 January 2014: www.raps.org/
focus-online/news/news-article-view/article/4511/regulatoryapproval-of-biosimilars-a-global-perspective.aspx
189RDPAC and BIO (2013), p. 17.
190Ibid.
191USDA (2013), “Agricultural Biotechnology Annual”, Global
Agricultural Information Network, July 15 2013, GAIN number
13033, pp. 6-8
192Ibid. p. 13.
193Ibid.
194Graff, G.D. (2007), “Echoes of Bayh-Dole? A Survey of IP and
Technology Transfer Policies in Emerging and Developing
Economies” in Intellectual Property Management in Health and
Agricultural Innovation: A Handbook of Best Practices, (eds.
A Krattiger, RT Mahoney, L Nelsen, et al.). MIHR: Oxford, U.K,
p. 176.
195WIPO (2011), p. 151.
196Nezu, R. et al, (2007), Technology Transfer, Intellectual Property
Rights and University-Industry Partnerships: The Experience
of China, India, Japan, Philippines, the Republic of Korea,
Singapore and Thailand, p. 10, WIPO.
197Ibid.
198See Guo, H (2007), “IP Management at Chinese Universities”,
in Krattiger, A et al (eds)
199RDPAC and BIO (2013), p. 20.
200Ibid. pp. 16-8.
201OECD (2012), p. 266.
202Times Higher Education World University Rankings 2013-2014
203ScienceWatch.com, “Top 20 Countries in ALL FIELDS,
2001-August 31, 2011”:
http://archive.sciencewatch.com/dr/cou/2011/11decALL/
204Ibid.
205OECD (2014), p. 26
206World Bank data bank, Researchers in R&D (per million people),
SP.POP.SCIE.RD.P6
207National Science Foundation (2014), ch. 4, p. 19.
208National Science Foundation (2014), ch. 4, p. 19.
209Ibid.
210OECD (2012), p. 312.
211OECD stat, Triadic Patent families, total patents. Triadic
patenting is generally considered to be the best indicator of
the perceived overall value and quality of a patent. The patent
application is filed in three separate locations and filing costs are
quite high. The three major patenting offices in which protection
is sought are: the European Patent Office (EPO), the US Patent
Office (USPTO) and the Japanese Patent Office (JPO)
176Ibid.
71
Notes
212OECD
stat, Patent applications filed under the PCT,
Biotechnology, Total patents.
213Department of Biotechnology (2014), p. 16.
214Ibid.
215Business Standard (2013), “Drug makers pay lip service to R&D in
India”, June 12, 2013
216Ibid.
217E Langer (2014), “Biopharmaceutical Outsourcing Continues
to Expand”, Pharmaceutical Outsourcing, The Journal of
Pharamceutical and Biopharmaceutical Contract Services,
January 28 2014: www.pharmoutsourcing.com/FeaturedArticles/153801-Biopharmaceutical-Outsourcing-Continues-toExpand/
218Clinicaltrials.gov, www.clinicaltrials.gov/ct2/search/map/
click?map.x=546&map.y=212
219Novartis, Newsroom, “Glivec patent case in India”:
www.novartis.com/newsroom/product-related-info-center/
glivec.shtml
220See: IMS (2013), Securing IP and Access to Medicine: Is Oncology
the Next HIV?, IMS Consulting Group, London UK, p. 2.
221BIO (2012), The Comments of the Biotechnology Industry
Organization on India’s Draft National IPR Strategy as Prepared
by the Sectoral Innovation council in IPR”
222Asia Times, ’Fake drugs a bitter pill for India’, June 7 2008.
223See: D Torstensson & M Pugatch (2010), pp. 26-32.
224USDA (2013), “India, Biofuels Annual”, September 4 2013, p. 2.
225Department of Biotechnology (2014), p. 16.
226J Loeb (2012), “India’s new biosimilar guidelines and their
relationship to the rest of the world”, Lexology, July 16 2012.
227Ibid.
228WIPO (2011), p. 149.
229Ibid.
230Ibid.
231Ibid. p. 152.
232EU Commission, ERAWATCH, Platform on Research and
Innovation policies and systems, India, Knowledge Transfer
233B Sampat (2009), The Bayh-Dole Model in Developing Countries:
Reflections on the Indian Bill on Publicly Funded Intellectual
Property, Policy brief Number 5, October 2009, ICTSD-UNCTD.
234THE PROTECTION AND UTILISATION OF PUBLIC FUNDED
INTELLECTUAL PROPERTY BILL, 2008, Bill No. LXVI of 2008,
s5(1)(b).
235Department of Biotechnology (2014), p. 19.
236Ministry of Chemicals and Fertilizers, Department of
Pharmaceuticals (2013), “Drugs (Prices Control) Order, 2013”,
Gazette of India, Extraordinary, Part II, Section 3, Sub-section(ii)
May 15 2013.
237IHS (2013), “Indian government releases DPCO 2013, expanding
price controls to 652 drugs”, May 15 2013.
238B Barnes (2014), “Credible India: why India’s sweeping anticorruption reform is good for Business”, Lexology, March 5 2014
239Times Higher Education World University Rankings 2013-2014
240OECD (2013i), p. 37.
241OECD.Stat, Education Statistics, Graduates by Field of
Education, Life Sciences.
242OECD (2014), p. 26
243Ibid. p. 27
244National Science Foundation (2014), ch. 4, p. 19.
245OECD (2014), p. 21.
246Ibid.
247Ibid. p. 32.
248OECD.Stat, Education Statistics, Biotech R&D as a percentage of
BERD (Business enterprise R&D)
249US National Institute of Health, clinicaltrials.gov
250OECD (2014), p. 83.
251The Economist, (2011), “R&D Spending”, October 1 2011, p. 97.
252OECD (2014), p. 85.
253OECD.Stat, Research and Development Statistics, Business
enterprise R-D expenditure by industry and by source of funds
254Ministry of Food and Drug Safety, Bio Information, www.mfds.
go.kr/eng/index.do?nMenuCode=45 (accessed on 01/04/2014)
255OECD (2009i)
256USDA Foreign Agricultural Service: Global Information Network,
Biotechnology Annual Report 2012: Republic of Korea (2012)
72
257OECD
Stat, Science, Technology and Industry, Venture capital
investment
258IESE (2010), p. 19.
259Song, P. P., et al. Rare diseases, orphan drugs, and their
regulation in Asia: current status and future perspectives,
Intractable Rare Dis Res 1.1 (2012): 3-9
260BIO (2013), 2014 SPECIAL 301 SUBMISSION, p. 39.
261PhRMA (2013), PHARMACEUTICAL RESEARCH AND
MANUFACTURERS OF AMERICA (PhRMA) SPECIAL 301
SUBMISSION 2014, p. 59.
262T. Nomura et al (2013), “Features of IP rights Enforcement in
Korea and China”, IDE Discussion Paper No. 417, April 2013,
pp. 4-5.
263U.S. Food and Drug Administration, Global Engagement (2013),
p. 15.
264USDA Foreign Agricultural Service: Global Information Network,
Biotechnology Annual Report 2013: Republic of Korea (2013)
265Ibid.
266USDA Foreign Agricultural Service: Global Information Network,
Biotechnology Annual Report 2013: Republic of Korea (2013)
267WIPO (2007)
268Ministry of Trade, Industry & Energy, Technology Transfer and
Commercialization Promotion Act (2009)
269Lee Yoon-jun (2010), “R &D Policy in Korea Bringing university
technologies to markets”, Korea Herald, March 29 2010.
270OECD, OECD Science, Technology and Industry Outlook (2012),
p. 338
271ERAWATCH – Platform on Research and Innovation policies and
systems, Korea Institute for Advancement of Technology,
http://erawatch.jrc.ec.europa.eu/erawatch/opencms/
information/country_pages/kr/organisation/organisation_0009?
tab=template&country=kr (accessed on
272IHS (2012), “Pharmaceutical price cuts in South Korea in 2013”,
December 27, 2012.
273Korea Trade Promotion Corporation, Overview of Korea’s
Industries: Promoting Investment Opportunities (2008)
274The World Justice Project (2014), p. 53
275World Bank, Data bank, Scientific and technical journal articles,
IP.JRN.ARTC.SC. “Scientific and technical journal articles refer
to the number of scientific and engineering articles published
in the following fields: physics, biology, chemistry, mathematics,
clinical medicine, biomedical research, engineering and
technology, and earth and space sciences.”
276National Science Foundation (2014), chapter 2, p. 41
277OECD (2013i), p.37
278World Bank data bank, Researchers in R&D (per million people),
SP.POP.SCIE.RD.P6
279MON, “National research universities”, http://eng.mon.gov.ru/
pro/ved/niu/; MON, “Attracting leading scientists to Russian
universities”, 2011, http://eng.mon.gov.ru/pro/ved/uch/
280Government regulation N219, “Regarding state support of the
development of the innovative infrastructure in the federal
institutions of higher professional education”, 2020
281Thomson Reuters, Essential Science Indicators,
http://thomsonreuters.com/essential-scienceindicators/?subsector=research-management-and-evaluation
282OECD (2014), p.20
283Ibid., p.21
284Ibid., NB Brazil’s figure is for 2011 (National Science Foundation
(2014), ch. 4, p. 19)
285OECD (2014), pp.32-3
286Ibid., p.37
287OECD (2013ii), “Data Brief: Key Biotechnology &
Nanotechnology Indicators: A Comparison”, November 2013,
www.oecd.org/sti/biotech/KNI_KBI_Nov_2013.pdf
288Ibid.
289OECD (2014), p. 83.
290Ibid. p. 85.
291Russian Venture Company, “RVC Biofund”,
www.rusventure.ru/en/investments/biofund/index.php
292US National Institute of Health, www.clinicaltrials.gov
293Skolkovo, “Biomedical Cluster Factsheet”, 2013,
http://community.sk.ru/foundation/biomed/p/goals.aspx
Building the Bioeconomy Examining National Biotechnology Industry Development Strategies
294Skolkovo,
“Skolkovo Foundation Factsheet”, 2012,
http://community.sk.ru/foundation/biomed/p/goals.aspx
295ERAWATCH, “Russian Federation: Fiscal Policies”,
http://erawatch.jrc.ec.europa.eu/erawatch/opencms/
information/country_pages/ru/country?section=PolicyMix&subs
ection=FiscalPolicies
296Ibid., Deloitte (2013), Tax incentives in Russia: See what we see,
August 2013, p.3
297WIPO (2011), “Federal Service for Intellectual Property,
Patents and Trademarks (ROSPATENT) Russian Federation:
Exceptions and Limitations”, www.wipo.int/scp/en/exceptions/
replies/russia.html
298The Pharma Letter, “Novartis criticizes system of public
procurement tenders in Russia”, 9/28/2012,
www.thepharmaletter.com/article/novartis-criticizes-system-ofpublic-procurement-tenders-in-russia
299Federal Law No. 61-FZ, “Law on the Circulation of Medicines”,
4/12/2010
300USDA Foreign Agricultural Service (2013), Russian Federation:
Agricultural Biotechnology Annual
301AG Professional, “Russia approves cultivation of GMO crops”,
12/23/2013, www.agprofessional.com/news/Russia-approvescultivation-of-GMO-crops-237060651.html
302USDA Foreign Agricultural Service (2013), Russian Federation
302RT, “Total ban on GM food production mulled in Russia”,
2/3/2014, http://rt.com/politics/russia-gmo-foods-ban-567/
304Ibid.
305GOST R 52249-2009, National Standard of the Russian
Federation, Rules for the Production and Quality Control of
Pharmaceuticals – Good Manufacturing Practice for Medicinal
Products; Kommersant, “Pharmacists were given two years
probation “, 12/18/2013,
www.kommersant.ru/doc/2371020
306US-Russia Innovation Corridor, “Federal Law 217:
Commercializing University Research”,
www.usric.org/law-217.html
307Resolution of the Government of the Russian Federation dated
April 9, 2010 No 218 “ On measures of state support for the
development of cooperation of Russian higher education
institutions and organizations implementing complex projects
on high-tech production”
308Ministry of Education and Science, “Cooperation of universities
and industrial enterprises”
309Russian Technology Transfer Network, ”About RTTN”,
http://transfer.nichost.ru/about?lang=eng
310WIPO (2011ii), World Intellectual Property Report: The Changing
Face of Innovation, WIPO Economics and Statistics Series, p.149
311Ibid, p.180
312World Justice Project (2014), p.50
313Times Higher Education World University Rankings 2013-2014.
314RC DeVol et al (2006), Mind to Market: A Global Analysis of
University Biotechnology Transfer and Commercialization,
Milken Institute, p. 78.
315EDB (2014).
316Ibid.
317Ibid.
318National Science Foundation (2014), ch. 4, p. 19.
319OECD (2014), p. 21.
320Ibid.
321Ibid. p. 32.
322OECD (2013iii), “Singapore: innovation profile”, in Innovation in
Southeast Asia, OECD Publishing, p. 230.
323OECD (2014), p. 83.
324Ibid. p. 85.
325EDB (2014).
326Ibid.
327Ibid.
328Ibid.
329IESE (2010), p. 19.
330Cantab IP, IP Guides, Patent Tern Extensions for Pharma
Patents in Singapore, www.cantab-ip.com/Life-Sciences/
Pharmaceutical-Patent-Term-Extensions.html (accessed April
2014).
331Orphanet,
About orphan drugs, Orphan drugs in Singapore,
www.orpha.net/consor/cgi-bin/Education_AboutOrphanDrugs.
php?lng=EN&stapage=ST_EDUCATION_EDUCATION_
ABOUTORPHANDRUGS_SIN (accessed April 2014).
332HSA, Home, Health Products Regulation, About HPRG,
www.hsa.gov.sg/publish/hsaportal/en/health_products_
regulation/about_cda.html (accessed April 2014).
333A Gross (2014), “Singapore’s pharmaceutical industry 2014
update”, pharmaphorum, February 13 2014:
www.pharmaphorum.com/articles/singapores-pharmaceuticalindustry-2014-update
334USDA (2013), Singapore, Agricultural Biotechnology Annual,
July 17 2013.
335EDB (2014).
336OECD (2013iii), p. 230.
337A*STAR (2012), “Asia’s Innovation Capital Stepping Up Yearbook
2011/2012”, A*STAR, p.37.
338Nezuet al, (2007), p. 11.
339E&Y (2013), 2013 Asia-Pacific R&D incentives, p. 14.
340WJP (2014), WJP Rule of Law Index 2014, World Justice Project,
p. 45.
341Times Higher Education World University Rankings 2013-2014
342RC DeVol et al (2006), p. 79.
343Ibid. p. 91.
344OECD (2013i), p. 37
345OECD.Stat, Education Statistics, Graduates by Field of
Education, Life Sciences.
346OECD (2014), p. 26
347Ibid. p. 27
348National Science Foundation (2014), ch. 4, p. 19.
349OECD (2014), p. 21.
350Ibid.
351Ibid. p. 32.
352Swiss Biotech (2013), Report 2013, p. 6.
353US National Institute of Health, clinicaltrials.gov
354OECD (2014), p. 83.
355The Economist, (2011)
356Ibid. p. 85.
357Swissinfo.ch, “Recession fails to dent Swiss innovation drive”,
February 17 2010, www.swissinfo.ch/eng/business/Recession_
fails_to_dent_Swiss_innovation_drive.html?cid=8316340
358EFPIA, (2010), The Pharmaceutical Industry in Figures, p. 6
359Pharmtech.com, “Swiss Pharma Strength” , July 1 2011,
http://pharmtech.findpharma.com/pharmtech/Manufacturing/
Swiss-Pharma-Strength/ArticleStandard/Article/detail/728803
(Accessed September 2011)
360Ibid.
361Ibid.
362Roche Switzerland, Our Company,
363SNSF Annual Report 2012,pp. 24-32.
364Ibid.
365Y Pierrakis (2010), Venture Capital now and after the Dotcom
Crash, NESTA, London, pp. 6-7
366IESE (2010), p. 19.
367Swiss Federal Institute of Intellectual Property, Supplementary
Protection Certificate (SPC)
368NHS South East Coast, Health Policy Support Unit, (2008),
Overview of Current Policy for Orphan Drugs, June 2008, p. 56.
369Swiss Federal Office of Public Health and WHO, (2011),
Switzerland Pharmaceutical Country Profile, September 2011,
pp. 13-9.
370Swissinfo (2012) “Scientists’ findings don’t satisfy politicians”,
www.swissinfo.ch/eng/science_technology/Scientists_findings_
don_t_satisfy_politicians.html?cid=33604154
371http://www.kti.admin.ch/netzwerke/00194/index.html?lang=de
372swiTT, About swiTT, Mission: www.switt.ch/about_switt/mission/
373swiTT (2013), swiTTreport 2013, p. 5.
374A Conti & P Gaule (2009), “Are the US outperforming
Europe in University Technology Licensing?”, CEMIWORKINGPAPER-2009-003, EPFL CDM.
375Ibid. p. 9.
376Swiss Federal Office of Public Health and WHO, (2011), p. 9.
377OECD, Science Technology Industry, (2002) Tax Incentives for
Research and Development: Trends and Issues, 2002, pp. 21-2.
73
Notes
378Swiss
Customs Admnistration, Fuels from renewable
feedstocks (biofuels): www.ezv.admin.ch/zollinfo_
firmen/04020/04256/04263/04530/index.html?lang=en
379See for example Times Higher Education World University
Rankings 2013-2014 (Accessed March 2014):
www.timeshighereducation.co.uk/world-universityrankings/2013-14/world-ranking
380Ibid. Life Sciences
381RC DeVolet al (2006), p. 79.
382Ibid. p. 91.
383OECD (2013i), p. 37.
384Ibid.
385National Science Foundation (2014), chapter 2, p. 39.
386Ibid.
387OECD.Stat, Education Statistics, Graduates by Field of
Education, Life Sciences.
388National Science Foundation (2014), ch. 2, p. 41.
389OECD (2014), p. 26
390Ibid.
391National Science Foundation (2014), ch. 4, p. 19.
392OECD (2014), p. 21.
393Ibid.
394Ibid. p. 32.
395US National Institute of Health, clinicaltrials.gov. (Accessed
March 2014): www.clinicaltrials.gov/ct2/search/map
396Ibid.
397OECD (2014), p. 83.
398Ibid. p. 85.
399NIH, About NIH, www.nih.gov/about/budget.htm (Accessed
March 2014)
400Ibid.
401J Loscalzo (2006) “The NIH Budget and the Future of Biomedical
Research”, New England Journal of Medicine, 2006; 354:
pp. 1665-1667.
402California Healthcare Institute, BayBio and PwC, (2011),
California Biomedical Industry 2011 Report, p. 8
403Ibid. p. 4.
404Massachusetts Biotechnology Council, “Massachusetts by the
numbers”, 2009, www.massbio.org/economic_development/
the_massachusetts_supercluster/massachusetts_by_the_
numbers (Accessed September 2011)
405California Healthcare Institute et al, (2011), p. 17.
406National Venture Capital Association, (Accessed March 2014):
www.nvca.org/index.php?option=com_content&view=article&i
d=344&Itemid=103
407IESE, The Global Venture Capital and Private Equity
Attractiveness Index, 2013, (Accessed March 2014):
http://blog.iese.edu/vcpeindex/ranking-2013/
408M Pugatch, (2004), ICTSD-UNCTAID Dialogue on Ensuring Policy
Options for Affordable Access to Essential Medicines
409BIO (2011), “BIO Praises Final Passage of Patent Reform
Legislation”, September 8 2011.
410California Healthcare Institute et al, (2011), p. 17.
411F Lichtenberg & J Waldfogel (2009), “Does Misery Love
Company? Evidence from Pharmaceutical Markets Before and
After the Orphan Drug Act”, Michigan Telecommunications and
Technology Law Review, Vol.15, pp.335-357.
412W Yin (2007) Market Incentives and Pharmaceutical Innovation,
University of Chicago, Harris School 2007.
413See: BIO (2013), “Myriad Supreme Court Decision: BIO’s
Statement”, June 13 2013 and E Barraclough (2013), “What
Myriad means for biotech”, WIPO Magazine, August 2013.
414See: The Economist (2012), “Prometheus unsound”,
March 24 2012, and BIO (2012), “Mayo v. Prometheus: BIO
Statement on Supreme Court Decision”, March 20 2012.
415See for example D Torstensson and M Pugatch (2010)
416California Healthcare Institute (2011), p. 49.
417Ibid.
418Ibid.
419Ibid.
74
420USDA,
Biotechnology Regulatory Services / Permits,
Notifications, and Petitions / Petitions, Petition Process
Improvements, (Accessed March 2014):
www.aphis.usda.gov/wps/portal/aphis/ourfocus/biotechnology?
1dmy&urile=wcm%3apath%3a%2Faphis_content_library%2Fsa_
our_focus%2Fsa_biotechnology%2Fsa_permits_notifications_
and_petitions%2Fsa_petitions%2Fct_pet_proc_imp
421Ibid.
422Shane, S, (2004), “Encouraging university entrepreneurship?
The effect of the Bayh-Dole Act on university patenting in the
United States”, Journal of Business Venturing, 19, pp. 127151. See introduction to this article for a full discussion of the
academic debate over the effects of Bayh-Dole.
423L Pressman et al (2012), p. 3.
424Ibid.
425AUTM, 2012 Licensing Survey, (Accessed March 2014):
www.autm.net/FY2012_Licensing_Activity_Survey/12357.htm
426US Department of Commerce/International Trade
Administration, Pharmaceutical Price Controls in OECD
Countries: Implications for US Consumers, Pricing, Research and
Development and Innovation,
www.ita.doc.gov/td/chemicals/drugpricingstudy.pdf
(Accessed September 2011)
427Legal Information Institute, Cornell University, “26 U.S. Code §
41 – Credit for increasing research activities”, (Accessed March
2014): www.law.cornell.edu/uscode/text/26/41
428California Healthcare Institute (2011), p.18.
429Ibid.
Building the Bioeconomy Examining National Biotechnology Industry Development Strategies
75
Contact us
UK Office
88 Sheep Street, Bicester, Oxon OX26 6LP
Tel: +44 1869 244414 Fax: +44 1869 320173
Israel Office
80 Achad Haam St., Tel-Aviv, 65206
Tel: +972 3 6299294 Fax: +972 3 6204395
E: [email protected]
Follow us
For more information on our services, to read our research
reports or media coverage and for all the latest Pugatch
Consilium news, please take a look at our online news room
and blog or follow us on social media.
www.pugatch-consilium.com
Twitter@PConsilium
Download