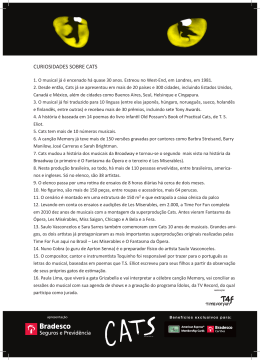
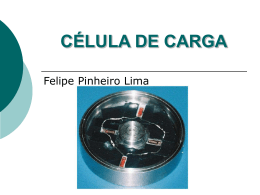
ADRIANA CRISTINA DA SILVA
STRAIN E STRAIN RATE LONGITUDINAL POR
MEIO DO SPECKLE TRACKING BIDIMENSIONAL
EM GATOS DOMÉSTICOS SADIOS E NÃO
SEDADOS
LAVRAS – MG
2012
ADRIANA CRISTINA DA SILVA
STRAIN E STRAIN RATE LONGITUDINAL POR MEIO DO SPECKLE
TRACKING BIDIMENSIONAL EM GATOS DOMÉSTICOS SADIOS E NÃO
SEDADOS
Dissertação apresentada à Universidade
Federal de Lavras, como parte das
exigências do Programa de PósGraduação em Ciências Veterinárias,
área de concentração em Clínica,
Cirurgia e Patologia Veterinária, para a
obtenção do título de Mestre.
Orientadora
Profa. Dra. Ruthnéa Aparecida Lázaro Muzzi
Coorientadores
Prof. Dr. Leonardo Augusto Lopes Muzzi
Prof. Dr. Rodrigo Bernardes Nogueira
LAVRAS – MG
2012
Ficha Catalográfica Preparada pela Divisão de Processos Técnicos da
Biblioteca da UFLA
Silva, Adriana Cristina da.
Strain e strain rate longitudinal por meio do speckle tracking
bidimensional em gatos domésticos sadios e não sedados / Adriana
Cristina da Silva. – Lavras : UFLA, 2012.
58 p. : il.
Dissertação (mestrado) – Universidade Federal de Lavras, 2012.
Orientador: Ruthnéa Aparecida Lázaro Muzzi..
Bibliografia.
1. Felinos. 2. Cardiopatia. 3. Ecocardiografia. 4. Strain. I.
Universidade Federal de Lavras. II. Título.
CDD – 636.08961207543
ADRIANA CRISTINA DA SILVA
STRAIN E STRAIN RATE LONGITUDINAL POR MEIO DO SPECKLE
TRACKING BIDIMENSIONAL EM GATOS DOMÉSTICOS SADIOS E NÃO
SEDADOS
Dissertação apresentada à Universidade
Federal de Lavras, como parte das
exigências do Programa de PósGraduação em Ciências Veterinárias,
área de concentração em Clínica,
Cirurgia e Patologia Veterinária, para a
obtenção do título de Mestre.
APROVADA em 28 de fevereiro de 2012.
Prof. Dr. Gregório Corrêa Guimarães
UFLA
Prof. Dr. Rodrigo Bernardes Nogueira
UFLA
Prof. Dr. Leonardo Augusto Lopes Muzzi
UFLA
Prof. Dr. Antônio Carlos Cunha Lacreta Júnior
UFLA
Profa. Dra. Ruthnéa Aparecida Lázaro Muzzi
Orientadora
LAVRAS – MG
2012
Aos meus pais, José e Rosa,
por me ensinarem o valor
das pequenas coisas,
DEDICO
AGRADECIMENTOS
Agradeço a Deus, por me permitir vencer mais esta etapa e conquistar,
durante o caminho, amigos de quem jamais me esquecerei.
A meus irmãos e irmãs, que partilharam comigo muitas felicidades e
dificuldades encontradas.
Ao meu amor, amigo e companheiro, Guilherme, que esteve comigo em
todos estes momentos, com muita paciência e carinho, partilhando cada
conquista e temor, me incentivando sempre a buscar meus sonhos. E à sua
família, que também considero como minha, pelo apoio e consideração.
À professora Ruthnéa, a quem considero mais do que uma orientadora e
sim uma amiga e um exemplo, como pessoa e como profissional, pela confiança,
apoio e por partilhar conosco seu conhecimento.
Aos amigos que sempre estiveram presentes em algum momento e que
torceram para que tudo fosse perfeito, em especial meus companheiros de
mestrado, Gisele, Rosane e Matheus, por estarem ao meu lado, mesmo nos
arranhões e miados, pelos risos e lágrimas que juntos partilhamos. E aos colegas
residentes do HV UFLA e alunos, que se mostraram sempre prontos a nos
ajudar.
Aos membros da banca examinadora, professores Gregório, Rodrigo,
Leonardo e Lacreta, por aceitarem o convite, pela disponibilidade e por
compartilharem seu conhecimento.
Ao Departamento de Medicina Veterinária e ao Programa de PósGraduação em Ciências Veterinárias, por propiciarem o desenvolvimento do
projeto e pela oportunidade de aprendizado.
À Universidade Federal de Lavras, por sempre acolher seus alunos com
braços de mãe.
À Coordenação de Aperfeiçoamento de Pessoal de Nível Superior
(CAPES), pelo suporte financeiro durante a realização do projeto.
Aos proprietários dos gatos, que prontamente se dispuseram a nos ajudar
E a todos os gatos que participaram do projeto. Todos foram “gracinhas” para
mim.
Aos meus gatos, Pretinha, Batata, Toninho e Neném, por estarem em
minha vida e ajudarem a despertar o imenso amor que tenho pelos felinos.
“Um gato vive um pouco nas poltronas, no cimento ao sol,
no telhado sob a lua. Vive também sobre a mesa do
escritório, e o salto preciso que ele dá para atingi-la é mais
do que impulso para a cultura. É o movimento civilizado
de um organismo plenamente ajustado às leis físicas, e que
não carece de suplemento de informação. Livros e papéis
beneficiam-se com a sua presteza austera. Mais do que a
coruja, o gato é símbolo e guardião da vida intelectual."
Carlos Drummond de Andrade
RESUMO
A ecocardiografia tem se tornado um dos métodos diagnósticos mais
importantes em cardiologia veterinária. Dessa forma, novas ferramentas
incorporadas à ecocardiografia, como o Doppler tecidual e, mais recentemente, o
speckle tracking bidimensional, têm auxiliado no diagnóstico definitivo assim
como na determinação do prognóstico das alterações cardíacas. O speckle
tracking é uma ferramenta já consolidada e validada em medicina humana,
sendo utilizada em diversas cardiopatias. Em medicina veterinária, o uso dessa
ferramenta já foi demonstrado em cães e equinos. No entanto, por ser recente,
ainda não abrange várias espécies, havendo poucas informações ou, mesmo,
ausência delas em felinos domésticos. Diante disso, o presente trabalho foi
realizado com o objetivo de demonstrar o uso da ferramenta speckle tracking
bidimensional em gatos, de forma a estabelecer valores de referência e
padronizar a técnica em felinos domésticos saudáveis não sedados. Para isso,
foram utilizados 30 gatos clinicamente saudáveis e não sedados, dos quais foram
obtidos
pressão
arterial
sistólica,
eletrocardiograma
(ECG)
e
ecoDopplercardiografia. Três a cinco ciclos cardíacos consecutivos utilizando
ECG contínuo foram armazenados em formato digital para posterior avaliação
off-line. Os cine loops foram obtidos a partir da vista apical quatro câmaras
esquerda e seis mensurações, utilizando o software do speckle tracking, foram
obtidas em dois diferentes cine loops (três medidas para cada cine loop) ao final
da sístole para todas as variáveis estudadas e, então, a média foi calculada. A
função miocárdica longitudinal foi avaliada e as variáveis strain (%), strain rate
(1/s), velocidade (cm/s) e deslocamento (mm) longitudinais foram obtidas,
demonstrando os seguintes valores -15,65±5,46, -1,80±0,59, 1,41±0,87,
1,27±0,80, respectivamente. Dessa forma, o presente estudo auxilia na melhor
compreensão da função miocárdica em felinos domésticos.
Palavras-chave: Cardiopatia. Ecocardiografia. Felinos. Strain.
ABSTRACT
Echocardiography has become one of the most important diagnostic
methods in veterinary cardiology. Thus, new tools incorporated into
echocardiography such as tissue Doppler and, more recently two-dimensional
speckle tracking has been assisting in the definitive diagnosis, as well as in
determining the prognosis of cardiac diseases. The speckle tracking is a wellestablished and validated tool in human medicine and is used in several heart
diseases. In veterinary medicine its use has been demonstrated in dogs and
horses. However, its use is recently applied to veterinary, given that, there is
little species being studied with speckle tracking. Regarding felines, there is
little or even absence of information about the use of this tool in domestic cats.
Thus, the present work aimed to demonstrate the use of the two-dimensional
speckle tracking echocardiography, in order to establish preliminary reference
range and the technique in healthy non-sedated cats. For this purpose, were used
30 clinically healthy non-sedated cats, which were obtained the systolic blood
pressure, electrocardiogram (ECG), and Doppler echocardiography. Three to 5
consecutive heart cycles using a continuous monitoring ECG were stored in
digital format on a workstation for off-line analysis. Cine loops were acquired
from left apical four chamber view and 6 measurements using speckle tracking
software were obtained in two different Cine loops (3 measurements for each
Cine loop) at end-systole for all studied variables and then average was
calculated. Myocardial longitudinal function was evaluated and the variables
longitudinal Strain (%) Strain Rate (1/s), velocity (cm/s) and displacement (mm)
were obtained, showing the values -15.65 ± 5.46, -1.80 ± 0.59, 1.41 ± 0.87, 1.27
± 0.80, respectively. Thus, the present study helps in the better understanding of
myocardial function in cats.
Keywords: Cardiopathy. Echocardiography. Felines. Strain.
LISTA DE FIGURAS
PRIMEIRA PARTE
Figura 1
Padrão de speckles em escala de cinza em imagem
bidimensional.
Pontos
acústicos
(speckles)
são
identificados na região de interesse. A posição relativa
dos pontos é, então, rastreada quadro a quadro (taxa de
frames/s), de acordo com a movimentação do miocárdio.
dY:
deslocamento
dos
pontos;
dX:
tempo
de
deslocamento. Fonte: Suffoletto e Herszkowicz (2006).....
Figura 2
Esquema
demonstrando
a
deformação
18
miocárdica
longitudinal, radial, circunferencial e cisalhamento (shear
strain). Fonte: Dell Castilho e Herszkowicz (2008)...........
21
SEGUNDA PARTE
Fig 1.
Figures illustrating myocardial tracking in a cat. (A) 2D
Apical Four chamber view in a non-sedated healthy cat,
demonstrating myocardial tracking process and velocity
vectors by STE; (B) 2D-STE analysis of left ventricular
epicardial longitudinal strain in a healthy cat. The
myocardium is automatically divided into 6 segments:
Basal (Bas Sept), Middle (Mid Sept) and Apical (Apic
Sept) segments for the interventricular septum and Basal
(Bas Lat), Middle (Mid Lat) and Apical (Apic Lat) lateral
segments for the left ventricular posterior wall…………..
51
Fig 2.
Graphical illustration of segmental differences of 2D STE
measurements of LV longitudinal function in non-sedated
healthy cats (n=30). The line near the middle of the box
indicates the middle half of the observations, the top and
the bottom of the box indicates the upper and lower
quartile, and the whiskers corresponds to the range of
observations
(smallest
and
largest
observations,
respectively). Boxes marked with different letters are
significantly different from each other to Mann-Whitney
test (P<0.05)………………………………………...…….
52
LISTA DE TABELAS
SEGUNDA PARTE
Table 1
Demographic data (age, weight, heart rate, gender and
breed) and systolic blood pressure in non-sedated healthy
cats (n = 30)……………………………………………….
Table 2
Data of main conventional echocardiographic variables in
non-sedated healthy cats (n = 30)………………………...
Table 3
53
54
Values of global, endocardial and epicardial regions of
longitudinal strain, strain rate, displacement and velocity,
displayed as mean ± standard deviation of healthy cats
(n=30)…………………………………………....…..
Table 4
55
Values of segmental and averaged longitudinal strain,
strain rate, displacement and velocity, displayed as mean
± standard deviation of healthy cats (n=30)…………
Table 5
56
Table displays the value of between-day intraobserver variability (%)……………………………...
57
DT
ECG
ROI
ST
St
StR
VE
2D
LISTA DE ABREVIATURAS
Doppler tecidual
Eletrocardiograma
Região de interesse
Speckle tracking
Strain
Strain rate
Ventrículo esquerdo
Bidimensional
LISTA DE SÍMBOLOS
%
1/s
cm/s
mm
±
Porcentagem
Um dividido por Segundo
Centímetros por Segundo
Milímetros
Mais ou menos
SUMÁRIO
1
2
2.1
2.2
2.2.1
3
PRIMEIRA PARTE ..............................................................................15
INTRODUÇÃO......................................................................................15
REFERENCIAL TEÓRICO ................................................................16
Ecocardiografia......................................................................................16
Ecocardiografia speckle tracking bidimensional .................................18
Strain e strain rate bidimensional .........................................................20
CONSIDERAÇÕES GERAIS ..............................................................23
REFERÊNCIAS.....................................................................................24
SEGUNDA PARTE ...............................................................................30
ARTIGO - Longitudinal strain and strain rate by two-dimensional
speckle tracking in non-sedated healthy cats ......................................31
ANEXO ...................................................................................................58
15
PRIMEIRA PARTE
1 INTRODUÇÃO
O felino doméstico (Felis catus) vem se tornado um dos animais de
companhia mais populares no mundo. Este fato leva a uma demanda crescente
por atendimento veterinário especializado para a espécie. Além disso, há um
aumento na longevidade destes animais e, com isso, o surgimento de doenças até
recentemente pouco diagnosticadas na rotina.
As cardiopatias em felinos têm recebido grande interesse, uma vez que
estes são modelos experimentais para algumas alterações que ocorrem em
humanos. Assim, o entendimento da fisiopatologia dessas afecções nesta espécie
corrobora para o desenvolvimento não apenas da cardiologia veterinária, mas
também da área cardiológica humana.
Neste contexto, a ecocardiografia tem se tornado um dos métodos
diagnósticos mais importantes na cardiologia veterinária. O desenvolvimento de
novas ferramentas, como o speckle tracking (ST), tem auxiliado tanto no campo
clínico quanto experimental, uma vez que pode fornecer o diagnóstico
definitivo, de forma não invasiva e muitas vezes precoce, das alterações
cardíacas.
Em nosso país, a medicina de felinos ainda é uma área em ascensão e
que cada vez mais pesquisas em torno desta espécie têm sido desenvolvidas.
O presente estudo foi realizado com o objetivo de avaliar, por meio da
ecocardiografia bidimensional (2D) ST, a deformação miocárdica ventricular
esquerda pela mensuração do strain (St) e do strain rate (StR) longitudinal,
obtidos em diversos segmentos miocárdicos em felinos clinicamente saudáveis e
não sedados, uma vez que não há dados semelhantes relatados na literatura.
16
2 REFERENCIAL TEÓRICO
2.1 Ecocardiografia
Durante os últimos anos, a ecocardiografia transtorácica tem se tornado
uma das ferramentas de imagem mais importantes para o diagnóstico não
invasivo e o manejo clínico adequado das doenças cardiovasculares em
pequenos animais. Avanços mais recentes em ultrassonografia como o Doppler
tecidual (DT) e o ST, têm acrescentado novos parâmetros para a avaliação da
função miocárdica, incluindo velocidade regional e deformação, torsão
ventricular e sincronia mecânica (CHETBOUL, 2010).
Em relação aos felinos, o exame ecocardiográfico é essencial para a
avaliação de doenças cardíacas, especialmente animais com suspeita de doença
miocárdica adquirida. Este exame é também indicado em casos suspeitos de
doenças cardíacas congênitas ou, mesmo, quando alterações são observadas à
auscultação, no eletrocardiograma (ECG) ou em outros exames auxiliares
(BONAGURA, 2000).
Várias modalidades ecocardiográficas são utilizadas nas doenças
cardíacas
em
felinos
(BONAGURA,
2000),
como
a
ecocardiografia
convencional (modo-M, 2D, Doppler clássico espectral e mapeamento de fluxo a
cores) e novas modalidades do Doppler (tecidual, St e StR) (ABBOTT;
MACLEAN, 2006; BOON, 2011a, 2011b, 2011c; WESS; SARKAR;
HARTMANN, 2010).
O modo-M e o 2D são utilizados para se obter o diâmetro das câmaras
cardíacas e a espessura do septo interventricular e parede ventricular, além da
avaliação qualitativa do movimento e função. Estes métodos, associados ao
Doppler, podem fornecer uma mensuração mais detalhada do miocárdio
(BONAGURA, 2000).
17
O DT é uma técnica ecocardiográfica que permite a quantificação da
função miocárdica global e regional por meio de medidas de velocidade
miocárdica em tempo real (CHETBOUL, 2002, 2010; SIMPSON et al., 2007).
As modalidades do DT pulsado e modo-M em cores têm demonstrado serem
ferramentas sensíveis para se detectar doença miocárdica em felinos (KOFFAS
et al., 2006, 2008; MACDONALD et al., 2006).
Em gatos com cardiomiopatia hipertrófica, em alguns estudos foi
demonstrado que o DT foi capaz de fornecer o diagnóstico precoce da doença,
mesmo na presença de hipertrofia em grau leve ou ausente (CHETBOUL et al.,
2006a, 2006b; SIMPSON et al., 2007). Por sua vez, em cães com doença crônica
da valva mitral, Schober et al. (2010) demonstraram que novos índices obtidos a
partir do DT foram capazes de predizer a ocorrência de insuficiência cardíaca
congestiva nos animais estudados.
Segundo Pavlopoulos e Nihoyannopoulos (2008), St e StR miocárdico
são definidos como a magnitude de encurtamento ou alongamento das fibras
cardíacas (%) e a taxa em que esta deformação ocorre (1/s). Estes são
considerados novos índices incorporados à medicina veterinária (CHETBOUL,
2010). St e StR obtidos a partir do DT foram capazes de demonstrar alterações
miocárdicas em felinos com cardiomiopatia hipertrófica, mesmo quando os
índices ecocardiográficos convencionais estavam dentro da normalidade (WESS
et al., 2010). No entanto, entre as limitações desta técnica está a dependência da
translação cardíaca e do ângulo de insonação, uma vez que o alinhamento
incorreto do feixe ultrassônico com a parede miocárdica pode influenciar os
resultados obtidos (CHETBOUL et al., 2007). Além disso, incorporação de
ruídos, reverberação de artefatos, limitação relativa à resolução lateral, aliasing
e inadequada taxa de repetição de quadros (frame rate) constituem os principais
desafios da técnica (PAVLOPOULOS; NIHOYANNOPOULOS, 2008).
18
2.2 Ecocardiografia speckle tracking bidimensional
A ecocardiografia 2D ST é uma das mais recentes ferramentas de
ultrassonografia que permitem o acesso à função miocárdica, utilizadas em
medicina veterinária (CHETBOUL, 2010). Esta técnica de imagem é baseada no
rastreamento de pontos criados pela interferência entre o feixe ultrassonográfico
e o miocárdio em imagens ecocardiográficas 2D em escala de cinza. Estes
speckles aparecem como elementos (pontos) pequenos e brilhantes dentro do
miocárdio e representam marcadores acústicos teciduais naturais que podem ser
monitorados (tracking) momento a momento, durante todo o ciclo cardíaco
(Figura 1) (CHETBOUL, 2010; HOOGE, 2007).
FIGURA 1 Padrão de speckles em escala de cinza em imagem bidimensional. Pontos
acústicos (speckles) são identificados na região de interesse. A posição
relativa dos pontos é, então, rastreada quadro a quadro (taxa de frames/s), de
acordo com a movimentação do miocárdio. dY: deslocamento dos pontos;
dX: tempo de deslocamento. Fonte: Suffoletto e Herszkowicz (2006)
Ao contrário do DT, a ecocardiografia 2D ST permite a mensuração das
deformações miocárdicas em sentido longitudinal e circunferencial pelos cortes
19
apical quatro câmaras e paraesternal eixo curto do ventrículo esquerdo (VE),
uma vez que não há restrições quanto ao ângulo de insonação. Além disso, os
pontos acústicos rastreados são representados por vetores de velocidade, que
permitem observar a direção e a intensidade do movimento (DEL CASTILLO;
HERSZKOWICZ, 2008). No entanto, este método ecocardiográfico também
possui algumas limitações, como resolução lateral em regiões miocárdicas
distantes, pontos fora do plano miocárdico, reverberações e, sobretudo, a
qualidade da imagem 2D, que deve ser acima da média (PAVLOPOULOS;
NIHOYANNOPOULOS, 2008).
Nos últimos anos, a técnica 2D ST tem sido aplicada intensamente em
medicina e seus resultados validados com a ressonância magnética marcada e
sonomicrometria, técnicas consideradas padrão para a obtenção da deformação
miocárdica. Foi demonstrado que os valores encontrados eram semelhantes aos
obtidos através do 2D ST (AMUNDSEN et al., 2006; GOFFINET et al., 2009).
Esta ferramenta tem sido empregada na obtenção de valores de referência em
humanos saudáveis (HURLBURT et al., 2007) e em portadores de diversas
alterações cardíacas, como cardiomiopatia hipertrófica ou dilatada, embolismo
pulmonar, torção ventricular, sincronia e avaliação da resposta à terapia de resincronização cardíaca (DELGADO et al., 2008; MELUZIN et al., 2011;
OPDAHL et al., 2008; SERRI et al., 2006; SUFFOLETTO et al., 2006;
TAKAMURA et al., 2011).
Em medicina veterinária, a ecocardiografia 2D ST tem sido utilizada em
cães, para se obter o St e StR, assim como a torção e a sincronia miocárdicas,
tanto em animais saudáveis para se estabelecer valores de referência e
padronizar a técnica (CHETBOUL et al., 2007, 2008; GRIFFTHS; FRANSIOLI;
CHIGERWE, 2011; WESS et al., 2011), como em animais cardiopatas
(TAKANO et al., 2011). Em equinos, esta ferramenta tem sido aplicada na
avaliação miocárdica, obtendo-se valores de referência em repouso e em
20
exercício (DECLOEDT et al., 2011; SCHEFER et al., 2010). No entanto, há
pouca informação na literatura sobre o uso desta ferramenta em gatos
domésticos (RIESEN et al., 2011), assim como valores de referência para St,
StR longitudinal, radial ou circunferencial, além de torsão ventricular, sincronia
e outras aplicações já validadas em outras espécies.
2.2.1 Strain e strain rate bidimensional
Vários trabalhos têm sido desenvolvidos utilizando-se as variáveis St e
StR obtidas pela ecocardiografia 2D ST, em humanos (DELGADO et al., 2008;
OPDAHL et al., 2008; SERRI et al., 2006; SUFFOLETTO et al., 2006;
TAKAMURA et al., 2011) e na área da cardiologia veterinária (CHETBOUL et
al., 2007; TAKANO et al., 2011; WESS et al., 2011). Estas variáveis têm grande
importância, uma vez que podem ser consideradas novos índices sistólicos que
podem, muitas vezes, predizer alterações miocárdicas, mesmo antes de serem
observadas na ecocardiografia convencional (ARTIS et al., 2008).
As variáveis de deformação miocárdica St e StR são diretamente
dependentes da disposição das fibras miocárdicas e esta deformação ocorre no
sentido destas, podendo ser longitudinal, radial, circunferencial ou em
cisalhamento (DEL CASTILLO; HERSZKOWICZ, 2008).
O St longitudinal é representado pela deformação que ocorre no
miocárdio entre o anel mitral e o ápice cardíaco, ou seja, no eixo longitudinal.
Por sua vez, o St radial é aquele que ocorre pelo espessamento da parede
ventricular e septal durante a sístole. O St circunferencial ocorre devido à
rotação do miocárdio em torno de seu eixo longitudinal. E, por último, o St de
cisalhamento é aquele formado pelo deslocamento do endocárdio em relação ao
epicárdio (Figura 2) (GEYER et al., 2010).
21
FIGURA 2 Esquema demonstrando a deformação miocárdica longitudinal, radial,
circunferencial e cisalhamento (shear strain). Fonte: Dell Castilho e
Herszkowicz (2008)
Em cães, Wess et al. (2011) demonstraram que os valores St e StR
longitudinais, obtidos tanto pela ecocardiografia 2D ST quanto pelo DT, são
semelhantes e com pouca variação inter e intraobservador. Dessa forma, os dois
métodos podem ser utilizados alternadamente, de acordo com a disponibilidade
destas ferramentas na rotina da clínica cardiológica. No entanto, o 2D ST
apresenta a vantagem de maior facilidade e rapidez em sua execução, além de
menor influência de fatores, como o ângulo de insonação nos resultados.
Em eqüinos, a ecocardiografia 2D ST demonstrou ser uma técnica
confiável para se obter o St e o StR longitudinal, além de velocidade e
deslocamento (DECLOEDT et al., 2011). Por sua vez, em humanos, o St
longitudinal demonstrou ser mais adequado como índice prognóstico em várias
alterações como em doenças valvares, além de auxiliar como indicativo de
disfunção ventricular esquerda (LANCELLOTTI et al., 2008; MARCINIAK et
al., 2009; MIZUGUCHI et al., 2008).
22
Em cães, a técnica do 2D ST foi padronizada para o corte paraesternal
eixo curto por Chetboul et al. (2007), que quantificaram o St e StR radial em
cães saudáveis e não sedados, além de comparar os valores obtidos com o DT,
tendo sido observada semelhança entre eles. Além disso, em humanos, foi
demonstrado, por Delgado et al. (2008), que o St radial é o melhor método para
se avaliar a resposta em pacientes submetidos à terapia de ressincronização
cardíaca, quando comparado ao St longitudinal e circunferencial.
Quanto às variáveis St e StR circunferenciais, em um estudo em paciente
humano tratado para insuficiência cardíaca com marcapasso, foi demonstrado
que, apesar de o DT mostrar velocidade radial e longitudinal sincronizada, o St e
o StR mostraram uma disparidade persistente, fato que poderia ser justificado
como uma possível melhora não sustentada do desempenho sistólico do VE no
paciente em questão (VANNAN et al., 2005).
Em outro estudo em humanos, identificou-se significante correlação
entre o St circunferencial e a fração de encurtamento na região média
miocárdica, obtida pela ressonância magnética cardíaca ou modo-M, podendo
atuar, dessa forma, como um índice prognóstico em casos de doença cardíaca
hipertensiva e disfunção sistólica intramural, assim como a fração de ejeção
(HURLBURT et al., 2007).
23
3 CONSIDERAÇÕES GERAIS
Diante do exposto, a ecocardiografia 2D ST tem demonstrado ser de
grande utilidade no diagnóstico das cardiomiopatias, tanto em humanos quanto
em medicina veterinária. Diversos estudos demonstram a importância de St e
StR como novos índices sistólicos para a avaliação da função miocárdica
ventricular esquerda. No entanto, sua viabilidade e sensibilidade ainda não
foram demonstradas em gatos domésticos. Dessa forma, o presente estudo atua
de modo a colaborar para o melhor entendimento desta ferramenta e suas
variáveis e seu papel na cardiologia de felinos, além de padronizar a técnica e
fornecer valores de referência para o St e o StR obtidos por meio do 2D ST nesta
espécie.
24
REFERÊNCIAS
ABBOTT, J. A.; MACLEAN, H. N. Two-dimensional echocardiographic
assessment of the feline left atrium. Journal of Veterinary Internal Medicine,
Philadelphia, v. 20, n. 1, p. 111-119, Jan./Feb. 2006.
AMUNDSEN, H. et al. Noninvasive myocardial strain measurement by speckle
tracking echocardiography: validation against sonomicrometry and tagged
magnetic resonance imaging. Journal of the American College of Cardiology,
San Diego, v. 47, n. 4, p. 789-793, Feb. 2006.
ARTIS, N. J. et al. Two-dimensional strain imaging: a new echocardiographic
advance with research and clinical applications. International Journal of
Cardiology, Amsterdam, v. 123, n. 3, p. 240-248, Jan. 2008.
BONAGURA, J. D. Feline echocardiography. Journal of Feline Medicine and
Surgery, London, v. 2, n. 3, p. 147-151, Sept. 2000.
BOON, J. A. Evaluation of size, function, and hemodynamics. In: ______.
Veterinary echocardiography. 2nd ed. Iowa: Wiley-Blackwell, 2011a. p. 153266.
______. The M-mode and Doppler examination. In: ______. Veterinary
echocardiography. 2nd ed. Iowa: Wiley-Blackwell, 2011b. p. 101-152.
______. The two-dimensional echocardiographic exam. In: ______. Veterinary
echocardiography. 2nd ed. Iowa: Wiley-Blackwell, 2011c. p. 37-100.
CHETBOUL, V. Advanced techniques in echocardiography in small animals.
Veterinary Clinics Small Animal, Philadelphia, v. 40, n. 4, p. 529-543, July
2010.
25
CHETBOUL, V. Tissue Doppler imaging: a promising technique for quantifying
regional myocardial function. Journal of Veterinary Cardiology, Bern, v. 4, n.
2, p. 7-12, Nov. 2002.
CHETBOUL, V. et al. Noninvasive assessment of systolic left ventricular
torsion by 2-dimensional speckle tracking imaging in the awake dog:
repeatability, reproducibility, and comparison with tissue Doppler imaging
variables. Journal of Veterinary Internal Medicine, Philadelphia, v. 22, n. 2,
p. 342-350, Mar./Apr. 2008.
______. Radial strain and strain rate by two-dimensional speckle tracking
echocardiography and the tissue velocity based technique in the dog. Journal of
Veterinary Cardiology, Bern, v. 9, n. 2, p. 69-81, Nov. 2007.
______. Tissue Doppler imaging for detection of radial and longitudinal
myocardial dysfunction in a family of cats affected by dystrophin-deficient
hypertrophic muscular dystrophy. Journal of Veterinary Internal Medicine,
Philadelphia, v. 20, n. 3, p. 640-647, May/June 2006a.
______. Two-dimensional color tissue Doppler imaging detects myocardial
dysfunction before occurrence of hypertrophy in a young Maine coon cat.
Veterinary Radiology & Ultrasound, Raleigh, v. 47, n. 3, p. 295-300,
May/June 2006b.
DECLOEDT, A. et al. Quantification of left ventricular longitudinal strain, strain
rate, velocity, and displacement in healthy horses by 2-dimensional speckle
tracking. Journal of Veterinary Internal Medicine, Philadelphia, v. 25, n. 2, p.
330-338, Mar./Apr. 2011.
DEL CASTILLO, J. M.; HERSZKOWICZ, N. Strain bidimensional (X-Strain):
utilização do método para avaliação de cardiopatias. Revista Brasileira de
Ecocardiografia, São Paulo, v. 21, n. 3, p. 29-35, jul./set. 2008.
26
DELGADO, V. et al. Assessment of left ventricular dyssynchrony by speckle
tracking strain imaging comparison between longitudinal, circumferential, and
radial strain in cardiac resynchronization therapy. Journal of the American
College of Cardiology, San Diego, v. 51, n. 20, p. 1944-1952, May 2008.
GEYER, H. et al. Assessment of myocardial mechanics using speckle tracking
echocardiography: fundamentals and clinical applications. Journal of the
American Society of Echocardiography, Morrisville, v. 23, n. 4, p. 351-359,
Apr. 2010.
GOFFINET, C. et al. Assessment of subendocardial vs. subepicardial left
ventricular rotation and twist using two-dimensional speckle tracking
echocardiography: comparison with tagged cardiac magnetic resonance.
European Heart Journal, Oxford, v. 30, n. 5, p. 608-617, Mar. 2009.
GRIFFITHS, L. J.; FRANSIOLI, J. R.; CHIGERWE, M. Echocardiographic
assessment of interventricular and intraventricular mechanical synchrony in
normal dogs. Journal of Veterinary Cardiology, Bern, v. 13, n. 2, p. 115-126,
June 2011.
HOOGE, J. d’. Principles and different techniques for speckle tracking. In:
MARWICK, T. H.; YU, C. M.; SUN, J. P. (Ed.). Myocardial imaging: tissue
doppler and speckle tracking. Massachusetts: Blackwell, 2007. p. 17-25.
HURLBURT, H. M. et al. Direct ultrasound measurement of longitudinal,
circumferential, and radial strain using 2-dimensional strain imaging in normal
adults. Echocardiography, Gardendale, v. 24, n. 7, p. 723-731, Aug. 2007.
KOFFAS, H. et al. Colour M-mode tissue Doppler imaging in healthy cats and
cats with hypertrophic cardiomyopathy. Journal of Small Animal Practice,
Oxford, v. 49, n. 7, p. 330-338, July 2008.
______. Pulsed tissue Doppler imaging in normal cats and cats with
hypertrophic cardiomyopathy. Journal of Veterinary Internal Medicine,
Philadelphia, v. 20, n. 1, p. 65-77, Jan./Feb. 2006.
27
LANCELLOTTI, P. et al. Importance of left ventricular longitudinal function
and functional reserve in patients with degenerative mitral regurgitation:
assessment by two-dimensional speckle tracking. Journal of the American
Society of Echocardiography, Morrisville, v. 21, n. 12, p. 1331-1336, Dec.
2008.
MACDONALD, K. A. et al. Tissue Doppler imaging and gradient echo cardiac
magnetic resonance imaging in normal cats and cats with hypertrophic
cardiomyopathy. Journal of Veterinary Internal Medicine, Philadelphia, v.
20, n. 3, p. 627-634, May/June 2006.
MARCINIAK, A. et al. Myocardial deformation abnormalities in patients with
aortic regurgitation: a strain rate imaging study. European Journal of
Echocardiography, Oxford, v. 10, n. 1, p. 112-119, Jan. 2009.
MELUZIN, J. et al. Estimation of left ventricular filling pressures by speckle
tracking echocardiography in patients with idiopathic dilated cardiomyopathy.
European Journal of Echocardiography, Oxford, v. 12, n. 1, p. 11-18, Jan.
2011.
MIZUGUCHI, Y. et al. The functional role of longitudinal, circumferential, and
radial myocardial deformation for regulating the early impairment of left
ventricular contraction and relaxation in patients with cardiovascular risk
factors: a study with two-dimensional strain imaging. Journal of the American
Society of Echocardiography, Morrisville, v. 21, n. 10, p. 1138-1144, Oct.
2008.
OPDAHL, A. et al. Apical rotation by speckle tracking echocardiography: a
simplified bedside index of left ventricular twist. Journal of the American
Society of Echocardiography, Morrisville, v. 21, n. 10, p. 1121-1128, Oct.
2008.
PAVLOPOULOS, H.; NIHOYANNOPOULOS, P. Strain and strain rate
deformation parameters: from tissue Doppler to 2D speckle tracking.
International Journal of Cardiovascular Imaging, Boston, v. 24, n. 5, p. 479491, June 2008.
28
RIESEN, S. C. et al. Comparison of the effects of ivabradine and atenolol on
heart rate and echocardiographic variables of left heart function in healthy cats.
Journal of Veterinary Internal Medicine, Philadelphia, v. 25, n. 3, p. 469-476,
Jan. 2011.
SCHEFER, K. D. et al. Quantitative analysis of stress echocardiograms in
healthy horses with 2-dimensional (2D) echocardiography, anatomical M -mode,
tissue Doppler imaging, and 2D speckle tracking. Journal of Veterinary
Internal Medicine, Philadelphia, v. 24, n. 4, p. 918-931, July/Aug. 2010.
SCHOBER, K. E. et al. Detection of congestive heart failure in dogs by Doppler
echocardiography. Journal of Veterinary Internal Medicine, Philadelphia, v.
24, n. 6, p. 1358-1368, Nov./Dec. 2010.
SERRI, K. et al. Global and regional myocardial function quantification by twodimensional strain application in hypertrophic cardiomyopathy. Journal of the
American College of Cardiology, San Diego, v. 47, n. 6, p. 1175-1181, Mar.
2006.
SIMPSON, K. E. et al. Assessment of the repeatability of feline
echocardiography using conventional echocardiography and spectral pulse wave
Doppler tissue imaging techniques. Veterinary Radiology & Ultrasound,
Raleigh, v. 48, n. 1, p. 58-68, Jan./Feb. 2007.
SUFFOLETTO, M. S. et al. Novel speckle-tracking radial strain from routine
black-and-white echocardiographic images to quantify dyssynchrony and predict
response to cardiac resynchronization therapy. Circulation, Dallas, v. 113, n. 7,
p. 960-968, Feb. 2006.
TAKAMURA, T. et al. Reversible left ventricular regional non-uniformity
quantified by speckle-tracking displacement and strain imaging in patients with
acute pulmonary embolism. Journal of the American Society of
Echocardiography, Morrisville, v. 24, n. 7, p. 792-802, July 2011.
29
TAKANO, H. et al. Assessment of left ventricular regional function in affected
and carrier dogs with duchenne muscular dystrophy using speckle tracking
echocardiography. BMC Cardiovascular Disorders, London, v. 11, n. 23, p. 18, May 2011.
VANNAN, M. A. et al. Effect of cardiac resynchronization therapy on
longitudinal and circumferential left ventricular mechanics by velocity vector
imaging: description and initial clinical application of a novel method using
high-frame rate B-mode echocardiographic images. Echocardiography,
Gardendale, v. 22, n. 10, p. 826-830, Nov. 2005.
WESS, G. et al. Comparison of longitudinal myocardial tissue velocity, strain,
and strain rate measured by two-dimensional speckle tracking and by color
tissue Doppler imaging in healthy dogs. Journal of Veterinary Cardiology,
Bern, v. 13, n. 1, p. 31-43, Mar. 2011.
WESS, G.; SARKAR, R.; HARTMANN, K. Assessment of left ventricular
systolic function by strain imaging echocardiography in various stages of feline
hypertrophic cardiomyopathy. Journal of Veterinary Internal Medicine,
Philadelphia, v. 24, n. 6, p. 1375-1382, Nov./Dec. 2010.
30
SEGUNDA PARTE
ARTIGO
Longitudinal strain and strain rate by two-dimensional speckle tracking in nonsedated healthy cats
Artigo segue as normas e formato do periódico Journal of Veterinary Internal
Medicine (JVIM)* ao qual foi submetido.
*
Este artigo é uma versão preliminar, considerando que o conselho editorial da
revista poderá sugerir alterações para adequá-lo ao seu próprio estilo.
31
1
Longitudinal Strain and Strain Rate by Two-dimensional Speckle tracking
2
in non-sedated healthy cats
3
4
A.C. Silva, R.A.L. Muzzi, G. Oberlender, R.B. Nogueira, L.A.L. Muzzi, G.F.M.
5
Reis and M.M. Mantovani
6
7
From the Division of Small Animal Medicine, Section of Veterinary Cardiology,
8
Department of Veterinary Medicine, Federal University of Lavras
9
(DMV/UFLA), Lavras, Minas Gerais, Brazil.
10
11
Short Title: Longitudinal Function by 2D-STE in Cats
12
13
14
15
16
17
18
19
20
21
22
Keywords: Echocardiography, Cardiomyopathy, Felines, Myocardial function.
32
23
Abbreviations:
24
2D-STE
Two-dimensional speckle tracking echocardiography
25
St
Strain
26
StR
Strain Rate
27
LSt
Longitudinal Strain
28
LStR
Longitudinal Strain Rate
29
Lvel
Longitudinal Velocity
30
Ldisp
Longitudinal Displacement
31
2D
Two-dimensional
32
LVDd
Left ventricular diastolic diameter
33
RVDd
Right ventricular diastolic diameter
34
LVDs
Left ventricular systolic diameter
35
PWd
Posterior wall at diastole
36
PWs
Posterior wall at systole
37
IVSd
Interventricular septum at diastole
38
IVSs
Interventricular septum thickness at systole
39
FS
Fractional shortening
40
41
42
33
43
Corresponding author: Adriana Cristina da Silva, Departamento de
44
Medicina Veterinária, Setor de Clínica Médica de Pequenos Animais, Serviço de
45
Cardiologia Veterinária, Universidade Federal de Lavras, Minas Gerais, Brasil,
46
Caixa Postal 3037, CEP: 37.200-000; email: [email protected].
47
48
Partial data of this study were accepted to be presented as a research
49
report at the American College of Veterinary Internal Medicine Forum
50
(ACVIM), New Orleans, Louisiana, USA, May 30-June 2, 2012.
51
52
Acknowledgments
53
The authors wish to thank to Fundação de Amparo a Pesquisa do Estado
54
de Minas Gerais (FAPEMIG), Coordenação de Aperfeiçoamento de Pessoal de
55
Nível Superior (CAPES) and Conselho Nacional de Desenvolvimento Científico
56
e Tecnológico (CNPq), for the financial support.
57
58
Background: 2D speckle tracking is a new tool that has been used in
59
humans and veterinary medicine to quantify myocardial longitudinal function.
60
However, there is an absence of information about the use of this tool in healthy
61
non-sedated cats to obtain myocardial longitudinal strain, strain rate, velocity
62
and displacement.
34
63
Objectives: To evaluate myocardial longitudinal strain and strain rate in
64
awake clinically healthy cats, as well as, longitudinal velocity and displacement
65
by means of 2D speckle tracking echocardiography.
66
Animals: The study population consisted of 30 clinically healthy no-
67
sedated cats, weighting 4.11 ± 0.94 kg and mean age 36.00 ± 33.43 months.
68
Methods: All cats were examined physically, were obtained systolic
69
blood pressure and performed electrocardiography and echocardiography to
70
assess the healthy status. During conventional echocardiography 2D images
71
were obtained and evaluated off line at speckle tracking software.
72
Results: Speckle tracking echocardiography demonstrated to be feasible
73
and reliable to obtain left ventricular longitudinal function. The global mean
74
obtained for strain and strain rate were -15.65 ± 5.46 (%), -1.80 ± 0.59 (1/s),
75
respectively. Regarding velocity and displacement were observed 1.41 ± 0.87
76
(cm/s), 1.27 ± 0.80 (mm), respectively.
77
Conclusions
and
Clinical
Importance:
2D
speckle
tracking
78
echocardiography was found to be a reliable technique for measuring LV
79
myocardial LSt, LStR, Lvel and Ldisp. These measurements offer new insights
80
into feline ventricular deformation and motion. In addition, based on our results,
81
preliminary reference values for healthy non-sedated cats could be formulated.
82
83
35
84
Two-dimensional Speckle Tracking (2D-STE) is a new tool that has
85
been used in veterinary medicine to evaluate myocardial strain (St) and strain
86
rate (StR).1 St is expressed as a percentage (%) and it is the magnitude of
87
myocardial fibers lengthening or shortening. On the other hand, StR is the rate at
88
which deformation occurs, it describes the velocity of deformation (1/s).2
89
This technique was already validated for dogs, showing to be useful in
90
the diagnosis of cardiomyopathies.3–6 In humans, several studies demonstrated
91
the efficacy of 2D-STE in the diagnosis of various cardiac diseases and
92
hemodynamic
93
cardiomyopathy, coronary disease, ventricular dyssyncrony, among others.7–
94
9
95
such as St and StR.10–13
conditions,
as
myocardial
infarctation,
hypertrophic
There is some studies in horses, which were obtained some 2D-STE variables,
96
In veterinary medicine longitudinal strain (LSt) and strain rate (LStR)
97
were obtained in dogs6 and in horses11 and its reliability and feasibility were
98
demonstrated for these species. Although, there are little information regarding
99
2D-STE variables, such as St and StR in cats,14,a being that its feasibly has not
100
yet clarified for this species. In addition, to our knowledge, there is no data
101
about LSt and LStR obtained by 2D-STE in non-sedated clinically healthy cats,
102
as well as, longitudinal velocity (Lvel) and displacement (Ldisp).
36
103
Thus, the aim of this study was to evaluate myocardial LSt and LStR in
104
non-sedated clinically healthy cats, as well as, myocardial Lvel and Ldisp by
105
means of 2D-STE.
106
107
Material and Methods
108
109
Study Population
110
111
The study population consisted of 30 healthy cats of different breeds and
112
origins (companion animals presenting for vaccinations or cardiac screening
113
programs, as well as ,student- or faculty-owned cats). Owner consent was
114
obtained before enrollment into the study. The study protocol was in compliance
115
with the institutional Animal Care and Use Committee under the protocol
116
number 052/11. In this study none of the animals were under any type of
117
treatment.
118
echocardiography, and indirect systolic blood pressure measurements were
119
performed to exclude cardiovascular disease.
120
121
122
123
In
all
cats,
clinical
examination,
electrocardiography,
37
124
Conventional Echocardiography
125
126
Echocardiographic studies were performed using an ultrasound unit
127
equipped with a 4-10 MHz phased-array transducer.b All examinations were
128
performed without sedation in gently restrained cats in lateral recumbency.
129
Standard echocardiographic views were obtained in right and left lateral
130
recumbence.17,18 Conventional echocardiographic variables, included ventricular
131
measurements taken from the right parasternal short-axis view by two-
132
dimensional (2D) guided M-mode, such as the left ventricular diastolic diameter
133
(LVDd), right ventricular diastolic diameter (RVDd); left ventricular systolic
134
diameter (LVSd), posterior wall at diastole (PWd) and
135
interventricular septum at diastole (IVSd) and at systole (IVSs) and fractional
136
shortening (FS %). Were also included measurements of the aorta (Ao) and left
137
atrial (LA) diameter by 2D mode and was calculated the LA/Ao ratio. All valves
138
were examined using color Doppler and velocities over the valves were
139
measured using pulsed wave Doppler examinations. At least 3 measurements
140
were performed for all echocardiographic variables and the mean value of the
141
measurements was calculated for each variable.
142
143
144
systole (PWs)
38
145
Speckle Tracking Echocardiography
146
147
The 2D echocardiographic loops used for STE analysis were acquired
148
and recorded in all cats using the same ultrasound unit as for the standard
149
examinations. Three to five consecutive heart cycles using a continuous
150
monitoring ECG were stored in digital format on a workstation for off-line
151
analysis. Cine loops were acquired from left apical four chamber view with
152
sampling rates from 56.10 ± 23.49 (38 to 159) frames/s and 6 measurements
153
were obtained in two different Cine loops (3 for each Cine loop) at end-systole
154
for all studied variables and then average was obtained. Semi-automatic tissue
155
tracking and analysis for 2D-ST was performed using a commercially software.c
156
For myocardial tracking, endocardial border was marked manually and then,
157
epicardial border was marked automatically by the software, which performed
158
myocardial wall tracking process and velocity vectors were displayed at the
159
region of interest (Fig 1A). Manual adjustment of the myocardial wall borders
160
was performed when necessary. Graphics and curves of studied variables were
161
automatic displayed and myocardium was divided in six segments by the
162
software (Fig 1B) and the values of peak systolic of LSt, LStR, Lvel and Ldisp
163
were shown for each segment at endocardial and epicardial region.
164
165
39
166
Statistical Analysis
167
168
All data were tested for normality by the Kolmogorov-Smirnov test
169
(P>0.05). Statistical and graphical analyses were performed by computer
170
software.d Summary statistics for the different measurements (mean ± standard
171
deviation-SD; n= 30 cats) were calculated using the average measurement of 6
172
consecutive heart cycles per cats obtained of two different cine loops (3
173
consecutive cycles for each cine loop). The data demonstrated not be normally
174
distributed and therefore the Mann-Whitney and Kruskal-Wallis test were
175
applied to compare the cardiac regions (Endocardium and Epicardium) and
176
segments (Bas Sept, Mid Sept, Apic Sept, Bas Lat, Mid Lat and Apic Lat),
177
respectively. These data were displayed as boxplots, and each segment, the
178
median and spread of the peak value or timing were indicated by a
179
boxplot, based on the averaged measurement values for each cat. A value
180
of P<0.05 was considered statistically significant.
181
The intra-observer repeatability was obtained from 3 echocardiograms
182
that were randomly selected to be subjected to 6 repeated analyses at 3 different
183
days for the same recorded loops, to determine intra-observer between-day
184
measurement variability for LSt, LStR, Lvel and Ldisp. Each variable was
185
measured 6 times on 6 consecutive cardiac cycles in 2 different cine loops (3
186
consecutive cardiac cycles for each cine loop), and the between-day intra-
40
187
observer variability was determined based on the analysis of variance results of
188
all measurements.
189
190
Results
191
192
Demographic data (Table 1) and conventional echocardiography (Table
193
2) are displayed as mean and standard deviation. In this study were observed a
194
higher number of males than females and the mean age of cats were about 36
195
months. The study population was compounded by mixed breed, Persian and
196
Siamese cats. Regarding to weight a minimal variation was present. The mean of
197
systolic blood pressure was into normal ranges (< 150 mmHg). Regarding
198
conventional echocardiography was observed that all variables were into the
199
normal range described at literature.19-21
200
The 2D STE demonstrated to be feasible in cats, using apical four
201
chamber view to obtain longitudinal variables. A total of 8,640 measurements
202
were obtained for all segments of all STE variables analyzed and 77% of
203
measurements could be considered with adequate tracking quality.
204
The values of endocardial and epicardial variables are displayed on
205
Table 3 and global endocardial values were lower than epicardial for LSt, Ldisp
206
and Lvel. Table 4 shows the peak values of global, average and segmental
207
measurements of 2D STE variables of all cats studied and significant differences
41
208
among regions were observed. Heterogeneity was observed at different
209
myocardial segments analyzed, but LV posterior wall regions demonstrated no
210
significant difference. Apical regions of variables Ldisp and Lvel demonstrated
211
significant lower values than other regions for these same variables. Regarding,
212
other variables were observed lower variability, despite significant differences
213
among segments (Fig 2).
214
The Table 5 displays the between-day intra-observer variability,
215
demonstrating that the variables LSt and LStR had higher values than the
216
others, despite these values were considered with low variability.
217
Endocardial region presented higher variability than epicardial for the
218
variables LSt, Lvel, Ldisp. Regarding the global average Lvel and Ldisp
219
demonstrated to be similar and have lower variability than LSt and LStR.
220
221
Discussion
222
223
The present study describes the technique of the 2D STE to obtain LV
224
longitudinal myocardial function and its feasibility in non-sedated healthy cats.
225
The left apical four chamber view demonstrated to be adequate to obtain
226
measurements of LSt, LStR, Lvel and Ldisp in felines.
227
In this study was observed a larger number of males than females, this
228
fact were also observed in a study with cats presenting hypertrophic
42
229
cardiomyopathy.22 In our study it can be justified by the fact that cats were
230
selected randomly and gender was not controlled.
231
Regarding conventional echocardiography, to be included in this study
232
cats must be in the normal range for all variables, excluding any cardiac
233
alteration.
234
The 2D-STE demonstrated to be feasible to obtain longitudinal function
235
in all cats evaluated, despite some measurements had to be excluded of the
236
analyzes because inadequate tracking. This fact was mentioned before by others
237
studies in dogs3,6 and could be justified by the difficulty of obtain an optimal
238
quality image compatible with STE software. In our study another fact that
239
could be added is the higher heart rates that non-sedated cats can present at
240
echocardiographic examination which could to interfere in the adequate
241
tracking. The frame rate presented in our study were in accordance with
242
previous data demonstrated in studies in dogs,3,6 humans,15,16 horses11,13 and
243
sedated cats (radial St and StR).14
244
In this study, epicardial and endocardial LSt demonstrated to be
245
significantly different, being epicardial values higher than endocardial one. This
246
fact is different of data reported in a previous study with humans, in which
247
endocardial region presented higher strain values.23 In our study the global mean
248
of LSt were similar to previous data for the same variable obtained in
249
dogs6 and in human fetus24 and much lower than data from horses.11 This result
43
250
could be justified by the species differences, as heart size, which is expected
251
higher values of St, proportionally to the size, and heart rate, that may influence
252
the quality of the image.
253
Heterogeneity was observed at different myocardial segments analyzed,
254
but for the variable LSt there was no significant difference among the segments
255
of the LV posterior wall (Apic Lat, Mid Lat and Bas Lat). In dogs was also
256
demonstrated no significant difference among these segments for LSt.6 This fact
257
was also observed in a study with horses11 and in humans.25 In humans was
258
demonstrated that apical values of LSt were higher than in other segments,25 and
259
in the present study we observed that basal segments of septum and posterior
260
wall demonstrated higher values. In a study with cats using tissue Doppler to
261
obtain the variable St,22 were demonstrated values of basal segments of septum
262
and posterior wall a little higher than values of our study. This difference could
263
be justified due to the data of studies were obtained using different techniques,
264
and also was reported at literature the fact that tissue Doppler can be influenced
265
by the insonation angle.1 Another explanation to these differences is the fact that
266
the cats of the tissue Doppler study were sedated and in the present study the
267
animals were awake, which could influence the results of measurements.
268
Regarding the variables Lvel, Ldisp and LStR, were observed
269
differences among the segments, despite the middle and basal segments of IVS
270
and LV posterior wall demonstrate no significant differences for the LStR. In
44
271
dogs, were observed no significant differences in the segments for LStR,
272
however, for the variable Lvel were observed that the values were different and
273
increasing from the apex to the base,6 as were demonstrated in our study in cats
274
for this same variable.
275
Regarding the between-day intra-observer the values of variability could
276
be considered with low variability due to all values were lower than 15%. It was
277
also observed at a study with dogs, which were found similar values for the
278
variable LStR.6 Although, in this same study lower values for LSt were observed
279
than in our study. Lower variability was shown for the variables Ldisp and Lvel
280
in the present data.
281
Limitations of the present study must be clarified. Firstly, it is a
282
noninvasive study design, performed on companion animals without any
283
invasively obtained hemodynamic data to corroborate with the healthy status of
284
the cats. Another limitation is the high dependency of STE of image quality,
285
which is difficult to obtain in non-sedated cats, given that they can present high
286
heart rates at the examination.
287
Another limitation of this study is the fact that data obtained may not be
288
applicable to all clinical situations due to differences in machine settings,
289
software, equipment, observer experience and image quality, which may
290
influence the values and variability of the data.
45
291
Our study was performed on 30 non-sedated healthy cats and mixed
292
breeds were over represented, being only Persians and Siamese cats presented in
293
small number. Then, a larger study population would be performed in order to
294
determine if there is an influence of breed, gender and age over the 2D-STE
295
variables in cats. Despite the limitations, the study provide preliminary reference
296
values of LSt, LStR, Lvel, Ldisp for non-sedated healthy cats, as well as the
297
feasibility of the technique in this specie.
298
In conclusion, 2D STE can be considered a reliable technique for
299
measuring left ventricular myocardial LSt, LStR, Lvel and Ldisp in cats. These
300
measurements provide new prospects into feline ventricular deformation and
301
motion, allowing a more complete quantification and understanding of
302
longitudinal myocardial function in this specie. However, more studies should
303
be carried out in order to evaluate the role and reliability of this technique in cats
304
with cardiomyopathies.
305
306
Footnotes
307
a
308
echocardiography in clinically healthy cats and cats with hypertrophic
309
cardiomyopathy. J Vet Int Med 2011;25:971 (Abstract)
310
b
311
c
Takano H, Isogai T, Aoki T, Wakao Y, Fujii Y: 2D speckle tracking
Esaote Mylab 40, Italy
Xstrain software version 10.1, Esaote
46
312
d
SPSS Statistics 17.0, Rel. 17.0.1. 2008, SPSS Inc, Chicago, IL
313
314
References
315
316
317
1. Chetboul V. Advanced techniques in echocardiography in small
animals. Vet Clin North Am Small Anim Pract 2010;40:529–543.
318
2. Pavlopoulos H, Nihoyannopoulos P. Strain and strain rate
319
deformation parameters: From tissue Doppler to 2D speckle tracking. Int J
320
Cardiovasc Imaging 2008;24:479–491.
321
3. Chetboul V, Serres F, Gouni V, et al. Radial strain and strain rate by
322
two-dimensional speckle tracking echocardiography and the tissue velocity
323
based technique in the dog. J Vet Cardiol 2007;9:69–81.
324
4. Chetboul V, Serres F, Gouni V, et al. Noninvasive assessment of
325
systolic left ventricular torsion by 2-dimensional speckle tracking imaging in the
326
awake dog: repeatability, reproducibility, and comparison with tissue Doppler
327
imaging variables. J Vet Int Med 2008;22:342–350.
328
5. Takano H, Fujii YO, Yugeta N, et al. Assessment of left ventricular
329
regional function in affected and carrier dogs with duchenne muscular dystrophy
330
using speckle tracking echocardiography. BMC Cardiovasc Disord 2011;11:2–8.
331
47
332
6. Wess G, Keller LJM, Klausnitzer M. et al. Comparison of
333
longitudinal myocardial tissue velocity, strain, and strain rate measured by two-
334
dimensional speckle tracking and by color tissue Doppler imaging in healthy
335
dogs. J Vet Cardiol 2011;13:31–43.
336
7. Amundsen H, Helle-Valle T, Edvardsen, T, et al. Noninvasive
337
myocardial strain measurement by speckle tracking echocardiography:
338
Validation against sonomicrometry and tagged magnetic resonance imaging. J
339
Am Coll Cardiol 2006;47:789–793.
340
8. Delgado V, Ypenburg C, Van Bommel RJ, et al. Assessment of left
341
ventricular dyssynchrony by speckle tracking strain imaging comparison
342
between
343
resynchronization therapy. J Am Coll Cardiol 2008;51:1944–1952.
longitudinal,
circumferential,
and
radial
strain
in
cardiac
344
9. Meluzin J, Spinarova K, Hude P, et al. Estimation of left ventricular
345
filling pressures by speckle tracking echocardiography in patients with
346
idiopathic dilated cardiomyopathy. Eur J Echocardiogr 2011;12:11–18.
347
10. Schwarzwald CC, Schober KE, Berli A-SJ, et al. Left ventricular
348
radial and circumferential wall motion analysis in horses using strain, strain rate,
349
and displacement by 2D speckle tracking. J Vet Int Med 2009;23:890–900.
350
11. Decloedt A, Verheyen T, Sys S, et al. Quantification of left
351
ventricular longitudinal strain, strain rate,velocity, and displacement in healthy
352
horses by 2-dimensional speckle tracking. J Vet Int Med 2011;25:330–338.
48
353
12. Schefer KD, Bitschnau C, Weishaupt MA, et al. Quantitative
354
analysis of stress echocardiograms in healthy horses with 2-dimensional (2D)
355
echocardiography, anatomical M-mode,tissue Doppler imaging, and 2D speckle
356
tracking. J Vet Int Med 2010;24:918–931.
357
13. Decloedt A, Verheyen T, Sys S, et al. Two-dimensional speckle
358
tracking for quantification of left ventricular circumferential and radial wall
359
motion in horses. Eq Vet J 2012; DOI: 10.1111/j.2042-3306.2012.00549.x.
360
14. Riesen SC, Schober KE, Cervenec RM, et al. Comparison of the
361
effects of ivabradine and atenolol on heart rate and echocardiographic variables
362
of left heart function in healthy cats. J Vet Int Med 2011;25:469–476.
363
15. Suffoletto MS, Dohi K, Cannesson M, et al. Novel speckle-tracking
364
radial strain from routine black-and-white echocardiographic images to quantify
365
dyssynchrony and predict response to cardiac resynchronization therapy.
366
Circulation 2006;113:960–968.
367
16. Gjesdal O, Hopp E, Vartdal T, et al. Global longitudinal strain
368
measured by twodimensional speckle tracking echocardiography is closely
369
related to myocardial infarct size in chronic ischaemic heart disease. Clin Sci
370
2007;113:287–296.
371
372
49
373
17. Thomas WP, Gaber CE, Jacobs GJ, et al. Recommendations for
374
standards in transthoracic two-dimensional echocardiography in the dog and cat.
375
Echocardiography Committee of the Specialty of Cardiology, American College
376
of Veterinary Internal Medicine. J Vet Int Med 1993;7:247–252.
377
18. Boon JA. The two-dimensional echocardiographic exam. In: Boon,
378
JA, ed. Veterinary Echocardiography. 2nd ed. Iowa, USA: Wiley-Blackwell;
379
2011:37–100.
380
19. Campbell FE, Kittleson MD. The effect of hydration status on the
381
echocardiographic measurements of normal cats. J Vet Int Med 2007;21:1008–
382
1015.
383
20. Disatian S, Bright JM, Boon J. Association of age and heart rate with
384
pulsed-wave Doppler measurements in healthy, nonsedated cats. J Vet Int Med
385
2008;22:351–356.
386
387
21. Boon JA. Appendix four feline. In: Boon, JA, ed. Veterinary
Echocardiography. 2nd ed. Iowa, USA: Wiley-Blackwell; 2011:569–580.
388
22. Wess G, Sarkar R, Hartmann K. Assessment of left ventricular
389
systolic function by strain imaging echocardiography in various stages of feline
390
hypertrophic cardiomyopathy. J Vet Int Med 2010;24:1375–1382.
391
23. Leitman M, Lysiansky M, Lysyansky P, et al. Circumferential and
392
longitudinal strain in 3 myocardial layers in normal subjects and in patients with
393
regional left ventricular dysfunction. J Am Soc Echocardiogr 2010;23:64–70.
50
394
24. Ishii T, McElhinney DB, Harrild D. M, et al. Circumferential and
395
longitudinal ventricular strain in the normal human fetus. J Am Soc
396
Echocardiogr 2012;25:105–111.
397
25. Hurlburt HM, Aurigemma GP, Hill, JC, et al. Direct ultrasound
398
measurement of longitudinal, circumferential, and radial strain using 2-
399
dimensional strain imaging in normal adults. Echocardiography 2007;24:723–
400
731.
401
402
403
404
405
406
407
408
409
410
411
412
413
414
51
415
416
Fig 1. Figures illustrating myocardial tracking in a cat. (A) 2D Apical Four
417
chamber view in a non-sedated healthy cat, demonstrating myocardial tracking
418
process and velocity vectors by STE; (B) 2D-STE analysis of left ventricular
419
epicardial longitudinal strain in a healthy cat. The myocardium is automatically
420
divided into 6 segments: Basal (Bas Sept), Middle (Mid Sept) and Apical (Apic
421
Sept) segments for the interventricular septum and Basal (Bas Lat), Middle
422
(Mid Lat) and Apical (Apic Lat) lateral segments for the left ventricular
423
posterior wall.
52
424
425
Fig 2. Graphical illustration of segmental differences of 2D STE
426
measurements of LV longitudinal function in non-sedated healthy cats
427
(n=30). The line near the middle of the box indicates the middle half of the
428
observations, the top and the bottom of the box indicates the upper and lower
429
quartile, and the whiskers corresponds to the range of observations (smallest and
430
largest observations, respectively). Boxes marked with different letters are
431
significantly different from each other to Mann-Whitney test (P<0.05).
432
53
433
Table 1. Demographic data (age, weight, heart rate, gender and breed) and
434
systolic blood pressure in non-sedated healthy cats (n = 30).
Variables
Age (months)
Weight (kg)
Heart rate (beats/min)
Gender
Male
Female
Breeds
435
436
437
438
439
440
441
442
443
444
445
446
Systolic pressure (mmHg)
Mean ± Standard deviation (SD)
36.00 ± 33.43
4.11 ± 0.94
161.20 ± 39.55
n = 20 (66.67%)
n = 10 (33.33%)
Mixed breed cats (n = 22 – 73.34%)
Persa (n = 7 – 23.33%)
Siamês (n = 1 – 3.33%)
129.50 ± 15.03
54
447
Table 2. Data of main conventional echocardiographic variables in non-sedated
448
healthy cats (n = 30).
449
Variables
Mean ± Standard deviation (SD)
Left atrium (mm) – LA
7.25 ± 0.96
Aorta (mm) – Ao
7.04 ± 0.85
Ratio LA/Ao
1.03 ± 0.11
Pulmonary artery (m/s)
0.88 ± 0.16
RVDd (mm)
2.75 ± 0.98
IVSd (mm)
4.10 ± 1.08
LVDd (mm)
11.07 ± 2.06
PWd (mm)
4.39 ± 0.97
IVSs (mm)
5.77 ± 0.94
LVDs (mm)
6.07 ± 1.26
PWs (mm)
6.45 ± 1.07
FS (%)
44.86 ± 7.82
E mitral (m/s)
0.90 ± 0.14
A mitral (m/s)
0.65 ± 0.15
Tric flow (m/s)
0.76 ± 0.11
Aortic flow (m/s)
0.92 ± 0.16
Aortic root (mm)
6.41 ± 0.69
RVDd: right ventricular diastolic diameter; IVSd: interventricular septum at
450
diastole; LVDd: left ventricle diastolic diameter; PWd: posterior wall at diastole;
451
IVSs: interventricular septum at systole; LVDs: left ventricle systolic diameter;
452
FS: fractional shortening; E mitral: transmitral peak early diastolic velocity; A
453
mitral: transmitral peak late diastolic velocity; Tric flow: peak of tricuspid flow
454
velocity.
455
55
456
Table 3. Values of global, endocardial and epicardial regions of longitudinal
457
strain, strain rate, displacement and velocity, displayed as mean ± standard
458
deviation of healthy cats (n=30).
Variables
Endocardium
Epicardium
LSt (%)
-15.15 ± 5.25 a -16.12 ± 5.61 b
LStR (1/s)
-1.79 ± 0.56 a -1.82 ± 0.62 a
Ldisp (mm) 1.22 ± 0.67 a
1.32 ± 0.91 a
Lvel (cm/s) 1.36 ± 0.74 a
1.46 ± 0.98 a
Average
-15.65 ± 5.46
-1.80 ± 0.59
1.27 ± 0.80
1.41 ± 0.87
P value
0.0020*
0.6720
0.6440
0.6280
459
LSt: Longitudinal Strain (%); LStR: Longitudinal Strain Rate (1/s); Ldisp:
460
Longitudinal displacement (mm); Lvel: Longitudinal Velocity (cm/s).
461
*
462
(P<0.05).
463
464
465
466
467
468
469
470
471
472
473
Means followed by different letters in the line differ by the Mann-Whitney test
56
474
Table 4. Values of segmental and averaged longitudinal strain, strain rate,
475
displacement and velocity, displayed as mean ± standard deviation of healthy
476
cats (n=30).
477
Segment
N
Mean ± Standard deviation*
APIC LAT
278
-15.15 ± 4.81 b
MID LAT
279
-14.57 ± 4.92 b
BAS LAT
270
-15.57 ± 6.18 b
APIC SEP
289
-14.91 ± 5.14 b
MID SEP
282
-15.23 ± 4.54 b
BAS SEP
265
-18.63 ± 6.10 a
Global mean
1663
-15.65 ± 5.46
Longitudinal
APIC LAT
299
-1.74 ± 0.54 c
Strain Rate
MID LAT
291
-1.73 ± 0.56 c
(1/s)
BAS LAT
281
-1.91 ± 0.61 b
APIC SEP
313
-1.73 ± 0.63 c
MID SEP
298
-1.69 ± 0.50 c
BAS SEP
279
-2.04 ± 0.64 a
Global mean
1761
-1.80 ± 0.59
Longitudinal
APIC LAT
260
0.70 ± 0.32 e
Displacement
MID LAT
260
1.30 ± 042 c
(mm)
BAS LAT
260
1.96 ± 0.67 b
APIC SEP
260
0.37 ± 0.20 f
MID SEP
260
1.09 ± 0.37 d
BAS SEP
289
2.14 ± 0.68 a
Global mean
1589
1.27 ± 0.80
Longitudinal
APIC LAT
260
0.69 ± 0.27 d
Velocity
MID LAT
263
1.38 ± 0.42 b
(cm/s)
BAS LAT
274
2.20 ± 0.67 a
APIC SEP
260
0.41 ± 0.20 e
MID SEP
259
1.28 ± 0.41 c
BAS SEP
310
2.31 ± 0.75 a
Global mean
1626
1.41 ± 0.87
*
Means followed by different letters in the column differ by the Mann-Whitney
478
test (P<0.05).
Variable
Longitudinal
Strain
(%)
479
57
480
Table 5. Table displays the value of between-day intra-observer
481
variability (%).
482
Variable
Endocardium Epicardium Average
LSt
12.2
10.8
11.7
Between-Day
Intra-observer
LStR
10.8
11.3
11.5
Variability
Ldisp
7.2
1.3
6.0
(CV in %)
Lvel
5.3
2.8
5.8
LSt: Longitudinal Strain (%); LStR: Longitudinal Strain Rate (1/s); Ldisp:
483
Longitudinal displacement (mm); Lvel: Longitudinal Velocity (cm/s).
484
485
486
487
488
489
490
491
492
493
494
495
58
496
497
498
499
500
501
ANEXO
Certificado fornecido pela Comissão de Ética no Uso de Animais da UFLA.
Download