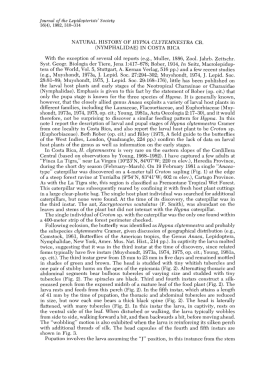
Census
1
Acknowledgement
This database software has been developed with the cooperation of the UN system. The product has
been adapted from UNICEF ChildInfo technology.
r2
2
Contents
INTRODUCTION ....................................................................................................... 6
WELCOME TO DEVINFO!........................................................................................................................ 6
Overview .......................................................................................................................................... 6
What’s new in DevInfo 6.0? ............................................................................................................. 7
System Requirements...................................................................................................................... 8
Installing DevInfo 6.0 ....................................................................................................................... 8
Learning DevInfo 6.0........................................................................................................................ 9
CHAPTER 1............................................................................................................ 10
GETTING STARTED ............................................................................................................................. 10
Starting DevInfo 6.0 .......................................................................................................................10
Opening the Data Wizard ..............................................................................................................11
Selecting a database .....................................................................................................................12
Selecting indicators and areas .......................................................................................................13
Viewing tables, graphs and maps ..................................................................................................17
Using the Gallery ...........................................................................................................................21
Refining your data search: selecting time periods,
sources and areas for which data does not exist ..........................................................................22
Getting more out of DevInfo ...........................................................................................................25
CHAPTER 2............................................................................................................ 26
SEARCHING FOR DATA........................................................................................................................ 26
Understanding the home page features ........................................................................................27
Selecting a database .....................................................................................................................30
Selecting data search elements .....................................................................................................32
Selecting indicators ........................................................................................................................33
Selecting areas ..............................................................................................................................39
Selecting time periods....................................................................................................................42
Selecting sources ...........................................................................................................................44
Starting over with a new search.....................................................................................................44
Using search boxes to speed up your search process ..................................................................44
3
CHAPTER 3............................................................................................................ 46
VIEWING DATA ................................................................................................................................... 46
Data view overview ........................................................................................................................46
Presentation preview panel overview ............................................................................................47
Customizing the data view .............................................................................................................48
Using the grouping bar to group elements.....................................................................................48
Data view toolbar ...........................................................................................................................49
Right-click menu commands ..........................................................................................................55
CHAPTER 4............................................................................................................ 58
TABLES .............................................................................................................................................. 58
Table editing overview ...................................................................................................................58
Editing tools on the Table toolbar ..................................................................................................60
Editing features on the left panel ...................................................................................................61
Table Wizard ..................................................................................................................................71
CHAPTER 5............................................................................................................ 75
M APS ................................................................................................................................................. 75
Map editing overview .....................................................................................................................76
Editing tools on the Map toolbar ....................................................................................................78
Editing features on the left panel ...................................................................................................86
Map Wizard ..................................................................................................................................112
CHAPTER 6.......................................................................................................... 114
GRAPHS ........................................................................................................................................... 114
Graph editing overview ................................................................................................................114
Editing tools on the Graph toolbar ...............................................................................................116
Editing features on the left panel .................................................................................................116
Right-click menu editing features .................................................................................................121
Graph Wizard ...............................................................................................................................121
CHAPTER 7.......................................................................................................... 124
GALLERY ......................................................................................................................................... 124
Browsing and viewing Gallery objects .........................................................................................125
Managing Gallery objects ............................................................................................................127
Editing Gallery objects .................................................................................................................128
Replicating Gallery objects for different indicators, areas and time periods ................................129
Copying Gallery objects directly into MS PowerPoint ..................................................................132
4
Publishing Gallery objects to the web ..........................................................................................133
CHAPTER 8.......................................................................................................... 135
REPORTS ......................................................................................................................................... 135
Step 1 - Creating a report layout ..................................................................................................135
Step 2 - Saving the report layout .................................................................................................136
Step 3 - Selecting the desired report layout ................................................................................140
Step 4 - Selecting new areas and time periods to generate reports ...........................................141
Creating advanced reports ..........................................................................................................143
Viewing and editing advanced reports .........................................................................................134
CHAPTER 9.......................................................................................................... 149
CALCULATE ...................................................................................................................................... 149
Percent .........................................................................................................................................150
100 Minus ....................................................................................................................................154
Composite Index ..........................................................................................................................156
Subtotal ........................................................................................................................................160
Transform Unit .............................................................................................................................162
User Defined Formula ..................................................................................................................166
CHAPTER 10........................................................................................................ 169
BOTTOM PANEL FEATURES ............................................................................................................... 169
di About ........................................................................................................................................170
di Settings ....................................................................................................................................171
di DataWizard ..............................................................................................................................177
di Book .........................................................................................................................................178
di Video ........................................................................................................................................184
di Profiles .....................................................................................................................................192
di Analyzer ...................................................................................................................................196
di TreeMap ...................................................................................................................................198
di Radar .......................................................................................................................................199
di Sidebar .....................................................................................................................................200
5
INTRODUCTION
Welcome to DevInfo!
DevInfo is a database system for monitoring human development. It is a powerful tool for organizing,
storing and presenting data in a uniform way, allowing data to be easily and quickly shared across
government departments, UN agencies and other development organizations. With DevInfo, you are
literally just a few mouse clicks away from:
•
•
•
Getting facts to help make better decisions based on evidence
Analyzing national, sub-national and regional data for monitoring and evaluation
purposes
Producing high-quality tables, graphs and maps for inclusion in reports, presentations
and advocacy materials
DevInfo supports both UN-defined human development indicators (related to the Millennium
Development Goals) as well as user-defined indicators. DevInfo is compliant with international
statistical standards and operates both as a desktop application as well as on the web, thus making it
accessible from anywhere in the world.
Whether you are a UN professional, a government executive or policy maker, an NGO worker, or a
concerned citizen, you will find DevInfo an indispensable tool for your research, analysis and
advocacy tasks.
Overview
What’s new in DevInfo 6.0?
See what’s new in this version.
System Requirements
Find out what you need to run DevInfo 6.0.
Installing DevInfo 6.0
Follow these simple steps to install the software.
6
Learning DevInfo 6.0
Discover the best way to start using DevInfo 6.0.
What’s new in DevInfo 6.0?
In this release, you will find significant improvements in the ways you can generate data views and
produce presentation objects, as well as many new, powerful features to make your user experience
much more enjoyable.
Reduced learning curve
The enhanced user interface of DevInfo 6.0 contains a new Data Wizard, enabling first-time users to
easily access data and generate presentation objects with minimal training.
Improved performance
DevInfo 6.0 executes tasks significantly faster as compared to previous versions of DevInfo,
particularly on large data sets.
Instant previews for tables, graphs and maps
DevInfo 6.0 provides instant previews of tables, graphs and maps when generating data views.
Upgraded Gallery
The completely upgraded DevInfo 6.0 Gallery allows you to edit previously created tables, graphs and
maps without having to re-create them. It also displays thumbnails of saved presentation objects and
allows you to search for presentation objects by keywords.
New report features
DevInfo 6.0 enables you to generate profiles as well as standard and advanced reports. You can
create your own report layouts, which can then be used to generate quick and consistent reports for
different areas or time periods. You can also create reports with dynamically-embedded presentation
objects, which can easily be updated to reflect changes in the underlying data.
New book and video presentation tools
DevInfo 6.0 now introduces new ways to make exciting animated presentations in flipbook (di Book)
and video (di Video) formats.
7
New desktop sidebar
DevInfo 6.0 contains a customizable desktop sidebar which provides you with quick access to Gallery
objects, RSS feeds, and related facts.
Live software updates
Software updates to DevInfo 6.0 are now available through a live update feature, enabling you to stay
updated with the latest application version.
DevInfo Lite
You now have the option of running DevInfo 6.0 directly from the setup CD instead of having to install
it on your computer, thereby saving space on your hard drive.
System Requirements
The recommended minimum hardware requirements to install and run the DevInfo 6.0 application are
as follows:
•
•
•
•
•
•
•
Pentium IV
512 MB of RAM
1 GB of free hard disk space
Display resolution 1024 x 768
Microsoft Windows XP or above
Microsoft Internet Explorer
Microsoft Office XP is recommended but not required
Installing DevInfo 6.0
To install the DevInfo 6.0 application on your computer, follow these steps:
•
•
•
8
Insert the DevInfo 6.0 User Interface CD into the CD drive.
Wait for Auto-run to launch the Setup screen.
Follow the instructions on the screen to complete setup.
If the setup program does not load automatically, then do the following:
•
•
•
Click Start and then click Run.
Type d:\setup (where “d” is the location of your CD drive) and press Enter.
Follow the instructions on the screen to complete setup.
Note: Using DevInfo Lite
DevInfo 6.0 users now have the option of running the application directly from the setup
CD instead of having to install it on their computers. This version of the software is called
DevInfo Lite.
The main advantage of using DevInfo Lite is that it saves space on your hard drive, as you do not
need to install the entire software application. Moreover, it can easily be used to demonstrate the
powerful features of DevInfo on other computers.
However, it is recommended that regular DevInfo 6.0 users still install the full application on their
computers, mainly for ease of access. Moreover, several features in DevInfo 6.0, such as Live
Update, di Video, di Book, di Profiles and di Sidebar, are not available in DevInfo Lite.
Using DevInfo Lite only requires that .Net Framework 2.0 be pre-installed on your computer before
running the application. For your convenience, this software is included with the DevInfo Lite CD,
from where it can be installed on your computer. If you attempt to run DevInfo Lite without
having .Net Framework 2.0 installed, the application will generate an error message.
Learning DevInfo 6.0
If you are new to DevInfo, then it is recommended that you read through and follow along
Chapter 1, “Getting Started.” Although this release of DevInfo has been designed with minimal user
training in mind, reading through this chapter will help you to understand and begin using the powerful
features of DevInfo 6.0 even more quickly.
If you already have previous experience using DevInfo, you may wish to explore the new features of
DevInfo 6.0 on your own and consult the User’s Guide as needed.
Detailed information about the various features of DevInfo 6.0 can be found in the remaining chapters
of the User’s Guide.
9
CHAPTER 1
Getting Started
DevInfo 6.0 contains many powerful tools to help you search for, organize, filter, analyze, present and
share data. Once you learn how to use these tools, you can accomplish all these tasks in just a few
mouse clicks.
This chapter gives an overview of how to use the Data Wizard feature - the quickest way to begin
using DevInfo 6.0 to search for and view data.
Starting DevInfo 6.0
To start the application, do one of the following:
If you have already installed DevInfo 6.0 on your computer: Double-click the DevInfo 6.0
icon on your desktop to start the application.
If you are using the DevInfo Lite CD: Insert the CD into your CD drive. The application should
automatically start up by itself. If it does not, then click Run from the Start menu and browse for the
location of your CD drive. Click it to view its contents, and then double-click DI_UserInterface.exe to
start the application.
10
The DevInfo 6.0 home page will appear on your screen (Fig. 1.1).
Fig. 1.1 DevInfo 6.0 home page
Opening the Data Wizard
The Data Wizard allows you to easily access data and generate presentation objects - tables, graphs
and maps - with minimal user training. Click
Start to open the Data Wizard (Fig. 1.2).
11
Fig. 1.2 Data Wizard
Selecting a database
Before searching for data, you must first select a database. When you open the Data Wizard, the
application selects a default database, which appears in the Database box at upper right. A
description of the selected database appears at upper center below the database name.
To select your own database, click the Database box to open the Open dialog box, which displays a
list of all available offline databases in the default location (Fig. 1.3). Scroll down to view the complete
list, select the desired database, and click OK.
12
Fig. 1.3 Selecting a database from the Open dialog box
Selecting indicators and areas
After selecting a database, you can begin searching by either selecting indicators or areas. Click
either
Select Indicator or
Select Area to begin searching for data.
The Data Wizard will now guide you through an easy three-step process to search for and view your
data as a table, graph and map.
Depending on how you wish to search for data, your first step is either selecting one or more
indicators (Fig. 1.4a) or selecting one or more areas (Fig. 1.4b). Scroll down to view the entire list of
available indicators and areas in the selected database. Select the check box next to the indicator(s)
or area(s) for which you wish to view data. Use the Select All or Clear All menu bar commands to
select or clear all the items in the list. Highlight any item and click Metadata on the menu bar to view
additional information about the selected item.
13
Fig. 1.4a Selecting indicators
Fig 1.4b Selecting areas
When you select an indicator, a sub-list will appear displaying the different indicator-unit-subgroup
(I-U-S) combinations available for that particular indicator. For example, in Fig 1.4a, selecting the
indicator “Children of secondary school age by educational status” results in three I-U-S combinations
being displayed, each representing data for a different subgroup. To refine your data search, clear the
I-U-S combinations for which you do not wish to view data.
14
To view the different sub-areas available for your selected indicator(s), click the Area Level box
below the menu bar to select a new area level. Note that area level 1 refers to the highest area level
in the database (for example, continents), area level 2 to the next sub-level (for example, countries),
area level 3 to the next sub-level (for example, states or provinces), etc.
Speed up your data search by using the built-in search features. In the indicator search box located
just below the menu bar, type keywords such as “education” or “child” to view all the indicators
containing those keywords. Likewise, type the first few letters of an area name (such as “Tan” for
Tanzania) in the area search box to view all the available areas containing those letters.
Tip: Searching for indicators and areas in Tree View
Sometimes you may wish to search for indicators by category (for example, all healthrelated indicators) or for areas by regional grouping (for example, all the countries in
Asia). To do this, click Tree View on the menu bar after clicking either the Select
Indicator or Select Area tabs.
In the tree view for indicators, all available indicators will now be grouped under a particular
classification displayed on the menu bar: Sector, Goal, Framework, Theme, Source, Institution or
Convention (Fig. 1.5a).
Fig. 1.5a Searching for indicators in tree view
15
Tip: Searching for indicators and areas in Tree View
In the tree view for areas, all available areas will now be grouped under different area nodes: for
example, continents, countries, etc. (Fig. 1.5b).
Fig. 1.5b Searching for areas in tree view
Select any category in the left pane to view the list of all available indicators or areas in the middle
(Available) pane. Use the selection arrows in the toolbar at the top of each pane to transfer your
selections from the middle (Available) pane to the right (Selected) pane. This is particularly useful if
you wish to quickly select all the countries in a continent or all the sub-national regions in a country.
For more information on how to make selections in tree view, see Chapter 2, “Searching for Data.”
When you are finished making your first selection(s), click the second tab (either Select Area
Select Indicator
16
) to continue with your second selection(s).
or
Viewing tables, graphs and maps
After making both your indicator and area selections, click the Query Database
tab to query the
database and view the data. The Data Wizard will query the database based on your indicator and
area selections and will generate three different presentation objects to display the data: a table, a
map and a graph. These can be viewed by selecting the Table, Map and Graph tabs (Fig. 1.6). By
default, the Data Wizard displays the data in table presentation first.
Fig 1.6 Data displayed in table presentation
To enlarge the table for better viewing and editing, click
Click to enlarge on the left toolbar. You
will now be able to conveniently edit your table using either the editing tools on the Table toolbar or
the editing features on the left panel (Fig. 1.7). The Wizard feature at the top of the left panel guides
you step-by-step through the various table editing options. For more details on how to edit tables, see
Chapter 4, “Tables.”
17
Fig. 1.7 Editing the table using the Table toolbar and the left panel
When you are satisfied with your table edits, you can save it or print it by clicking Save | Print at the
bottom of the left panel. By default, DevInfo 6.0 saves all presentation objects in the Gallery, where
they can later be conveniently viewed and edited.
To view your data displayed in map and graph presentations, click the Map and Graph tabs,
respectively (Figs. 1.8a and 1.8b).
18
Fig. 1.8a Data displayed in map presentation
Fig. 1.8b Data displayed in graph presentation
19
The process for viewing and editing maps and graphs is the same as that for tables. After clicking
Click to Enlarge on the left toolbar, you can conveniently edit your map and graph using either
the editing tools on the Map and Graph toolbars or the editing features on the left panel (Figs. 1.9a
and 1.9b).
Fig. 1.9a Editing the map using the Map toolbar and the left panel
Fig. 1.9b Editing the graph using the Graph toolbar and the left panel
20
The Wizard feature at the top of the left panel guides you step-by-step through the various map and
graph editing options. For more details on how to edit maps and graphs, see Chapter 5, “Maps” and
Chapter 6, “Graphs.”
When you are satisfied with your map and graph edits, you can save them or print them by clicking
Save | Print at the bottom of the left panel.
Using the Gallery
Click
Gallery from the Data Wizard home page to view and manage the various presentation
objects - tables, maps and graphs – created in DevInfo. The Gallery displays these objects as
thumbnails (reduced-size images) (Fig. 1.10).
Fig. 1.10 Gallery
Within the Gallery, you can perform the following tasks:
•
•
•
•
Browse and view Gallery objects
Edit Gallery objects
Replicate Gallery objects for different indicators, areas and time periods
Copy Gallery objects directly into MS PowerPoint
For more details on how to use the various Gallery features, see Chapter 7, “Gallery.”
21
Refining your data search: selecting time periods, sources and
areas for which data does not exist
You can easily refine your data search by selecting different time periods and data sources as well as
areas for which data does not exist.
Selecting different time periods
Sometimes you may wish to view data for multiple time periods, in order to compare data over time or
to view trends. By default, the Data Wizard displays data only for the most recent time period.
To view data for multiple time periods, click Time Period on the menu bar. The time period window
opens, displaying all time periods for which data is available. If you have previously made indicator
and/or area selections, then the time periods for which data is available based on your selections will
be displayed (Fig. 1.11).
Fig. 1.11 Selecting different time periods
Clear the Most Recent check box to the right of the search box and select the desired time periods.
When you are finished, click one of the Data Wizard tabs or Next on the menu bar to continue.
Another way to view data for multiple time periods is to first select your indicator(s) and area(s), click
Query Database and then clear the Most Recent check box below the Gallery tab. Data for all
available time periods will now be displayed.
22
Tip: Pivoting tables to generate a time series table
To display data trends over time in a time series table, first make your selections, query
the database, and clear the Most Recent check box in the Table window. Then click
Pivoting on the left toolbar several times until the time periods are displayed as
sequential columns.
Selecting different sources
Sometimes you may wish to view data from a particular source. By default, the Data Wizard displays
data from recommended sources only. (The decision as to which sources are recommended is left to
the database administrator.) If you wish to view all data sources available for your selections, simply
click Source on the menu bar. The source window opens, displaying all sources containing data for
your selections (Fig. 1.12). You now have the option to select or clear the desired sources to further
refine your data search.
Fig. 1.12 Selecting different sources
23
Selecting areas where data is not available
Sometimes you may wish to create a map for an entire geographic region showing all of its areas,
even if data is not available for some of them. By default, the Data Wizard only displays areas for
which data exists. As a result, this often leads to incomplete map presentations with missing areas
(Fig. 1.13).
Fig. 1.13 Sample regional map with missing areas
To create a map for an entire geographic region showing all of its areas, simply clear the Show
where data exists check box on the menu bar in the Area window before making your area
selections. The Data Wizard will now display all available areas for your selection, allowing you to
generate a more complete map (Fig. 1.14). Note that by default, areas with missing data are
displayed in grey.
24
Fig. 1.14 Sample regional map displaying areas with missing data in grey
Getting more out of DevInfo
This chapter has covered only the Data Wizard feature in DevInfo 6.0, which provides the quickest
way for new users to begin using DevInfo. Once you are comfortable using the Data Wizard, you may
wish to begin exploring the many additional DevInfo features available in the regular (non-Wizard)
data search mode. These features include powerful tools to help you search for, organize, filter,
analyze, present and share your data using the latest database technology.
More details about these features can be found in the remaining chapters of the User’s Guide.
25
CHAPTER 2
Searching for Data
Searching for data is the first and most important task facing any DevInfo user. Before you can
analyze, present or share any data, you must first search for it accurately. One of the greatest
strengths of DevInfo database technology is that it helps you quickly search for the data you want, in
the way you wish to search for it.
This chapter gives an overview of the following tasks related to searching for data in regular (nonWizard) mode:
•
•
•
•
•
•
•
•
•
26
Understanding the home page features
Selecting a database
Selecting data elements
Selecting indicators
Selecting areas
Selecting time periods
Selecting sources
Starting over with a new search
Using search boxes to speed up your search process
Understanding the home page features
When you start the DevInfo application, the DevInfo 6.0 home page will appear on your screen
(Fig 2.1).
Top panel
Database
box
Data
search box
Bottom panel
Fig. 2.1 DevInfo 6.0 home page
The various home page features are explained below.
Top panel features
Located on the top panel are the main data search and presentation features of DevInfo:
Home
Takes you back to the DevInfo home page from any window
Indicator
Opens the indicator window to allow you to view and select indicators
Area
Opens the area window to allow you to view and select areas
Time Period
Opens the time period window to allow you to view and select time periods
27
Source
Opens the source window to allow you to view and select sources
Data
Takes you to the data view window to allow you to view data
Gallery
Opens the Gallery window to allow you to view and edit saved tables, maps
and graphs
Reports
Opens the Reports window to allow you to create and edit reports
Bottom panel features
Located on the bottom panel are the following additional data analysis and presentation features as
well as administrative options:
28
di About
Provides links to important product information about DevInfo 6.0, including
live updates
di Settings
Allows you to customize the DevInfo 6.0 user interface settings
di DataWizard
Launches the Data Wizard
di Book
Allows you to create animated flipbooks using DevInfo presentation objects
di Video
Allows you to create videos using DevInfo presentation objects
di Profiles
Allows you to generate uniform profiles for multiple areas using created
profile layouts
di Analyzer
Allows you to display and view data in scatter plots to analyze correlations
among multiple indicators over time
di Tree Map
Allows you to display and view data in tree maps to analyze data patterns
and relationships
di Radar
Allows you to display and view data in radar charts to analyze relative data
values for a set of indicators
di Sidebar
Launches a customizable desktop sidebar providing quick access to Gallery
objects, RSS feeds, and related facts
Other home page features
Other features located on the home page include the following (Fig. 2.1):
Start
Launches the Data Wizard
Database box
Displays the selected database and allows you to view and select other
databases
Data search box
Allows you to search the entire database by keywords
29
Selecting a database
The first step in searching for data is selecting a database. When you start the DevInfo application, a
default database appears in the Database box. To view a description of this database as well as a list
of other available databases, click the Database box. The Open dialog box opens, displaying all
available offline databases in the default location (Fig. 2.2).
Fig. 2.2 Selecting an offline database
Scroll down to view the list of databases available in the default location. To view a comprehensive
summary of any database, select the desired database and click Summary Report. To view and
select other offline databases, click the arrow to the right of the file directory box and select more…
If you wish to select an online database, click the Online tab to open the Open dialog box
(Fig. 2.3). Click the arrow to the right of the online database connection box to view and select a
previously-saved online database connection.
30
Fig. 2.3 Selecting an online database
To connect to an online database not listed, click
New Connection to open the New
Connection dialog box (Fig. 2.4). Provide the requested information and click Test to authenticate
the user name and password on the specified server. The system will return a Connection
successful message after authentication. Click Save to save the connection for future use.
Fig. 2.4 Providing details for a new online database connection
After selecting your desired database, click OK.
31
Note: Selecting a database
Each time the application is opened, the last database selected becomes the new
default database.
Selecting data search elements
After selecting a database, the next step is selecting the data search elements. Only after selecting
these elements can you query the database, view the data, and generate tables, maps, graphs and
other presentation objects.
DevInfo 6.0 allows you to search for data by selecting four major data search elements, all located on
the top panel:
•
Indicator
•
Area
•
Time Period
•
Source
These elements can be selected in any sequence, and you can choose to modify them at any time.
You can also choose to skip selecting one or more of these elements, in which case the system will
automatically search for all records where data is available based on your previous selections.
Generally, you should always select indicator(s) and area(s) at a minimum, to narrow your data
search. Note that at least one element must be selected in order to generate a data view.
To select an element, click its button on the top panel to open its respective window, in which you can
make your selections. The process of making a selection is similar for all the elements. When you
have finished making your selection(s), click another element button to make additional selections.
Below are details on how to select indicators, areas, time periods and sources, as well as useful tips
to help you select these elements more efficiently.
32
Selecting indicators
Click
Indicator to open the indicator window, in which you can view and select indicators. In
DevInfo, indicators refer to pointers or benchmarks intended to measure progress towards particular
goals. Note that the indicator window is divided into three panes: left, center and right (Fig. 2.5).
Fig. 2.5 Indicator window
The left pane displays the various classifications under which the available indicators are grouped. By
default, indicators are classified according to Sector as displayed in the pane header below the
toolbar. In DevInfo, indicators can be classified in seven different ways: Sector, Goal, Framework,
Theme, Source, Institution and Convention. Click any of these to change the indicator
classification, to help you better search for indicators.
33
Note: Indicator classification definitions
Under Sector, indicators are classified according to sectors typically used at the national
and international levels, such as demography, education, health and women.
Under Goal, indicators are classified according to agreed-upon national or international goals, such
as national planning goals and the Millennium Development Goals.
Under Framework, indicators are classified according to agreed-upon national or international
frameworks, such as DFID’s Sustainable Livelihoods framework and IFAD’s Food Security
framework.
Under Theme, indicators are classified according to broad themes, such as poverty and gender.
Under Source, indicators are classified according to data source, such as government and
international agencies.
Under Institution, indicators are classified according to related institutions, such as national
governments, UN agencies and NGOs.
Under Convention, indicators are classified according to formal UN multi-lateral conventions, such
as the Child Rights Convention and the Convention on Bio-Diversity.
Click any indicator classification in the left pane. Immediately in the center or Available pane, you will
see a list of all available indicators classified under your selection. Note that in the Available pane,
the list of indicators is displayed in three columns: Indicator, Unit and Subgroup (Fig. 2.6).
34
Fig. 2.6 Available pane displaying indicator, unit and subgroup columns
In DevInfo, indicators are always linked with units and subgroups to form indicator-unit-subgroup or
I-U-S combinations. Examples of units in DevInfo include percent, births per thousand and million.
Examples of subgroups in DevInfo include female/male, rural/urban and 15-19 years of age.
To view the I-U-S combinations in their entirety, click
View Horizontally on the toolbar. The
Available and Selected panes will now be displayed horizontally, allowing you to better view the I-US combinations (Fig. 2.7). You can further adjust the viewing area within these panes by clicking and
dragging the I-U-S column dividers to either side.
35
Fig. 2.7 Viewing I-U-S combinations horizontally
Tip: Viewing only indicators, not units or subgroups
By default, the Available pane displays the indicator-unit-subgroup (I-U-S)
combinations. Click
Show Units and Subgroups on the left pane header to
view only indicators. Click it again to return to the original I-U-S view.
To expand the indicator classifications in the left pane to show sub-classifications, either double-click
the classification or click the plus sign
next to the classification. The sub-classifications will now be
displayed in tree view. To focus your indicator search, click any sub-classification to view all its
related indicators in the Available pane.
Tip: Learning more about indicators
To learn more about a particular indicator, highlight it and click
Information on the
toolbar. A window will open displaying descriptive information (metadata), where
available, about the indicator.
36
Making your selections
Items are selected only when they appear in the Selected pane - either the right pane or the lower
right pane, depending on whether you have clicked
View Horizontally (Fig. 2.8). DevInfo allows
you to make selections in multiple ways, depending on your preference. The process of making and
deleting selections is similar for all the data search elements (indicator, area, time period and source).
Fig. 2.8 Making your selections
Selecting items
Selecting an item involves moving it from the Available pane to the Selected pane. To do this, you
can:
•
•
Double-click the item
Click and drag the item to the Selected pane
•
•
Highlight the item and click
Select Highlighted on the Available pane header
Highlight the item, right-click and choose Select Highlighted from the right-click menu
37
To select multiple items in the Available pane, you can:
•
•
Click an item and hold down the SHIFT key while using the arrow keys or the mouse to
highlight a block of items
Click an item and hold down the CTRL key while using the mouse to highlight multiple
scattered items
To select all the items in the Available pane, you can:
•
•
Click
Select All on the Available pane header
Right-click in the Available pane and choose Select All from the right-click menu
Sometimes you may wish to select all items in the left (tree view) pane, such as all the indicators in
the database. To do this, click
Select Al on the left pane header.
Deleting selections
To remove one or more items from the Selected pane, you can:
•
Double-click the item(s)
•
•
Highlight the item(s) and click
Remove Highlighted on the Selected pane header
Highlight the item(s), right-click and choose Remove Highlighted from the right-click
menu
Highlight the item(s) and press the DELETE key
•
To remove all the items from the Selected pane, click
Remove All on the Selected pane header
or right-click in the Selected pane and choose Remove All from the right-click menu.
Tip: Sorting your selections
To quickly sort your selections in ascending or descending order, click any of the column
headers in the Selected and Available panes.
38
Selecting areas
Click
Area to open the area window, in which you can view and select areas (Fig. 2.9). The left
pane displays the tree view of all available areas, grouped by area levels - continents, countries, subnational regions, etc.
Fig. 2.9 Area window
Click an area or the plus sign
next to the area to view all areas available in the next sub-level
(Fig. 2.10). For example, in a particular database, area level 1 could refer to continents, area level 2
to countries, area level 3 to states or provinces, etc. In the example below, clicking “Africa” (area level
1) in the left pane causes various African countries (area level 2) to be displayed in the Available
pane.
39
Fig. 2.10 Viewing available areas
Note: Area ID
Each area in DevInfo has a unique Area ID which is used to link the area name with its
associated map file. The Area ID is displayed in the center column of the Available
pane.
The process for selecting areas is nearly identical to that of selecting indicators. Transfer the desired
areas from the Available pane to the Selected pane using any of the methods previously described.
Additionally, you can double-click any area in the left pane to transfer it immediately to the Selected
pane.
Tip: Selecting all countries within a continent or all sub-national regions within a country
To select all countries within a continent, you can:
· Click the desired continent in the left pane and then click
Select All on the
Available pane header
· Click the desired continent in the left pane, click the Area Level box on the left pane header, select
area level 2, and then click
Select All on the left pane header.
This same procedure can be used to select all sub-national regions (such as states or provinces)
within a country.
40
Selecting areas by map
You can also select areas by map instead of by name. This is particularly useful when you wish to
select various countries within a continent or various sub-national regions within a country. In the area
window, click Map on the menu bar and select the desired area from the area tree to view its map in
the Available pane (Fig. 2.11). For some maps, you may wish to click
better viewing.
View Horizontally for
Fig. 2.11 Selecting areas by map
Click any area in the left pane (area tree) to view its map in the Available pane. Then click
Select
on the map toolbar on the Available pane header. The mouse pointer changes into a map pointer.
Move the map pointer over different map areas and click to select them. The selected areas are
highlighted and will automatically appear in the Selected pane.
Use the other tools on the map toolbar to make your area selection process easier. You can:
•
Click
Full Extent to view the entire map in the pane
•
Click
Zoom in Frame to use the mouse to select and zoom in on a particular area
•
Click
Zoom In to zoom in on a particular area by a fixed magnitude
•
Click
Zoom Out to zoom out from a particular area by a fixed magnitude
•
Click
Pan to pan (move) to a particular location on the map using the mouse
41
•
Click
Labels to display labels (area names) on the map
Tip: Selecting various countries within a continent or various sub-national regions within a
country
If you have selected a database containing composite maps, then you can select various
countries within a continent by doing the following:
· First click Map on the menu bar to view areas displayed in Map view.
· Then click the desired continent in the left pane to display its map with country boundaries outlined
in the Available pane.
· Then click
Select on the map toolbar and select the desired countries. Use the other tools on
the map toolbar to make your selection process easier.
This same procedure can be used to select various sub-national regions (such as states or
provinces) within a country.
Selecting time periods
Click
Time Period to open the time period window, in which you can view and select time
periods (Fig. 2.12). The left pane displays all available time periods. Note that the time period window
only contains two panes, Available and Selected.
42
Fig. 2.12 Time period window
Transfer the desired time periods from the Available pane to the Selected pane using any of the
methods previously described.
Tip: Using Auto-Select to select time periods, indicators and areas
Often when searching for data, you may have no idea which time periods contain data
for the selected indicator(s) and area(s). For example, suppose data exists only for the
time periods “2004” and “2006” for the combination of indicator(s) and area(s) you
selected. If you select “2007” and “2008” as time periods, wishing to get the most recent data, the
system will display a “No records found” message when you query the database.
To avoid this scenario, it is generally recommended that you use the Auto-Select feature when
selecting time periods. After making your indicator and area selections, open the time period window
and click
Auto-Select on the Available pane header. This will instruct the system to
automatically select only those time periods for which data is available, based upon your previous
selections (in this case, indicator and area). The auto-selected time periods will appear in the
Selected pane. If you wish, you can manually remove any unwanted selections.
While the Auto-Select feature is most often used to select time periods, it can also be used to autoselect indicators and areas. For example, if you are interested in a particular country and wish to
view all the indicators containing data for that country, you can select that country and auto-select
the indicators. Or if you are interested in a particular indicator and wish to view all the countries
containing data for that indicator, you can select that indicator and auto-select the areas.
43
Selecting sources
Selecting sources is a new feature in DevInfo 6.0 and offers a convenient method to restrict your data
search to the selected source(s) only. Click
Source to open the source window, in which you can
select the desired sources for which you wish to view data. To learn more about a particular source,
highlight it and click
Information on the toolbar.
If you choose not to select any sources, the application will automatically display data from all
available sources.
Starting over with a new search
At any point if you wish to start over with a new search, click
previous selections for all data search elements.
Start Over on the toolbar to clear all
You can also select a new database to search by clicking the Database box.
Using search boxes to speed up your search process
You can greatly speed up your data search by using the various search boxes. There are four search
boxes available for your use:
•
•
•
•
Indicator
Area
Data
Database
To speed up your indicator search, open the indicator window and use the indicator search box,
located at the right of the toolbar. For example, type keywords such as “education” or “child” to search
the database for and view all indicators containing these keywords.
In the same way, speed up your area search by using the area search box, located at the right of the
toolbar in the area window. Type the first few letters of an area name (such as “Tan” for Tanzania) to
search for and view all areas containing these letters.
44
Use the data search box located just below
Gallery and
Reports to search the database by
one or more keywords. For example, type “Philippines population” to search for and view all data
containing these keywords.
To search for data across multiple databases, use the database search box. Click the Database box
to open the Open dialog box (Fig. 2.2). Enter one or more keywords in the database search box at
upper right to search for data across all available offline databases.
45
CHAPTER 3
Viewing Data
After selecting your indicator(s), area(s), time period(s) and source(s), you are now ready to view the
data. Click
Data to query the database and generate the data view in the data window (Fig 3.1).
Fig. 3.1 Data window
Note that the data window is divided into two panes. The top pane contains the data view, which
displays all the data records - the data values along with their associated data elements. The bottom
pane contains three presentation preview panels, which display data for your selections in table, map
and graph preview format.
Data view overview
The data view displays the data records for your selections in eight columns: Time Period, Area ID,
Area Name, Indicator, Data Value, Unit, Subgroup and Source. The total number of selected
46
records in the data view is displayed at lower left under the table preview. Note that by default, all the
data records are considered while generating the table, map and graph presentations.
Click any column header to quickly sort the column items in ascending or descending order. For
example, click the Data Value column header to sort the records by data value in ascending order.
Click it again to sort the records in descending order.
To re-arrange the order of the columns in the data view, drag any of the column headers to the
desired location in the column header area.
Presentation preview panel overview
Move the mouse pointer over any of the three presentation preview panels (table, map or graph) to
cause its respective toolbar to appear at the left of the preview panel (Fig 3.2).
Fig. 3.2 Moving the mouse pointer over any of the presentation
preview panels causes its toolbar to appear at left
To enlarge any of the presentation objects (table, map or graph) for better viewing and editing, click
Click to enlarge on its toolbar. You will now be able to conveniently view and edit the object. For
details on how to edit presentation objects, see Chapter 4, “Tables,” Chapter 5, “Maps,” and
Chapter 6, “Graphs.”
47
Customizing the data view
By default, all the records displayed in the data view are considered while generating the table, map
and graph presentations. However, you can filter the records considered for these presentations by
clearing the check boxes to the left of the desired records. Although the cleared records will still be
visible in the data view, they will not be considered while generating presentation objects.
To clear a range of data records, highlight a record and use the mouse or SHIFT + arrow keys to
select a range of records and then press DELETE. To restore the cleared records, click
on the toolbar and choose Clear Filter to return to the original data view.
Filters
Using the grouping bar to group elements
Sometimes when the data view contains many records, you may wish to see the records grouped by
particular data elements for easier viewing. To do this, click the dotted line
below
Calculate on the toolbar. The grouping bar will now be visible above the data view (Fig. 3.3).
Grouping bar
Fig. 3.3 Revealing the grouping bar to group data records
Click and drag any column header to the grouping bar to view the data grouped by that column
element. For example, dragging Area Name to the grouping bar instructs the system to group all data
records by area name. This allows you to easily view multiple data records for each area name
(Fig. 3.4).
48
Fig 3.4 Grouping data records by area name
You can drag additional column headers to the grouping bar to further organize your data view by
sub-headers. You can also re-arrange them in any order by dragging them within the grouping bar.
To return to the original data view, drag the column headers back to the data view area.
Data view toolbar
The data view toolbar in the data window contains 12 tools to help you better view and manage your
data. Each of these will be explained below.
Open
Click
Open to open the Open dialog box to select a new database.
Print
Click
Print to generate a .pdf file of the data view, which can subsequently be printed.
Export
Click
Export to export your data to another file format, such as .xls or .pdf.
49
Information
Click
Information to display indicator, area and source information (metadata) about any
highlighted record.
Data View
Click
Data View to view the data displayed only in the three presentation preview panels - table,
graph and map (Fig. 3.5). Click it again to return to the default view.
Fig. 3.5 Viewing the data displayed only in the three presentation preview panels
Table
Click
Table to display the data view in table format. Click it again to return to the default view.
Sort
Click
50
Sort to open the Sort dialog box to sort the data according to various criteria (Fig. 3.6).
Fig. 3.6 Sort dialog box
To specify criteria for sorting, double-click any element in the Available pane or use the selection
arrows in the pane header to transfer it to the Selected pane. You can specify multiple criteria for
sorting by selecting multiple elements. To change the order of the sort elements, highlight an element
in the Selected pane and click
Move Up or
Move Down. Click the
element to indicate whether you want the records sorted in
ascending or
arrow to the left of the
descending order.
When you are finished specifying your sort criteria, click OK to sort and view the data.
Most Recent
Click
Most Recent to filter and display only the most recent data for each I-U-S and area
combination in the data view. Click it again to revert to the original view.
For example, selecting the indicator “Infant mortality rate” for a particular country may yield many data
records, one for each year. Click
the most recent year.
Most Recent to filter the data to display only the record from
51
Filters
Click
Filters to open the Apply Filters window to filter the data records according to various
criteria. The Apply Filters window contains six tabs: Source, Unit, Subgroup, I-U-S, Data Value and
Time Period (Fig. 3.7).
Fig. 3.7 Apply Filters window displaying the Source tab
By default, the Apply Filters window opens to the Source tab, under which you can view and filter
records based on their sources. The system displays the source for each indicator-unit-subgroup (I-US) combination. If you do not wish to view data from a particular source, you can clear the source
selection only for that particular I-U-S combination or click
combinations and then clear the source for all I-U-S combinations.
I-U-S to hide all the I-U-S
Click the Unit and Subgroup tabs to view and filter records based on their units and subgroups. If
you do not wish to view data for a particular unit or subgroup, you can clear those selections.
Click the I-U-S tab to set minimum and maximum values for particular I-U-S combinations. Enter
these values in the From and To columns next to the I-U-S combinations you wish to filter (Fig 3.8).
The data records will then be filtered based on the specified ranges.
52
Fig. 3.8 Filtering records based on data values for
particular I-U-S combinations
Click the Data Value tab to filter records based on all data values. Click the box to display four filter
options: Between, Greater than, Less than and Equal to (Fig. 3.9).
Fig. 3.9 Filtering records based on all data values
Select the desired filter and enter the appropriate values. For example, if you wish to view only those
records with data values between 60 and 80, select Between and enter “60” and “80” in the boxes
that appear.
53
Click the Time Period tab to filter records based on the most recent time period only. Select the Most
Recent check box to display the most recent data for all indicator and area combinations. Note that
this performs the same function as
Most Recent (Fig 3.10).
Fig. 3.10 Filtering records based on the most recent time period
At any point, you can click Cancel to cancel only your most recent filter selection or click Clear Filter
to clear all filters. When you are finished making your filter selections, click OK to apply them and
view the filtered data.
Calculate
Click
Calculate to perform the following calculations on the data values: Percent, 100 Minus,
Composite Index, Subtotal, Transform Unit and User Defined Formula. The Calculate tool is
discussed in detail in Chapter 9, “Calculate.”
Statistics
Click
Statistics to view the following statistical values for each of the I-U-S combinations
displayed in the data view: count, minimum, maximum, mean, standard deviation and variance
(Fig. 3.11).
54
Fig. 3.11 Statistics window
Start Over
Click
Start Over at any point to clear all selections for all data search elements and start over
with a new search.
Right-click menu commands
Right-click anywhere in the data view to display a menu with six data view commands (Fig. 3.12).
Fig. 3.12 Right-click menu
55
Click Enable Auto Filters to set up filters (
(Fig. 3.13).
) on each of the column headers in the data view
Fig. 3.13 Enabling Auto filters on each of the column headers
Click
on any column header to display the Auto Filter menu containing various filter options. For
example, to view data records for a particular year only, click
on the Time Period column header
and select the desired year from the Auto Filter menu (Fig. 3.14). Click Custom to customize your
own filter for any column.
Fig. 3.14 Using the Auto Filter feature to filter time periods
56
Click Expand Subgroup to expand the subgroup column in the data view to show its different
dimensions: sex, age, location, etc.
Click Format to change the default format settings for the data view.
57
CHAPTER 4
Tables
DevInfo 6.0 automatically generates three presentation objects based on the data view to help you
prepare professional presentations and reports: a table, a map and a graph. Each of these objects
can then be edited and formatted as per your requirements and then printed or saved.
This chapter deals with how to edit tables. In DevInfo 6.0, the same procedure is used for editing
tables, whether in regular or Data Wizard mode.
Note: Finalize the data view before editing a table
Before editing your table, ensure that the data view contains the data records you wish
to display. If necessary, refine your indicator, area and time period selections, because
you cannot change the data records while editing your table. Alternatively, use the
various filter options to refine the data view.
Table editing overview
Move the mouse pointer over the table preview panel at lower left in regular mode to cause the table
preview toolbar to appear at the left of the panel (Fig 4.1). The same toolbar is located to the left of
the table in Data Wizard mode.
58
Fig. 4.1 Move the mouse pointer over the table presentation preview panel
to cause its respective toolbar to appear at left
You can use the horizontal and vertical scroll bars on the preview panel to quickly preview your entire
table. From the toolbar on the table preview panel, you can also pivot your table by clicking
Pivoting and
Pivoting. If you are satisfied with your table, you can click
table in various file formats.
To enlarge your table for more convenient viewing and editing, click
Table window (Fig. 4.2).
Save to save your
Click to enlarge to open the
59
Fig. 4.2 Table window
The Table window displays your table with the default format settings for the rows, columns and other
table elements. To edit your table, you can use any of the following:
•
•
•
Editing tools on the Table toolbar
Editing features on the left panel
Table Wizard
Each of these will now be explained in detail.
Editing tools on the Table toolbar
The Table toolbar located at the top of the Table window contains the following ten editing tools:
60
Suppress Duplicate Rows
Suppresses duplicate rows in the table
Suppress Duplicate Columns
Suppresses duplicate columns in the table
Autofit
Automatically adjusts the column widths to fit the longest
entry
Footnotes
Displays footnotes for data values wherever entered in the
database
Comments
Displays comments about data sets wherever entered in the
database
Denominator
Displays the denominator used to compute data values
wherever entered in the database
Row and Column Header
Displays the MS-Excel row and column headers
Pivoting
Column Arrangement
Pivots the table either counter-clockwise or clockwise
Allows you to re-arrange the column order (for more
details,see Step 3 – Arrangements under the “Table Wizard”
heading later in this chapter)
Editing features on the left panel
The left panel in the Table window contains six features which allow you to edit your table: Theme,
Rows and Columns, Sort, Format, Page Setup and Save | Print (Fig. 4.3). The Table Wizard
feature will be discussed separately later in this chapter.
Fig. 4.3 Editing features on the left panel
61
Theme
The
Theme feature allows you to apply a customizable color theme to the table. Click the arrow
to the right of
Theme to expand the panel window (Fig. 4.4).
Fig. 4.4 Expanded Theme panel window
Select the Apply Color check box to instruct the system to automatically arrange the data into four
equal breaks and apply a default color scheme to each break (Fig. 4.5).
62
Fig. 4.5 Applying default breaks and a color scheme to the table
To change any of the default colors, click any color in the expanded Theme panel window and select
the desired color from the color palette. To remove the color scheme from the table, clear the Apply
Color check box.
To edit the data breaks, click
Theme window (Fig. 4.6).
Theme Edit at the lower left of the panel window to open the
63
Fig. 4.6 Theme Window
The Indicator box displays the indicator to which the breaks and color scheme have been applied. To
apply the breaks and color scheme to a different indicator (if multiple indicators were selected in the
data view), click the box and select the desired indicator from the list.
The Breaks box displays the number of data breaks. To change the number of data breaks, use the
box arrows or enter the desired number of breaks. You can set a maximum of ten and a minimum of
two breaks.
The box to the right of the Breaks box displays the method of data break. Click the box to select one
of the following four methods of data break:
Equal count
Instructs the application to arrange the data values into the specified number
of breaks such that each break has approximately the same number of data
values.
Equal size
Instructs the application to arrange the data values into the specified number
of breaks such that each break range (that is, the difference between the
From and To range values) is of the same magnitude.
64
Continuous
Instructs the application to arrange the data values into the specified number
of breaks according to the continuous break ranges specified by the user.
You can change the range values for each break by entering new values in
the To column. Upon changing a value in the To column, the other break
ranges will be automatically re-calculated to ensure continuity.
Discontinuous
Instructs the application to arrange the data values into the specified number
of breaks according to the discontinuous break ranges specified by the user.
You can change the range values for each break by entering new values in
both the From and To columns. Upon changing any of these values, the
other break ranges will not be automatically re-calculated.
Tip: Choosing the right method of data break
Choose Equal Count to divide your areas into groups of equal count.
Choose Equal Size to show the inherent variation in the data values.
Choose Continuous to manually define the break ranges while retaining continuity across the
breaks. For example, you may wish to show which sub-national regions are close to the national
average for a given indicator.
Choose Discontinuous to group data values that are widely dispersed. For example, you may wish
to group data for maternal mortality rates across developed and developing countries.
The Minimum and Maximum boxes display the default values for the minimum and maximum range
values for the data set. You can change these by entering new values in these boxes.
The Decimal box displays the default number of decimal places used for all data values and the
break range values. You can change the default setting by entering a new number in the box. Note
that changing this number may affect the distribution of the data values across the various breaks.
The High is Good box displays the default setting indicating that the higher the data value, the better
the indicator performance. For some indicators, however, the reverse is true - such as infant mortality
rate, illiteracy, carbon dioxide emissions, etc. To apply a reverse color scheme for such indicators,
select No from the list in the box.
Click Apply to the right of the Decimal box to apply and view the specified data break settings.
65
To add captions to the table legend, click the respective boxes in the Caption column and enter the
desired captions.
To change the color of any data break, click its color box and select the desired color from the color
palette. Click Smooth to smooth out the color gradient from the first break to the last.
When you are satisfied with your color theme, click OK.
Rows and Columns
The
Rows and Columns feature allows you to specify the row and column elements that you
wish to include in the table. Click the arrow to the right of
Rows and Columns window (Fig. 4.7).
Rows and Columns to open the
Fig. 4.7 Rows and Columns window
Note that the window is divided into four panes. The Available pane displays the list of elements
available for selection for the table rows and columns. The Rows and Columns panes display the
default selections for the table rows and columns, respectively. To specify additional row and column
elements or to modify the default selections, transfer the desired elements from one pane to the other
by either using the selection arrows in the pane headers or by dragging them.
66
Tip: Showing time series data in a table
To show time series data in a table, transfer the Time Period element from the Rows
pane to the Columns pane. Now you will be able to view data trends over time.
The Aggregate Functions pane allows you to generate and display the following aggregate statistics
in your table:
•
•
•
•
•
Sum
Count
Mean
Minimum
Maximum
Select the Aggregate Functions check box and then select the statistical functions you wish to be
applied to the table data. If you wish to apply these functions to groups of data records, select the
Group By check box and make your selection from the list.
When you are satisfied with your row and column settings, click OK.
Sort
The
Sort feature allows you to specify the sort order for the different row elements and data
values in the table. Click the arrow to the right of
Sort to expand the panel window (Fig. 4.8).
Fig. 4.8 Expanded Sort panel window
To modify the default sort order, highlight any element in the panel window and click
Move Down to move it to the desired location. Click the
Move Up or
arrow to the left of the element to
67
indicate whether you want the records sorted in
ascending or
selections will be automatically reflected in the Table window.
descending order. Your sort
Format
The
Format feature allows you to customize fonts, font sizes and font colors for all the items in
your table, as well as to automatically apply other previously-saved table formats to your table. Click
the arrow to the right of
Format to expand the panel window (Fig. 4.9).
Fig. 4.9 Expanded Format panel window
Note that there are four tool buttons in the panel window:
New
Allows you to create a new table format by opening the File Name
dialog box, in which you can enter a file name for your new table
format. Upon clicking OK, you will be taken to the Format window.
Edit
Opens the Format window where you can customize the fonts, font
sizes and font colors for all the items in your table.
Save
Allows you to save your table format as an .xml file for future use.
Import
Allows you to import a table format from a previously-created Gallery
object and apply the same format to your table.
In the Format window, you can customize table fonts, font sizes and font colors for all the items in
your table (Fig. 4.10).
68
Fig. 4.10 Format window
To apply a previously created and saved format to your table, click the format file name box located
just below the Format tab and select a format from the list.
The Item pane at the left of the Format window displays all the table items that can be customized:
Title, Subtitle, Columns, Rows, etc. To customize any table item, highlight the item in the Item pane
and use the Format toolbar at right to change its font, font size, font color, background color or
alignment.
Highlight various table items to cause additional customizable features to be displayed below the
Format toolbar. For example, you can edit the title and subtitle texts, adjust the column width, display
or hide footnotes and comments, opt to display legend captions instead of labels, etc.
By default, the Show Border Lines check box is selected to display the table gridlines. Clear the
check box to hide gridlines.
To apply any format change(s) and view the table without closing the Format window, click Apply.
You can now view the table with any applied format changes in the Table window behind the Format
window.
To save your table format as an .xml file for future use, click Save. When you are satisfied with your
table format, click OK.
69
Page Setup
The
Page Setup feature allows you to customize the page setup for printing your table. Click the
arrow to the right of
Page Setup to expand the panel window (Fig. 4.11).
Fig. 4.11 Expanded Page Setup panel window
Here you can change the page size, change the page orientation, and preview your table before
printing.
Save l Print
The
Save l Print feature allows you to save your table in a variety of file formats and print it.
Click the arrow to the right of
Save l Print to expand the panel menu (Fig. 4.12).
Fig. 4.12 Expanded Save l Print panel menu
Here you can save your table in the Gallery, save it as a report layout (see Chapter 8, “Reports”),
save it to the Sidebar (see Chapter 10, “Bottom Panel Features“), or print it.
70
Table Wizard
The Table Wizard feature located at the top of the left panel guides you through a series of seven
steps to help you format your table. Most of these steps are also available as stand-alone editing
features on the left panel.
Click
Wizard to start the Table Wizard. The Table Wizard window opens and automatically takes
you to Step 6 - Preview, which appears at the bottom of the table in the wizard step box (Fig. 4.13).
Fig. 4.13 Starting the Table Wizard
At any point in the Table Wizard, you can go to a different step by clicking Back or Next at the bottom
of the window or by clicking the wizard step box and selecting any step from the list. You may skip
any step if you wish, and you may exit the Table Wizard at any point without saving your table by
clicking Cancel.
Step 1 - Rows & Columns
In Step 1 - Rows & Columns, you can specify the row and column elements that you wish to include
in your table. You can also generate and display aggregate statistics such as sum, count and mean in
your table. This is identical to the
Rows and Columns feature on the left panel. For more
details, see Rows and Columns earlier in this chapter.
71
Step 2 - Apply Color
In Step 2 - Apply Color, you can arrange the data into various breaks and apply a customizable
color theme to the table. This is identical to the
details, see Theme earlier in this chapter.
Theme feature on the left panel. For more
Step 3 - Arrangements
In Step 3 - Arrangements, you can specify the grouping criteria for the table rows as well as rearrange the sequence of the table columns (Fig. 4.14).
Fig. 4.14 Table Wizard Step 3 - Arrangements
To specify grouping criteria for the table rows, first select the Classification Arrangements check
box. Next, select the desired indicator classification in the Indicator Classification pane by which
you wish to group the table rows. The upper right pane automatically displays the available subclassification for your selection. Specify the level of classification to be displayed in the box above the
upper right pane. Finally, select all the classifications by which you wish to group the table rows.
To re-arrange the sequence of the table columns, select the Column Arrangement check box and
use
72
Move Up and
Move Down to move the column headers to the desired location.
Step 4 - Sort By
In Step 4 - Sort By, you can specify the sort order for the different row elements in the table (Fig.
4.15). This is almost identical to the
Sort feature on the left panel, with the only difference being
that this window displays the Available and Selected panes. For more details, see Sort earlier in this
chapter.
Fig. 4.15 Table Wizard Step 4 - Sort By
Step 5 - Format
In Step 5 - Format, you can customize fonts, font sizes, font colors and many other items in your
table. This is nearly identical to the
earlier in this chapter.
Format feature on the left panel. For more details, see Format
Step 6 - Preview
In Step 6 - Preview, you can preview the edits made to your table in Steps 1 through 5.
73
Step 7 - Gallery
In Step 7 - Gallery, you can save your table in the DevInfo Gallery (Fig. 4.16).
Fig. 4.16 Table Wizard Step 7 - Gallery
Enter the name of your table in the Presentation Name box. By default, the table is saved in the
C:\DevInfo\DevInfo 6.0 \DevInfo 6.0\Gallery\Presentations folder. Click
in a different location.
Click Finish to save your table and exit the Table Wizard
74
Browse to save the table
CHAPTER 5
Maps
DevInfo 6.0 automatically generates a map (along with a table and a graph) based on the data view
to help you prepare professional presentations and reports. A map helps you effectively visualize data
and communicate information on development trends across geographic regions - international,
regional, national and sub-national.
Maps in DevInfo 6.0 can be edited and re-formatted to suit your preferences. You can apply multiple
themes - color gradients, patterns and charts - to the same geographic area to display data for
multiple indicators. You can overlay feature layers such as road and river networks on the base map
to improve its visual impact. You can create map insets to display data trends over time for a
particular geographic region. You can overlay the map on a three-dimensional globe to create a
raster image.
This chapter deals with how to edit maps. In DevInfo 6.0, the same procedure is used for editing
maps, whether in regular or Data Wizard mode.
Note: Finalize the data view before editing a map
Before editing your map, ensure that the data view contains the data records you wish
to display. If necessary, refine your indicator, area and time period selections, because
you cannot change the data records while editing your map. Alternatively, use the
various filter options to refine the data view.
75
Map editing overview
Move the mouse pointer over the map preview panel at lower center in regular mode to cause the
map preview toolbar to appear at the left of the panel (Fig 5.1). The same toolbar is located at the left
of the map in Data Wizard mode. Note that DevInfo automatically applies a default color scheme to
the data values, which can be later edited.
Fig. 5.1 Move the mouse pointer over the map presentation
preview panel to cause its respective toolbar to appear at left
To quickly view your map, you can use the following tools on the map preview panel toolbar:
Full Extent
Resets your map so you can view it in its full extent
Zoom In
Allows you to use the mouse to zoom in on a particular area by a
fixed magnitude
Zoom Out
Allows you to use the mouse to zoom out from a particular area by a
fixed magnitude
Pan
Allows you to use the mouse to pan (move) to any location on the
map
Labels
Displays labels (area names) on the map
If you are satisfied with the map, you can click
76
Save to save your map in various file formats.
To enlarge your map for more convenient viewing and editing, click
Map window (Fig. 5.2).
Click to enlarge to open the
Fig. 5.2 Map window
The Map window displays your map with the default format settings for the color, theme and other
map elements. To edit your map, you can use any or all of the following:
•
•
•
Editing tools on the Map toolbar
Editing features on the left panel
Map Wizard
Each of these will now be explained in detail.
77
Editing tools on the Map toolbar
The Map toolbar located at the top of the Map window contains the following 19 editing tools:
78
Select
Returns the mouse to regular pointer mode, after you are done
using any of the other map tools.
Full extent
Resets the map so you can view it in its full extent.
Zoom in Frame
Allows you to use the mouse to select and zoom in on a particular
area.
Zoom In
Allows you to use the mouse to zoom in on a particular area by a
fixed magnitude
Zoom Out
Allows you to use the mouse to zoom out from a particular area by a
fixed magnitude.
Pan
Allows you to use the mouse to pan or move to any location on the
map.
Information
Displays information (metadata) on any selected area, including the
Area ID, area name and data value (Fig 5.3).
Fig. 5.3 Viewing map information
After displaying information on an area, the area remains
highlighted. Click
Select to Highlight
Remove Highlighted
Zoom to Highlight
Remove Highlighted to remove the highlight.
Changes the mouse pointer into a map pointer, so you can move
the map pointer over different map areas and click to select or
highlight them.
Removes the highlight from all selected or highlighted areas.
Instructs the system to zoom in on all highlighted areas.
79
Labels
Instructs the system to display map labels or area names (Fig. 5.4).
Click
Labels again to hide map labels.
Fig. 5.4 Displaying map labels (area names)
Nudge
80
Allows you to nudge or re-position map labels to avoid a cluttered
look. Use the mouse to drag any label which you wish to re-position.
A leader line automatically appears, connecting the label with the
area (Fig 5.5).
Fig. 5.5 Nudging or re-positioning map labels to avoid a cluttered look
Edit Label
Opens the Label dialog box, in which you can edit map labels and
modify label settings (Fig. 5.6).
Fig. 5.6 Label dialog box
Note that you can choose to apply label edits to three different map
levels:
81
•
Active Theme (default) - Applies label edits to the
•
active theme selected in the
Theme window on the
left panel
Active Layer – Applies label edits to the active layer
•
selected in the
Layer window on the left panel
Active Selection – Applies label edits only to
highlighted
Highlight
areas
selected
using
Select
to
To display labels for the selected map level, select the Label On
check box on the left side of the Label dialog box. Then select the
data elements which you wish to display in each map label (for
example, Area Name, Data Value, etc.). On the right side of the
dialog box, you can edit the label font name, style, size and color.
To display leader lines for the selected map level, select the Leader
Line check box on the right side of the Label dialog box. You can
also modify the leader line color, style and thickness.
82
North
Inserts a north pointer in the map.
Scale
Displays the map scale.
Map Overview
Displays a small map showing the context of the currently visible
map within its larger geographic region.
Add to Raster Image
Overlays the map on a raster (three-dimensional globe) image,
using previously-installed map software such as Google Earth or
NASA Worldwind (Fig. 5.7).
Fig. 5.7 Map overlaid on a raster image in Google Earth
Note that software to display raster images is not part of the DevInfo
6.0 application and must be downloaded separately. It is
recommended that you download Google Earth (not Google Earth
Plug-In) as the raster image software to use with DevInfo 6.0.
83
Show by Time
Creates time series maps for all time periods available in the data
view, to show data trends over time. A time series bar appears
below the map (Fig. 5.8).
Fig. 5.8 Time series bar below the map
The Most Recent tab displays a map with the latest data. Click any
of the individual year tabs to view maps showing data for the
selected year. Click Map Animator to open di Video and view a
video presentation showing maps for all time periods in sequence.
84
Show by Area
Creates area series maps for all area levels available in the data
view, to show data across area levels. An area series bar appears
below the map (Fig. 5.9).
Fig. 5.9 Area series bar below the map
The All tab displays a map with data for all levels. Click any of the
individual area level tabs to view maps showing data for the
selected area level. Click Map Animator to view an animated
presentation showing maps for all area levels in sequence.
85
Editing features on the left panel
The left panel in the Map window contains seven features which allow you to edit your table:
Indicator, Theme, Layer, Inset, Format, Page Setup and Save | Print (Fig. 5.10). The Map Wizard
feature will be discussed separately later in this chapter.
Fig. 5.10 Editing features on the left panel
Indicator
The
Indicator feature allows you to view your map according to different indicators, if your data
view contains data for more than one indicator. Click the arrow to the right of
Indicator to open
the Indicator window. Then click the indicator box to display all available indicators in the data view
(Fig. 5.11).
Fig. 5.11 Indicator window displaying all indicators in the data view
Select the indicator for which you wish to see data presented on the map.
Theme
The
Theme feature allows you to apply one or more customizable themes to your map including color gradients, patterns and charts - to display data for one or more indicators. In DevInfo
86
6.0, maps can be customized along six different themes: Color, Hatch, Dot Density, Chart, Symbol
and Label. Click the arrow to the right of
Theme to expand the panel window (Fig. 5.12).
Fig. 5.12 Expanded Theme panel window
Note that the system automatically arranges the data into four breaks and applies a default color
scheme to each break. To quickly change any of the default colors, click any color in the panel
window and select the desired color from the color palette. You can also change any of the default
map border settings - color, style and thickness - by making the desired selections below Missing
Value.
Note the three tools located on the bottom of the panel window:
Add
Opens the Theme window to allow you to add a new map theme
Edit
Opens the Map window to allow you to edit the selected map theme
Delete
Deletes the selected theme
87
Editing map themes
To edit the selected map theme, click
Edit to open the Map window (Fig. 5.13).
Fig. 5.13 Editing the selected map theme in the Map window
The Map window displays the editing options available for the selected theme type. As the default
theme type is Color, clicking
Edit opens the Map window displaying editing options for the Color
theme type. Here you can edit the legend title, data breaks and colors for the map. In addition, you
can edit the map borders by specifying the border style and thickness in the Border boxes. See Color
theme type later in this chapter for more details.
To apply any map edits to the map without closing the Map window, click Apply. You can now view
the updated map behind the Map window. If you are satisfied with your map, click OK.
If you wish to apply a different theme type to the selected indicator, click Edit… at the top of the Map
window to open the Theme window (Fig. 5.14).
88
Fig. 5.14 Applying a new theme type in the Theme window
Note that there are six different customizable theme types available at the top of the Theme window:
Color
Uses different colors or color gradients to represent data ranges
Hatch
Uses different hatch patterns to represent data ranges
Dot Density
Uses dots or other symbols to represent the number of occurrences
of a particular indicator
Chart
Uses column, pie or line charts to represent data values
Symbol
Uses different symbols to represent data ranges
Label
Uses different colored labels to represent data ranges
89
To apply a different theme type to the selected indicator, first click the theme type you want. To
change the default theme name, enter the desired text in the Theme box at the top of the window.
Ensure that the indicator, unit and subgroup selections in the respective boxes are correct.
If you select Chart theme type, you will have the option to select the desired chart type - column, pie
or line - from the Chart Type box.
When you are satisfied with your selections, click OK to open the Map window and display the editing
options available for your selected theme type.
Color theme type
The Color theme type uses different colors or color gradients to represent data ranges on the map. It
is useful for presenting data for most indicators.
Click
and then click OK to edit the Color theme type in the Map window (Fig. 5.15).
Fig. 5.15 Editing Color theme type
90
Here you can edit the legend title, data breaks and colors for the map. In addition, you can edit the
map borders by specifying the border color, style and thickness in the Border boxes. See Theme,
Chapter 4, “Tables” for detailed information on how to edit the Color theme type.
Tip: Selecting colors for your data breaks
To create a smooth color gradient for your map color theme, select a light color for the
first data break range and a dark color for the last data break range. Then click
Smooth to smooth out the color gradient from the first break to the last.
To create a “traffic light” color theme, change the number of data breaks to three and color them red
(for the break representing poor performance), green (for the break representing excellent
performance), and yellow (for the middle break).
To reset the map data breaks and colors to the default settings, click Reset at the bottom of the Map
window.
To save your legend, range (data breaks) and color settings so you can apply them later to other
maps, click Save… Later, you can click Load to open the Legend dialog box and load these same
settings to apply them to a new map (Fig. 5.16). Select the desired legend file as well as the desired
elements (Breaks, Caption, Color and Range) which you wish to apply to the new map.
Fig. 5.16 Legend dialog box
91
Hatch theme type
The Hatch theme type uses different hatch patterns to represent data ranges.
Click
and then click OK to edit the Hatch theme type in the Map window (Fig. 5.17).
Fig. 5.17 Editing Hatch theme type
To change any of the hatch patterns, click its cell in the Polygon column and select the desired
pattern from the list. You can also change the color of any of the hatch patterns by clicking its cell in
the Color column and selecting the desired color from the color palette.
The other editing options for the Hatch theme type are identical to those for the Color theme type.
For more information on these options, see Color theme type earlier in this chapter.
92
Dot Density theme type
The Dot Density theme type uses dots or other symbols to represent the number of occurrences of a
particular indicator. It is useful for presenting data expressed through absolute numbers (such as
population size) rather than percentages.
Click
and then click OK to edit the Dot Density theme type in the Map window
(Fig. 5.18).
Fig. 5.18 Editing Dot Density theme type
Here you can edit the legend title, symbol color, symbol style, symbol font size and symbol opacity for
the map. To use a custom character, select
(the last option) from the Style box, which allows
you to select a custom font as well as a custom character.
To edit the default data value represented by one dot or other symbol, enter the desired value in the
Value box.
93
Chart theme type
The Chart theme type uses column, pie or line charts to represent data values. It is useful for
comparing different subgroup values and can be effectively overlaid on top of a Color theme to
display data for multiple indicators.
Click
and then select the desired chart type - column, pie or line - from the Chart Type box. Then
click OK to edit the Chart theme type in the Map window (Fig. 5.19).
Fig. 5.19 Editing Chart theme type (column chart)
Note that by default, each subgroup associated with the selected indicator has been assigned a
different color and is selected for display.
In the Map window, the following edits are available for all chart types (column, pie and line):
Legend Title
Enter the desired text in the Legend Title box.
View Data Value
Select or clear the View Data Value check box to display or hide
data values.
94
Decimals
Modify the level of decimal places displayed in the Decimals box.
Subgroup
Select or clear the check boxes next to the various subgroups to
display or hide subgroup data. Click any of the colors in the Color
column to change the default colors.
Opacity
Enter the desired number in the Opacity box to adjust the opacity of
the chart relative to the background map.
Leader Line
Select or clear the Leader Line box to display or hide leader lines,
which are displayed when using the
Nudge tool to nudge or reposition charts. You can also modify the leader line color, style and
thickness.
Area Name
Select or clear the areas for which you want chart data displayed.
Time Period
By default, only chart data for the most recent time period is
displayed. To display data for other time periods, select Time Series
and then select or clear the time periods for which you want data
displayed.
For column charts, the following additional edit options are available in the Map window (Fig. 5.20):
Fig. 5.20 Additional edit options for column charts
Chart Size
Use the Chart Size sliders to adjust column width and height
Column Gap
Enter the desired number in the Column Gap box to adjust the
column gap
95
For pie charts, the following additional edit options are available in the Map window (Fig. 5.21):
Fig. 5.21 Additional edit options for pie charts
Chart size
Select the desired chart size from either the Auto Size box or the
Custom Size box
For line charts, the following additional edit options are available in the Map window (Fig. 5.22):
Fig. 5.22 Additional edit options for line charts
Show Axis
Select or clear the Show Axis check box to display or hide the X and
Y axes
Chart Size
Select the desired chart size from either the Auto Size box or the
Custom Size box
Line Thickness
Enter the desired number in the Line Thickness box to adjust line
thickness
96
Symbol theme type
The Symbol theme type uses different symbols to represent data ranges.
Click
and then click OK to edit the Symbol theme type in the Map window (Fig. 5.23).
Fig. 5.23 Editing Symbol theme type
To change any of the symbols, click its cell in the Symbol column to open the Symbol dialog box
(Fig. 5.24). Select the desired symbol from the grid or click the Custom tab to select a custom symbol
from another file location on your computer. Here you can also edit the symbol color, font size, and
opacity.
97
Fig. 5.24 Selecting a symbol from the Symbol dialog box
The other editing options for the Symbol theme type in the Map window are identical to those for the
Color theme type. For more information on these options, see Color theme type earlier in this chapter.
Label theme type
The Label theme type uses different colored labels to represent data ranges.
Click
98
and then click OK to edit the Label theme type in the Map window (Fig. 5.25).
Fig. 5.25 Editing Label theme type
To change any of the labels, click its cell in the Label column to open the Label dialog box (Fig. 5.26).
Here you can select the data elements you wish to display in each map label (for example, Area
Name, Data Value, etc.). On the right side, you can edit the label font name, style, size and color.
Fig. 5.26 Label window
99
The other editing options for the Label theme type are identical to those for the Color theme type.
For more information on these options, see Color theme type earlier in this chapter.
Adding map themes
To show data on a map for more than one indicator-unit-subgroup (I-U-S) combination, you can add
themes. By default, the system generates a color theme map for one of your I-U-S combinations. To
add a map theme for another I-U-S combination, click
on the toolbar in the expanded Theme
panel window. The Theme window will open (Fig. 5.27).
Fig. 5.27 Adding a map theme in the Theme window
Select the indicator, unit and subgroup for which you want a new map theme. Then select the desired
theme type and click OK. You will now be able to edit your new theme type before applying it to the
map.
100
Tip: Adding map themes
Adding map themes is particularly useful in the following scenarios:
· Displaying data from multiple subgroups against the total, for a single indicator. Use a
color theme for the total and overlay it with another theme (such as chart or hatch) for the various
subgroups.
· Displaying data for two or more indicators. Use a color theme for one indicator and overlay it with
another theme for the other indicator(s).
Layer
The
Layer feature allows you edit existing map layers and add additional layers to your map.
Click the arrow to the right of
Layer to expand the panel window (Fig. 5.28).
Fig. 5.28 Expanded Layer panel window
Displayed in the expanded layer panel window are four layer categories:
Administrative Boundaries
Shapefiles depicting boundaries for continents, countries
and sub-national regions. Also called base layers, these are
automatically generated based upon the area selections.
Feature Layer
Shapefiles depicting other geographic features such as
lakes, parks, villages, hospitals, rivers, roads, etc. These are
added individually by the user and overlaid on top of base
layers.
Custom Feature Layer
User-defined symbols, labels, or colors applied over existing
base layers.
101
Buffer
Buffer zones around geographic features.
Click
next to any layer category to expand and view the list of available layers under that category.
Note that each layer is displayed with an icon and a shapefile name (Fig. 5.29).
Fig. 5.29 Layer icons and shapefile names
Layer icons in DevInfo can be classified as follows:
Represents polygon shapefiles. Common examples of polygon shapefiles include
administrative boundaries, lakes and national parks.
Represents point shapefiles. Common examples of point shapefiles include villages,
hospitals, and service centers.
Represents line shapefiles. Common examples of line shapefiles include rivers, rail networks
and road networks.
To hide a layer, clear its check box. To display it again, select its check box.
There are nine tools on the toolbar at the bottom of the expanded layer panel window to help you edit
layers.
Move Up
Move Down
Move to Top
Move to Bottom
Zoom In
102
Moves the highlighted (selected) layer up, down, to the top, or to the
bottom. Layer order affects the map display as the layers are added
in sequence from bottom to top. These options are also available by
right-clicking any layer and selecting Move from the right-click menu.
Zooms in to the highlighted (selected) layer.
Change Base Layer
Allows you to change any base layer (administrative boundary) by
opening the Change Base Layer dialog box (Fig. 5.30).
Fig. 5.30 Change Base Layer dialog box
Changing base layers becomes necessary when the database map
file associated with a particular area becomes outdated due to
changes in administrative boundaries. If an updated map is
available, it can be substituted in place of the outdated file.
To change a base layer, first select it from the list in the Change
Base Layer box. Then select the shapefile you wish to change it to
by transferring it from the Available pane to the Selected pane.
Select from the list of shapefiles available in the database or click
Browse… to browse for shapefiles in another location. Click Apply
to change the base layer and continue changing more base layers.
When you are finished, click OK.
103
Add Layer
Allows you to add feature layers such as roads, rivers, health
centers, villages, etc. by opening the Add Layer diailog box (Fig.
5.31).
Fig. 5.31 Add Layer dialog box
Select the desierd feature layer by transferring it from the Available
pane to the Selected pane. Select from the list of shapefiles
available in the database or click Browse… to browse for shapefiles
in another location. Click Apply to add the feature layer and
continue adding more feature layers. When you are finished, click
OK.
104
Buffer
Allows you to create buffer zones around administrative boundaries
or geographic features by opening the Buffer dialog box (Fig. 5.32).
Fig. 5.32 Buffer dialog box
Buffers are concentric polygons drawn around feature layers (both
line layers and point layers) intended to show the area of impact or
influence. For example, you can use buffers to show the area within
5 km of a national highway or a river (line layers) or the area within a
10 km radius of a major city or an earthquake epicenter (point
layers). Note that buffers are not generally applied to administrative
(base) layers.
To apply a buffer, first enter the buffer name and the desired buffer
radius. For a line layer, the buffer radius refers to the buffer
thickness on either side of the line. For a point layer, the buffer
radius refers to the radius of the circle whose center is at the point.
From the list in the Customize box, select either Point Layer or
Line Layer, depending on the type of layer you wish to apply the
buffer to. From the list in the Target box, select the targeted layer to
which you wish to apply the buffer. Then click OK to apply the buffer.
105
Custom Feature Layer
Allows you to create user-defined symbols, labels, or colors to be
applied over existing base layers by opening the Custom Feature
Layer dialog box (Fig. 5.33).
Fig. 5.33 Custom Feature Layer dialog box
Enter the name of the custom feature layer you wish to create. The
default criteria field is area, and the default source of data elements
is the data view.
Note that in the custom feature layer grid, you have the option of
overlaying a symbol, a label and/or a color on top of each area (base
layer). To overlay a symbol on top of an area, click the cell in the
Symbol column next to the desired area to open the Symbol dialog
box (Fig. 5.34).
106
Fig. 5.34 Symbol dialog box
Select the desired symbol to overlay on top of the area (base layer).
To view other available symbols, you can either select another font
type besides the default Webdings font or click the Custom tab to
browse other locations. You can also edit the symbol color, size and
opacity. Click Add to custom to add the symbol to the custom
symbol bar, from where you can easily re-select it under the
Custom tab.
To overlay a label or color on top of an area, click the cell in the
respective column to open a window allowing you to make edits to
your custom feature. To delete any custom feature, highlight the cell
and press DELETE.
When you are finished editing the custom feature layer, click Save to
apply and save the layer.
107
Layer editing options available on the right-click menu
Additional layer editing options are available by highlighting any layer and right-clicking to open the
right-click edit menu (Fig. 5.35).
Fig. 5.35 Right-click menu displaying
additional layer editing options
The following editing options are available on the right-click edit menu:
Move
Moves the highlighted (selected) layer up, down, to the top, or to
the bottom. Layer order affects the map display as the layers are
added in sequence from bottom to top.
Edit Label
Allows you to edit the map label for the highlighted layer
Edit
Allows you to edit the highlighted custom feature layer by opening
the Custom Feature Layer dialog box
Zoom In
Zooms in to the highlighted layer
Layer Settings
Opens the Layer Settings dialog box to allow you to edit the fill
color, fill style and fill opacity for polygon and point layers and the
border color, border style and border thickness for line layers (Fig.
5.36).
108
Fig. 5.36 Layer Settings dialog box
Delete
Deletes the highlighted layer
Inset
The
Inset feature allows you to create smaller map insets highlighting specific areas of the main
map, to be displayed on the same page. Click the arrow to the right of
window (Fig. 5.37).
Inset to expand the panel
Fig. 5.37 Expanded Inset panel window
The panel window lists all the added insets under the main map. Note the three tools located on the
bottom of the window:
Add
Creates a new inset of the current map image in the Map window
and opens the Inset dialog box to allow you to enter the inset name
Edit
Opens the Inset dialog box to allow you to edit the selected inset
name
Delete
Deletes the selected inset
109
To add an inset, first use the various zoom tools on the map tool bar such as
Zoom in Frame
and
Zoom In to select the area for which you want to create an inset. Then click
Add to
create a new inset of the current map image in the Map window. The Inset dialog box opens, allowing
you to enter the inset name (Fig. 5.38).
Fig. 5.38 Inset dialog box
To return to the main map view or to add additional insets, click Map in the expanded Inset panel
window. To edit the inset name, select the desired inset and click
Edit.
To view the inset(s) along with the main map, click
Wizard at the top of the left panel and then
click Next. You will be able to view your inset(s) in Step 4 - Preview. To hide an inset, clear the
check box next to its name in the expanded Inset panel window.
Tip: Adding insets
Insets are useful for bringing specific smaller areas into focus. They can also be used to
display time series data by showing map data from previous years.
Format
The
Format feature allows you to customize the fonts, font sizes and colors for the map title,
subtitle, disclaimer and legend, as well as to automatically apply other previously-saved formats to
your map. Click the arrow to the right of
Format to expand the panel window (Fig. 5.39).
Fig. 5.39 Expanded Format panel window
110
Note that there are four format tool buttons in the expanded panel window. These four format tools New,
Edit,
Save and
Import - are nearly identical to those used for editing tables.
See Format in Chapter 4, “Tables” for more details.
Page Setup
The
Page Setup feature allows you to customize the page setup for printing your map. Click the
arrow to the right of
Page Setup to expand the panel window (Fig. 5.40).
Fig. 5.40 Expanded Page Setup panel window
Here you can change the page size, change the page orientation, and preview your table before
printing.
Save l Print
The
Save l Print feature allows you to save your map in a variety of file formats and print it. Click
the arrow to the right of
Save l Print to expand the panel menu (Fig. 5.41).
Fig. 5.41 Expanded Save l Print panel menu
Here you can save your map in the Gallery, save it to the Sidebar (see Chapter 10, “Bottom Panel
Features“), or print it.
111
Map Wizard
The Map Wizard located at the top of the left panel guides you through a series of five steps to help
you format your map. All of the Map Wizard steps are also available as stand-alone editing features
on the left panel.
Click
Wizard to start the Map Wizard. The Map Wizard window opens and automatically takes
you to Step 3 – Settings, which appears at the bottom of the map in the wizard step box (Fig. 5.42).
Fig. 5.42 Starting the Map Wizard
At any point in the Map Wizard, you can go to a different step by clicking Back or Next or by clicking
the wizard step box and selecting any step from the list. You may skip any step if you wish, and you
may exit the Map Wizard at any point without saving your map by clicking Cancel.
Step 1 - Theme
In Step 1 - Theme, you can apply one or more customizable themes to your map – including color
gradients, patterns and charts - to display data for one or more indicators. This is identical to the
Theme feature on the left panel. For more details, see Theme earlier in this chapter.
112
Step 2 - Title
In Step 2 - Title, you can customize fonts, font sizes, colors and many other items in your map. This
is nearly identical to the
this chapter.
Format feature on the left panel. For more details, see Format earlier in
Step 3 - Settings
In Step 3 - Settings, you can preview the edits made to your map in Steps 1 and 2, as well as use
the editing tools on the map toolbar and on the left panel to make further edits.
Step 4 - Preview
In Step 4 - Preview, you can preview the map in MS Excel format.
Step 5 - Gallery
In Step 5 - Gallery, you can save your map in the DevInfo Gallery (Fig. 5.43).
Fig. 5.43 Map Wizard Step 5 – Gallery
Enter the name of your map in the Presentation Name box. By default, the map is saved in the
C:\DevInfo\DevInfo 6.0 \DevInfo 6.0\Gallery\Presentations folder. Click
Browse to save the map
in a different location. Click Finish to save your map and exit the Map Wizard.
113
CHAPTER 6
Graphs
DevInfo 6.0 automatically generates a graph (along with a table and a map) based on the data view
to help you prepare professional presentations and reports. Graphs in DevInfo can be easily edited
and re-formatted as per your requirements and then printed or saved.
This chapter deals with how to edit graphs. In DevInfo 6.0, the same procedure is used for editing
graphs, whether in regular or Data Wizard mode.
Note: Finalize the data view before editing a graph
Before editing your graph, ensure that the data view contains the data records you wish
to display. If necessary, refine your indicator, area and time period selections, because
you cannot change the data records while editing your graph. Alternatively, use the
various filter options to refine the data view.
Graph editing overview
Move the mouse pointer over the graph preview panel at lower right in regular mode to cause the
graph preview toolbar to appear at the left of the panel (Fig 6.1). The same toolbar is located at the
left of the graph in Data Wizard mode.
114
Fig. 6.1 Move the mouse pointer over the graph presentation preview
panel to cause its respective toolbar to appear at left
From the toolbar on the graph preview panel, you can modify the graph display by clicking
Column,
Bar,
Pie or
Line. If you are satisfied with your graph, you can click
As… to save your graph in various file formats.
To enlarge your graph for more convenient viewing and editing, click
the Graph window (Fig. 6.2).
Save
Click to enlarge to open
Fig. 6.2 Graph window
115
The Graph window displays your graph with the default format settings. To edit your graph, you can
use any of the following:
•
•
•
•
Editing tools on the Graph toolbar
Editing features on the left panel
Right-click menu editing features (if MS-Excel is installed on your computer)
Graph Wizard
Each of these will now be explained in detail.
Editing tools on the Graph toolbar
The Graph toolbar located at the top of the Graph window contains the following five editing tools:
Footnotes
Displays footnotes for data values whenever recorded in the
database
Column
Displays data in a column graph
Bar
Displays data in a bar graph
Line
Displays data in a line graph
Pie
Displays data in a pie graph
Editing features on the left panel
The left panel in the Graph window contains five features which allow you to edit your graph: X-Axis
& Y-Axis, Sort, Format, Page Setup and Save | Print (Fig. 6.3). The Graph Wizard feature will be
discussed separately later in this chapter.
116
Fig. 6.3 Editing features on the left panel
X-Axis & Y-Axis
The
X-Axis & Y-Axis feature allows you to specify the X-Axis and Y-Axis elements that you wish
to include in the graph. Click the arrow to the right of
Axis window (Fig. 6.4).
X-Axis & Y-Axis to open the X-Axis & Y-
Fig. 6.4 X-Axis & Y-Axis window
Note that the window is divided into four panes. The Available pane displays the list of elements
available for selection for the graph axes. The X-Axis and Y-Axis panes display the default
selections for the graph axes. To specify additional X-axis and Y-axis elements or to modify the
117
default selections, transfer the desired elements from one pane to the other either by using the
selection arrows in the pane headers or dragging them.
When you are satisfied with your row and column settings, click OK.
Sort
The
Sort feature allows you to sort the graph by data value. Click the arrow to the right of
Sort to expand the panel window (Fig. 6.5).
Fig. 6.5 Expanded Sort panel window
Click the
arrow to the left of Data Value to indicate whether you want the records sorted in
ascending or
descending order. If you do not wish to sort the records by data value, clear the Data
Value check box. Your sort selections will be automatically reflected in the Graph window.
Format
The
Format feature allows you to customize the graph title, grid, X-axis, Y-axis, legend and chart,
as well as to automatically apply other previously-saved formats to your graph. Click the arrow to the
right of
Format to expand the panel window (Fig. 6.6).
Fig. 6.6 Expanded Format panel window
Note that there are four format options in the expanded panel window:
New
118
Allows you to create a new graph format by opening the File Name
dialog box, in which you can enter a file name for your new graph
format. Upon clicking OK, you will be taken to the Format window.
Edit
Opens the Format window, where you can customize the graph title,
grid, X-axis, Y-axis, legend and chart.
Save As
Allows you to save your graph format as an .xml file for future use.
Import
Allows you to import a format from a previously-created Gallery
object and apply the same format to your graph.
In the Format window, you can customize the graph title, grid, X-axis, Y-axis, legend and chart
(Fig. 6.7).
Fig. 6.7 Format window
To apply a previously created and saved format to your graph, click the format file name box located
just below the Format tab and select a format from the list.
The Item pane at the left of the Format window contains all the graph items that can be customized:
Title, Grid, X-Axis, Y-Axis, etc. To customize any graph item, highlight the item in the Item pane,
which causes the customizable features to appear at right.
119
To apply any format change(s) and view the graph without closing the Format window, click Apply.
You can now view the graph with any applied format changes in the Graph window behind the Format
window.
To save your graph format as an .xml file for future use, click Save.
When you are satisfied with your graph format, click OK.
Page Setup
The
Page Setup feature allows you to customize the page setup for printing your graph. Click the
arrow to the right of
Page Setup to expand the panel window (Fig. 6.8).
Fig. 6.8 Expanded Page Setup panel window
Here you can change the page size, change the page orientation, and preview your graph before
printing.
Save l Print
The
Save l Print feature allows you to save your graph in a variety of file formats and print it.
Click the arrow to the right of
Save l Print to expand the panel menu (Fig. 6.9).
Fig. 6.9 Expanded Save l Print panel menu
120
Here you can save your graph in the Gallery, save it to the Sidebar (see Chapter 10, “Bottom Panel
Features “), or print it.
Right-click menu editing features
If MS-Excel is installed on your computer, you can use the graph editing features available from the
various right-click menus. Right-click the following graph items in the Graph window to open their
respective MS-Excel edit menus:
•
•
•
•
•
•
Chart Area
X-Axis
Y-Axis
Columns, bars, lines or pie slices
Gridlines
Legend
Edit the graph items using the options available from the respective right-click menus.
Graph Wizard
The Graph Wizard located at the top of the left panel guides you through a series of three steps to
help you format your graph. All of the Graph Wizard steps are also available as stand-alone editing
features on the left panel.
121
Click
Wizard to start the Graph Wizard. The Graph Wizard window opens and automatically
takes you to Step 2 - Preview, which appears at the bottom of the graph in the wizard step box (Fig.
6.10).
Fig. 6.10 Starting the Graph Wizard
At any point in the Graph Wizard, you can go to a different step by clicking Back or Next at the
bottom of the window or by clicking the wizard step box and selecting any step from the list. You may
skip any step if you wish, and you may exit the Graph Wizard at any point without saving your graph
by clicking Cancel.
Step 1 - X-Axis & Y-Axis
In Step 1 - X-Axis & Y- Axis, you can specify the X-axis and Y-axis elements that you wish to include
in the graph. This is identical to the
X-Axis & Y-Axis feature on the left panel. For more details,
see X-Axis & Y-Axis earlier in this chapter.
Step 2 - Preview
In Step 2 - Preview, you can preview the edits made to your graph in Step 1, as well as use the
editing tools on the graph toolbar and on the left panel to make further edits.
122
Step 3 - Gallery
In Step 3 - Gallery, you can save your graph in the DevInfo Gallery (Fig. 6.11).
Fig. 6.11 Graph Wizard Step 3 - Gallery
Enter the name of your graph in the Presentation Name box. By default, the graph is saved in the
C:\DevInfo\DevInfo 6.0 \DevInfo 6.0\Gallery\Presentations folder. Click
graph in a different location.
Browse to save the
Click Finish to save your graph and exit the Graph Wizard.
123
CHAPTER 7
Gallery
DevInfo 6.0 uses the Gallery to manage the various presentation objects - tables, maps and graphs created in DevInfo. The following tasks can be performed in the Gallery:
•
•
•
•
•
•
Browsing and viewing Gallery objects
Managing Gallery objects
Editing Gallery objects
Replicating Gallery objects for different indicators, areas and time periods
Copying Gallery objects directly into MS PowerPoint
Publishing Gallery objects to the web
Click
Gallery from either the DevInfo home page or the Data Wizard to open the di Gallery
window. The Gallery displays previously-saved tables, maps and graphs as thumbnails (reduced-size
images) (Fig. 7.1).
124
Fig. 7.1 di Gallery window
Browsing and viewing Gallery objects
The first three tools on the Gallery toolbar allow you to change the display format of Gallery objects
as follows:
Tile View
Allows you to view Gallery objects as thumbnails (default view) (Fig.
7.2)
125
Fig. 7.2 Gallery objects in tile view
Detail View
Allows you to view file details of Gallery objects (Fig. 7.3)
Fig. 7.3 Gallery objects in detail view
126
Classic View
Allows you to view Gallery objects in DevInfo 5.0 format (Fig. 7.4)
Fig. 7.4 Gallery objects in classic view
In classic view, Gallery objects are automatically enlarged in the right pane for better viewing. For
better viewing in tile view, double-click the object. In detail view, click Open next to the object.
To browse for objects in other galleries, click the Gallery box above the toolbar and select the desired
gallery from the list.
To search for Gallery objects by keyword, enter the desired text in the search box above the toolbar.
Managing Gallery objects
To save a Gallery object to a new location or under a new file name, select the desired object in
classic view and click
Save As.
To delete a Gallery object, select the desired object and click
To import a Gallery object from another location, click
Delete.
Import.
127
Note: Importing Gallery objects from DevInfo 5.0
Gallery objects from DevInfo 5.0 can be imported into the DevInfo 6.0 Gallery. However,
that they cannot be subsequently edited or replicated like Gallery objects created in
DevInfo 6.0.
To save a Gallery object to the sidebar, select the desired object and click
Save to Sidebar.
Tip: Creating and using other galleries to better manage presentation objects
By default, DevInfo saves all presentation objects in the default Gallery folder at
C:\DevInfo\DevInfo 6.0 \DevInfo 6.0\Gallery\Presentations. Over time as this Gallery
folder fills up, you may wish to better organize your Gallery objects by creating separate
gallery folders for them by project, sector, etc.
The easiest way to do this is to use the
Save As option whenever you save a presentation
object and specify the desired folder location. The application will remember this file location as a
separate gallery and will automatically include it in the list in the Gallery box.
To re-organize and re-file an existing Gallery object, select it classic view and click
save it in a new gallery folder.
Save As to
Editing Gallery objects
DevInfo allows you to edit (modify the format settings of) any Gallery object. To edit any Gallery
object, do any of the following:
•
•
In tile view, double-click the desired object to enlarge it and then click
toolbar in the enlarged viewing window.
In detail view, click Edit next to the desired object.
•
In classic view, select the desired object and click
Edit on the
Edit on the toolbar.
If the database from which the object was generated is different from the current database open, the
application will prompt you to select the correct database. After clicking OK, the application will open
a window allowing you to edit and re-save the object (Fig. 7.5).
128
Fig. 7.5 Editing a Gallery object
Replicating Gallery objects for different indicators, areas and time
periods
From the Gallery, you can replicate Gallery objects for different indicators, areas and time periods.
For example, suppose you have created a graph displaying the female literacy rate of 15-24 year-olds
for selected Latin American and Caribbean countries (Fig. 7.6).
129
Fig. 7.6 Original graph displaying female literacy rate of 15-24
year-olds for selected Latin American and Caribbean countries
To replicate the same graph for a different indicator (for example, “Proportion of infants with low
birth-weight”), select the object and click
Refresh on the Gallery toolbar. A dialog box will open
displaying the name of the object in the title bar and the data elements which can be refreshed
(updated or modified) (Fig. 7.7).
Fig. 7.7 Refreshing the Gallery object
Select the desired time period from the Time Period boxes or select the Most Recent check box.
Then select the desired indicator (for example, “Proportion of infants with low birth-weight”) from the
list in the Indicator box. Click Save to save the replicated graph with refreshed data under the
original file name. Click Save As to save the replicated graph under a new file name. Open the new
graph in the Gallery to view it (Fig. 7.8).
130
Fig. 7.8 Replicated graph displaying proportion of infants with low
birth-weight for the same selected Latin American and Caribbean countries
To replicate the same graph for multiple indicators, click Advanced from the Refresh window to open
a new window displaying all the available indicators in tree view (Fig. 7.9).
Fig. 7.9 Selecting multiple indicators for replication
131
Select the desired indicators by transferring them from the Available pane to the Selected pane.
When you are finished, click Replicate. The application will replicate the graph for each of the
selected indicators and save them all to the Gallery.
Note: Replicating Gallery objects for different indicators and areas
Gallery objects can be replicated for different indicators only when the original object
displays data for a single indicator. In other words, if the original object displays data for
multiple indicators, then it cannot be replicated for different indicators.
Similarly, Gallery objects can be replicated for different areas only when the original object displays
data for a single area. In other words, if the original object displays data for multiple areas, then it
cannot be replicated for different areas.
Gallery objects displaying data for a single indicator and a single area can be replicated for both
different indicators and areas.
Copying Gallery objects directly into MS PowerPoint
From the Gallery, you can copy Gallery objects directly into MS PowerPoint to quickly create a
presentation.
From any view (tree view, detail view or classic view), first select the Gallery objects which you wish
to copy into your presentation. Then click
to Slideshow dialog box (Fig. 7.10).
Copy to Slideshow on the toolbar to open the Copy
Fig. 7.10 Copy to Slideshow dialog box
Click New to copy the selected objects into a new PowerPoint presentation. Click Open to copy them
into an existing presentation.
After specifying the presentation file name, the application automatically copies the selected objects
in sequence into the PowerPoint presentation and saves the presentation either in the default location
(C:\DevInfo\DevInfo 6.0 \DevInfo 6.0\Gallery\Presentations) or in the specified location.
132
To view the presentation, open the PowerPoint file from the saved location. You can then re-size and
re-sequence the objects according to your requirements.
Publishing Gallery objects to the web
From the Gallery, you can publish selected Gallery objects to a searchable web application (Fig. 7.11).
Fig. 7.11 Publishing Gallery objects to a searchable web application
133
First select the Gallery objects which you wish to publish. Then click
open the Browse For Folder window (Fig. 7.12).
Publish from the toolbar to
Fig. 7.12 Browse For Folder window
Select an existing folder and click OK, or select the desired location and click Make New Folder to
specify a new folder name. The application then publishes the selected Gallery objects to the
specified folder. Configure this folder on a web server to publish your gallery as a searchable web
application.
134
CHAPTER 8
Reports
The Reports feature in DevInfo 6.0 allows you to replicate standard table reports for different areas
and time periods. This feature is particularly useful when standard table reports need to be replicated
regularly for different areas and/or time periods. Instead of re-selecting the same set of indicators and
re-formatting the table repeatedly, you can create a report layout to greatly simplify the process.
The Reports feature also offers an Advanced Reports option, through which users can easily paste
saved tables, maps and graphs into an MS-Word document.
Generating standard reports in DevInfo 6.0 is a four-step process.
Step 1 - Creating a report layout
The first step in generating reports is to create a report layout. This is done by generating a sample
table which you wish to later replicate for different areas and/or time periods. For example, suppose
you wish to replicate a standard table report displaying basic demographic and health data for various
Latin American and Caribbean countries.
In the DevInfo 6.0 application, select the desired database, the desired demographic and health
indicators, and a sample country (for example, Brazil). Auto-select the time periods. For more
information on how to select indicators, areas and time periods, see Chapter 2, “Searching for Data.”
After generating the data view and filtering the data to show only the most recent data, enlarge the
table presentation preview panel to better view and edit the table. Format the table according to your
desired specifications.
135
In this example, the default row and column settings have been modified to display the area name in
the right column and the standard report title, “Demographic and Health Report,” has been added (Fig.
8.1). For more information on how to edit tables, see Chapter 4, “Tables.”
Fig. 8.1 Generating a sample table
Step 2 - Saving the report layout
The next step is to save the formatted table as a report layout. From the expanded
menu on the left panel, click Save as Report Layout (Fig. 8.2).
Save l Print
Fig. 8.2 Expanded Save l Print menu
This opens the Save as Report Layout window, which contains three tabs representing the three
steps needed to save your table as a report layout: Area, Time Period and Source.
136
Selecting area levels
First select the area level(s) which you wish to display in your reports and clear the selections which
you do not wish to display (Fig. 8.3).
Fig. 8.3 Selecting areas for the report layout
To select an area level, highlight the desired selection in the Select Data by box. To clear an area
level, select the desired check box in the Include Data by column. Note that an area level cannot be
cleared if it is being displayed in the Select Data by box.
For example, to display only country level data in your reports, select “Level 2” from the Select Data
by box and then clear the “Level 1” check box (if area level 1 refers to continents and area level 2 to
countries in your database).
Click Format to edit the format (font name, size, appearance, etc.) of the area level(s) selected.
Click Next to proceed to the Time Period tab.
137
Selecting time periods
Select the time period which you wish to display in your reports. By default, the Most Recent check
box is selected to display only the most recent data for all reports generated (Fig. 8.4).
Fig. 8.4 Selecting time periods for the report layout
Select the From check box as well as the time periods listed in the From and To boxes to only
display data within a specified time range.
If you wish to exclude certain time periods from being displayed, select the desired time periods in the
Exclude pane.
Selecting sources
Next, select the category of sources which you wish to use in your reports. By default, the
Recommended Sources check box is selected to display data only from recommended sources.
Saving the report layout
The final step involves saving the report layout. Enter the desired text for the category, file name and
description of the report layout (Fig. 8.5).
138
Fig. 8.5 Saving the report layout
Click Finish to save the report layout.
Note: Difference between saving table formats and saving report layouts
When you save your table format in DevInfo 6.0, the application saves only those table
settings available in the Format feature on the left panel in the Table window, such as
the table fonts, font colors, font styles, etc.
When you save your table as a report layout, the application saves the table settings available in all
the features on the left panel, including Theme, Rows and Columns, Sort, Format and Page
Setup. Additionally, the application saves your indicator, area and time period selections.
139
Step 3 - Selecting the desired report layout
After saving your table as a report layout, you can now begin to generate reports displaying the same
table, but for different areas and time periods. Click
Reports window (Fig. 8.6).
Reports on the top panel to open the di
Fig. 8.6 di Reports window
The di Reports window displays all previously saved report layouts, grouped under the category
specified at the time of saving. Note that the following tools are available on the main toolbar:
Edit
Allows you to edit the selected report layout
Save As
Allows you to re-save the selected report layout under a new
category, file name or description
Delete
Allows you to delete the selected report layout
Select the desired report layout either by double-clicking it or by clicking OK.
140
Step 4 - Selecting new areas and time periods to generate reports
Selecting the desired report layout opens the Reports window (Fig. 8.7).
Fig. 8.7 Reports window - Area tab
The Reports window contains two tabs - Area and Time Period - which allow you to select the areas
and time periods for which you wish to generate reports. By default, the Area tab opens first.
First select the desired area(s) from the list. Note that areas will be displayed only for the area level(s)
specified at the time of saving the report layout. Also note that by default, the application pre-selects
the area(s) used to create the report layout (in this example, Brazil). If you wish to generate a report
for a different area (for example, Guatemala), be sure to clear the default area selection.
141
When you are done with your area selections, click Next to proceed to the Time Period tab (Fig. 8.8).
Fig. 8.8 Reports window - Time Period tab
By default, the application pre-selects the time period specified at the time of saving the report layout
(in this example, Most Recent). If you wish to change the default selection, select the desired time
period(s) for which you wish to view data.
When you are done with your time period selections, click Finish to generate the report. The
application will open the Table window and generate a new table based on the saved report layout for
your new area and time period selections (Fig. 8.9).
142
Fig. 8.9 Generating a report
This process can be repeated to quickly replicate standard table reports for different areas and time
periods.
Creating advanced reports
The Reports feature in DevInfo 6.0 also offers an Advanced Reports option, through which users
can easily paste tables, maps and graphs saved in the Gallery into an MS-Word document.
143
Click the Advanced Reports tab in the di Reports window to begin (Fig. 8.10).
Fig. 8.10 Creating advanced reports
To create a new advanced report, click
New from the toolbar. The Advanced Reports Wizard
opens, which guides you through a series of three steps.
Step 1 - Select Presentation
In Step 1, select the presentation objects - tables, maps and graphs - which you wish to paste into
your MS-Word document (Fig. 8.11).
144
Fig. 8.11 Advanced Reports Wizard - Selecting tables, maps and graphs
The left panel displays all the presentation objects saved in the Gallery. Highlight any object in the left
panel to preview it in the main window.
When you are finished selecting presentation objects, click Next to proceed to Step 2.
Step 2 - Create Report
In Step 2, the application opens a new MS-Word document with a bottom panel displaying thumbnails
of all the selected objects. Double-click any table, map or graph in the bottom panel to paste it into
the MS-Word document and then re-size and/or re-position the object as needed. Enter text as
desired above or below the pasted objects to create the report (Fig. 8.12).
145
Fig. 8.12 Advanced Reports Wizard – Creating a report
Step 3 – Finish
In Step 3, enter the title for your report and click Finish to save it.
Viewing and editing advanced reports
To view an advanced report, highlight the desired report and click
open the Save As window (Fig. 8.13).
146
Save As on the toolbar to
Fig. 8.13 Save As window
Choose a file location other than the default C:\DevInfo\DevInfo 6.0 \DevInfo 6.0\Reports location in
which to re-save the report. Then open the report from the new location to view it.
To edit an advanced report, highlight the desired report and click
Edit on the main toolbar. The
Advanced Reports Wizard opens, allowing you select additional presentation objects to include in the
report.
To delete an advanced report, highlight the desired report and click
Delete.
147
To update an advanced report with more recent data, highlight the desired report and click
Refresh. If the database from which the presentation objects were generated is different from the
current database open, the application will prompt you to select the correct database. A dialog box
opens displaying the name of the advanced report in the title bar and the data elements in the report
that can be refreshed (Fig. 8.14).
Fig. 8.14 Refreshing the report
To update the report to reflect the most recent data, select the Most Recent check box. Alternatively,
select the time period for which you wish to generate new data to be included in the report. Click
Save to save the report with refreshed data under the original file name. Click Save As to save the
report with refreshed data under a new file name.
148
CHAPTER 9
Calculate
The Calculate tool allows you to perform various calculations on the data queried from the database.
Click
Calculate on the main toolbar in the data view window to open the Calculate window
(Fig. 9.1).
Fig. 9.1 Calculate window
From the Calculate window, you can select the following six functions:
Percent
Converts absolute numbers into percentages
100 Minus
Calculates complementary (inverse) indicator values
Composite Index
Creates and calculates a weighted composite index
Subtotal
Subtotals data values for a given indicator
Transform Unit
Transforms one unit into another by a multiplier
149
User-Defined Formula
Performs a calculation using your own custom formula
Note: Viewing newly calculated data
All the functions under the Calculate tool generate new databases containing the
calculated values. To view this data in the form of tables, maps and graphs, you need to
first open the newly created database in DevInfo and then select the indicator assigned
to the newly calculated value.
Each of these Calculate functions will be explained in detail.
Percent
The Percent function converts absolute numbers into percentages. It is based on the formula:
100 x numerator / denominator = percentage value
For example, suppose you have already generated a data view displaying data for selected countries
in Europe for the following two indicators:
•
•
Net ODA (Official Development Assistance)
Net ODA to LDCs (Least Developed Countries)
You can then use the Percent function to calculate the Net ODA to LDCs as a percentage of Net
ODA for the same areas.
Click
Calculate on the toolbar in the data view window and then double-click Percent. This
launches the Percent Wizard, which consists of five steps.
150
Step 1 - Numerator
In Step 1, select the numerator to be used for calculating the percentage and transfer it to the
Selected pane by either double-clicking it or by using the selection arrows in the pane header. In this
example, the numerator selected is “Net ODA to LDCs” (Fig. 9.2).
Fig. 9.2 Selecting the numerator
Click Next to proceed to Step 2.
Step 2 - Denominator
In Step 2, select the denominator to be used for calculating the percentage and transfer it to the
Selected pane. In this example, the denominator selected is “Net ODA” (Fig. 9.3).
151
Fig. 9.3 Selecting the denominator
Step 3 - Classification, I-U-S and decimals
In Step 3, specify the new indicator classification, indicator name, unit name, subgroup name and
number of decimal places desired for the percentage calculation (Fig. 9.4).
152
Fig. 9.4 Specifying classification, I-U-S and decimal places
Note that this new percentage calculation needs to be assigned a new indicator-unit-subgroup
combination. For the indicator name, unit and subgroup, either select from the available options in the
list or type in the desired text. In this example, the new indicator name could be “Net ODA to LDCs as
a percentage of Net ODA” while the unit and subgroup remain as the default entries.
Step 4 - Preview calculations
In Step 4, preview the calculations in an MS-Excel sheet, which displays the percentage calculation
for all the areas in the data view.
Step 5 - Preview Data Entry Spreadsheet
In Step 5, preview the DevInfo Data Entry Spreadsheet for the new percentage indicator. Click Finish
to save the calculated data to a new database and enter the desired database name when prompted.
153
100 Minus
The 100 Minus function calculates complementary (inverse) indicator values. It is based on the
formula:
100 – (data value of indicator) = 100 minus value
For example, suppose you have already generated a data view displaying the most recent data for
the female literacy rate of 15-24 year olds for countries in Asia. You can then use the 100 Minus
function to calculate the illiteracy rate for the same subgroup and areas.
Click
Calculate on the toolbar in the data view window and then double-click 100 Minus. This
launches the 100 Minus Wizard, which consists of four steps.
Step 1 - Indicator
In Step 1, select the indicator to be used for calculating the complementary (inverse) indicator value
percentage and transfer it to the Selected pane by either double-clicking it or by using the selection
arrows in the pane header. In this example, the indicator selected is “Literacy rate of 15-24 year-olds”
(Fig. 9.5).
Fig. 9.5 Selecting the indicator
154
Click Next to proceed to Step 2.
Step 2 - Classification, indicator, unit and decimals
In Step 2, specify the new indicator classification, indicator name, unit name, and number of decimal
places desired for the complementary (inverse) indicator value (Fig. 9.6).
Fig. 9.6 Specifying classification, indicator, unit and decimal places
Note that this new data value needs to be assigned a new indicator-unit-subgroup combination. For
the indicator name and unit, either select from the available options in the list or type in the desired
text. In this example, the new indicator name could be “Illiteracy rate of 15-24 year olds” while the unit
remains as the default entry.
Step 3 - Preview calculations
In Step 3, preview the calculations in an MS-Excel sheet, which displays the complementary (inverse)
indicator value calculation for all the areas in the data view
Step 4 - Preview Data Entry Spreadsheet
In Step 4, preview the DevInfo Data Entry Spreadsheet for the new complementary (inverse) indicator
calculations. Click Finish to save the calculated data to a new database and enter the desired
database name when prompted.
155
Composite Index
The Composite Index function allows you to create and calculate a composite index by combining
the values of several indicators into one value using a weighted scale.
For example, suppose you have already generated a data view displaying the most recent data for
the following three “safe motherhood” indicators for selected African countries:
•
•
•
Antenatal care coverage for at least one visit (female 15-49 yr)
Births attended by skilled health personnel (total)
Contraceptive prevalence rate (female 15-49 yr)
You can then use the Composite Index function to create and calculate a weighted “safe
motherhood” composite index based on your selections.
Click
Calculate on the toolbar in the data view window and then double-click Composite Index.
This launches the Composite Index Wizard, which consists of five steps.
Step 1 - Indicators
In Step 1, select the indicators to be used for calculating the composite index and transfer them to the
Selected pane by either double-clicking it or by using the selection arrows in the pane header. In this
example, all three indicators cited above are selected (Fig. 9.7).
156
Fig. 9.7 Selecting the indicators
Click Next to proceed to Step 2.
Step 2 - Percentage weights
In Step 2, assign the percentage weight to each indicator to be used when calculating the composite
index. Note that by default, the same percentage weight is assigned to each indicator (Fig. 9.8).
157
Fig. 9.8 Assigning percentage weights to each indicator
Modify the percentage weight according to your requirements. Note that the sum of all the weights
must equal 100.
Select the High is Good check box for all indicators for which a higher value is better than a lower
value (for example, “Births attended by skilled health personnel”). Clear the check box for all
indicators for which the reverse is true (for example, “Infant mortality rate”).
Step 3 - Classification, I-U-S, decimals and scale
In Step 3, specify the new indicator classification, indicator name, unit name, subgroup name and
number of decimal places desired for the composite index value (Fig. 9.9).
158
Fig. 9.9 Specifying classification, I-U-S, decimal places and scale
Note that this new data value needs to be assigned a new indicator-unit-subgroup combination. For
the indicator name, unit and subgroup, either select from the available options in the list or type in the
desired text. In this example, the new indicator name could be “Safe Motherhood Index” while the unit
and subgroup remain as the default entries.
Specify the desired range for the index scale in Scale Min and Scale Max. For example, you may
wish to apply a scale of 0 to 1 or 0 to 100 to your composite index.
Step 4 - Preview calculations
In Step 4, preview the calculations in an MS-Excel sheet, which displays the composite index
calculation for all the areas in the data view.
Step 5 - Preview Data Entry Spreadsheet
In Step 5, preview the DevInfo Data Entry Spreadsheet for the new composite index indicator
calculations. Click Finish to save the calculated data to a new database and enter the desired
database name when prompted.
159
Subtotal
The Subtotal function allows you to subtotal data values for a given indicator at a lower area level, to
create a subtotal value for a higher area level.
For example, suppose you have already generated a data view displaying the data for number of
AIDS deaths in various Latin American and Caribbean countries for the year 2007. You can then use
the Subtotal function to calculate the subtotal for number of AIDS deaths in Latin America and the
Caribbean as a whole.
Click
Calculate on the toolbar in the data view window and then double-click Subtotal. This
launches the Subtotal Wizard, which consists of four steps.
Note: Uses and limitations of the Subtotal function
The Subtotal function can be used to generate (1) subtotals at the continent level based
on country data and (2) subtotals at the national level based on sub-national data. In
many cases, this function can be used to subtotal census data.
However, this function should be used only after first verifying that the unit of measurement for the
selected indicator can indeed be subtotalled and also accounting for the survey methodology used.
Step 1 - Indicator
In Step 1, select the indicator to be used for calculating the subtotal and transfer it to the Selected
pane by either double-clicking it or by using the selection arrows in the pane header. In this example,
the selected indicator is “AIDS deaths” (Fig. 9.10).
160
Fig. 9.10 Selecting the indicator
Click Next to proceed to Step 2.
Step 2 - Area level
In Step 2, specify the area level for which you wish to generate the subtotal value. Note that by
default, the area level immediately above the area level in the data view is displayed (Fig. 9.11).
161
Fig. 9.11 Specifying the area level
Step 3 - Preview calculations
In Step 3, preview the calculations in an MS-Excel sheet, which displays the subtotal calculation for
all the areas in the data view.
Step 4 - Preview Data Entry Spreadsheet
In Step 4, preview the DevInfo Data Entry Spreadsheet for the new subtotals. Click Finish to save the
calculated data to a new database and enter the desired database name when prompted.
Transform Unit
The Transform Unit function transforms one unit into another by a multiplier. For example, you can
use this function to transform the unit “number” into “thousand” or “thousand” into “million.”
For example, suppose you have already generated a data view displaying the data for number of
Internet users in European countries for the year 2006. To simplify the data view, you can use the
Transform Unit function to display the same data, but with the unit changed from “number” to
“thousand.”
162
Click
Calculate on the toolbar in the data view window and then double-click Transform Unit.
This launches the Transform Unit Wizard, which consists of five steps.
Step 1 - Indicator
In Step 1, select the indicator whose unit you wish to transform and transfer it to the Selected pane
by either double-clicking or by using the selection arrows in the pane header. In this example, the
selected indicator is “Internet users” (Fig. 9.12).
Fig. 9.12 Selecting the indicator
Click Next to proceed to Step 2.
163
Step 2 - Target unit and conversion factor
In Step 2, specify the name of the target unit and the conversion factor. The conversion factor is the
number by which the source data will be multiplied to generate new values for the target unit. In this
example, the target unit is “Thousand” and the conversion factor is “.001” (Fig. 9.13).
Fig. 9.13 Specifying target unit and conversion factor
Step 3 - Classification, indicator and decimals
In Step 3, specify the new indicator classification, indicator name and number of decimal places
desired for the new value (Fig. 9.14).
164
Fig. 9.14 Specifying classification, indicator and decimal places
Note that this new data value needs to be assigned a new indicator-unit-subgroup combination. For
the indicator name, either select from the available options in the list or type in the desired text. Note
that the unit reflects the target unit specified in Step 2.
Step 4 - Preview calculations
In Step 4, preview the calculations in an MS-Excel sheet, which displays the transformed unit
calculation for all the areas in the data view.
Step 5 - Preview Data Entry Spreadsheet
In Step 4, preview the DevInfo Data Entry Spreadsheet for the new transformed unit indicator. Click
Finish to save the calculated data to a new database and enter the desired database name when
prompted.
165
User Defined Formula
The User Defined Formula function allows you to perform a calculation on the data using your own
custom formula.
For example, suppose you have already generated a data view displaying the data for life expectancy
at birth for African countries for 2006. You can then use the User Defined Formula function to
calculate the life expectancy index for each country, using the following formula:
Life expectancy index = (Life expectancy at birth – 25) / (85 – 25)
Click
Calculate on the toolbar in the data view window and then double-click User Defined
Formula. This launches the User Defined Formula Wizard, which consists of four steps.
Step 1 - Formula
In Step 1, enter the custom formula in the formula bar at the bottom of the window. Use the various
operators
available above the formula text bar to help enter your formula.
To use the data values for a particular I-U-S combination in your formula, click the indicator name to
cause its alphabetical label to appear in the formula.
In this example, the custom formula “(A – 25) / (85 – 25)” has been entered, where “A” is the label
assigned to the data values for the indicator “Life expectancy at birth” (Fig. 9.15).
166
Fig. 9.15 Entering the custom formula
Click Next to proceed to Step 2.
Step 2 – Classification, I-U-S and decimals
In Step 2, specify the new indicator classification, indicator name, unit name, subgroup name and
number of decimal places desired for the percentage calculation (Fig. 9.16).
167
Fig. 9.16 Classification, I-U-S and decimal places
Note that the data values calculated from the custom formula need to be assigned a new indicatorunit-subgroup combination. For the indicator name, unit and subgroup, either select from the
available options in the list or type in the desired text. In this example, the new indicator name could
be “Life expectancy index” while the unit and subgroup remain as the default entries.
Step 3 - Preview calculations
In Step 3, preview the calculations in an MS-Excel sheet, which displays the custom formula
calculation for all the areas in the data view.
Step 4 - Preview Data Entry Spreadsheet
In Step 4, preview the DevInfo Data Entry Spreadsheet for the custom formula indicator calculations.
Click Finish to save the calculated data to a new database and enter the desired database name
when prompted.
168
CHAPTER 10
Bottom Panel Features
The bottom panel of the DevInfo application contains ten administrative, data presentation and data
analysis features which offer additional powerful data utilities to DevInfo users. These features are as
follows:
di About
Provides links to important product information about DevInfo 6.0, including
live updates
di Settings
Allows you to customize the DevInfo 6.0 user interface settings
di DataWizard
Launches the Data Wizard
di Book
Allows you to create animated flipbooks using DevInfo presentation objects
di Video
Allows you to create videos using DevInfo presentation objects
di Profiles
Allows you to generate uniform profiles for multiple areas using created
profile layouts
di Analyzer
Allows you to display and view data in scatter plots to analyze correlations
amogn multiple indicators over time
di TreeMap
Allows you to display and view data in tree maps to analyze data patterns
and relationships
169
di Radar
Allows you to display and view data in radar charts to analyze relative data
values for a set of indicators
di Sidebar
Launches a customizable desktop sidebar providing quick access to Gallery
objects, RSS feeds, and related facts
Each of these features will be explained in detail.
di About
di About provides links to important information about DevInfo 6.0, including live updates. Click
di About to open the di About dialog box (Fig 10.1).
Fig. 10.1 di About dialog box
The following options are available in the di About dialog box:
Version
A clickable link which opens a web page displaying details about the
latest version of DevInfo 6.0 and a summary of the latest updates
Tour
Launches a tour of the features in DevInfo 6.0
Product
Opens a web page displaying details about the DevInfo 6.0 software
application
Opens a web page displaying a link to the DevInfo website
Organization
170
Help
Opens the DevInfo 6.0 User’s Guide in .pdf format
Check for Updates
Checks to see whether any live updates to the DevInfo 6.0
application are available and, if so, allows you to download them to
your computer. Note that you must be connected to the Internet to
use this feature.
Register
Allows you to register your user details with the DevInfo initiative to
update the global registry of all DevInfo users. After registering, your
user information will be visible on di Sidebar under the di Worldwide
widget as well as at www.devinfo.org | di Worldwide, thereby
facilitating social networking among the global DevInfo community.
di Settings
di Settings allows you to change the default DevInfo 6.0 display settings. Click
open the di Settings dialog box (Fig 10.2).
di Settings to
Fig. 10.2 di Settings dialog box displaying the General tab
Note that there are six tabs in the di Settings dialog box, each of which contain various options.
171
General
Under the General tab, the following general options are available (Fig. 10.2):
Product Path
Displays the path of the application root folder. Note that this can
only be viewed, not modified.
Product Name
Displays the product name as it appears on the desktop icon label.
Note that this can only be viewed, not modified.
Auto-Select Filter Options
Instructs the application to display or hide the Auto-Select Filter
button. If this check box is selected, the application will display the
Auto-Select button on the pane headers in those windows/modules
which handle data sets (such as the Data Entry module).
Prompt to save presentation Instructs the application to prompt you to save the table, graph or
map at the time of closing the respective window, if selected.
Area Tree Sorted by Area ID
Instructs the application to sort the area tree by Area ID as the
default sort option, if selected.
Global Color
Allows you to assign the desired color to the DevInfo global database
elements. Click the color box to open the color palette and select the
desired color.
Recommended Sources
Allows you to assign the desired color to the recommended sources.
Click the color box to open the color palette and select the desired
color.
Comments
Allows you to display or hide comments in the data view.
Show Excel
Instructs the application to use MS-Excel to display tables, graphs
and maps, if selected. Clear the check box to instruct the application
to use its own (non MS-Excel) method of displaying these
presentation objects.
172
Show Classic Home Page
Instructs the application to display the home page in Classic view, if
selected.
Click Apply to apply all changes and continue selecting additional options. Click Cancel to cancel all
changes and exit. Click OK to save all changes and exit.
Language
Under the Language tab, the following language options are available for the DevInfo 6.0 User
application interface strings (Fig. 10.3):
Fig. 10.3 Language tab
Name
Allows you to change the language used for the DevInfo User
application interface strings. Select the desired language from the list
in the box. Note that you can choose from any of the six official UN
languages: Arabic, Chinese, English, French, Russian and Spanish.
Alternatively, click
language file.
Font, Style and Size
Browse to browse and select another
Allows you to change the font, font style, and font size used for the
interface strings. Select the desired options from the lists in the Font,
Style and Size boxes, respectively.
173
Source Language
Allows you to change the default language used for the selected
database if other languages are available. Select the desired
language from the list in the box.
Indicator
Under the Indicator tab, the following options are available for modifying the display settings for
indicators (Fig. 10.4):
Fig. 10.4 Indicator tab
Select Indicators by
Allows you to display or hide indicator classifications as well as set
the default classification view. Select the check boxes next to the
indicator classifications which you wish to display and clear the ones
which you wish to hide. Note that you cannot clear the Sector check
box, as it is the default selection.
By default, Sector is selected as the default classification view. To
change the default classification view, select the option button next
to the desired classification. Note that only one indicator
classification can be selected as the default view.
Show Unit and Subgroups
174
Allows you to display or hide units and subgroups along with the
indicators in the default view.
Show Indicators with Missing Data
Allows you to show or hide indicators with missing data
Data
Under the Data tab, the following options are available for modifying the display settings of the
elements in the data view (Fig. 10.5):
Fig. 10.5 Data tab
Column Arrangement
Allows you to select the elements and their display order in the data
view. By default, all the data elements are selected in the Selected
pane. To hide a data element in the data view, double-click it to
remove it from the Selected pane. To change the display order of
the data elements, highlight an element in the Selected pane and
use
Move Up or
location.
Data View Alternate Row Color
Enable Auto Filters
Move Down to move it to the desired
Allows you to view the alternate rows in the data view in a
different color. To change the default color, click the color
box to open the color palette and select the desired color.
Allows you to enable Auto Filters in the column headers in the data
view, if selected.
175
Page Size
Allows you to specify the number of data records (rows) per page in
the data view.
Table Preview Limit
Allows you to specify the maximum number of data records for which
a table preview will be generated.
Graph Preview Limit
Allows you to specify the maximum number of data records for which
a graph preview wil be generated.
Data Value
Allows you to specify the desired alignment of the data value in the
data view.
Map
Under the Map tab, you can modify the default color scheme for the four default map data breaks
(Fig. 10.6).
Fig. 10.6 Map tab
Click any of the color boxes to open the color palette and select the desired color. After selecting the
first and last colors, click Smooth to smooth out the color gradient between the two colors.
176
Sound
Under the Sound tab, you can modify the default sound file (background music) that plays while the
application is running (Fig. 10.7).
Fig. 10.7 Sound tab
Select the desired sound file from the list or click
a different location.
Click
Browse to browse for and select the file from
to enable or disable the sound file.
di DataWizard
di DataWizard launches the Data Wizard. See Chapter 1, “Getting Started,” for more information on
how to use the Data Wizard.
177
di Book
di Book allows you to create animated flipbooks using DevInfo presentation objects.
di Book to open the di Book application (Fig. 10.8).
Click
Fig. 10.8 di Book application
Note that there are three enabled tools on the toolbar:
New
Allows you to create a new animated flipbook
Delete
Deletes the selected flipbook
Export
Exports the selected flipbook to the Gallery
Click any flipbook thumbnail below the main toolbar to view and/or edit it.
178
Creating a new flipbook
Click
New to open the di Book window (Fig. 10.9).
Fig. 10.9 di Book window
First select the desired page size from the expanded
Page Setup panel window on the left panel.
Note that you can choose from standard page sizes or specify the dimensions for a custom page size.
179
Importing image files
The next step is to import the image files which you wish to paste into your flipbook. Click Add Files
at the top of the right panel to search the Gallery for available image files. Note that the default file
format displayed (located above Open and Cancel) is Picture files (*.gif). To view all DevInfo tables,
maps and graphs saved in the Gallery, change this selection to Picture files (*.jpg) (Fig. 10.10).
Fig. 10.10 Importing Gallery images into di Book
Select the desired image from the list or browse for other available images. Note that di Book allows
you to import images in a variety of file formats, including .gif, .jpeg, .png, .pdf and .xls.
The selected image will be imported into the di Book application and will appear as a thumbnail on
the right panel (Fig. 10.11). Continue using Add Files to import all the images which you wish to
paste into your flipbook.
180
Fig. 10.11 Imported images on the right panel
Pasting image files into the flipbook
The next step is to paste the image files located on the right panel into the flipbook. Start by dragging
the desired image to the center pane. Note that the same image also appears in Page 1 of the
expanded
Pages panel window on the left panel (Fig. 10.12).
Fig. 10.12 Pasting image files into the flipbook
181
To re-size or re-position the image on the page, drag the image borders to the desired location. To
add text to the page, use the text tools
available on the editing toolbar at the
top of the window. Re-size and re-position the default text box by dragging its borders to the desired
location (Fig. 10.13).
Fig. 10.13 Re-sizing and re-positioning the image and text
Note that only one image can be pasted per page. To delete the contents of any page, select the
desired page from the expanded
toolbar in the panel window.
Pages panel window and click
Delete on the bottom
To paste images to other pages in your flipbook, first select the desired page from the expanded
Pages panel window. Note that the selected page also appears in the center pane. Now you can drag
the desired image to the center pane to create a new page.
To add more pages to your flipbook, click
Add on the bottom toolbar in the expanded Pages
panel window. Note that the application adds two pages at a time to your flipbook.
182
Note: Re-sizing and re-positioning flipbook images
The option to re-size and re-position an image by dragging the image borders to the
desired location is disabled once you leave the current page and move on to the next
page. Therefore, be sure to finalize your image edits on the current page before pasting
images to new pages.
Previewing the flipbook
To preview your flipbook, click Preview from the expanded
Save panel menu. A new window
opens in Flash Page Flip, allowing you to preview the flipbook (Fig. 10.14).
Fig. 10.14 Previewing the flipbook
183
Use the page navigation tools on the bottom toolbar to view the different pages of the flipbook. For a
more interesting animated viewing experience, flip the pages manually by using the mouse pointer to
drag the page corners to the desired location (Fig. 10.15).
Fig. 10.15 Flipping pages manually using the mouse pointer
Saving the flipbook
To save your flipbook, click either Save or Save As from the expanded
Save panel menu. Note
that the application allows you to save your flipbook in either .diBook or .pdf file formats.
di Video
di Video allows you to create videos using DevInfo presentation objects. Click
the di Video application (Fig. 10.16).
184
di Video to open
Fig. 10.16 di Video application
Note that there are three enabled tools on the toolbar:
New
Allows you to create a new video
Delete
Deletes the selected video
Export
Exports the selected video to the Gallery
Click any video thumbnail below the main toolbar to view and/or edit it.
185
Creating a new video
Click
New to open the di Video window (Fig. 10.17).
Fig. 10.17 di Video window
First select the desired screen size from the expanded Screen Setup panel window on the left panel.
Note that you can choose from standard screen sizes or specify the dimensions for a custom screen
size.
Importing files
The next step is to import the files which you wish to paste into your video. Click Add Files at the top
of the right panel to search and browse for available files. Note that the default file format displayed
(located above Open and Cancel) is Picture files (*.gif), while di Video allows you to import files in a
variety of formats, including .mpg, .wmv, .avi, .jpeg and .xls.
To view and select DevInfo tables, maps and graphs saved in the Gallery, change the folder location
to C:\DevInfo\DevInfo 6.0\DevInfo 6.0\Gallery\Presentations and change the file format to Picture
files (*.jpg) (Fig. 10.18).
186
Fig. 10.18 Importing Gallery images into di Video
The selected file will be imported into the di Video application and will appear as a thumbnail on the
right panel (Fig. 10.19). Continue using Add Files to import all the files which you wish to paste into
your video.
Fig. 10.19 Imported images on the right panel
187
Pasting files into the video
The next step is to paste the files located on the right panel into the video. To create the first screen
of the video, drag the desired file to the first screen on the bottom screen panel (Fig. 10.20). Note that
the contents of the selected screen are displayed in the center pane.
Fig. 10.20 Pasting files into the video
To re-size or re-position the image on the screen, drag the image borders to the desired location. To
add text to the screen, use the text tools
available on the editing toolbar at the
top of the window. Re-size and re-position the default text box by dragging its borders to the desired
location (Fig. 10.21).
188
Fig. 10.21 Re-sizing and re-positioning the image and text
Note that only one file can be pasted per screen. To delete the contents of any screen, select the
desired screen from the bottom screen panel and click
Delete on the panel toolbar.
Continue pasting files to other screens by dragging the desired file from the right panel to the desired
screen on the bottom screen panel. Note that the application automatically adds additional screens to
your video as needed.
Note: Re-sizing and re-positioning images
The option to re-size and re-position an image by dragging its borders to the desired
location is disabled once you leave the current screen and move on to the next screen.
Therefore, be sure to finalize your image edits on the current screen before pasting files
to new screens.
189
Applying transitions between screens
di Video allows you to apply transitions between screens, which are similar to slide transitions in MS
PowerPoint. Click the arrow to the right of
window (Fig. 10.22).
Transitions on the left panel to expand the panel
Fig. 10.22 Expanded Transitions panel window
Note that there are eight transitions available in di Video. To apply a transition, drag the desired
transition to the desired transition window (connecting link) between any two screens (Fig. 10.23).
Fig. 10.23 Applying transitions between screens
To remove an applied transition, select it and right-click to open the Remove menu. Click Remove
from the right-click menu to remove the applied transition.
190
To change the default transition timings, modify the values in the boxes below each transition window.
Applying special effects to screens
di Video allows you to apply special effects to screens. Click the arrow to the right of
the left panel to expand the panel window (Fig. 10.24).
Effects on
Fig. 10.24 Expanded Effects panel window
Note that there are nine special effects available in di Video: Blur, Brightness, Fade To Black, Film
Aging, Mirror Horizontal, Pixellate, Rotate 180, Rotate 270 and Rotate 90. To apply an effect to a
screen, drag the desired effect to the blue star at the bottom left of the desired screen (Fig. 10. 25).
Fig. 10.25 Applying special effects to screens
To remove an applied effect, select it and right-click to open the Remove menu. Click Remove from
the right-click menu to remove the applied effect.
191
Previewing the video
To preview your video, do one of the following:
•
Click
•
Click Preview from the expanded
media player.
Play on the screen panel toolbar to view the video in the current window.
Save panel menu to run the video in the default
Saving the video
To save your video, either click Save or Save As in the expanded
Save panel menu. Note that
the application allows you to save your video in .mpg, .wmv, or .avi file formats.
di Profiles
di Profiles allows you to generate uniform profiles for multiple areas using created profile layouts
(Fig. 10.26).
Fig. 10.26 Sample country profile created using di Profiles
Click
192
di Profiles to open the di Profiles Wizard, which allows you to create profiles in four steps.
Step 1 - Select Profile Layout
In Step 1, select the desired profile layout from the Available pane and transfer it to the Selected
pane by either double-clicking it or by using the selection arrows in the pane header (Fig. 10.27).
Alternatively, click
Browse to browse for additional created profile layouts offline.
Fig. 10.27 Selecting a profile layout
Note: Creating profile layouts
Creating profile layouts requires familiarity with database content and knowledge of MSExcel spreadsheet handling. Users interested in creating their own profile layouts need
to contact the DevInfo Support Group for further details.
Click Next to proceed to Step 2.
193
Step 2 - Select Database
In Step 2, select the database from where you want the profile layout to extract data and transfer it to
the Selected pane (Fig. 10.28). Alternatively, click
offline.
Browse to browse for additional databases
Fig. 10.28 Selecting a database
Note: Matching databases with profile layouts
Profile layouts are created for a particular database and are therefore databasespecific. Users wishing to know which profile layouts are associated with which
databases need to contact the DevInfo Support Group for more details.
Step 3 - Select Area
In Step 3, select one or more areas for which you wish to generate profiles and transfer them to the
Selected pane (Fig. 10.29). For more information on how to select areas, see Selecting areas in
Chapter 2, “Searching for Data.”
194
Fig. 10.29 Selecting areas
Step 4 – Process Information
In Step 4, select the file location where the profile(s) should be saved. Click OK to begin generating
profiles for each of the selected areas. Click Finish after all the profiles have been generated.
Viewing the profile
All profiles are generated as Microsoft Excel files. To view a profile, open the profile file from the
location where it was saved.
195
di Analyzer
di Analyzer allows you to display and view data in scatter plots to analyze correlations among multiple
indicators over time. Click
di Analyzer to open the application (Fig. 10.30).
Fig. 10.30 di Analyzer
Understanding di Analyzer
di Analyzer displays data in the following dimensions: geographic areas, X-axis data value, Y-axis
data value, symbol size and time period. The data are shown in an animated scatter plot. The
geographic areas represented by the symbols are shown in the legend at the bottom of the screen.
Each geographic area is assigned a default color. The X-axis and Y-axis indicators are shown against
each time period. The symbol size is determined by a user-defined indicator.
When the application starts, the default scatter plot is shown from a pre-selected set of selections.
The time bar progresses through the animation from the first time period to the last and then the
animation stops. To run the animated scatter plot again, click the
arrow to the left of the timeline
located above the scatter plot. Click it again to pause the application to view data for a particular time
period. While the application is paused, move the mouse pointer over any scatter to open a box
containing its data details or drag the timeline slider to a particular time period to generate a data view
for that time period.
196
Changing the settings
Click Settings to change the default selections for the database, areas, X-axis, Y-axis and symbol.
•
•
•
•
•
•
Click the Database tab to select the database of indicators available for each dimension
of the scatter plot. To upload your own database, click Upload Database to send your
database to the DevInfo Support Group to be optimized and uploaded.
Click the Areas tab to select the areas for which you wish to view data.
Click the X-Axis and Y-Axis tabs to select the indicators for these dimensions of the
scatter plot.
Click the Symbol tab to select the indicator for this dimension of the scatter plot. This
indicator will determine the relative size of the symbol plotted. Select the symbol to be
used to display data and adjust the absolute symbol size and transparency.
Click Save As to save your settings as a new scenario.
Click Settings again to return to the main application.
Click Full Screen to view the application in full screen.
Select the Trails check box to view the data trend trails over time.
Click Symbol to select the symbol used to display data and to adjust the absolute symbol size and
transparency. Note that these options are also available under the Symbol tab under Settings.
In the area legend below the scatter plot, select or clear the areas for which you wish to view data.
You can also customize the area colors by clicking the color box next to any area name to open the
color palette, from where you can select the desired color.
197
di TreeMap
di Tree Map allows you to display and view data in tree maps to analyze data patterns and
relationships. Click
di TreeMap to open the application (Fig. 10.31).
Fig. 10.31 di TreeMap
Understanding di TreeMap
di TreeMap allows users to display and view data in tree maps to analyze data patterns and
relationships. Tree maps display hierarchical, tree-structured data as a set of nested rectangles. Each
branch of the tree is depicted by a rectangle, which is then tiled with smaller rectangles representing
sub-branches. The area of each rectangle is proportionate to a specified dimension of the data. The
branches are colored to show separate data dimensions. When the color and size dimensions are
correlated in some way with the tree structure, users may be able to spot patterns that might be
difficult to spot in other presentation objects.
As di TreeMap is a web-based application, users can view data displayed for pre-loaded indicators,
areas and time periods. Work to enhance di TreeMap and develop a desktop version of the same is
scheduled for the future, at which time users will be able to use their own data sets and select their
own indicators, areas and time periods.
198
Changing the settings
Use the box at upper left to select the categorization method. Select either Agency-Theme-Year
(default) to categorize the data by agency, theme and year or Theme-Agency-Year to categorize the
data by theme, agency and year.
From the Algorithm box, select either squarified or alternating to apply the desired tree map
algorithm to the data.
From the Color Scheme box, select the desired color scheme.
From the Label Threshold box, select the desired number of thresholds (tree branch levels) for tree
map display.
From the data legend at the bottom of the application window, view the data values corresponding to
each color.
di Radar
di Radar allows you to display and view data in radar charts to analyze relative data values for a set
of indicators. Click
di Radar to open the application (Fig. 10.32).
Fig. 10.32 di Radar application
199
Understanding di Radar
di Radar allows users to display and view data in radar charts to compare and analyze data values
among various areas. Radar charts consist of a sequence of equi-angular spokes, with each spoke
representing a different indicator. A line is drawn to connect the data values on each spoke, allowing
users to identify relative data trends that might be difficult to spot in other presentation objects.
As di Radar is a web-based application, users can view data displayed for pre-loaded indicators and
areas. Work to enhance di Radar and develop a desktop version of the same is scheduled for the
future, at which time users will be able to use their own data sets and select their own indicators and
areas.
Note that for the present, the data elements selected for di Radar are purely arbitrary and are
intended only to demonstrate the potential of this application. In this demonstration version, the
indicators selected all pertain to hypothetical measures of in-country DevInfo implementation, the
areas selected are purely arbitrary, and the data values assigned are purely imaginary.
Changing the settings
Under the Series Type heading on the left panel, select either Line or Column to instruct the
application to display the data in either line or column format on the radar chart.
Under the Radial Axis heading on the left panel, select either Horizontal, Vertical, Both or None to
instruct the application which type of radial axis to display.
Under the Form heading on the left panel, select either Line or Curve to instruct the application to
use either lines or curves to connect chart values. Note that this option is only available when the
Line series type is selected.
Move the mouse pointer over any area name in the Legend area to view chart data only for that area.
Click any area name in the legend to freeze the chart to display data only for that area. Click Reset to
display data again for all areas available.
di Sidebar
di Sidebar launches a customizable desktop sidebar providing quick access to Gallery objects, RSS
feeds, and related facts. Click
the screen (Fig. 10.33).
200
di Sidebar to open the sidebar, which will appear at the right of
Fig. 10.33 di Sidebar at the right of the screen
The sidebar gives you access to the following widgets:
•
•
•
•
•
Graphs, maps and tables saved to the sidebar
Gallery
RSS
Fact of the Week
di Worldwide
Note that the sidebar remains active even when the DevInfo application is closed. To collapse (hide)
the sidebar while still keeping it active, move the mouse pointer away from the sidebar towards the
left. To view the sidebar again, move the mouse pointer towards the right edge of your screen.
To close the sidebar and render it inactive, click
on the toolbar at the upper right of the sidebar.
201
Graphs, maps and tables saved to the sidebar
Displayed at the top of the sidebar are the maps, graphs and tables created in DevInfo 6.0 which
have been saved to the sidebar. These presentation objects can be saved to the sidebar in two ways:
•
•
By clicking Save to Sidebar from the expanded
Save l Print menu in the Map,
Graph and Table windows after viewing and editing the objects
By selecting the desired maps, graphs and tables already saved in the Gallery and
clicking
Save to Sidebar from the Gallery toolbar
Click the arrow to the right of any map, graph or table widget on the sidebar to open its widget
window, which displays a presentation preview. Move the mouse pointer over the presentation
preview to cause its respective toolbar to appear at the left of the window (Fig. 10.34).
Fig. 10.34 Presentation preview panel in di Sidebar
To enlarge any of the presentation objects for better viewing and editing, either click the object itself
within the widget window or click
Click to enlarge on the window toolbar. This opens an
enlarged viewing window (Fig. 10.35).
202
Fig. 10.35 Enlarged viewing window for sidebar objects
Move the mouse pointer over the enlarged viewing window to cause the same presentation preview
toolbar to appear at the left of the window. To further enlarge the object for better editing, click
Click to enlarge on the toolbar again. A new DevInfo application window opens, allowing you to edit
the object. For details on how to edit presentation objects, see Chapter 4, “Tables,” Chapter 5, “Maps,”
and Chapter 6, “Graphs.”
203
Gallery
The Gallery widget in di Sidebar allows you to conveniently view presentation objects saved to the
Gallery. Click the arrow to the right of Gallery to expand the widget window (Fig. 10.36).
Fig. 10.36 Expanded Gallery widget window
To view all Gallery objects, click All from the top menu bar and use the
arrows at the bottom
of the window to navigate through the objects. Click Table, Graph, or Map to view only those objects.
To enlarge any object for better viewing, click the object in the widget window.
To search for Gallery objects, type the desired keyword(s) in the search box.
RSS
The RSS widget in di Sidebar allows you to view DevInfo-related RSS news feeds. Click the arrow to
the right of RSS to expand the widget window (Fig. 10.37).
204
Fig. 10.37 Expanded RSS widget window
Click any news feed to read the full article. Use the
arrows at the bottom of the window to
navigate through the news feeds. To add additional RSS news feeds, click
on the bottom toolbar
in the window to open the Add Feed window, in which you can specify the feed name and URL.
205
Fact of the Week
The Fact of the Week widget in di Sidebar allows you to view the DevInfo Fact of the Week. Click the
arrow to the right of Fact of the Week to expand the widget window (Fig. 10.38).
Fig. 10.38 Expanded Fact of the Week widget window
To view the full article, click
206
Click to enlarge on the bottom toolbar in the window.
di Worldwide
The di Worldwide widget in di Sidebar allows you explore details on DevInfo adaptations and users
worldwide. Click the arrow to the right of di Worldwide to expand the widget window (Fig. 10.39).
Fig. 10.39 Expanded di Worldwide widget window
Note: Downloading Google Earth Plug-In to view di Worldwide
In order to properly view and use the di Worldwide widget in di Sidebar, the Google
Earth Plug-In application must be first installed on your computer. If this application is not
already installed, a message will appear in the widget window prompting you to
download and install it.
207
For optimum viewing, click
Click to enlarge at the bottom of the window. This opens an
enlarged viewing window (Fig. 10.40).
Fig. 10.40 Enlarged viewing window for di Worldwide
Displayed at the top of the window are three categories. Select Adaptations to explore DevInfo
adaptations worldwide, as DevInfo has been adapted to country-specific requirements in many
countries around the world. Select Activations to see where DevInfo has been installed. Select
Users to view which users are currently online.
After selecting the category, use the mouse to generate the desired view on the globe. Drag the globe
to rotate it, double-click to zoom in on a particular region, and double right-click to zoom out.
After generating the desired view on the globe, click any country flag or DevInfo icon to view more
details about DevInfo adaptations, activations and users worldwide.
Changing di Sidebar settings
Click
on the toolbar at the upper right of the sidebar to open the di Sidebar - Settings dialog box
(Fig. 10.41).
208
Fig. 10.41 di Sidebar – Settings dialog box
Note that there are five tabs which allow you to change the default di Sidebar settings:
General
Allows you to modify the default di Sidebar settings, including which
widgets should be displayed on the sidebar
Table
Allows you to delete tables saved to the sidebar
Map
Allows you to delete maps saved to the sidebar
Graph
Allows you to delete graphs saved to the sidebar
RSS
Allows you to add, edit or delete RSS feeds
Click
to refresh the sidebar after changing the settings.
209
Download