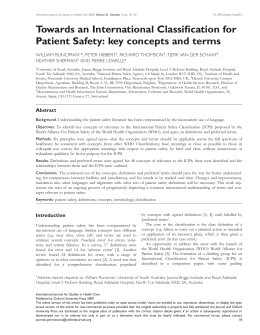
Introdução à Medicina I/II
Class 9
Adviser: Alberto Freitas
What are PQIs?
IntroMedI - class 9 - PQIs
QIs
• Not definitive measures
• Use hospital discharge
inpatient data
•Based on readily available data
IntroMedI - class 9 - PQIs
PQIs
• Primary Healthcare
•Ambulatory Care Sensitive
Conditions
Prevention starts
here.
• “avoidable hospitalization rates are a sensitive indicator for
assessing quality of primary ambulatory care”IntroMedI
(Niti et
al,9 2003)
- class
- PQIs
Source: Ansari Z. Laditka JN. Laditka SB. Access to Health Care and Hospitalization for
Ambulatory Care Sensitive Conditions. Med Care Res Rev. 2006;IntroMedI
63:719-742
- class 9 - PQIs
When were they first
introduced?
IntroMedI - class 9 - PQIs
Studies of the kind in other countries
• United States
• Australia
(Ansari et al., 2003, 2006)
• New Zealand
• Canada
• Italy
(Sheerin et al., 2006)
(Roos et al., 2005, Porter et al., 2007)
• Singapore
• Spain
(Starfied et al.,1991, Sanderson et al., 2000, Kozak et al., 2001)
(Niti & Ng, 2003)
(Sánchez et al., 2004)
(Rizza et al., 2007)
IntroMedI - class 9 - PQIs
Source: Agency for Healthcare Research and Quality. Guide to Prevention Quality
Indicators: Hospital Admission for Ambulatory Care Sensitive Conditions. Version 3.1.
Rockville, MD: Agency for Healthcare Research and Quality; March 2007.
IntroMedI - class 9 - PQIs
This kind of studies
• evaluate the quality of the healthcare
conditions
• establish patterns
• allow comparison with past and
future works inside and outside the
sampling area.
IntroMedI - class 9 - PQIs
Key-words
• Ambulatory Care
•Primary Care
•Quality of Healthcare
•Portugal
•Delivery of Healthcare
•Prevention Quality Indicators
IntroMedI - class 9 - PQIs
Aim
IntroMedII - class 9 - PQIs
RESEARCH QUESTION
What is the status of the primary health
care system in Portugal and how does it
compare to past years and among its
regions?
IntroMedI - class 9 - PQIs
AIMS
• Assessment of the primary healthcare
system quality, in an outpatient setting.
• Compare different level 2 NUTS*, trends
2000-2005
• Lay hypotheses for the observed
differences.
*except for Azores and Madeira.
IntroMedI - class 9 - PQIs
Participants and Methods
IntroMedII - class 9 - PQIs
PARTICIPANTS
•
6199102 patients’ discharge data from
national database (ACSS)
• 94 Acute Care Public Hospitals (continent)
IntroMedI - class 9 - PQIs
DATA COLLECTION
• Data collected from acute care hospital
database
• Variables of interest present in the
database or calculated from others
•
INE (Instituto Nacional de Estatística)
provides populational and other statistical
data
IntroMedI - class 9 - PQIs
• Division in NUTS II
2000
2002
2001
2004
2003
2005
IntroMedI - class 9 - PQIs
INCLUSION
• Diagnosis according to PQI
EXCLUSION
•
Age <18
•
MDC = 14 or 15
•
Transferred from
•
Related non-evaluative conditions
IntroMedI - class 9 - PQIs
IntroMedI - class 9 - PQIs
IntroMedI - class 9 - PQIs
IntroMedI - class 9 - PQIs
Source: Agency for Healthcare Research and Quality. Guide to Prevention Quality
Indicators: Hospital Admission for Ambulatory Care Sensitive Conditions. Version 3.1.
Rockville, MD: Agency for Healthcare Research and Quality; March
2007.
IntroMedI - class 9 - PQIs
INVALID
• Address codes missing. non-existent or
belonging to the Azores or Madeira.
• Absurd age (below 0; over 150)
• Undetermined Sex (3)
IntroMedI - class 9 - PQIs
STRATIFICATION
• NUT II (Norte, Centro, Lisboa, Alentejo, Algarve)
• Year (2000-2005)
• Gender
• Age (0-17; 18-24; 25-34; 35-44; 45-54; 55-64;
65-74; 75+)
IntroMedII - class 9 - PQIs
IntroMedII - class 9 - PQIs
RESULTS OVERVIEW
IntroMedII - class 9 - PQIs
*
*
9
Overall PQI = Sum of all PQIs except for 2 and
IntroMedI - class 9 - PQIs
IntroMedI - class 9 - PQIs
IntroMedII - class 9 - PQIs
IntroMedII - class 9 - PQIs
IntroMedII - class 9 - PQIs
IntroMedII - class 9 - PQIs
Country
PQI1
PQI2
PQI3
PQI5
PQI7
PQI8
PQI9
M
20.04
23.62
89.23
155.77
18.94
156.45
5.24
F
29.27
18.95
89.25
80.84
25.38
190.29
6.01
M
56.24
31.18
135.41
208.1
37.27
463.64
6.00
F
53.31
28.93
118.71
251.39
61.44
512.08
6.53
PQI12
PQI13
PQI14
PQI15
PQI16
PT
Gender
USA
PQI10 PQI11
PT
USA
M
17.75
324.81
58.43
71.37
19.64
11.37
31.38
F
25.35
263.99
107.27
49.79
27.82
27.83
19.34
M
98.72
398.89
101.03
43.74
21.37
67.99
51.22
F
154.39
436.39
249.26
47.97
23.07
170.22
27.64
IntroMedII - class 9 - PQIs
Significant Associations
• Life Quality
• GIP per Capita
• Life Expectancy at Birth
• Healthcare Facilities
• Number of Health Centers per 100.000 pop.
• Medical visits per inhabitant
• Number of doctors per 1000 pop.
• Education
• Literacy Index
• Proportion of active population with minimum education
(“3º Ciclo”)
• Proportion of active population with secondary education
or higher
• Neonatal
• Age of first pregnancy
IntroMedII - class 9 - PQIs
Significant Associations
•Overall PQI
•Acute PQI
•Diabetes PQI
No significant associations
found
IntroMedII - class 9 - PQIs
Diabetes short-term complication
Doctors (N) r= -0,70
Nurses (N) r= -0,81
Health Centres r= 0,74
Lit. Index r= -0,67
Life exp. r= -0,61
Hospital Distance r= 0,76
Med. Visits r= -0,59
IntroMedII - class 9 - PQIs
Perforated Appendix
Pop. Density r= -0,96
Med. Visits r= -0,76
Doctors (N) r= -0,53
Hospital Distance r= 0,37
Life Exp. r= -0,43
Lit. Index r= - 0,40
IntroMedII - class 9 - PQIs
Diabetes Long-term complication
NONE
COPD
Med. Visits r= 0,71
Life Exp. r= 0,60
Hospital Distance r= 0,53
Min. Education r= -0,39
Hypertension
Sec. Education r= -0,36
Min. Education r= -0,35
IntroMedII - class 9 - PQIs
Congestive Heart Failure
Health Centres r= 0,70
Doctors (N) r= -0,68
Hospital Distance r=
0,56
Lit. Index r= -0,68
Dehydration
Hospital Distance r=
0,78
Lit. Index r= -0,64
Life Exp. r= -0,40
Health Centres r= 0,73
IntroMedII - class 9 - PQIs
Bacterial Pneumonia
Life Exp. r= -0,51
Urinary Tract Infection
Sec. Education r= 0,49
Min. Education r= 0,52
Med. Visits r= -0,51
GDP r= 0,37
IntroMedII - class 9 - PQIs
Angina without Procedure
GDP r= 0,54
Minim. Education r= 0,44
Life Exp. r= -0,50
Sec. Education r =0,42
Lower-extremety amp. in Diabetics
Hospital Distance r=
0,74
Health Centres r= 0,63
Minim. Education r= 0,33
Lit. Index
r= -0,62
Uncontrolled Diabetes
Med. Visits r= 0,50
Adult Asthma
GDP r= 0,50
Min. Education r=
0,47
Med. Visits r= 0,57
Sec. Education r
=0,46
Lit. Index r= 0,38
IntroMedII - class 9 - PQIs
Low Birth Weight per 100 neonates
GDP
r= 0,70
Mean
Age 1st
Pregnancy
r= 0,64
Fig.6 Mean age of first child vs LBW Linear Regression
IntroMedII - class 9 - PQIs
Cost Analysis
IntroMedII - class 9 - PQIs
IntroMedII - class 9 - PQIs
Discussion
IntroMedII - class 9 - PQIs
Prevention
• There are different levels of prevention
1. Preventing the onset of the condition
2. Preventing the rampage development of symptoms; i.e
controling the condition
IntroMedII - class 9 - PQIs
Variable
North
Centre
Lisbon
Alentejo Algarve
Population Ageing Index 90,9
140,1
105,9
170,8
126,2
Cities
51
41
17
19
11
Pop. Density(N/Km2)
175,6
84,5
946,9
24,3
83,4
SEDI
CO2 emissions/Km2
0,775
0,767
620,131 361,722
0,854
9029,576
0,747
232,786
0,791
360,295
Sources: INE, 2005; Cónim C. População e Desenvolvimento Humano- Uma Perspectiva de Quantificação -1970-1999; Marques
JL, Martins JM, Castro EA. Análise input-output rectangular inter-regional - emissões de CO2 em Portugal e o protocolo de
Quioto
Fig.9 Overall PQI per NUT II
IntroMedII - class 9 - PQIs
Self-Perception of Health
NUT II
Good/Very Good
Total Male Female
Continent 31,3 38,5
27,1
North
31,4 38,1
27,6
Centre
26 32,4
22,1
Lisbon
34,3 42,8
49,1
Alentejo
33,2
40
28,3
Algarve
31,5 38,8
27,2
Total
42,9
42,2
44,1
43,3
42,5
41,7
Average
Male Female
41,6
43,7
40,8
43,1
44
44,2
40,7
44,9
43
42,2
39,3
43,1
Bad/Very Bad
Total Male Female
25,8 19,9
29,3
26,4 21,1
29,3
27,9 23,6
30,5
22,4 16,5
26
24,3
17
28,5
26,9
22
29,7
Source: National Health Survey, 1999
Overall PQI
IntroMedII - class 9 - PQIs
Patient Profile
• Male
• Elderly (75 years old +)
• Living in areas not densely populated
IntroMedII - class 9 - PQIs
Studies supporting this association:
Lockwood et al .Stress-associated preterm delivery: the role of corticotropin-releasing hormone.
IntroMedII - class 9 - PQIs
Variable
USA
Portugal
Year
Source
Human
Development
Index (HDI)
0,951
(ranked
12th)
0,897
(ranked
29th)
2005
UNDP report 2007/2008
Obesity
32,0%
14.2%
2004
Health 2007 (USA)
Overweight and obesity
in Portugal: national
prevalence in 2003–
2005
Smoking
prevalence
23.9%
35.8%
2005
WHO
CO2 emissions
(ton per
capita)
20,6
5,6
2004
UNDP report 2007/2008
Hypertension
30,2%
20,0%
2004/5
National Health Survey
(PT)
Health 2007 (USA)
Diabetes
7,0%
6,5%
2005
National Institute of
Diabetes
National Health Survey
(PT)
IntroMedII - class 9 - PQIs
Variable
USA
Access to
drinking
water
99%
99%
2006
WHO
Life
expectancy at
birth (years)
77,9
77,7
2005
UNDP report 2007/2008
Climate
Dfa/b, Cfa,
BSh/k, Csb,
BWk.
Csb
(north),
Csa
(south)
2006
Kottek et al, World map
of Koppen-Geiger climate
classification update.
Ethnies
Heterogeneous
N/A
2006
US Census Bureau.
Male/Female
49%/51%
48,4%
51,6%
2005
US Census Bureau
INE
>65 y
12,4%
17,0%
2005
US Census Bureau
INE
Wet all seasons:
Dfa – snow, fully humid, hot summer ;
Dfb – snow, fully humid, warm summer
Portugal Year
Dry arid
BWk – arid, desert, cold arid
Mediteranean
Csb – warm temperature, summer dry,
warm summer
Csa – warm temperature, summer dry,
hot summer.
Source
Humid subtropical:
Cfa – warm temperature, flly humid, hot
summer
Dry semiarid
BSk – arid, steppe, cold arid
BSh – arid, steppe, hot arid
IntroMedII - class 9 - PQIs
250
200
150
Portugal
Spain
Espanha
100
50
UT
I
De
CH
hy
F
dr
at
at
Hy
io
pe
n
r te
ns
io
n
An
gi
na
As
th
m
a
DP
O
C
0
IntroMedII - class 9 - PQIs
Study Limitations
• Socioeconomic factors:
• gender
• age
• Income
• Propensity to seek care according to perceived
health needs
• Hospital bed availability
• Regular source of care or continuity of care
• Differences in healthcare service (Public/Private
healthcare; Insurances)
• Coding Issues
• Lack in Epidemiological Studies (or inconsistent)
• Intra-regional variations
IntroMedII - class 9 - PQIs
Conclusions
•From 55 years old on:
•There is a clear increase in avoidable hospitalizations
•Males present higher avoidable hospitalizations rates
•Differences among years are not significant
•Norte presents the best quality/cost ratio
•Portugal shows a more efficient primary
healthcare system than USA or Spain.
•Some heterogeneity among regions points to
uneven primary healthcare supply
•Further study is required to evaluate yearly trends
and precise factors which influence PQ.
IntroMedII - class 9 - PQIs
Future Research
• Multivariate analysis of correlations
• Litoral/Interior Analysis
• Wider timespan (Pre and Post SNS restructuration)
• Careful analysis of economical indexes and prevalence of
analysed conditions
• Further International Comparison
IntroMedII - class 9 - PQIs
IntroMedII - class 9 - PQIs
REFERENCES
PQI Info
• Agency for Healthcare Research and Quality. Guide to Prevention Quality Indicators:
Hospital Admission for Ambulatory Care Sensitive Conditions. Version 3.1. Rockville (MD):
Agency for Healthcare Research and Quality; March 2007.
• Farquhar, M. AHRQ Quality Indicators [slides]. Rockville (MD): Agency for Healthcare
Research and Quality; 2005. 20 slides colour.
• General Questions about the AHRQ QIs [Internet]. Rockville (MD): Agency for Healthcare
Research
and
Quality;
July
2004
[cited
2007
Oct
31].
Available
from:
http://www.qualityindicators.ahrq.gov/general_faq.htm
• AHRQ Prevention Quality Indicators Overview [Internet]. Rockville (MD): Agency for
Healthcare Research and Quality; July 2004 [cited 2007 Oct 31]. Available from:
http://www.qualityindicators.ahrq.gov/pqi_overview.htm
• Agency for Healthcare Research and Quality. Prevention Quality Indicators: Technical
Specifications. Version 3.2. Rockville (MD): AHRQ; March 2008.IntroMedI - class 9 - PQIs
Related Articles
• Ansari Z, Laditka JN, Laditka SB. Access to Healthcare and Hospitalization for
Ambulatory Care Sensitive Conditions. Med Care Res Rev. 2006; 63:719-42
• Billings J, Zeitel L, Lukomnick J, Carey TS, Blank AE, Newman L. Impact of
socioeconomic status on hospital use in New York City. Health Aff (Millwood). 1993;
2:162-9.
• Starfield B. Primary care and health: a cross-national comparison. JAMA. 1991;
266:2268-71.
• Sanderson C, Dixon J. Conditions for which onset or hospital admission is potentially
preventable by timely and effective ambulatory care. J Health Serv Res Policy. 2000,
5:222-30.
• Kozak LJ, Hall MJ, Owings MF. Trends in Avoidable Hospitalizations, 1980-1998. Health
Aff. 2001; 2 (20): 225-32.
• Casanova C, Starfield B. Hospitalizations of children and access to primary care: a crossnational comparison. Int J Health Serv. 1995; 25:283-94.
• Ansari Z, Barbetti T, Carson NJ, Auckland MJ, Cicuttini F: The Victorian ambulatory care
sensitive conditions study: rural and urban perspectives. Soz Praventivmed. 2003; 48:3343.
IntroMedI - class 9 - PQIs
• Sheerin I, Allen G, Henare M, Craig K. Avoidable hospitalizations: potential for primary
and public health initiatives in Canterbury, New Zealand. N Z Med J. 2003; 119(1236).
• Roos LL, Walld R, Uhanova J, Bond R: Physician visits, hospitalizations, and
socioeconomic status: ambulatory care sensitive conditions in a Canadian setting. Health
Serv Res. 2005, 40:1167-85.
• Porter J, Herring J, Lacroix J, Levinton C. Avoidable Admissions and Repeat Admissions:
What Do They Tell Us? Healthc Q. 2007, 10:26-28.
• Niti M, Ng TP. Avoidable hospitalization rates in Singapore, 1991-1998: assessing trends
and inequities of quality primary care, J Epidemiol Community Health. 2003; 57: 17-22.
• Rizza P, Bianco A, Pavia M, Angelillo IF. Preventable hospitalization and access to
primary healthcare in an area of Southern Italy. BMC Health Serv Res. 2007; 7:134.
• Sanchez JLA, Vilalta JS, Perepérez SB, Martínez IM. Characteristics of avoidable
hospitalization in Spain. Med Clin (Barc). 2004; 122(17):653-8.
• Weissman JS, Gatsonis C, Epstein AM. Rates of avoidable hospitalization by insurance
status in Massachusetts and Maryland. JAMA. 1992; 268:2388-94.
IntroMedI - class 9 - PQIs
• Pappas G, Hadden WC, Kozak LJ, Fisher GF. Potentially Avoidable Hospitalization
inequalities in rates between US socioeconomic groups. Am J Public Health. 1997;
87:811-6.
• Booth GL, Hux JE. Relationship Between Avoidable Hospitalizations for Diabetes Mellitus
and Income Level. Arch Intern Med. 2003; 163:101-6.
Data Sources
• Administração Central do Sistema de Saúde, IP (ACSS). www.acss.min-saude.pt
• Statistics Portugal [Internet]. Lisbon: INE. 1864- [cited 2008 Mar 30]. http://www.ine.pt
• Regulation (EC) No 1059/2003 of the European Parliament and of the Council of 26 May
2003 on the establishment of a common classification of territorial units for statistics
(NUTS) (Official Journal L 154, 21/06/2003)
• Departamento de Gestão Financeira. Serviço Nacional de Saúde – Contas Globais 2000
[Internet]. IGIF; 2002 Sep [cited 2008 Apr 19]. 192p. Available from: http://www.acss.minsaude.pt/Downloads_ACSS/relatorios_contas/Relatorio_Contas_2000.pdf
IntroMedI - class 9 - PQIs
• Departamento de Gestão Financeira. Serviço Nacional de Saúde – Contas Globais 2001
[Internet]. IGIF; 2003 Nov [cited 2008 Apr 19]. 171p. Available from: http://www.acss.minsaude.pt/Downloads_ACSS/relatorios_contas/Relatorio_Contas_2001.pdf
• Departamento de Consolidação e Controlo de Gestão do SNS. Serviço Nacional de Saúde
– Contas Globais 2002 [Internet]. IGIF; 2004 Apr [cited 2008 Apr 19]. 237p. Available from:
http://www.acss.minsaude.pt/Downloads_ACSS/relatorios_contas/Relatorio_Contas_2002.pdf
• Departamento de Consolidação e Controlo de Gestão do SNS. Serviço Nacional de Saúde
– Contas Globais 2003 [Internet]. Lisbon: Instituto de Gestão Informática e Financeira da
Saúde; 2005 Apr [cited 2008 Apr 19]. 223p. Available from: http://www.acss.minsaude.pt/Downloads_ACSS/relatorios_contas/Relatorio_Contas_2003.pdf
• Departamento de Consolidação e Controlo de Gestão do SNS. Serviço Nacional de Saúde
– Contas Globais 2004 [Internet]. Lisbon: Instituto de Gestão Informática e Financeira da
Saúde; 2006 Mar [cited 2008 Apr 19]. 187p. Available from: http://www.acss.minsaude.pt/Downloads_ACSS/relatorios_contas/Relatorio_Contas_2004.pdf
IntroMedI - class 9 - PQIs
Software
• SPSS for Windows, Rel. 15.0.0 2006. Chicago (IL): SPSS Inc.
• Microsoft Frontpage 2003, Rel. 11.5516.8202. USA: Microsoft Corporation.
International Data
•Health, United States, 2007 ;U.S. Department of Health and Human
Services; Centers for Disease Control and Prevention; National Center
for Health Statistics
•World Health Organization. Available from:www.who.int/en
•M. C. Peel, B. L. Finlayson, and T. A. McMahon. Updated world map of
the Koppen-Geiger climate classification
•National Diabetes Statistics. Available from:
diabetes.niddk.nih.gov/dm/pubs/statistics/
•U.S. Census Bureau. Available from:www.census.gov/
IntroMedII - class 9 - PQIs
Protocol developed by:
Ana Catarina Moura, [email protected]
Ana Margarida Oliveira, [email protected]
Bárbara Mendonça, [email protected]
Cláudia Pereira, [email protected]
Hélio Alves, [email protected]
João Miguel Rego, [email protected]
José Pedro Pinto, [email protected]
Maria Francisca Costa, [email protected]
Maria Guiomar Pinheiro, [email protected]
Nelson Couto, [email protected]
Ricardo Reis, [email protected]
José Alberto Silva Freitas, [email protected]
IntroMedI - class 9 - PQIs
Thank you for your time
IntroMedI - class 9 - PQIs
Download