Artigo Original Revista Brasileira de Física Médica.2011;5(1):35-40. A comparative study using both coded excitation and conventional pulses in the evaluation of signal to noise ratio sensitivity and axial resolution in ultrasonic A-mode scan Estudo comparativo entre pulso de excitação codificada e pulso convencional na avaliação da relação sinal-ruído e resolução axial em ultrassom por inspeção modo-A Tiago M. Machado1 and Eduardo T. Costa1,2 1 University of Campinas/Department of Biomedical Engineering, School of Electrical and Computer Engineering, Campinas (SP), Brazil. 2 University of Campinas/Center for Biomedical Engineering, Campinas (SP), Brazil. Abstract In this paper, we have made a comparative study of backscattering of ultrasound conventional and chirp codified pulses. We simulated the interaction of these two different pulses with a computational phantom constructed with variable amplitude and phase scatterers following a Gamma distribution. We have used the echo signal-to-noise ratio (eSNR) metric of the backscattered signals from both coded excitation pulse (CEP) and conventional pulse (CP) for various scenarios, as well as the evaluation of the axial resolution (AR) of the system, using both pulses. The computational phantoms were created with regular and variable scatterers spacing with amplitude and phase variation for three transducers: 2.25, 5.0 and 7.5 MHz center frequencies. The duration of the excitation CEP was 18 μs with chirp frequency bandwidth varying from a multiplying factor of 3.7, 2.0 and 1.2 times the transducer bandwidth, respectively. The pulse compression was performed using matched (MF) and mismatched (MMF) filters. The results for different transducers and phantoms are in accordance to the literature, and they have given an improvement of the SNR for coded pulse above 20 dB (in average) over conventional pulse excitation. In addition, the axial resolution for both codified and conventional pulses are in the same range. For a 2.25 MHz transducer, ARs were 1.33, 1.18 and 1.38 λ for CP, CEP/MF and CEP/MMF filters. Similarly, ARs for 5 MHz for all above three conditions were 1.34, 1.14 and 1.29 λ, and for the 7.5 MHz transducer 1.31, 1.23 and 1.38 λ. Our results have confirmed the increase in gain and very close agreement of the AR. Further research and development should be carried out to use the potentialities of CEP techniques in medical ultrasound imaging equipment. Keywords: signal-to-noise ratio, coded excitation pulse, pulse compression, axial resolution, gamma distribution. Resumo Neste artigo realizou-se um estudo comparativo do retroespalhamento ultrassônico por inspeção modo-A, obtidos pela utilização de pulsos codificados e convencionais. Foi simulada a interação destes dois diferentes pulsos em phantoms computacionais construídos com espalhadores de fase variável e amplitude seguindo a distribuição estatística gama. Mediu-se a relação sinal-ruído (eSNR) para os sinais de eco obtidos tanto por pulso de excitação chirp codificada (CEP) quanto por pulso convencional (CP) em diversos cenários, bem como a resolução axial do sistema (AR) por sua métrica usual, para ambos os pulsos. Os espalhadores foram distribuídos espacialmente de forma regular e variável, variando-se a amplitude e fase para três transdutores operando em 2,25, 5,0 e 7,5 MHz. A duração da excitação chirp utilizada foi de 18 μs, varrendo uma largura de banda de 3,7, 2,0 e 1,2 vezes maior do que a largura de banda de cada transdutor descrito, respectivamente. A compressão de pulso foi realizada usando-se filtros casado (MF) e descasado (MMF). Os resultados para os diferentes transdutores e phantoms estudados apresentaram boa concordância com a literatura e indicam uma melhora da SNR para o CEP em torno de 20 dB (em média) quando comparados com o CP. Além disso, as ARs comparadas tanto para o CEP quanto para o CP estiveram dentro da mesma faixa de valores. Para o transdutor de 2,25 MHz, os valores das ARs foram 1,33, 1,18 e 1,38λ para CP, CEP/MF e CEP/MMF, respectivamente. Semelhantemente, para o transdutor de 5 MHz, nas mesmas condições acima foram 1,34, 1,14 e 1,29λ, e para o transdutor de 7,5 MHz: 1,31, 1,23 e 1,38λ. Os resultados confirmaram o aumento no ganho da SNR e uma concordância próxima em relação à resolução axial. Contudo, novos estudos e pesquisas devem continuar a ser realizados sobre a potencialidade de uso da técnica CEP em sistemas de ultrassom médico. Palavras-chave: razão sinal e ruído, pulso de excitação codificada, compressão do pulso, resolução axial, distribuição gama. Corresponding author: Tiago de Moraes Machado – Departamento de Engenharia Biomédica; Faculdade de Engenharia Elétrica e de Computação da Universidade Estadual de Campinas (DEB/FEEC/UNICAMP) – Rua Alexander Fleming, 181 – Campinas (SP), Brazil – E-mail: [email protected] Associação Brasileira de Física Médica® 35 Machado TM, Costa ET Introduction Ultrasound imaging is one of the most important medical imaging procedures mainly due to the possibility of getting real-time images, be a noninvasive and ionizing radiation free technique and low cost equipment compared to those of other imaging modalities (computed tomography – CT, X-Ray, magnetic resonance image – MRI, etc)1. However, poor image quality, due to the ultrasound wave attenuation frequency-dependence with speckle artifacts, poses a constant challenge to overcome these limitations. Conventional pulse (CP) imaging technique has a peak power limitation imposed by the safety limits for human body to avoid, for instance, cavitations and internal heating2. Thus, adaptation of coded excitation pulse (CEP) from radar and sonar theory has been implemented with success in medical ultrasound. This technique comprises the application of long pulse with frequency modulation as excitation in the transmission, distributing the energy by its frequency components without increasing the peak power limits as would do in the CP. In the reception, the echo signal obtained with CEP is compressed by matched filter, restoring the possibility of detection of medium targets, improving the echo signal to noise ratio (eSNR) and retaining the axial resolution (AR), even though this filter presents sidelobe artifacts adjacent to the mainlobe, which degrade the image quality2,3. As our research group is working on the development of low cost ultrasound equipment and studying different approaches to obtain good quality images, we carried out a comparative study between both CEP and CP techniques interacting on a scattering medium obeying statistical gamma distribution by simulations with computational phantoms in one dimension (A-line simulation), for three different transducer frequencies, highlighting the feasibility and validity of the techniques for several distribution scenarios. Our results are confronted against those of the literature. Theory Linear frequency modulation Linear frequency modulation (chirp) is one among several possible coded excitations and is the more usual, because of its ease generation and unique properties in both time and frequency domains. Mathematically, a common definition is denoted by Eq. 12,4: B 2¹¼ T T ¬ © s(t) = a(t).cos 2p ª f0 t+ t º , f t f 2T » ½¾ 2 2 ® « where: a(t) is the amplitude modulation function; 36 Revista Brasileira de Física Médica.2011;5(1):35-40. (1) f0 is the start frequency; T is the chirp time duration; and B is the bandwidth swept. The core of signal modulation is the distribution of the energy over all frequency components during time T, allowing the increase of the time-bandwidth product (TBP), which is nearly one for mono-frequency signals. Therefore, to get TBP >1 is the key for modulation and pulse compression4. Ultrasonic pulse compression The matched filter is a common filter to perform ultrasound echo pulse compression, because it maximizes the eSNR in the presence of white noise. The complex conjugate of the excitation signal used to excite the transducer is the transfer function in the frequency domain of the matched filter4. The main purpose of this filter is to concentrate the energy distribution performed by the pulse modulation for a single instant, bringing back the TBP to approximately one again. Nevertheless, the transducer bandwidth has a bandpass behavior, which poses limitations on the use of the chirp bandwidth as well in the gain of the eSNR2,4. The disadvantage in the compression process is the generation of adjacent sidelobes around the mainlobe, affecting the resolution and contrast of the image2,4. Therefore, invariably, a new requirement is to apply a weighted tapering of the excitation signal in the transmission and also move the matched filter (MF) to a mismatched condition for the sidelobe reduction below -45 dB, according to Haider et al.5. To achieve this attenuation level, the mismatched filter (MMF) is done by applying a window function on the transfer function of the MF in the reception4. Signal-to-noise ratio and axial resolution The ultrasonic echo detection sensitivity is measured by SNR value. Therefore, eSNR is a good metric to evaluate a pulse-echo system because this relation helps to determine the contrast resolution of the system6,7. The eSNR for CEP can be written as in Eq. 2: eSNR(χ)(dB) = 10.log(TBP) + eSNRCONV (χ) (2) where: eSNRCONV is the known metric for conventional pulse. To evaluate the axial resolution, the common metric is defined as in Eq. 32: AR = ct 2 where: c is the sound speed, t is the pulse length. (3) A comparative study using both coded excitation and conventional pulses in the evaluation of signal to noise ratio sensitivity and axial resolution in ultrasonic A-mode scan Materials and Methods Results All algorithms used in both eSNR and AR test validation were developed using MATLAB® (MathWorks Inc., EUA) software. We present the main aspects of the methodology adopted as follows: Ultrasonicpulse: a Gaussian pulse was generated with a Gaussian envelope modulating a sine wave and we assumed a circular transducer. Amplitude tapering and mismatched filter: the chirp was tapered by 0.15 ratio Tukey window implemented with the MATLAB tukeywin function. For MMF, the -60 dB Chebyshev window was chosen. Computational phantoms: one-dimension structures were built and the scatterers were modeled as complex variables containing magnitude and phase. The phase was distributed between 0 and 2 π, randomly varying. The amplitude obeys the statistical gamma distribution and we used the MATLAB gamrnd function1. Figure 1 shows an example of the arrangement of scatterers in one of the constructed phantoms. A set of ten simulations was performed for several distributions and conditions of scattering: regular, regular plus random, and random. For each condition we varied amplitude and phase in a combined way. Both CP and CEP interacted with the scatters by convolution generating RF A-lines, which were then processed. We used transducers operating at 2.25, 5.0, and 7.5 MHz. The chirps sweeping bandwidths (B) were 3.7, 2.0 and 1.2 greater than the respective transducer bandwidth (65% of transducer center frequency). We then compute AR, SNR average values and their associated standard deviation for each case. The global parameters used were: • Soundspeed(c):1540m/s. • Phantomdimension(axialdirection):60mm. • Relativetransducerbandwidth(BWR):65%. • Timedurationofthechirp(T):18μs. In Figure 2 it is shown the A-line obtained by CEP interaction with the phantom of Figure 1. As one can see, the target information is not resolved and pulse compression mechanism must be applied to solve the problem of resolution. In Figure 3, we present the output profile of both MF and MMF filters on CEP. Applying the filters of Figure 3 to the A-line shown in Figure 2, the target information (position along the transducer axis) is obtained (Figure 4), where the RF signal and its respective envelop are shown. In Tables 1, 2 and 3, we show eSNR values for each transducer after processing the echo signal obtained with CP and CEP after application of both MF and MMF filters for several scenarios. In all tables, we have: the amplitude variation (AV); random phase (RP); σ as the standard deviation. In Table 4 it is shown the AR for the transducers excitation pulses (CP, CEP+MF, CEP+MMF). 0.8 Normalized Amplitude 0.6 0.2 0 -0,2 -0,4 -0,8 0 10 20 30 40 Depth [mm] Matched Filter (MF) Mismatched Filter (MMF) -10 Normalized Amplitude [dB] 0.8 0.6 0.4 60 Pulse compression outputs 0 1 50 Figure 2. Echo signal with unresolved targets due long length of the CEP convoluted with phantom of the Figure 1. Scatterers Amplitude 0.4 -0,6 Computational phantom -20 -30 -40 -50 -60 -70 -80 -90 0.2 0 Echo returned from scatterers 1 -100 0 0 10 20 30 40 Depth [mm] Figure 1. Spatial distribution of the scatterers. 50 60 2 4 6 8 10 Time, [μs] 12 14 16 18 Figure 3. Profile of the pulse compression outputs for 2.25 MHz transducer. Revista Brasileira de Física Médica.2011;5(1):35-40. 37 Machado TM, Costa ET Table 4. AR values obtained for both 2.25, 5.0 and 7.5 MHz transducers (ultrasound wave propagating in water) RF and envelope of A-line echo signal 1 RF signal Envelope 0.8 Spatial resolution [mm and λ] Transducer frequency [MHz] CP CEP+MF CEP+MMF 2.25 (λ=0,7 mm) 0.91 (1.33 λ) 0.80 (1.18 λ) 0.93 (1.38 λ) 5.0 (λ=0,3 mm) 0.41 (1.34 λ) 0.35 (1.14 λ) 0.40 (1.29 λ) 7.5 (λ=0,2 mm) 0.26 (1.31 λ) 0.25 (1.23 λ) 0.28 (1.38 λ) Normalized Amplitude 0.6 0.4 0.2 0 -0,2 -0,4 Discussion -0,6 -0,8 0 0 10 20 30 40 Depth [mm] 50 60 Figure 4. Resolved target of structured phantom of Figure1 after pulse compression applied to signal shown in Figure 2. We show RF signal and its envelope. Table 1. SNR values obtained for the 2.25 MHz transducer Spatial distribution of the scatterers CP eSNR σ (dB) (dB) CEP+MF eSNR σ (dB) (dB) CEP+MMF eSNR σ (dB) (dB) Regular 25.15 1.41 47.52 0.95 45.87 1.06 (AV + RP) Regular + Random 30.85 1.42 46.45 0.77 44.66 0.70 (AV + RP) Random 31.68 0.83 48.16 0.49 46.47 0.51 (AV + RP) Table 2. SNR values obtained for the 5.0 MHz transducer Spatial distribution of the scatterers CP eSNR σ (dB) (dB) CEP+MF eSNR σ (dB) (dB) CEP+MMF eSNR σ (dB) (dB) Regular 26.48 0.89 46.43 0.98 45.88 0.94 (AV + RP) Regular + Random 32.00 1.33 45.76 1.29 45.23 1.29 (AV + RP) Random 31.24 1.37 47.08 0.88 46.58 0.90 (AV + RP) Table 3. SNR values obtained for the 7.5 MHz transducer Spatial distribution of the scatterers CP eSNR σ (dB) (dB) CEP+MF eSNR σ (dB) (dB) CEP+MMF eSNR σ (dB) (dB) Regular 27.09 1.13 46.94 0.73 45.98 0.79 (AV + RP) Regular + Random 31.78 1.29 46.91 1.15 45.87 1.17 (AV + RP) Random 31.40 1.49 47.30 0.76 46.30 0.71 (AV + RP) 38 Revista Brasileira de Física Médica.2011;5(1):35-40. O’Donnell8 and Misaridis4 discuss the potential gain factor of the eSNR, indicating a numerical range between 15 and 20 dB. Misaridis4 also claims that the use of MMF in a medium without attenuation leads to a loss of eSNR in the range of 1 to 2 dB. It is important to note that the application of MMF leads to a slight decrease in eSNR, because it invariably broadens the mainlobe. Moreover, some authors4,7 indicate that the gain factor of the eSNR is given by the TBP. The results summarized in Tables 1, 2 and 3 show good agreement with those obtained in the literature, taking into account that in those situations, tests were mainly focused on B-mode images while in our case we used only A-line mode. In Table 1 we see that the gain obtained with CEP varies between 15.60 to 22.37 dB. When MMF was applied over MF, there was a loss in the eSNR gain between 1.65 and 1.79 dB. The eSNR theoretical gain expected in this case (TBP=97) is 19.85 dB. For data in Table 2, the predicted theoretical gain is 20.68 dB with TBP=117. As one can see, the CEP gain ranges between 13.76 and 19.95 dB and after MMF application, the loss varied from 0.50 to 0.55 dB. In Table 3, the SNR with CEP ranged from 15.13 to 19.85 dB with TBP=105 (eSNR theoretical gain is 20.21 dB). For spatial resolution, we compare the ordinary values for CP with those obtained by CEP+MF and CEP+MMF (pulse compression). According to Behar and Adam2 and Misaridis4, the AR produced by these filters is calculated at -20 dB of the maximum mainlobe. We can notice that, if we only work with CEP+MF, the AR shows better results than after application of the MMF (CEP+MMF). However, in the first case the sidelobes levels were in the dynamic range of the ultrasound system (range between -40 and -50 dB), which is unacceptable. Therefore, after applying MMF over the CEP+MF, the attenuation comes to acceptable levels at the expense of a slight broadening of the mainlobe, but not compromising too much the AR system. Conclusions We have presented a comparative study of the SNR and AR obtained when processing ultrasound A-line echo A comparative study using both coded excitation and conventional pulses in the evaluation of signal to noise ratio sensitivity and axial resolution in ultrasonic A-mode scan signals obtained with conventional and with codified pulse transducer excitation. The present results are in accordance with literature data and have also shown that it is possible to improve SNR with codified pulse, when proper procedures are applied to regain system resolution. These are important results for our research group and shall be used in our ultrasound system development, although further studies are required. References 1. Vivas GC. Estudos de modelos estatísticos utilizados na caracterização de tecidos por ultra-som. [dissertação]. Campinas: Faculdade de Engenharia Elétrica e de Computação, Universidade Estadual de Campinas, 2006. 2. Behar V, Adam D. Parameter optimization of pulse compression in ultrasound imaging systems with coded excitation. Ultrasonics. 2004;42(10):1101-9. 3. Pedersen MH, Misaridis TX, Jensen JA. Clinical evaluation of chirpcoded excitation in medical ultrasound. Ultrasound Med Biol. 2003;29(6):895-905. 4. Misaridis T. Ultrasound imaging using coded signals. [thesis]. Denmark: Technical University of Denmark, 2001. 5. Haider B, Lewin PA, Thomenius KE. Pulse elongation and deconvolution filtering for medical ultrasonic imaging, IEEE Trans Ultrason Ferroelect Freq Contr. 1998;45(1):98-113. 6. Liu J, Kim KS, Insana MF. SNR comparisons of beamforming strategies. IEEE Trans Ultrason Ferroelectr Freq Contr. 2007;54(5):1010-7. 7. Oelze ML. Bandwidth and resolution enhancement through pulse compression. IEEE Trans Ultrason Ferroelectr Freq Contr. 2007;54(4):768-81. 8. O’Donnell M. Coded excitation system for improving the penetration of realtime phased-array imaging systems. IEEE Trans Ultrason Ferroelectr Freq Contr. 1992;39(3):341-51. Revista Brasileira de Física Médica.2011;5(1):35-40. 39
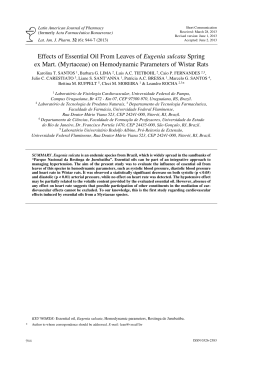
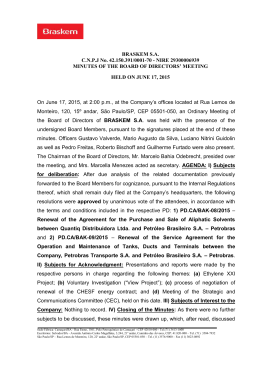
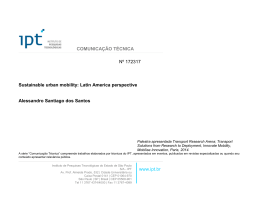
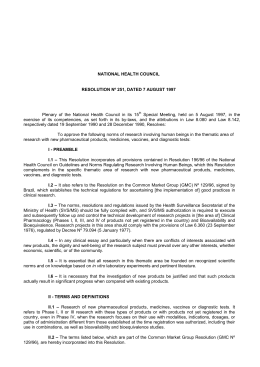
Download