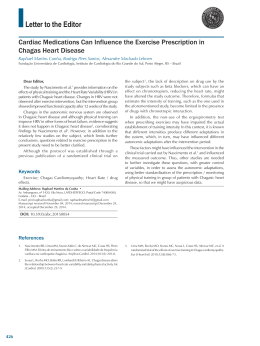
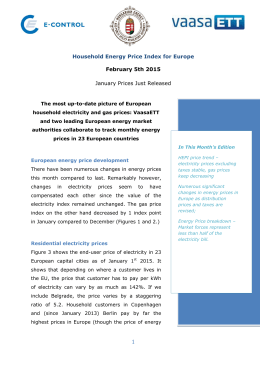
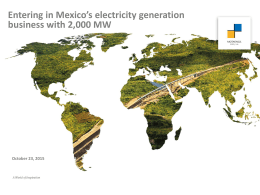
The state of global energy efficiency
1. Global and sectoral energy efficiency trends
1.1 Global trends
1
In 2010, total energy consumption per unit of GDP (primary energy intensity ), measured at purchasing power
2
parity and where 1 is the world average, ranged from 1.8 in the CIS to 0.6 in Europe (Figure 1): energy use per
unit of GDP in the CIS is three times higher than in European countries. Levels in OECD Asia and Latin America
exceed the European level by about 20 percent, while North America stands 50 percent higher but remains
below the world average. India and Other Asia are on a par with the world average, with energy intensity levels
55 percent higher than in Europe. The high energy intensity in the CIS, China and the Middle East is explained
by various factors, including the predominance of energy-intensive industries and low energy prices.
Figure 1: Primary energy intensities by world region (2010)
3.5
at exchange rate
3.0
at ppp
World=1
2.5
2.0
1.5
1.0
0.5
Europe
Latin
America
OECD
Asia
North
America
World
Other
Asia
India
Africa
MiddleEast
China
CIS
0.0
Source: Enerdata
Global energy intensity – or the energy required per unit of GDP – decreased by 1.2 percent/year between
1990 and 2010 (Figure 2), and fell in all regions except the Middle East. The trend is explained by the combined
effect of high energy prices, energy efficiency programs and, more recently, CO₂ abatement policies in OECD
countries, as well as other economic factors, such as the move by economies towards tertiary activities.
The largest reductions were seen in countries or regions with the highest intensity in 1990 (China, CIS, India).
The largest drop in energy intensity since 1990 was achieved in China (-4.6 percent/year), while in the CIS
countries and India the reduction was twice as slow. The sharp reduction seen in China was mainly driven by
the rapid growth in machinery and transport equipment, ie, the branch with the lowest energy intensity, in the
industrial value added. It can also be attributed to a more efficient use of coal and higher energy prices. Aboveaverage reductions were also achieved in North America and Europe (-1.5 percent/year each). Compared with
1
Primary energy intensity measures the total amount of energy required to generate one unit of GDP. GDP is expressed at constant
exchange rate or purchasing power parity (ppp) to remove the impact of inflation and changes in currency rates. Using purchasing power
parity rates instead of exchange rates to convert GDP in the same currency (ie, $) makes it possible to account for differences in general
price levels: it increases the value of GDP in regions with a low cost of living (case of developing countries) and, therefore, decreases their
energy intensities (Figure 1). Definitions of indicators are available in “Sources and methodology” at the end of the report.
2
Definitions of regions are available in “Sources and methodology” at the end of the report.
1
3
the world average, energy productivity in other world regions improved to a lesser extent over the period. In
the Middle East, energy consumption has been growing at a faster pace than GDP; consequently, energy
intensity has increased by 1.1 percent/year since 1990.
The surge in oil prices over the 2004-2008 period accelerated reductions in energy intensity in all regions
except China. The global economic crisis in 2008-2009 induced a net slowdown in the energy intensity
reduction in almost all regions except China and Africa. This poor performance was mainly caused by industry,
a sector in which energy consumption did not decrease at the same pace as the value added due to lower
efficiency.
Figure 2: Trends in primary energy intensity to GDP
3%
1990-2010
2%
1990-2004
2004-2008
2008-2010
1%
%/year
0%
-1%
-2%
-3%
-4%
-5%
Middle-East
OECD
Asia
Latin
America
Africa
World
World
Other
Asia
Europe
North
America
CIS
India
China
-6%
Source: Enerdata
About 80 percent of countries in the world have decreased their energy intensity since 1990 (Figure 3).
Productivity gains in about 30 percent of countries were moderate, since their energy intensity decreased by
less than 1 percent/year, whereas the reduction in about 15 percent of countries (mainly Asian and East
European) took place at the rapid pace of over 3 percent/year. In more than 20 percent of countries, on the
other hand, energy productivity is decreasing (mainly in the Middle East, Africa and Latin America).
Figure 3: Trends in primary energy intensity by country (1990-2010)
3
Energy productivity increase is another way to refer to energy intensity decrease by analogy with labor productivity increase.
2
Source: Enerdata
1.2 Sectoral trends
4
5
At world level, the household-services and industry sectors led the fall in energy intensity between 1990 and
2010, accounting for 40 percent and 30 percent of the overall decrease, respectively (Figure 4). In developed
countries, industry is the driving force behind the fall in primary energy intensity; in OECD Asia it accounted for
the entire reduction. In the Middle East the increase in primary energy intensity is mainly due to the surge in
the consumption of the transformation sector, which is linked to the rapid development of electricity use,
which is almost entirely generated from thermal sources, ie, with conversion losses.
Figure 4: Primary energy intensity by sector (1990/2010)
0.8
Transformation
koe/$2005ppp
0.7
Transport
0.6
Households-services
0.5
Non energy uses
0.4
Industry
0.3
0.2
0.1
Europe
Latin
America
OECD
Asia
North
America
World
Other
Asia
India
Africa
MiddleEast
China
CIS
0.0
Source: Enerdata
Final energy intensity is a better indicator for the assessment of energy efficiency at end-use level, since it
corresponds to the energy consumed per unit of GDP by final consumers for energy uses, excluding
consumption and losses in energy conversion (power plants, refineries, etc.) and non-energy uses.
At world level, primary energy intensity has decreased more slowly than final energy intensity since 1990 (-1.2
percent/year vs. -1.6 percent/year) (Figure 5). Africa is the only region where this is not the case. This trend is
explained by a rise in energy conversion losses, mainly in the power sector. Globally, the share of losses in
energy conversion in primary energy intensity increased from 27 percent in 1990 to 31 percent in 2010. In
India, conversion losses represented 33 percent of energy intensity in 2010, compared with 20 percent in 1990.
On the one hand, the growth in conversion losses can be explained by the rapid development of electricity end
uses and, on the other hand, by the fact that electricity is mainly generated from thermal sources, with 60-70
percent of losses. At world level, around 20 percent of energy productivity gains are counterbalanced by
increasing losses in energy conversion. In India and China that percentage is even higher: soaring electricity
demand led to a sharp rise in conversion losses since most power is generated from coal. In North America and
Europe, primary energy intensity decreased at the same rhythm as final intensity due to the fact that energy
conversion losses decreased over the period. This drop is related to the reduction in thermal power generation,
led by the development of renewables in the power mix (primarily wind energy), the growing efficiency of
thermal power plants (boosted by the spread of gas combined-cycle technologies) and the increasing use of
cogeneration facilities.
4
Including agriculture.
5
Including non-energy uses.
3
Figure 5: Energy intensity trends (1990-2010) (%/year)
2%
Primary intensity
6
Final intensity
1%
%/year
0%
-1%
-2%
-3%
-4%
-5%
MiddleEast
OECD
Asia
Latin
America
Africa
World
World
Other
Asia
Europe
North
America
CIS
India
China
-6%
Source: Enerdata
Electricity consumption per capita varies greatly among the different regions (Figure 6). In North America, it is
five times higher than the world average (and 20 times higher than in India).
Globally, electricity consumption per capita has increased by 40 percent since 1990. With the exception of the
CIS, it rose in all world regions or countries between 1990 and 2010. It increased sharply in most developing
countries and regions. In China, electricity consumption per capita has increased fivefold since 1990, while in
the Middle East and India it was twice as high in 2010 as in 1990. In developed countries, which already had
very high levels, electricity consumption per capita increased to a lesser extent: by just over 10 percent in
North America and around 20 percent in Europe.
At world level, industry’s share of electricity consumption reached 40 percent in 2010. The largest share was in
China, where industry accounts for more than 60 percent of total electricity consumption. In developing
countries that share is generally higher than the world average (>40-60 percent), with the exception of the
Middle East where it is just 20 percent. In OECD Asia and Europe, industry accounted for 35 percent of
electricity consumption in 2010, while it accounted for just 23 percent in North America.
Figure 6: Variation of per capita electricity consumption by sector (1990/2010)
14000
5000
Other
12000
Industry
4000
kWh/cap
10000
kWh/cap
Other
Industry
8000
6000
3000
2000
4000
Africa
India
Other
Asia
World
Latin
America
Europe
China
OECD
Asia
World
North
America
MiddleEast
0
0
CIS
1000
2000
Source: Enerdata
6
Non-energy uses are not included in the final energy intensity.
4
2. Energy efficiency performance in power generation
2.1 Global power generation efficiency
In over half of the countries in the world, the energy efficiency of electricity generation is above 40 percent
(world average), while in about 30 percent of countries energy efficiency is above 50 percent (Figure 7). In
countries with a large share of hydroelectricity in their power generation mix (Canada, Brazil and Norway) the
energy efficiency of electricity generation exceeds 60 percent.
Figure 7: Energy efficiency of total electricity generation (2010) (%)
Source: Enerdata
2.2 Thermal power generation efficiency
At world level, the energy efficiency of thermal power plants has improved by 3 percentage points since 1990,
from 32 percent in 1990 to 35 percent in 2010 (Figure 8). This level is far lower than the average in North
America or Europe (around 40 percent), or the level of the world’s best performer (Spain, with 48 percent).
High energy efficiency levels are also seen in OECD Asia -especially in Japan- and Latin America, mainly thanks
to new gas combined-cycle power plants. On the contrary, the efficiency level in most developing countries
stands below the world average. In China the large share of coal in thermal generation led to a low efficiency
level, despite the improvements that have been achieved since 1990 (5 percentage points). In India the decline
in efficiency is explained by aging coal power plants, although it is counterbalanced by a rise in gas combinedcycle capacities (around 15 percent in 2010). In the CIS, the efficiency of thermal power plants was 20 percent
lower than the world average in 2010.
The energy savings potential is high: if all regions had an efficiency of 45 percent (average of the top 10
countries), fossil fuel consumption for power generation would be reduced by about 30 percent (ie, 700 Mtoe).
5
Figure 8: Efficiency of thermal power plants
45
1990
2000
2010
40
35
%
30
25
20
15
10
5
CIS
India
China
MiddleEast
World
Africa
Other
Asia
Europe
North
America
Latin
America
OECD
Asia
0
Source: Enerdata
The energy efficiency improvement in thermal power generation is closely linked to the spread of gas
7
combined cycle plants since the 2000s (Figure 9). In fact, Europe, North America, OECD Asia and Latin America,
whose energy efficiency of thermal power plants is among the highest in the world, are also the regions with
the largest penetration of combined cycle technologies (about 30 percent of the thermal capacity). Moreover,
those regions also showed the largest increase in the energy efficiency of thermal power generation over the
period 1990-2010. At world level, in 2010 gas combined-cycle plants made up , on average, 19 percent of the
thermal installed capacities ie, a rise of 10 percentage point compared with 2000.
8
Figure 9: Penetration of gas combined-cycle technology and efficiency of thermal power generation (2010)
Efficiency of thermal power plants %
45
OECD Asia
North America
40
Latin America
World
Europe
35
Middle East
30
India
25
20
10%
Africa
15%
20%
25%
% combined cycle
30%
35%
Source: Enerdata
7
The efficiency of gas combined-cycle plants lies within a range of 50-60 percent, compared with 30-40 percent for conventional steam
thermal power plants.
8
Penetration of gas combined-cycle plants in terms of their share in the thermal power capacity.
6
2.3 Power grid efficiency
At world level, the rate of transmission and distribution losses (T&D) was around 9 percent of the distributed
volumes in 2010 (Figure 10). The regions with the most efficient grids are developed regions and Asia,
excluding India, since their losses are below or close to the world level. Other regions suffer losses of more
than 10 percent and, in the case of Latin America and India, over 15 percent and close to 20 percent,
respectively. However, in those regions a substantial part of the losses are in fact non-technical losses due to
unpaid electricity (in India electricity theft and unpaid bills represent up to 20 percent of losses). If all grids
were to perform as well as OECD Asia’s grid, 4 percent of electricity consumption would be saved (ie, 800
TWh).
Globally, the rates of losses are almost stable, but that stability is the result of two opposite trends. On the one
hand, they have been decreasing since 1990 in developed countries due to power grid efficiency improvements
achieved in several ways: the use of low-loss conductors and transformers, the standardization and upgrading
of transmission and distribution voltages, and reactive power control. In North America, the losses amounted
to 6 percent of the distributed volumes in 2010, compared with 10 percent in 1990. In OECD Asia and the EU,
the reduction in T&D losses was smaller. On the other hand, losses have been increasing in developing
countries. In the CIS and the Middle East, they rose from 9 percent to 12 percent in 2010, while they reached
20 percent in India. Latin America also faces a high and growing rate of T&D losses (17 percent in 2010).
Figure 10: Evolution of T&D losses
25
1990
2010
20
%
15
10
5
India
Latin
America
Africa
MiddleEast
CIS
Other
Asia
World
Europe
North
America
China
OECD
Asia
0
Source: Enerdata
7
3. Industry
3.1 Global trends
At world level, the share of electricity in industrial energy consumption increased from 19 percent in 1990 to 24
percent in 2010 (Figure 11). That share is higher in developed countries: in 2010 it was above 30 percent in
Europe and above 25 percent in North America and OECD Asia. In the Middle East, electricity represented just
11 percent of industrial energy consumption in 2010, showing a slight increase since 1990.
Industrial electricity use is on the rise in all world regions. The largest increases were seen in emerging Asian
countries, and primarily in China, where the share of electricity in industrial energy consumption soared from
11 percent in 1990 to 23 percent in 2010. Over the period that share also grew substantially in Europe (+8
points), while in North America and OECD Asia it has remained relatively stable since 1990. At the world level,
the share of electricity in industrial consumption has increased by 5 points since 1990.
Figure 11: Share of electricity in industrial consumption
35
1990
2010
30
25
%
20
15
10
5
MiddleEast
India
CIS
Other
Asia
Latin
America
China
Africa
World
North
America
OECD
Asia
Europe
0
Source: Enerdata
The energy required per unit of value added (industrial intensity) has decreased in all regions except the Middle
East since 1990. As a result of the globalization of industrial activities, energy intensity levels are converging. At
world level, it fell by 1.4 percent/year between 1990 and 2010 (0.5 percent/year between 2000 and 2010).
Industrial energy intensity is lowest in Europe, OECD Asia and Africa, where it stands 40 percent below the
world average (Figure 12). Energy intensity is relatively higher in North America than in Europe and OECD Asia:
it stands just 5 percent below the world average and 65 percent above the European average.
8
Figure 12: Industrial energy intensity
0.40
0.6
1990
2000
2010
0.35
koe/$2005ppp
0.30
0.25
0.20
0.15
0.10
Europe
Africa
OECD
Asia
Latin
America
World
Other
Asia
India
MiddleEast
CIS
China
0.00
North
America
0.05
Source: Enerdata
The sharpest decreases over the period 1990-2010 were seen in countries with the highest levels of industrial
energy intensity (Figure 13). In China, India, the CIS and the United States industrial energy intensity was
reduced by more than 2 percent/year between 1990 and 2010. However, despite large reductions over the
period, China and India still have above-average industrial energy intensity levels: 15 percent higher in the case
of India and 50 percent in the case of China. In the Middle East, industrial energy intensity remains among the
lowest in the world and has decreased moderately since 1990 (0.3 percent/year).
MiddleEast
OECD
Asia
Latin
America
World
Africa
Other
Asia
Europe
CIS
India
North
America
China
The slowdown caused by the global economic crisis in 2009 had a strong impact on industrial energy intensity
trends. In almost all regions, the reduction in industrial energy intensity slowed down significantly: the drop in
energy consumption was lower than the reduction in industrial production. In Europe, for instance, it fell by 2.1
percent/year between 1990 and 2008, compared with 1.1 percent/year over 2008-2010. OECD Asia, North
America and India even posted a reverse trend (for instance, -0.3 percent/year between 1990 and 2008 for
OECD Asia, compared with 4.1 percent/year over 2008-2010). This phenomenon is due to the fact that part of
the industrial energy consumption is not correlated with GDP and remains stable despite the drop in
production.
Figure 13: Industrial energy intensity trends
6%
1990-2010
2008-2010
4%
%/year
2%
0%
-2%
-4%
-6%
Source: Enerdata
9
Industrial cogeneration (CHP) covered around 6.5 percent of industrial electricity consumption in 2010,
compared with around 8 percent in 1990 (Figure 14). This decreasing trend is strongly influenced by the trend
in North America, since in 1990 that region represented more than half of the worldwide electricity production
from industrial CHP and in 2010 one third. A reverse trend was seen in all other regions. In Europe, the share of
cogeneration increased by 9 points between 1990 and 2010, when it reached 17 percent. Following this
increase, the share in Europe is now larger than in North America, where CHP accounted for 15 percent of
industrial consumption in 2010, compared with 18.5 percent in 1990. In OECD Asia, CHP represents just 5
percent, approximately, of industrial consumption, up slightly since 1990. In turn, a sharp rise was seen in
Other Asia, where the share of CHP in industrial consumption increased from 3 percent to 9 percent between
1990 and 2010. In the CIS, the share of CHP is higher (11 percent in 2010) but has developed at a slower pace
since 1990 (by 4 points).
Figure 14: Share of CHP in industrial electricity consumption (1990-2010)
20
18
1990
16
2010
14
%
12
10
8
6
4
2
0
Europe
North
America
CIS
Other Asia
World
OECD Asia
Latin
America
Source: Enerdata
At world level, energy-intensive industries accounted for 55 percent of industrial consumption in 2009, up from
50 percent in 1990 (Figure 15). Steel absorbs about 20 percent of industrial consumption while the nonmetallic minerals (cement, glass, ceramics, etc.) and chemical industries consume around 15 percent each and
the paper industry 5 percent.
The share of energy-intensive industries in industrial consumption is highest in OECD countries, the CIS and
China, and stands below the world average in other developing countries. The large share of energy-intensive
industries in China and the CIS partly explains the previously observed high industrial energy intensity.
However, thanks to the use of more efficient technologies that is not the case in developed regions, which
include the countries with the lowest industrial energy intensity.
Industrial energy intensity trends are influenced by energy productivity improvements in each individual
branch (ie, steel, chemicals, non-metallic minerals), but also by changes in the structure of the industrial value
added. Industrial activities have moved toward less energy-intensive branches (equipment, textiles, etc.), which
lowers energy intensity. In India, a decrease in the share of energy-intensive industries (from over 38 percent in
1990 to 33 percent in 2009) contributed to the increase in the country’s industrial energy productivity, in
addition to energy efficiency improvements. In turn, an increasing share of energy-intensive industries in the
CIS between 1990 and 2009 played its part in limiting the improvements in energy productivity over the period.
10
Figure 15: Share of energy-intensive industries in industrial consumption (1990/2009)
Other
Paper
Non metallic minerals
Chemicals
Steel
Africa
Other
Asia
India
MiddleEast
Latin
America
World
North
America
Europe
OECD
Asia
CIS
China
100%
90%
80%
70%
60%
50%
40%
30%
20%
10%
0%
Source: Enerdata
3.2 Steel industry
The steel industry is the main industrial energy consumer and the largest source of industrial CO 2 emissions: it
represents about 20 percent of global industrial energy consumption and 15 percent of industrial CO 2
emissions from fuel combustion. More than half of the world’s crude steel production is supplied by China,
Japan and the United States.
The countries that showed the greatest reductions in their specific consumption between 1990 and 2009 were
also the countries that made the greatest use of the electric process, since on average this process uses only
9
half the energy required by the most widespread process, ie, the oxygen/blast furnace process (Figure 16).
Figure 16: Trends in the specific energy consumption of the steel industry
10
3%
2%
1%
%/year
0%
-1%
-2%
-3%
-4%
1990-2008
2000-2008
2008-2009
South
Korea
Brazil
Japan
Ukraine
Taiwan
European
Union
Russia
United
States
Turkey
China
-5%
Source: Enerdata
9
According to the International Steel Industry Institute, two times less energy is required to produce one ton of steel using the electric
process than when using the oxygen/blast furnace process (0.2-0.3 tep/t compared with 0.5-0.7 tep/t).
10
1992-2009 for Ukraine. No data for India.
11
The countries with the largest share of electric steel (Europe, US, South Korea, Taiwan, Turkey) have the lowest
energy consumption per ton of steel produced (Figure 17).
However, the spread of the electric process is not the only factor impacting energy efficiency in the steel
industry. For the same share of steel produced using the electric process, specific consumption is 1.5 to 2 times
higher in Russia, China, Ukraine and Brazil than in Japan. This lower energy performance can be explained by
several factors, such as the use of outdated processes like open-hearth furnaces in Russia and Ukraine, or the
use of small-sized plants and low quality ore in China. Accordingly, the potential for further energy and CO₂
savings is still high. The energy consumption of the steel industry could be reduced by 40 percent if the main
producing countries were to have the same energy efficiency as that achieved by the world’s best performer
through its current mix of processes; about 60 percent of those energy savings would take place in China.
Figure 17: Specific energy consumption of the steel industry
0.8
Russia
0.7
Ukraine
0.6
Brazil
toe/t
0.5
China
Japan
0.4
United States
European Union
South Korea
0.3
Taiwan
0.2
Turkey
0.1
0
0%
20%
40%
60%
80%
100%
% electric steel
Source: Enerdata
3.3 Chemical industry
The chemical industry is the second largest industrial energy consumer, accounting for just over 14 percent of
11
total industrial energy consumption . In the United States the chemical industry is even the largest energyintensive branch, with 25 percent of industrial consumption in 2009.
In 2009 China had, by far, the highest energy consumption per unit of value added among the world’s main
producers of chemical products (Figure 18). Its energy intensity is high, since coal-based production in China
requires much more energy than natural gas-based production in other countries.
The largest decrease in the energy intensity of chemicals since 1990 (-6.8 percent/year) was seen in Mexico.
Other countries such as South Korea, Germany, France and the UK also saw substantial decreases in their
energy intensity, whereas Iran and Brazil posted a growth. Since the chemical industry is highly diverse it is
difficult to link these energy intensity reductions to the spread of more efficient processes, in particular, and to
genuine energy efficiency improvements; indeed, part of the energy intensity reduction may be explained by a
change in the product mix, for instance from heavy chemicals to light chemicals.
11
Excluding chemical feedstocks
12
Figure 18: Energy intensity of the chemical industry
12
0.6
koe/$2005ppp
0.5
0.4
0.3
1990
2000
0.2
2009
0.1
Italy
Spain
UK
France
Mexico
Brazil
Iran
Korea
Japan
Germany
USA
China
0.0
Source: Enerdata
3.4 Cement industry
The non-metallic minerals industry (cement, glass, ceramics, etc.) is the third largest industrial energy user,
accounting for just about 13 percent of industrial energy consumption. The cement industry absorbs most of
the energy consumption of the non-metallic minerals industry and, on average, represents around 70-80
percent of the branch’s consumption. China alone accounts for half of the energy consumption for cement
production.
The energy efficiency of cement production strongly depends on the process used to produce the clinker, the
13
main component in cement manufacturing (dry or wet), and the type of kiln. Indeed, the dry process avoids
the need for water evaporation and is much less energy intensive than the wet process; whereas vertical shaft
kilns are the most energy intensive, dry kilns with pre-heaters and pre-calciners are the most efficient (Figure
19).
Figure 19: Unit consumption of clinker by technology/process used
Technology/process
Unit consumption
Vertical shaft kilns
5 GJ/t (0.119 toe/t)
Wet kilns
5.8-6.7 GJ/t (0.139-0.160 toe/t)
Long dry process
4.5 GJ/t (0.107 toe/t)
Dry kiln (four stages pre-heater)
3.2 GJ/t (0.076 toe/t)
Dry kiln (six stages pre-heater 2.8 GJ/t (0.067 toe/t)
and pre-calciner)
Source: International Energy Agency
12
13
2008 data for China and Iran
Cement is produced by grinding clinker and additives such as ashes; on average, cement is made of between 80-90 percent of clinker.
13
The most efficient technologies used to produce cement are found in Japan, Mexico and in European countries,
whereas the technologies used in Asian and North American countries are less efficient. Vertical shaft kilns are
used for almost half of the cement production in China since, while being more energy intensive, that
technology is better suited to the smaller factories found in the country.
Between 1990 and 2008, the average energy consumption per ton of cement produced decreased in the main
producing countries, except in France, the US, Turkey, Russia and Mexico (Figure 20). This can mainly be
explained by the shift from wet- to dry-process cement kilns and the replacement of older dry kilns by new
ones using pre-heaters and pre-calciners. The largest drop in the specific energy consumption of the cement
industry was seen in China, where the replacement of small cement plants by larger facilities has led to a 5
percent/year decrease since 1990. Although significant progress has been recorded in China, the country
continues to have the highest energy savings potential. Indeed, if the main producing countries were to have
the same energy efficiency as the world’s best performer through the same clinker-to-cement ratio, the specific
energy consumption of the cement industry would drop by 20 percent, with China accounting for about 80
percent of those savings. For almost all countries, energy consumption per ton of cement produced increased
strongly in 2009 since part of the energy is consumed independently of the quantity of cement produced (ie,
fixed size of boilers).
Figure 20: Unit consumption trends in the cement industry for the main producers
6%
1990-2008
14
2000-2008
4%
%/year
2%
0%
-2%
-4%
-6%
Turkey
USA
Italy
Mexico
Japan
France
Brazil
Korea
Germany
Spain
UK
China
-8%
Source: Enerdata
3.5 Paper industry
The paper industry accounts for about 5 percent of global industrial energy consumption. The consumption is
mainly used to produce steam. The world’s largest producers are the United States, with more than 30 percent
of the branch’s consumption, Japan, the European Union, China and Canada.
The efficiency of the paper industry is primarily related to the technical age of production facilities. In the
United States, aging pulp and paper mills lead to a high specific consumption that exceeds the average level of
the main producers. Other factors are the share of imported pulp, the process used to manufacture the pulp
and the share of recycled paper. The specific energy consumption is higher in pulp exporting countries. In
Canada, the widespread use of mechanical pulping, ie, the process with the highest specific energy
consumption per ton produced, combined with aging facilities, leads to a high ratio. The mechanical process is
14
Energy intensity trends for the United States, Japan, South Korea and Mexico. No data for India. 2008-2009 trends not provided on the
graph due to scale issues.
14
used for less than 10 percent of the world’s pulp production. A high use of recycled paper can also improve the
industry’s specific consumption. South Korea and Turkey are among the main producers with the lowest energy
consumption per ton of paper.
Between 1990 and 2009, the energy consumption per ton of paper decreased in all the world’s main producing
countries except Brazil and Canada (Figure 21). The largest reductions were seen in China and Mexico, where
specific consumption has decreased by about 4 percent/year since 1990. In countries with lower unit
consumptions, smaller reductions took place: 1.9 percent/year for Turkey and less than 1 percent/year for
other countries. The reduction in the Unites States, which is the largest producer and has a high unit
consumption, was just 0.8 percent/year.
Figure 21: Trends in energy consumption per ton of paper
1990
2000
2009
Japan
Mexico
South
Korea
1.2
1.0
toe/t
0.8
0.6
0.4
0.2
Turkey
China
European
Union
United
States
Canada
Brazil
0.0
Source: Enerdata
3.6 Aluminum industry
Aluminum production is made up of primary aluminum production and recycling. Primary aluminum
production is 20 times more energy intensive than recycling. The world’s main producers are China, Russia,
North America, Australia and Brazil, which together account for about 60 percent of global production.
The primary production of aluminum requires large amounts of electricity for aluminum smelting, while
alumina plants use steam energy, with combined heat and power production in modern facilities. Two main
types of smelters are used: the Hall-Héroult system with pre-baked anodes (10 percent of the market), with a
relatively high energy efficiency (electricity consumption ranging between 13–16.5 MWh/t); and the older
Søderberg cell with in-situ baked electrodes (70 percent of the market), with an electricity consumption
ranging from 15 MWh/t to 18 MWh/t.
The specific electricity consumption for primary aluminum production varies on a narrow range among world
regions, from 14.5 MWh/t to 16 MWh/t in 2010 (Figure 22). In Africa, where new facilities have been
implemented, it is lower, at 6 percent below the world average. The highest rates are seen in Europe and South
America. Accordingly, the electricity savings potential in primary aluminum production is limited.
At world level, specific electricity consumption for primary aluminum production has decreased by 4 percent
since 1990. That downward trend was seen in all world regions except Europe, with sharp drops in North
America and Africa.
15
Figure 22: Specific electricity consumption for primary aluminum
17.0
1990
2000
2010
16.5
MWh/t
16.0
15.5
15.0
14.5
14.0
13.5
Europe
South
America
World
Asia
North
America
Pacific
Africa
Source: International Aluminium Institute (2010)
According to the International Energy Agency, since the current best practice, ie, that of Hall-Héroult
electrolysis cells, is estimated at 12.9–13 MWh/t of aluminum, the global potential for electricity efficiency
improvements using the current technology is estimated at around 15 percent. Over time, electrolysis process
designs using aluminum chloride or carbothermic processes could become the most energy-efficient way to
produce primary aluminum.
4. Conclusion
Over the last 20 years significant progress has been recorded in terms of energy efficiency. At world level, the
energy required per unit of GDP (the energy intensity) has been decreasing by 1.2 percent per year since 1990.
Improvements were achieved in all regions, with the largest reductions found in the regions with the highest
energy intensities (China, CIS and India). Industry and power generation accounted for almost half of that
reduction (about 30 percent and 15 percent, respectively).
At world level, the energy efficiency of thermal power plants has improved by 3 percentage points since 1990
thanks to a widespread switch to gas combined-cycle technology. However, strong disparities still exist
between developed countries, where thermal power plants are very efficient (up to 48 percent for Spain, the
best performer), and developing countries, where efficiency is low due to aging plants and the large share of
coal in thermal generation (particularly in China and India). Power grid efficiency improvements led to a
reduction in the rate of transmission and distribution losses in developed countries thanks to the use of lowloss conductors and transformers, the standardization and upgrading of transmission and distribution voltages,
and reactive power control. However, those technologies are still poorly implemented in developing countries.
The energy required per unit of industrial value added has been decreasing in all regions; as a result of the
globalization of industrial activities, energy intensity levels are converging. The global economic crisis in 2009
had a strong impact on industrial energy intensity trends, especially in developed countries, since energyintensive industries were severely hit.
In the steel industry, which is the main industrial energy consumer, significant progress has been made over
the last 20 years thanks to the spread of the electric process. However, the main producers still use outdated
processes like open-hearth furnaces (Russia and Ukraine) or small-sized plants and low quality ore (China).
16
In the chemical industry, the energy consumption per unit of value added decreased in all main producing
countries. However, since the chemical industry is highly diverse, it is difficult to link these energy intensity
reductions to the spread of more efficient processes, in particular, and to genuine energy efficiency
improvements.
The spread of dry processes and kilns using pre-heaters and pre-calciners led to reductions in the average
energy consumption per ton of cement (specific energy consumption) in several large producing countries. The
sharpest drop in specific energy consumption was achieved in China, thanks to the replacement of small
cement plants by larger facilities.
Nevertheless, a great deal still remains to be done, as shown by the significant energy savings potentials
identified in this study. In the power sector, the improvement of power generation efficiency could reduce
fossil fuel consumption for power generation by 30 percent, and power grid efficiency improvements could
reduce global electricity consumption by 4 percent. In industry, the energy efficiency improvement potential is
40 percent in the case of steel, 20 percent for cement and 15 percent for aluminum; potentials in the chemical
and paper industries are also high.
17
Download