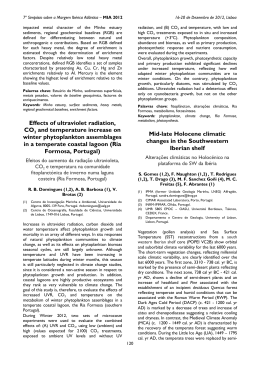
LIMNOLOGY
and
OCEANOGRAPHY: METHODS
Limnol. Oceanogr.: Methods 5, 2007, 363–370
© 2007, by the American Society of Limnology and Oceanography, Inc.
HPLC determination of phytoplankton and microphytobenthos
pigments: comparing resolution and sensitivity of a C18 and a C8
method
Carlos R. Mendes1, Paulo Cartaxana2, and Vanda Brotas1
1
Instituto de Oceanografia, Faculdade de Ciências, Universidade de Lisboa, Campo Grande 1749-016 Lisboa, Portugal;
Laboratório Marítimo da Guia, IMAR, Estrada do Guincho, 2750-374 Cascais, Portugal
2
Abstract
The effectiveness of two HPLC methods (a monomeric C18 column with a high ion strength solvent gradient
and a monomeric C8 column with a pyridine-containing mobile phase) in the separation, identification, and
quantification of pigments are compared, using phytoplankton, microphytobenthos, and algal cultures.
Although the two studied methods showed good analytical resolution, the C18 method presents a higher discrimination for several carotenoid pigments. On the other hand, the C8 method allows the separation of chlorophylls c1, c2, and Mg-2, 4-divinyl phaeoporphyrin a5 monomethyl ester as well as the pair chlorophyll a/divinyl
Chl a. The C18 method had a shorter elution program and a lower solvent flow rate, making it cheaper and faster
than the C8 method. Furthermore, the C18 method showed significantly lower detection and quantification limits, a particularly important advantage for pigments present in trace amounts in both phytoplankton and
microphytobenthic samples. Differences in the sensitivity of the two studied methods were due mainly to differences in flow rate, with significantly higher peak areas for slower flow rates. No method is ideal for all pigments and sample types and the choice of method should be made in accordance with the objective of each
study, taking into consideration the advantages and disadvantages identified for each method.
Since the 1980s, high-performance liquid chromatography
(HPLC) has been used commonly for the separation, identification, and quantification of chlorophylls and carotenoids in
phytoplankton (Mantoura and Llewellyn 1983; Wright et al.
1991; Zapata et al. 2000). The importance of HPLC-based phytoplankton pigment analysis in oceanographic studies has led
to the publication of a comprehensive monograph in which
both modern analytical methods and their application to biological oceanography were reviewed exhaustively (Jeffrey et al.
1997b). The photosynthetic pigments detected and quantified
by HPLC can supply information about the biomass, taxonomy, and physiological state of microalgae (Letelier et al.
1993; Schlüter et al. 2000; Rodríguez et al. 2002; Zapata et al.
2004; Latasa 2007). The widespread use of remote sensing to
study oceanic primary production has led to an increase in
papers where HPLC analyses are used to calibrate satellite ocean
color measurements in terms of both biomass and phytoplankton groups (Dandonneau et al. 2004; Alvain et al. 2005).
Corresponding Author: [email protected]
Acknowledgments
This work was founded by FCT (Fundação para a Ciência e
Tecnologia, Portugal) through projects INTAGUS
(POCTI/MAR/58022/2004) and HABCOL (POCTI/MAR/60086/2004).
HPLC also has been applied, although to a lesser extent, to
microphytobenthic pigment analysis (Klein and Riaux-Gobin
1991; Brotas and Plante-Cuny 1998; Cartaxana et al. 2006). In
the case of microphytobenthos, a complex pool of pigments
and degraded forms coexist which originate from autochthonous microphytobenthos populations, allochthonous plant
material, grazing, and diagenic processes (Cariou-Le Gall and
Blanchard 1995; Brotas and Plante-Cuny 1998; Cartaxana et
al. 2003). Therefore, the separation and quantification of pigments and their degraded forms is particularly complex in sediment samples. For microphytobenthos, the use of optical
techniques, such as PAM (Pulse Amplitude Modulated) fluorescence and spectroradiometry, has pushed the need to validate optical data with HPLC (Jesus et al. 2006).
HPLC methods described in the literature differ in resolution, sensitivity, and rapidity on the basis of the type of column (stationary phase) and solvent gradient (mobile phase)
used. Up to now, different columns have been tested, including octadecylsilica (ODS) C18 and octylsilica (OS) C8 columns,
with different diameters, lengths, particle sizes, and different
degrees of effectiveness in the resolution of key pigments
(Kraay et al. 1992; Schmid and Stich 1995; Rodríguez et al.
1998; Zapata et al. 2000). In fact, the comparison of the different existing HPLC methods is still a subject of discussion.
363
Mendes et al.
HPLC methods for pigment analysis
An important aspect is the sensitivity of the methods (detection limit), essential in the analysis of algal samples with low
biomass. The various methods yield different results regarding
the detection of minor pigments which might be essential for
chemotaxonomic purposes.
The main objective of this study was to compare the resolution and sensitivity of two HPLC methods in the separation
and quantification of chlorophylls, carotenoids, and degradation products: a method based on a monomeric C18 column
and a mobile phase composed of methanol, acetonitrile, and
ethyl acetate (Kraay et al. 1992), and a method using a
monomeric C8 column and a pyridine-containing mobile
phase (Zapata et al. 2000). For simplicity, these two methodological approaches will be referred as the C18 and C8 methods.
Methods were tested using a wide variety of sample types:
phytoplankton, microphytobenthos, and algal cultures.
Materials and procedures
Phytoplankton samples—Seawater samples were obtained from
different regions of the Portuguese coast: near Figueira da Foz
(40°04’N, 09°52’W), Aveiro (40°18’N, 09°00’W), Nazaré (39°34’N,
9°43′W) and Cascais (38°41’N, 09°25′W). Water samples (5 L)
were filtered onto a Whatman GF/F filter (nominal pore size 0.7
μm and 47 mm diameter). The filters were kept frozen at –80°C
before extraction. Photosynthetic pigments were extracted with 5
mL of 95% cold-buffered methanol (2% ammonium acetate) for
30 min at –20°C, in the dark. Samples were sonicated (Bransonic,
model 1210) for 30 s at the beginning of the extraction period.
The samples were centrifuged at 1100 g for 5 min, at 4°C. Extracts
were filtered (Fluoropore PTFE filter membranes, 0.2 μm pore
size) and immediately injected in the HPLC.
Microphytobenthic samples—Sediment samples were collected in mudflats of the Tagus estuary (38°44’N, 09°09’W) at
low tide using contact corers (Honeywill et al. 2002). The sediment disc (0–2 mm) was wrapped in foil and stored in liquid
nitrogen. In the laboratory, samples were transferred to –80°C
and later freeze-dried. A sub-sample of approximately 0.2 g of
freeze-dried sediment was extracted with 2 mL of 95% coldbuffered methanol (2% ammonium acetate) for 15 min at
–20°C, in the dark. Samples were sonicated (Bransonic, model
1210) for 30 s at the beginning of the extraction period.
Extracts were filtered (Fluoropore PTFE filter membranes, 0.2
μm pore size) and immediately injected in the HPLC.
Algal cultures—Pigments were extracted from exponentially
growing cultures of a variety of marine algal species that were
selected for the diversity in their pigment composition. Phy-
toplankton cultures isolated from the Tagus estuary and adjacent coastal ocean were obtained from the Institute of
Oceanography (IO) Algae Collection (ALISU), University of
Lisbon. The cultures are listed with their designation indicated
in parentheses: (1) Coelastrum reticulatum (IO 41-01), (2) Emiliania huxleyi (IO 30-01), (3) Rhodomonas sp. (IO 55-01), (4)
Cylindrotheca closterium (IO 19-01), and (5) Scrippsiella trochoidea (IO 14-01). All cultures except Coelastrum reticulatum
were grown on f/2 enrichment seawater medium (Guillard
and Ryther 1962) with a salinity of 28. Coelastrum reticulatum
was grown on BB medium (Bold’s Basal Medium) as described
by Nichols and Bold (1965). The cultures were grown at 15.5°C
in glass Erlenmeyer flasks exposed to ca. 30 μmol photons m–2
s–1. Of each culture, 10 mL were filtered onto 25 mm Whatman GF/F filters (nominal pore size 0.7 μm). The filters were
frozen immediately at –80°C and later extracted with 4 mL of
95% cold-buffered methanol (2% ammonium acetate) for 30
min at –20°C, in the dark. Samples were sonicated (Bransonic,
model 1210) for 30 s at the beginning of the extraction period.
Extracts were centrifuged at 1100 g for 5 min, at 4°C, filtered
(Fluoropore PTFE filter membranes, 0.2 μm pore size), and
immediately injected in the HPLC.
HPLC pigment analysis—Pigment extracts were analyzed
using a Shimadzu HPLC comprised of a solvent delivery module (LC-10ADVP) with system controller (SCL-10AVP), a photodiode array (SPD-M10ADVP), and a fluorescence detector
(RF-10AXL). The chromatographic separation of pigments was
achieved using two methods: a method using a monomeric
ODS C18 column (Kraay et al. 1992) and a method using a
monomeric OS C8 column (Zapata et al. 2000). The characteristics of the different columns used are shown in Table 1. The
solvent gradient used with the C18 method followed Kraay et
al. (1992) adapted by Brotas and Plante-Cuny (1996) with a
flow rate of 0.6 mL min–1, an injection volume of 100 μL, and
a run duration of 35 min. The solvent gradient used with the
C8 method followed Zapata et al. (2000) with a flow rate of 1
mL min–1, an injection volume of 100 μL, and a run duration
of 40 min. Details on gradient profiles and mobile phase compositions are shown in Table 2. Each sample was diluted in
10% water (HPLC-grade), to prevent distortion of early eluting
peaks (Zapata and Garrido 1991).
Pigments were identified from absorbance spectra and
retention times and concentrations calculated from the signals in the photodiode array detector or fluorescence detector
(Ex. 430 nm; Em. 670 nm). Calibration of the HPLC peaks was
performed using commercial standards, namely, Chl a, Chl b,
Table 1. Characteristics of the chromatographic columns used in this study.
Columns
Supelcosil LC-18
Symmetry C8
Bonded phase
Dimensions
(mm)
Pore size
(Å)
Particle size
(μm)
Surface area
(m2 g–1)
Carbon load
(%)
Monomeric octadecylsilica
Monomeric octylsilica
250 × 4.6
150 × 4.6
100
100
5
3.5
170
337
11
12.27
364
Mendes et al.
HPLC methods for pigment analysis
Table 2. Gradient profiles and mobile phase compositions employed with the two HPLC methods (C18 and C8 method).
C8 method
C18 method
Solvent
Time (min)
A
Methanol:water*
(85:15 v/v)
%
B
Acetonitrile:water
(90:10 v/v)
%
C
Ethyl acetate
0
2
7
17
21
28.5
29.5
30.5
35
60
0
0
0
0
0
0
60
60
40
100
80
50
30
30
100
40
40
0
0
20
50
70
70
0
0
0
Time (min)
A
Methanol:acetonitrile:aqueous pyridine†
(50:25:25 v/v/v)
%
B
Methanol:acetonitrile:acetone
(20:60:20 v/v/v)
%
0
20
26
38
40
100
60
5
5
100
0
40
95
95
0
%
*Buffered with 0.5 M ammonium acetate (final concentration)
†The aqueous pyridine solution (0.25 M) was adjusted to pH 5.0 with acetic acid addition
and β, β-carotene standards from Sigma, Chl c2, Chl c3, peridinin, 19’-butanoyloxyfucoxanthin, fucoxanthin, 19’-hexanoyloxyfucoxanthin, neoxanthin, prasinoxanthin, violaxanthin,
diadinoxanthin,
antheraxanthin,
alloxanthin,
diatoxanthin, lutein, zeaxanthin, crocoxanthin, divinyl Chl a,
chlorophyllide a, pheophorbide a, and pheophytin a standards from DHI (Institute for Water and Environment). The
absorbance spectra of other algal pigments and their elution
order were compared with literature data (Mantoura and
Llewellyn 1983; Jeffrey et al. 1997a; Brotas and Plante-Cuny
1998; Brotas and Plante-Cuny 2003; Méléder et al. 2003). Resolution (Rs) between a peak and the preceding one was calculated (for critical pigment pairs) using the following equation:
Rs = 2(Rt2 – Rt1)/W, where Rt2 and Rt1 are the retention times
of two adjacent peaks, and W is the sum of peak widths at
baseline. Calibration curves were established for each pigment
standard and the pigment response factor (fp, mg.(mAU.s)–1)
derived from the calibration slope as expressed by the equation: fp = ΔWp/ΔAp, where Ap is the peak area and Wp is the
weight of pigment injected. Limits of detection (LOD) and
quantification (LOQ) were calculated as the amount of pigment
(in nanograms) resulting in a signal-to-noise ratio (SNR) of
three and ten, respectively, as described by Hooker et al. (2005).
The SNR, as used in this study, was the signal amplitude (or
peak height) divided by the observed noise (characterized
using a 2 × standard deviation formulation) at the same wavelength from which the pigment signal was determined.
Assessment
Chromatographic resolution—The separation of chlorophylls
and carotenoid pigments by the two studied methods yielded
satisfactory results in phytoplankton, microphytobenthic, and
culture samples. A total of 37 pigments were detected in the
samples analyzed: 25 carotenoids and 12 chloropigments
(Table 3). A comparison of the results obtained with the two
methods shows differences in the elution times of individual
pigments (Table 3) and several inversions in elution order
(Figs. 1, 2, 3), as mentioned in Zapata et al. (2000). This is the
case for the pigment pairs lutein (peak 26)/zeaxanthin (peak
27), neofucoxanthin (peak 18)/diadinoxanthin (peak 20), and
Chl b (peak 29)/crocoxanthin (peak 30). In the C8 method,
19’-hexanoyloxyfucoxanthin (peak 12) elutes after neoxanthin (peak 13), prasinoxanthin (peak 15), and violaxanthin
(peak 16), whereas it elutes before this set of pigments with
the C18 column.
For the C8 method, in phytoplankton and/or culture samples, violaxanthin (peak 16) co-eluted or partially co-eluted
with 19’-hexanoyloxyfucoxanthin (peak 12; Figs. 1B, 3B; Rs <
0.8), and prasinoxanthin (peak 15) with an unknown
carotenoid (peak 17; Fig. 1B; Rs = 0.85); in microphytoben-
365
Mendes et al.
HPLC methods for pigment analysis
Table 3. List of pigments obtained for the C18 and C8 columns, with the corresponding retention times and absorption maxima.
Number
Pigment
Column C18 Column C8
1
2
3
4
5
6
7
8
9
10
11
12
13
14
15
16
17
18
19
20
21
22
23
24
25
26
27
28
29
30
31
32
33
34
35
36
37
Peridininol
Chlorophyll c3
Chlorophyllide a
MgDVP
Chlorophyll c2
Chlorophyll c1
Fucoxanthinol
Unknown peridinin derivative
Peridinin
19’-Butanoyloxyfucoxanthin
Fucoxanthin
19’-Hexanoyloxyfucoxanthin
Neoxanthin
Unknown fucoxanthin derivative
Prasinoxanthin
Violaxanthin
Unknown carotenoid λ444 nm
Neofucoxanthin
Unknown violaxanthin derivative
Diadinoxanthin
Diadinochrome
Antheraxanthin
Alloxanthin
Unknown carotenoid λ443 nm
Diatoxanthin
Lutein
Zeaxanthin
Pheophorbide a*
Chlorophyll b
Crocoxanthin
Chlorophyll a allomer
Chlorophyll a
Chlorophyll a epimer
Pheophytin a1
Pheophytin a2
β, ε - Carotene
β, β - Carotene
λmax (nm)
Retention time (min)
7.23
7.58
7.91
–
8.69
–
9.90
10.67
10.88
11.26
12.38
12.76
12.91
13.05
13.51
13.81
14.21
14.60
15.15
15.45
16.53
16.60
16.84
17.41
17.77
18.24
18.71
19.86
22.97
24.80
25.30
25.82
26.21
28.20
29.70
29.71
30.00
6.19
7.30
9.88
10.43
10.68
11.70
–
14.82
13.77
17.31
18.18
20.91
19.10
17.09
19.67
20.54
19.56
23.90
23.51
23.06
24.77
24.13
24.85
25.71
25.51
26.21
26.04
15.93
30.20
29.92
31.36
31.72
32.21
34.00
35.60
35.48
35.77
Column C18
Column C8
474
454, 586
431, 665
–
445, 581, 630
–
446, 470
474
475
445, 470
448, 465
445, 470
414, 438, 466
449, 469
454
417, 441, 471
424, 444, 467
442, 462
414, 441, 471
424, 448, 477
408, 432, 458
424, 448, 476
429, 454, 483
422, 443, 472
430, 454, 482
425, 447, 475
430, 454, 481
410, 506, 536, 609, 666
457, 596, 646
426, 446, 475
428, 613, 662
430, 617, 663
430, 615, 663
409, 504, 535, 609, 666
410, 507, 536, 609, 667
426, 449, 476
430, 454, 481
475
458, 591
429, 664
438, 576, 627
452, 584, 633
447, 581, 632
–
474
475
447, 469
450, 464
447, 469
414, 437, 466
449, 472
455
417, 440, 470
424, 444, 468
443, 458
414, 441, 469
424, 446, 476
408, 430, 458
423, 446, 475
429, 453, 482
419, 443, 471
428, 453, 481
425, 447, 475
428, 453, 479
409, 507, 536, 608, 665
462, 599, 648
429, 447, 477
428, 619, 663
431, 617, 663
429, 617, 663
409, 506, 535, 608, 665
409, 506, 535, 608, 665
427, 447, 475
429, 454, 480
*Retention time of pheophorbide a correspond to the pigment standard.
thos, diatoxanthin (peak 25) partially co-eluted with an
unknown carotenoid (peak 24; Figure 2B; Rs = 0.91). This
introduces an error on pigment quantification, although in
cases of partial co-elution modern software generally allows
satisfactory resolution through peak analysis tools. Pigment
pairs lutein (peak 26)/zeaxanthin (peak 27) and β, ε-carotene
(peak 36)/β, β-carotene (peak 37) were completely resolved
with both studied methods (Rs > 1). In general, carotenoid resolution was higher with the C18 method as some pigments
partially co-eluted with the C8 method.
366
One of the major differences between the two methods
was the capacity of the C8 column to discriminate chlorophylls c1, c2 and MgDVP (peaks 6, 5, and 4, respectively; Rs >
1.1), whereas these chloropigments eluted as a single peak
with the C18 column (Figs. 1, 2, 3). Nevertheless, in microphytobenthic samples, fucoxanthinol (peak 7), a degradation
product of fucoxanthin, partially co-eluted with Chl c1 in the
C8 method (Rs = 0.64; Fig. 2B); with the C18 method, the
fucoxanthinol peak was clearly separated from the chlorophylls c1 + c2 + MgDVP peak (Rs = 2.17; Fig. 2A). Although not
Mendes et al.
HPLC methods for pigment analysis
Fig. 1. Example of HPLC chromatogram of absorbance (continuous line;
Fig. 3. HPLC chromatograms of absorbance (continuous line; 440 nm)
440 nm) and fluorescence (broken line; Ex. 430 nm; Em. 670 nm)
obtained for a phytoplankton sample with the C18 (A) and C8 (B) HPLC
method. Pigments are labeled according to Table 3.
and fluorescence (broken line; Ex. 430 nm; Em. 670 nm) obtained for a
mixture of Scrippsiella trochoidea, Rhodomonas sp., Cylindrotheca
closterium, Coelastrum reticulatum and Emiliania huxleyi with the C18 (A)
and C8 (B) HPLC method. Pigments are labeled according to Table 3.
Fig. 2. Example of HPLC chromatogram of absorbance (continuous line;
440 nm) and fluorescence (broken line; Ex. 430 nm; Em. 670 nm) obtained
for an intertidal muddy sediment sample (microphytobenthos) with the
C18 (A) and C8 (B) HPLC method. Pigments are labeled according to Table 3.
present in the samples analyzed, divinyl Chl a standard
injected in some of the runs was not separated from Chl a
with the C18 method, whereas the C8 method clearly separated both pigments (Rs = 1.22). Therefore, the C8 method is
essential for the separation of the latter pigments as well as of
polar chlorophylls c.
Several pheophorbide and pheophythin a pigments were
observed. Some of these Chl breakdown products, particularly
abundant in microphytobenthic samples, co-eluted with
carotenoids. In the C18 method, different pheophorbide a
peaks in natural samples co-eluted with diadinoxanthin (peak
20) and lutein (peak 26), and pheophythin a2 (peak 35) with
β, β-carotene (peak 37; Fig. 2A). In the C8 method, pheophorbide a (peak 28) co-eluted with fucoxanthin (peak 11; Fig. 2B).
As pheopigments a do not absorb at the wavelength range
where carotenoids are usually detected, they do not interfere
in their quantification. However, the absorbance of
carotenoids around 410 nm interferes with the quantification
of pheopigments a with the diode array detector. Absorbance
of pheopigments a at 666 nm was usually too small for identification and quantification. For this reason, the double
detection with the diode array and fluorescence detector
(approximately one order of magnitude more sensitive) is
essential for the quantification of pheophorbide and pheophythin a pigments.
367
Mendes et al.
Chromatographic sensitivity—The C18 method had significantly lower limits of detection (LOD) and quantification (LOQ)
than the C8 method. For the C18 method, LODs for zeaxanthin,
prasinoxanthin and diadinoxanthin were 0.08, 0.16, and 0.08
ng of pigment, respectively. The corresponding values for the C8
method were significantly higher: 0.15, 0.21, 0.17 ng of pigment, respectively. Low concentrations of zeaxanthin (0.45 ng
100 μL–1), prasinoxanthin (0.57 ng 100 μL–1), and diadinoxanthin (0.54 ng 100 μL–1) standards were detected with both methods (above LOD), but were not quantifiable with the C8 method
(below LOQ values of 0.50, 0.70 and 0.55 ng of pigment, respectively; Fig. 4). In natural samples, for example, β, β-carotene
(peak 37), detected in trace amounts with the C18 method in
phytoplankton samples was not detected with the C8 method
(below LOD, Fig. 1). Pigment response factors (fp, ng.(mAU.s)–1)
were lower for the C18 method for all pigments analyzed, as
shown by the steeper slopes of the calibration curves obtained
with commercially available standards of zeaxanthin, prasinoxanthin, and diadinoxanthin (Fig. 5).
Differences in the sensitivity of the two studied methods
could be related to the characteristics of both the stationary
and mobile phases. Therefore, the four combinations of column type and elution gradient were tested for pigment sensitivity. Pigment areas were significantly lower when the C8 elution gradient was used and were independent of the type of
column, as shown for fucoxanthin, alloxanthin, and zeaxanthin (Fig. 6). Hence, we can conclude that differences in sensitivity are due to the characteristics of the mobile phase.
These could be either the extinction coefficients of the pigments in the mobile phase solvents or in the flow rate used
(0.6 mL min–1 and 1.0 mL min–1 for the C18 and C8 methods,
respectively). Extinction coefficients of the pigments in the
solvent mixture at the time of elution were similar for both
the C18 and C8 methods, and could not explain the differences
in method sensitivity. For example, Chl a extinction coeffi-
Fig. 4. HPLC chromatogram of absorbance at 440 nm obtained for a
mixture of pigment standards (zeaxanthin, prasinoxanthin, and diadinoxanthin) in trace amounts for the C18 method. Inset: Corresponding chromatogram with the C8 method. [Zeaxanthin; peak 27] = 0.45 ng 100
μL–1; [Prasinoxanthin; peak 15] = 0.57 ng 100 μL–1; [Diadinoxanthin; peak
20] = 0.54 ng 100 μL–1. Pigments are labeled according to Table 3.
HPLC methods for pigment analysis
Fig. 5. Comparison of calibration curves of zeaxanthin (Zea), prasinoxanthin (Pras), and diadinoxanthin (DD) obtained with the C18 and C8
HPLC method.
cients at 664.3 nm were 85.9 and 82.4 L g–1 cm–1 for the C18
and C8 solvent mixture, respectively, at the time of elution.
Applying flow rates of 0.6 and 1 mL min–1 to both C18 and C8
methods clearly demonstrates that this parameter affects peak
area and hence sensitivity with significantly higher peak areas
when a slower flow rate was used, as shown for fucoxanthin
(Fig. 7). Lower flow rates elute pigments in smaller volumes of
solvent, and absorbance therefore increases. When flow rates
slower than 1.0 mL min–1 are applied to the C8 method, nonpolar pigments such as β-carotene do not elute within the 40
min run. This is a significant disadvantage of C8 method.
Discussion
An HPLC method can be evaluated on the basis of several
criteria, such as resolution, sensitivity, and rapidity. Pig-
Fig. 6. Peak areas (mean ± standard deviation, n = 3) of fucoxanthin
(0.342 mg L–1), alloxanthin (0.312 mg L–1), and zeaxanthin (0.281 mg L–1)
standards for A. C18 column + C18 elution gradient; B. C8 column + C18 elution gradient; C. C18 column + C8 elution gradient; and D. C8 column +
C8 elution gradient.
368
Mendes et al.
HPLC methods for pigment analysis
The C18 method has a shorter elution program and a lower
solvent flow rate, making it cheaper and faster than the C8
method. Furthermore, the C18 method had higher carotenoid
resolution and significantly lower detection limits than the C8
method. The C18 method is, therefore, more suitable for the
detection of pigments present in trace amounts in both phytoplankton and microphytobenthic samples. Van Leeuwe et
al. (2006) stresses the importance of optimized extraction and
automation on the reproducibility and sensitivity of the HPLC
method, particularly when low microalgae biomass is present.
Our results prove that method flow rate is crucial also.
Comments and recommendations
Fig. 7. Influence of flow rate on fucoxanthin standard (0.342 mg L–1)
peak area for the C18 and C8 method (mean ± standard deviation, n = 3).
ments should be resolved in a single run, detected in trace
amounts, and the analysis time should be the shortest possible to allow numerous samples to be processed. Although a
high number of HPLC methods for pigment analysis have
been published over the past years, no method is ideal for all
pigments and all sample types (phytoplankton and microphytobenthos).
The C8 method allowed the discrimination of Chl a and
divinyl Chl a, as well as chlorophylls c1, c2 and MgDVP, pigments that co-eluted in the C18 method. This result can be
explained in terms of column polarity, considering that its
increased value in the C8 column allows the discrimination of
compounds with small differences in molecular polarity
(Rodríguez et al. 1998). Furthermore, the pyridinium ion, as
mobile phase additive, is a more hydrophobic ion pair reagent
than ammonium acetate, increasing the retention of acidic
chlorophylls (Zapata et al. 2000). The advantage of the C8
method to resolve chlorophylls c1 and c2 is not so effective in
microphytobenthic samples, because fucoxanthinol, a common degradation product of fucoxanthin, interferes with the
quantification of Chl c1. The C8 method should be chosen if a
separation between chlorophylls c1, c2, and MgDVP or Chl a
and divinyl Chl a is necessary.
Kraay et al. (1992) reported a modification of the Wright et
al. (1991) method using a high carbon load C18 column and a
high ion strength solvent capable of separating chlorophylls c1
and c2. In our study, using a C18 monomeric column and the
same solvent gradient, separation of chlorophylls c1 and c2 was
not obtained. Rodriguez et al. (1998) reported the use of four
different monomeric C18 columns, one of them with a higher
carbon load than the one originally used by Kraay et al. (1992)
and did not achieve the separation of the chlorophylls c1 and
c2. Therefore, separation of both chlorophylls c in Kraay et al.
(1992) is probably not related to the high carbon load of the
C18 column as the authors state, but instead is related to the
fact that the RSil column originally employed was in fact a
polymeric or partially polymeric (intermediate) column.
Each method must be chosen to meet the objectives of each
kind of study, taking into consideration the advantages and
disadvantages of the methods, as well as the type of sample
(phytoplankton or microphytobenthos). The C18 method is
cheaper, has faster sample throughput and higher sensitivity.
Hence, the C18 method should be used in the absence of polar
chlorophylls c and divinyl Chl a or, in case the separation of
these pigments is not essential, as is the case with microphytobenthos samples. On the other hand, if your target is to
characterize phytoplankton assemblages in natural samples
with unknown pigment composition, the C8 method would
be preferred thanks to its good overall resolution and capacity
to resolve polar chlorophylls c and the pair Chl a/divinyl Chl
a, not separated by the C18 method. The lower sensitivity of
the C8 method may constitute a major disadvantage in
oceanic samples with low pigment concentrations and might
require different sample preparation, including larger filtration volumes, smaller filters, and smaller extraction volumes.
Future work regarding the C8 method might include adjustment of the elution conditions (gradient and elution time) to
allow the use of a lower solvent flow rate.
References
Alvain, S., C. Moulin, Y. Dandonneau, and F. M. Bréon. 2005.
Remote sensing of phytoplankton groups in case 1 waters
from global SeaWiFS imagery. Deep-Sea Res. I. 52:1989–2004.
Brotas, V., and M. R. Plante-Cuny. 1996. Identification et
quantification
des
pigments
chlorophylliens
et
caroténoïdes des sédiments marins: un protocole d’analyse
par HPLC. Oceanol. Acta. 19:623–634.
———, and M. R. Plante-Cuny. 1998. Spatial and temporal
patterns of microphytobenthic taxa of estuarine tidal flats
in the Tagus Estuary (Portugal) using pigment analysis by
HPLC. Mar. Ecol. Prog. Ser. 171:43–5.
———, and M. R. Plante-Cuny. 2003. The use of HPLC pigment analysis to study microphytobenthos communities.
Acta Oecol. 24:109–115.
Cariou-Le Gall, V., and G. F. Blanchard. 1995. Monthly HPLC
measurements of pigment concentration from an intertidal
muddy sediment of Marennes-Oléron Bay, France. Mar.
Ecol. Prog. Ser. 121:171–179.
369
Mendes et al.
HPLC methods for pigment analysis
Cartaxana, P., B. Jesus, and V. Brotas. 2003. Pheophorbide and
pheophytin a-like pigments as useful markers for intertidal
microphytobenthos grazing by Hydrobia ulvae. Estuar.
Coast. Shelf Sci. 58:293–297.
———, C. R. Mendes, M. A. van Leeuwe, and V. Brotas. 2006.
Comparative study on microphytobenthic pigments of
muddy and sandy intertidal sediments of the Tagus estuary.
Estuar. Coast. Shelf Sci. 66:225–230.
Dandonneau, Y., P. Deschamps, J. Nicolas, H. Loisel, J. Blanchot,
Y. Montel, F. Thieuleux, and G. Bécu. 2004. Seasonal and
interannual variability of ocean color and composition of
phytoplankton communities in the North Atlantic, equatorial Pacific and South Pacific. Deep-Sea Res. II. 51:303–318.
Guillard, R. R. L., and J. H. Ryther. 1962. Studies of marine
planktonic diatoms. I. Cyclotella nana Hustedt and Detonula
confervacea (Cleve) Gran. Can. J. Microbiol. 8:229–239.
Honeywill, C., D. M. Paterson, and S. E. Hagerthey. 2002.
Determination of microphytobenthic biomass using pulseamplitude modulated minimum fluorescence. Eur. J. Phycol. 37:485–492.
Hooker, S. B., L. Van Heukelem, C. S. Thomas, H. Claustre, J.
Ras, R. Barlow, H. Sessions, L. Schlüter, J. Perl, C. Trees, V.
Stuart, E. Head, L. Clementson, J. Fishwick, C. Llewellyn
and J. Aiken. 2005. The Second SeaWiFS HPLC Analysis
Round-Robin Experiment (SeaHARRE-2). NASA TM-2005212785, Washington.
Jeffrey, S. W., R. F. C. Mantoura, and T. Bjørnland. 1997a. Data
for the identification of 47 key phytoplankton pigments, p.
447–559. In S. W. Jeffrey, R. F. C. Mantoura and S. W.
Wright [eds.], Phytoplankton pigments in oceanography:
guidelines to modern methods. UNESCO, Paris.
———, R. F. C. Mantoura, and S. W. Wright. 1997b. Phytoplankton pigments in oceanography: guidelines to modern
methods. UNESCO, Paris.
Jesus, B., C. R. Mendes, V. Brotas, and D. M. Paterson. 2006.
Effect of sediment type on microphytobenthos vertical distribution: Modelling the productive biomass and improving ground truth measurements. J. Exp. Mar. Biol. Ecol.
332:60–74.
Klein, B., and C. Riaux-Gobin. 1991. Algal pigment diversity
in coastal sediments from Kerguelen (sub-Antarctic Islands)
reflecting local dominance of green algae, euglenoids and
diatoms. Polar Biol. 11:439–448.
Kraay, G. W., M. Zapata, and M. J. W. Veldhuis. 1992. Separation of chlorophylls c1, c2, and c3 of marine phytoplankton
by reversed-phase-C18-High-Performance Liquid Chromatography. J. Phycol. 28:708–712.
Latasa, M. 2007. Improving estimations of phytoplankton
class abundances using CHEMTAX. Mar. Ecol. Prog. Ser.
329:13–21.
Letelier, R. M., R. R. Bidigare, D. V. Hebel, M. Ondrusek, C. D.
Winn, and D. M. Karl. 1993. Temporal variability of phytoplankton community structure based on pigment analysis.
Limnol. Oceanogr. 38:1420–1437.
370
Mantoura, R. F. C., and C. A. Llewellyn. 1983. The rapid determination of algal chlorophyll and carotenoid pigments and
their breakdown products in natural waters by reversephase High-Performance Liquid Chromatography. Anal.
Chim. Acta 151:297–314.
Méléder, V., L. Barillé, P. Launeau, V. Carrére, and Y. Rincé.
2003. Spectrometric constraint in analysis of benthic
diatom biomass using monospecific cultures. Remote Sens.
Environ. 88:386–400.
Nichols, H. W., and H. C. Bold. 1965. Trichosarcina polymorpha
gen. et sp. nov. J. Phycol. 1:34–38.
Rodríguez, F., M. Zapata, and J. L. Garrido. 1998. High performance liquid chromatographic separation of chlorophyll c forms from marine phytoplankton on octylsilica
bonded phases. Chromatographia 48:677–680.
———, M. Varela, and M. Zapata. 2002. Phytoplankton assemblages in the Gerlache and Bransfield Straits (Antarctic
Peninsula) determined by light microscopy and CHEMTAX
analysis of HPLC data. Deep-Sea Res. II. 49:723–747.
Schlüter, L., F. Møhlenberg, H. Havskum, and S. Larsen. 2000.
The use of phytoplankton pigments for identifying and
quantifying phytoplankton groups in coastal areas: testing
the influence of light and nutrients on pigment/chlorophyll a ratios. Mar. Ecol. Prog. Ser. 192:49–63.
Schmid, H., and H. B. Stich. 1995. HPLC-analysis of algal pigments: comparison of columns, column properties and eluents. J. Appl. Phycol. 7:487–494.
van Leeuwe, M. A., L. A. Villerius, J. Roggeveld, R. J. W. Visser,
and J. Stefels. 2006. An optimized method for automated
analysis of algal pigments by HPLC. Mar. Chem.
102:267–275.
Wright, S. W., S. W. Jeffrey, R. F. C. Mantoura, C. A. Llewellyn,
T. Bjørnland, D. Repeta, and N. Welschmeyer. 1991.
Improved HPLC method for the analysis of chlorophylls
and carotenoids from marine phytoplankton. Mar. Ecol.
Prog. Ser. 77:183–196.
Zapata, M., and J. L. Garrido. 1991. Influence of injection conditions in reversed-phase high-performance liquid chromatography of chlorophylls and carotenoids. Chromatographia 31:589–594.
———, F. Rodríguez, and J. L. Garrido. 2000. Separation of
chlorophylls and carotenoids from marine phytoplankton:
a new HPLC method using a reversed phase C8 column and
pyridine-containing mobile phases. Mar. Ecol. Prog. Ser.
195:29–45.
———, S. W. Jeffrey, S. W. Wright, F. Rodríguez, J. L. Garrido,
and L. Clementson. 2004. Photosynthetic pigments in 37
species (65 strains) of Haptophyta: implications for
oceanography and chemotaxonomy. Mar. Ecol. Prog. Ser.
270:83–102.
Submitted 31 March 2007
Revised 26 July 2007
Accepted 28 July 2007
Download