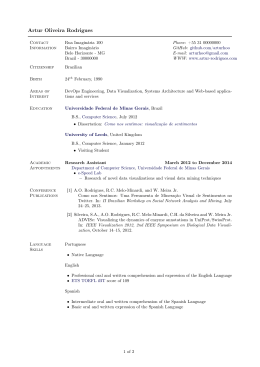
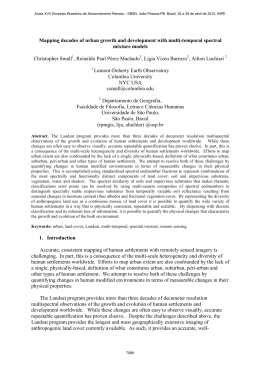
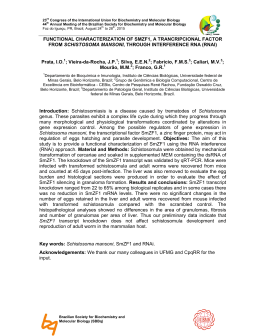
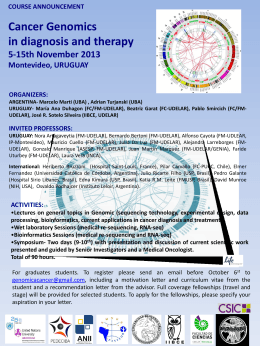
próximo
artigo
97 834
Anais XI SBSR, Belo Horizonte, Brasil, 05 - 10 abril 2003, INPE, p. 1575-1586.
CALCULATION OF PRIMARY PRODUCTION FROM REMOTELY-SENSED
OCEAN COLOR DATA: SE BRAZIL, SW ATLANTIC
1,2
MILTON KAMPEL
2
SALVADOR AIRTON GAETA
1
INPE - Instituto Nacional de Pesquisas Espaciais
Caixa Postal 515 - 12201-970 - São José dos Campos - SP, Brasil
[email protected]
2
IOUSP - Instituto Oceanográfico da Universidade de São Paulo
Praça do Oceanográfico, 191 - 05508-900 - São Paulo - SP, Brasil
[email protected]
Abstract. This paper presents a first effort in transforming a map of surface chlorophyll, obtained from an
ocean color image (SeaWiFS) into a map of primary production of the SE Brazilian coastal region, SW Atlantic.
The main steps involved in the computation of the daily primary production integrated in the water column are
summarized. In situ primary production experiments provided the biomass-normalized photosynthesis
parameters α B , P B used in the calculation. Principal limitations are that the SeaWiFS sensor sample only the
m
surface of the ocean, neither can see through clouds.
Keywords: primary production, ocean color.
1. Introduction
Characterizing the spatial and temporal patterns of phytoplankton biomass and primary
production is a central topic in biological oceanography. The topic is important not only for
commercial applications and management of marine resources but also for questions
regarding the global carbon cycle. Determination of the time-varying flux of carbon (and
associated elements) in the world ocean is a focused objective of programs such as the
International Geosphere Biosphere Program (IGBP, 1988) and its Joint Global Ocean Flux
Study (JGOFS, 1988).
To quantify the primary production of the world oceans and to characterize its variability
at the global scale, frequent and well-distributed measurements over large sites, basins, and
oceans are required. This is practically impossible with traditional in situ methods,
particularly in offshore regions. Observations of the ocean by satellites make this global scale
approach possible if radiometric measurements can be interpreted quantitatively in terms of
primary production (Berthelot and Deschamps, 1994).
The fundamental difficulty in estimating primary production from satellite-derived
chlorophyll is that an indicator of standing stock (phytoplankton pigment), with dimensions of
[ML-3 ], is being used to calculate a rate (carbon fixation), with dimensions of [ML–3 T-1 ]
(Balch and Byrne, 1994). It could be argued that the rate of carbon fixation by any particular
phytoplankton biomass might be dependent on factors other than the amount of pigment
present. For example, nutrient limitation, depth distribution of biomass in the water column
and temperature might all be expected to influence the rate of primary production (Joint and
Groom, 2000). However, it appears that these processes have little influence on production
estimates and a great deal of progress has been made in estimating primary production from
pigment concentration alone (Behrenfeld and Falkowski, 1997).
Models that have been applied to satellite remote sensing have basically been of two
types – empirical and semi-analytical (Behrenfeld et al., 1998). Those that estimate primary
production from standing stock are essentially empirical. They me be influenced by local
1575
Anais XI SBSR, Belo Horizonte, Brasil, 05 - 10 abril 2003, INPE, p. 1575 - 1586.
conditions, and it is possible that they can only be applied to those oceanic provinces for
which the algorithms were originally derived; that is, these relationships may prove to be
geographically specific. In an attempt to obtain globally applicable models, more complex
algorithms have been developed which utilize knowledge of physiological response and light
absorption properties. Both empirical and semi-analytical models have advantages and
disadvantages. Joint and Groom (2000) present a good comparison between these two types
of algorithms. Sathyendranath and Platt (1994a,b) and Falkowski et al. (1998) give a critical
revision of many existing algorithms.
This paper presents a first effort in transforming a map of surface chlorophyll, obtained
from an ocean color image (SeaWiFS) into a map of primary production of the SE Brazilian
coastal region, SW Atlantic. The main steps involved in computation of daily primary
production integrated in the water column are summarized. In situ primary production
experiments provided the biomass-normalized photosynthesis parameters αB , PmB used in the
calculation.
2. Study Area
The Southeast coast of Brazil is the most populated and economically developed region of the
country. The study area considered here is inserted in the Southeastern continental shelf
between Sao Tome Cape (22ºS), in the State of Rio de Janeiro, and Ilha de Sao Sebastiao
(24ºS), in the State of Sao Paulo (Figure 1). The narrower part of this continental shelf is
located close to Cape Frio (50km). With the exception of a few big islands and many small
islands, the bathymetry of this oceanic region is relatively smooth with the isobaths parallel to
the coastline. The shelf break is located at depths of 120m to 180m (Zembrusky, 1979).
Even being situated in a tropical region, the SE continental shelf is located far enough
from the Equator to has the geostrophy being dominant over movements with sub-inertial
frequency scales (temporal scales ranging from 2 and 15 days) and seasonal (1 year) (Castro
Filho, 1996).
The oceanic flow in the region is perturbed by the presence of an abrupt change of the
coastline orientation at Cape Frio, inducing topographic steering of the flow and regular
mesoscale activity such as eddies and meanders (Lima et al., 1999). The Tropical Water
(S>36; T>20º), formed at low latitudes, is observed at the surface layers (Miranda, 1982). The
Brazil Current (BC), is a western boundary current flowing Southwestwards over the
continental slope, all year round. The presence of meanders and mesoscale eddies can induce
large perturbation in the main flow (Stech et al., 1996; Kampel et al., 2000).
The Coastal Water (33<S<33.7 and 4º<T<21o C) dominates most of the continental shelf
area. However, intense and frequent upwelling events occur in the same region predominantly
from September through April. These events are associated with the intrusion of the South
Atlantic Central Water (34.5<S<36; 6<T<20o C) (Kampel et al., 1997). The upwelling plumes
are considered as one of the most significant mechanisms responsible for the biological
production enhancement in the region.
1576
Anais XI SBSR, Belo Horizonte, Brasil, 05 - 10 abril 2003, INPE, p. 1575 - 1586.
Figure 1 – Study area in the SE Brazilian coast, SW Atlantic. The oceanographic stations
occupied during the DEPROAS Project are also shown. Mesoscala 1 cruise station’s (summer
2001) are in red. Isobaths are in meters. (Background: SPOT 5 Vegetation image).
3. Data and Methods
SeaWiFS Data
The Chlorophyll a map of the region of interest was derived from data collected by the Seaviewing Wide Field-of-view Sensor (SeaWiFS). This data was recorded in HRPT and Store
modes (Level 0) by INPE’s station with a nominal 1.1 km resolution at nadir. The raw data
was delayed decrypted and converted to a Level-1A file in Hierarchical Data Format (HDF)
using the routines Swl10 and the SeaDAS software (Fu et al., 1998), both distributed by the
SeaWiFS Project (NASA). The digital processing involved: a) Level-1A image ingestion and
generation of Level-2 geophysical products (chlorophyll a - Chl, photosynthetic active
radiation - PAR, and diffuse vertical attenuation coefficient – K490 ) by applying atmospheric
corrections and bio-optical algorithms to the SeaWiFS data. Accurate atmospheric correction
requires adjustments for O3 and O2 absorption as well as atmospheric pressure variations
described in various sensitivity analyses (Gordon and Wang, 1994). Daily atmospheric data
were acquired from NASA GSFC’s Distributed Active Archive Center. Algorithms for cloud
and land masking were applied following McClain et al. (1995). The algorithm used to
calculate chlorophyll concentrations was de OC2, as recommended by O’Reilly et al. (1998).
b) Mapping to cylindrical lat/lon projection and geographic gridding; c) Digital image
enhancement to increase the contrast and color slicing (logarithmic scale) to facilitate
interpretation of the pigment fields present; d) Chl satellite estimates were scaled to a
maximum of 32 mg.m-3 .
In situ Data
Hydrographic, nutrients, biomass and phytoplankton primary production data were collected
during an oceanographic cruise (DEPROAS Mesoescala 1), from 5-15 of February 2001. A
section perpendicular to the coast, in front of Cape Frio, was repeated 4 times with the
1577
Anais XI SBSR, Belo Horizonte, Brasil, 05 - 10 abril 2003, INPE, p. 1575 - 1586.
objective of observe the water masses variation in the continental shelf and slope regions in a
quasi-synoptic mode (Figure 1). 35 stations were occupied and sampled up to 10 depth levels
(0, 5, 10, 25, 50, 75, 100, 125, 150, 200m).
Hydrographic data were reduced following the UNESCO (1988) standard procedures.
The nutrients NO2 , NO3 , NH4 , Si(OH)4 , and PO4 were analyzed following the methodologies
described in Grasshoff (1983), Strickland and Parsons (1972) and Paranhos (1996),
respectively. The chlorophyll estimates follows the methodology indicated in Holm-Hansen et
al. (1965), Shoaf and Lium (1976), Stramski and Morel (1990), and Welschmeyer (1994). In
situ simulated 14 C primary production experiments were conducted as suggested by Teixeira
(1972). The Light – Photosynthesis curves were adjusted as suggested by Platt et al. (1980).
The diffuse attenuation vertical coefficient was estimated with the use of a natural
fluorescence profiler (PNF-300, Biospherical Instruments Inc.) and/or a Secchi disk. Surface
irradiance was measured with the PNF-300 surface unit or estimated using the spectral solar
irradiance model of Gregg and Carder (1990). The base of the euphotic layer was considered
as the 1% light level depth.
Calculation of Primary Production from SeaWiFS Ocean Color Data
The standard model used in this paper was that for a vertically homogeneous, non-spectral
model. This has the following solution for the daily water column production PZ,T:
PZ ,T
BPmB D
=
f ( I *m ),
K
(1)
where B is the pigment biomass (indexed as the satellite chlorophyll retrieval), D is the
daylength, PmB is the assimilation number, K is the diffuse attenuation coefficient for
downwelling light and f ( I *m ) is a function of the dimensionless irradiance whose form is
determined once the mathematical representation of the light – saturation curve has been
selected. The quantity I *m is given by I *m = I 0m I K where I 0m is the local irradiance at
noon, and I K is the photoadaptation parameter. Equation (1) is so basic to the field that is
referred as the canonical form of daily, water column production. It is robust no matter what
the choice of the light – saturation curve. It is often written in the compact form
PZ ,T = Af ( I *m ) ,
(2)
where the scale factor A = BPmB D / K .
For convenience of application, f ( I *m ) is usually replaced, since it may be a slowlyconverging series, by a low-order polynomial (Platt et al., 1990; Platt and Sathyendranath,
1993). Thus
f
( I *m ) =
N
∑ Ω x ( I*m ) x ,
(3)
x=1
1578
Anais XI SBSR, Belo Horizonte, Brasil, 05 - 10 abril 2003, INPE, p. 1575 - 1586.
where the weights Ω x are determined by the least-squares fitting to the numerical solution of
equation (2). The magnitudes of the weights will depend on the number of terms N in the
polynomial series and on the range of I *m for which they are computed. Usually, it is
sufficient to take N = 5 and compute for a range 0 < I *m > 20. The weights need to be
determined only once. They are given in Table 1 for the case when the light – saturation
curve is represented by the exponential equation (Platt et al., 1980),
P B ( I ) = PmB (1 − exp( − α B I PmB )).
(4)
where P B is the primary production normalized to biomass (chlorophyll a - B), I is the
irradiance, α B is the initial slope, and PmB is the assimilation number.
Table 1 – The weights Ω x for the polynomial approximation to f ( I *m ) computed for
the range 0.2 ≤ I *m ≥ 20.
x
Ωx
1
2
3
4
5
6.1035 x 10⁻¹
-8.9251 x 10⁻²
8.1477 x 10⁻³
-3.7427 x 10⁻⁴
6.6103 x 10⁻⁶
4. Results and Discussion
The SeaWiFS image (Figure 2) shows the oligotrophic Tropical Water of the Brazil Current
(blue tones) with low levels of chlorophyll, in contrast to the continental shelf Coastal Water
(green to red tones), with relatively higher pigment concentrations. It is also possible to note
in this image the presence of plumes of wind induced upwelling events associated with the
Cape Frio, Sao Tome Cape and Vitoria (more to the North) cores at the coast.
1579
Anais XI SBSR, Belo Horizonte, Brasil, 05 - 10 abril 2003, INPE, p. 1575 - 1586.
Figure 2 – SeaWiFS Chl image acquired on February 15, 2001, 14:43 GMT. Lower pigment
values are in blue tones, typical of the Brazil Current oligotrophic waters. Relatively higher
chlorophyll concentrations (mg.m-3 ), in green to red shades, are found over the continental
shelf, associated with wind induced upwelling plumes, continental runoff and the possible
presence of more coloured dissolved organic matter. Clouds are in black
Satellite pigment estimates were compared to in situ data collected during an
oceanographic cruise of the DEPROAS Project (summer 2001) (Kampel and Gaeta, 2002).
The results (not shown) are in good agreement at this point of development of the work. In
this sense, no correction was applied to the Chl image.
In situ primary production experiments provided the biomass-normalized photosynthesis
parameters α B , PmB used in the calculation.
Figure 3 presents a map of the photosynthetic active radiation (PAR) obtained from the
SeaWiFS data. The algorithm estimates daily (i.e., 24-hour averaged) PAR reaching the
ocean surface. PAR is defined as the quantum energy flux from the Sun in the spectral
range 400-700 nm. It is expressed in Einstein.m-2.day-1. The applied PAR model uses
plane-parallel theory and assumes that the effects of clouds and clear atmosphere can be
de-coupled. The planetary atmosphere is therefore modeled as a clear sky atmosphere
positioned above a cloud layer. This approach was shown to be valid by Frouin and
Chertock (1992). The great strength of such a de-coupled model resides in its simplicity.
It is unnecessary to distinguish between clear and cloudy regions within a pixel, and this
dismisses the need for often-arbitrary assumptions about cloudiness distribution.
1580
Anais XI SBSR, Belo Horizonte, Brasil, 05 - 10 abril 2003, INPE, p. 1575 - 1586.
Figure 3 – Photosynthetic Active Radiation – PAR (E.m-2 .d-1 ) estimated with the use of
SeaWiFS data for February 15, 2001. Almost all the area is very homogeneous. Continent is
in white.
The histogram on Figure 4 contains the PAR values taken from the map shown on
Figure 3. The mean value of 59.75 E.m-2.d-1 (std 2.88) was considered representative of
the majority of the region, for the day when the SeaWiFS image was acquired.
Figures 5 presents the diffuse attenuation coefficient map (K490) obtained from the
SeaWiFS data. Attenuation is markedly stronger in areas closer to the shore or under the
influence of the upwelling plumes. Lower values of K490 are found in the area dominated
by the Brazil Current clear waters. The histogram containing the K490 values taken from
Figure 5 is shown on Figure 6. The mean value of 0.058m -1 was than used in the primary
production map computation.
Finally, Figure 7 shows the resulted daily integrated on the water column primary
production map, considering an approach for a vertically homogeneous, non-spectral
model. The oligotrophic waters of the Brazil Current are shown in blue tones, with lower
values of primary production. Closer to the coast and associated to the upwelling plumes,
the values of primary production are relatively higher (>80 mgC.mgChl-1.m -2.d-1). A
cyclonic eddy centered on 22.15ºS-40.5ºW, in front of Sao Tome Cape, could be better
noted in this map of primary production, than in the chlorophyll map (Figure 2).
Similarly, a relative maximum value of biological productivity centered on 23.5ºS43.3ºW, approximately, south of the Guanabara Bay, could be observed on Figure 7, but
not so well on Figure 2. It is interesting to note that even having an intrinsic relationship
between the two maps – chlorophyll and primary production, it is possible to observe a
few interesting differences.
The quantification in time and space of mechanisms that promote the enrichment of these
waters is extremely relevant for the general understanding of the factors controlling primary
production, and the resultant impact on biogeochemical cycles and management of ocean's
living resources.
1581
Anais XI SBSR, Belo Horizonte, Brasil, 05 - 10 abril 2003, INPE, p. 1575 - 1586.
Figure 4 – Histogram of the PAR values (E.m-2 .d-1 ) taken from the map shown on Fig. 3.
Statistical computations (mean, std, max, min, median, mode) are also included.
Figure 5 – Map of diffuse attenuation coefficient (m-1 ) - K490 estimated from the SeaWiFS
data. Yellow-green-light blue colors are indicative of stronger attenuation of underwater light
in more coastal waters. Dark blue tone, associated with the Brazil Current waters, indicates
lower values of K490 . Clouds and continent are in white.
1582
Anais XI SBSR, Belo Horizonte, Brasil, 05 - 10 abril 2003, INPE, p. 1575 - 1586.
Figure 6 – Histogram of the diffuse attenuation coefficient (m-1 ) taken from the map shown on
Fig. 5. Statistical computations (mean, std, max, min, median, mode) are also presented.
Figure 7 – Daily integrated on the water column primary production map (mgC.mgChl-1 .m-2 .
d-1 ) obtained from the SeaWiFS image acquired on February 15, 2001, with the use of a
vertically homogeneous, non-spectral model. Green to red colors, representative of relatively
higher values of primary production, are seen closer to the shore and associated with
upwelling plumes and eddies (see text). Blue tones indicate the presence of more oligotrophic
waters of the Brazil Current. Clouds and continent are in white.
1583
Anais XI SBSR, Belo Horizonte, Brasil, 05 - 10 abril 2003, INPE, p. 1575 - 1586.
5. Conclusions
The purpose of this paper was to show how a map of primary production of the SE Brazilian
coast could be obtained from a SeaWiFS image and in situ data. The steps involved in the
calculation of the daily primary production integrated in the water column were presented.
The approach adopted was for a vertically homogeneous, non-spectral model.
The surface fields generated from the satellite data contains interesting oceanographic
patterns of importance in the dynamical and ecological understanding of this oceanic region.
Principal limitations are that the SeaWiFS sensor sample only the surface of the ocean, neither
can see through clouds.
Understanding the physical and biological processes, as well as their interaction, is a
central goal for the management of fisheries over continental shelf areas. In one of the most
economically important regions of Brazil (SE coast), phytoplankton productivity and standing
crops are influenced by a complex suite of seasonal physical processes. One of these physical
processes involves the relationship between the coastal upwelling near Cape Frio and the
displacement of a cold-nutrient-rich water mass (South Atlantic Central Water) towards the
coast. An oceanographic project (DEPROAS) is being carried out in this region, and this work
is a preliminary contribution to our dynamical and ecological understanding of this oceanic
region.
References
Balch, W.M.; Byrne, C.F. Facotors affecting the estimate of primary production from space. J. Geophys. Res.,
99(C4):7555-7570, 1994.
Behrenfeld, M.J.; Falkowski, P.G. A consumer’s guide to phytoplankton primary productivity models. Limnol.
Oceanogr., 42(7):1479-1491, 1997.
Behrenfeld, M.J.; Falkowski, P.G.; Esaias, W.E.; Balch, W.; Campbell, J.W.; Iverson, R.L.; Kiefer, D.A.; Morel,
A.; Yoder, J.A. Towards a consensus productivity algorithm for SeaWiFS. In: Hooker, S.B., Firestone, E.R., eds.
SeaWiFS Technical Report Series, v.42, Satellite primary productivity data and algorithm development: a
science plan for Mission to Planet Earth. Goddard Space Flight Center, Greenbelt, MD, USA, 1998, p. 18-25.
Berthelot, B.; Deschamps, P.Y. Evaluation of bio-optical algorithms to remotely sense marine primary
production from space. J.Geophys.Res., 99:7979-7989, 1994.
Castro Filho, B. M. Correntes e massas de água da plataforma continental norte de São Paulo. Tese de LivreDocência, Instituto Oceanográfico, Universidade de São Paulo, São Paulo, SP, 1996. 248p.
Falkowski, P.G.; Behrenfeld, M.J.; Esaias, E.; Balch, W.; Campbell, J.W.; Iverson, R.L.; Kiefer, D.A.; Morel,
A.; Yoder, J.A. Satellite primary productivity data and algorithm development: a science plan for mission to
planet Earth. In: Hooker, S.B.; Firestone, E.R.; Eds., SeaWiFS Technical Report Series, V.42 (NASA Technical
Memorandum 104566). NASA, Washington, DC, 36p. 1998.
Frouin, R., and B. Chertock. A technique for global monitoring of net solar irradiance at the ocean surface. Part
I: Model. J. Appl. Meteor., 31:1056-1066, 1992.
Fu, G., Baith, K. S., and McClain, C. R. SeaDAS: The SeaWiFS Data Analysis System. In: The 4th Pacific
Ocean Remote Sensing Conference, Qingdao, China, July 28-31, 1998. Proceedings. 1998, p. 73-79.
Gordon, H.R.; Wang, M. Retrieval of water-leaving radiance and aerosol optical thickness over the oceans with
SeaWiFS: a preliminary algorithm. Appl. Optics, 33:443-452. 1994.
Grasshoff, K.M.E.; Kremling, K. Methods of seawater analysis. 2nd. Ed. Verlag Chemie, New York, 419p.
1983.
Gregg, W.W.; Carder, K.L. A simple spectral solar irradiance model for cloudless-maritime atmospheres.
Limnol. Oceanogr., 35(8):1657-1675. 1990
Holm-Hansen, O.; Lorenzen, C.J.; Holems, R.W.; Strickland, J.D.H. Fluorimetric determination of chlorophyll.
International Council for the exploration of the sea, 30:3-15. 1965.
1584
Anais XI SBSR, Belo Horizonte, Brasil, 05 - 10 abril 2003, INPE, p. 1575 - 1586.
IGBP. The International Geosphere-Biosphere Programme: a study of global change. IGBP Rep. 4. 200p. 1988.
JGOFS. Report of the first session of the SCOR committee for JGOFS. Sci. Comm. Ocean. Res. 50p. 1988.
Joint, I.; Groom, S.B. Estimation of phytoplankton production from space: current status and future potential of
satellite remote sensing. J.Exper. Mar. Biol. Ecol., 250:233-255, 2000.
Kampel, M.; Gaeta, S.A. Estimativas da produtividade primária na região oeste do Atlântico Sul utilizando
dados orbitais da cor do oceano. In: Simpósio Brasileiro de Oceanografia, 26-30 agosto 2002, São Paulo, SP.
IOUSP, São Paulo, Anais, CD-ROM (OCB-181).
Kampel, M.; Lorenzzetti, C.L.; Silva Jr., C.L. Observação por satélite de ressurgências na costa S-SE brasileira.
In: VII COLACMAR, 22 a 26 de setembro de 1997, Santos, SP. IOUSP, ALICMAR, São Paulo, Anais, v.II, 3840 p. 1997.
Kampel, M.; Lorenzzetti, J.A.; Gaeta, S.; Araujo, C.E.S. Use of satellite data for studying and monitoring the
southeast coast of Brazil. In: IX Simpósio Latino-americano de Percepción Remota, Puerto Iguazú, Argentina, 610 Nov. 2000. Proceedings. SELPER, 2000.
Lima, J.A.M.; Scofanno, A.M. New Oceanograghic challenges in the Brazilian deepwater oil fields. In: Offshore
Technologgy Conference – OTC, 1999. Proceedings. 1999.
McClain, C.; Arrigo, K.; Esaias, W.E.; Darzi, M.; Patt, F.S.; Evans, R.H.; Brown, J.W.; Brown, C.W.; Barnes,
R.A.; Kumar, L. SeaWiFS algorithms, Part 1. In: Hooker, S.B.; Firestone, E.R.; Acker, J.G. eds. SeaWiFS
Technical Report Series, V.28 (NASA Technical Memorandum 104566). NASA, Washington, DC, 46p. 1995.
Miranda, L.B. Análise de massas d'água da plataforma continental e da região oceânica adjacente: Cabo de São
Tomé (RJ) e a Ilha de São Sebastião (SP). Livre Docência Thesis, Instituto Oceanográfico da USP, São Paulo,
1982. 194p.
O’Reilly, J.E.; Maritorena, S.; Mitchell, B.G.; Siegel, D.A.; Carder, K.L.; Garver, S.A.; Kahru, M.; McClain, C.
Ocean color chlorophyll algorithms for SeaWiFS. J. Geophys. Res., 103(11):24937-24953. 1998
Paranhos, R. Alguns métodos para análise da água. Rio de Janeiro, cadernos didáticos, UFRJ, 1996, 281p.
Platt, T.; Gallegos, C.L.; Harrison, W.G. Photoinhibition of photosynthesis in natural assemblages of marine
phytoplankton. J. Mar. Res., 38:687-701. 1980
Platt, T.; Sathyendranath, S.; Estimators of primary production for interpretation of remotely sensed data on
ocean color. J. Geophys. Res., 98(C8):14.561-14.576. 1993.
Platt, T.; Sathyendranath, S.; Ravindran, P. Primary production by phytoplankton: analytic solutions for daily
rates per unit area of water surface. Proc. R. Soc. Lond. Ser. B 241, 101-111. 1990.
Sathyendranath, S.; Platt, T. Remote sensing of water-column primary production. In: Li, W.K.M.; Maestrini,
S.Y., Eds., Measurements of primary production from molecular to the global scale, Copenhagem, International
Council for the Exploration of the sea, 1994a.
Sathyendranath, S.; Platt, T. Underwater light field and primary production: application to remote sensing. In:
Barale, V.; Schlittenhardt, P., Eds., Ocean colour: theory and applications in a decade of CZCS experience,
Kluver Academic Publishers, 1994b.
Shoaf, W.T.; Lium, B.W. Improved extraction of chlorophyll a and b from algae using dimethyl sulfoxide.
Limnol. Oceanogr., 21:926-928, 1976.
Stramski, D.; Morel, A. Optical properties of photosynthetic picoplankton in different physiological states as
affected by growth irradiance. Deep Sea Research, 37:245-266.
Stech, J.L.,Lorenzzetti, J.A., de Souza, J.M.C. and Araujo, C.E.S. A mesoscale Brazil Current eddy observed
through AVHRR images and current meter moorings. In: International Archives of Photogrammetry and Remote
Sensing. Proceedings. Vol. XXXI, Part B7. Vienna, July 1996, pp. 650-653.
Strickland, J.D.H.; Parsons, T.R. A pratical handbook of seawater analysis. 2nd ed. J. Fish. Res. Bd. Can.
Canadian Bulletin, 167, 1972, 311p.
Teixeira, C. Introdução aos métodos para medir a produção primária do fitoplâncton marinho. Bolm. Inst.
Oceanogr., S.Paulo, 22:59-92. 1972.
1585
Anais XI SBSR, Belo Horizonte, Brasil, 05 - 10 abril 2003, INPE, p. 1575 - 1586.
UNESCO. Progress on oceanographic tables and standards: work and recommendations of the
UNESCO/SCOR/ICES/IAPSO Joint Panel. Unesco technical papers in marine science 50. 1988.
Welshmeyer, N.A. Fluorometric analysis of chlorophyll a in the presence of chlorophyll b and pheopigments.
Limnol. Oceanogr., 39:1985-1992. 1994.
Zembruski, S.G. Geomorfologia da margem continental sul brasileira e das bacias oceânicas adjacentes. In:
Chaves, H.A.F., ed. – Geomorfologia da margem continental sul brasileira e das áreas oceânicas adjacentes.
Petrobrás, Rio de Janeiro. 1979.
1586
Baixar