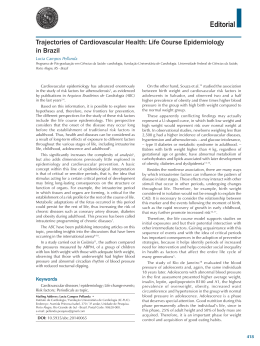
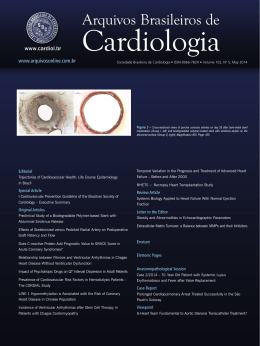
www.arquivosonline.com.br Sociedade Brasileira de Cardiologia • ISSN-0066-782X • Volume 104, Nº 4, April 2015 Figure 1 – Schematic representation of quantitative coronary analysis by 64-slice MDCT (above) and IVUS (below). The upper images show the longitudinal reconstruction for both methods. The lower images show illustrative vessel cross-sections with the outer vessel and lumen (inner) boundaries tracings. page 317 Original Articles Letter to the Editor Infant Mortality in Novo Hamburgo: Associated Factors and Left Atrial Volume Index as Predictor of Events in Acute Coronary Cardiovascular Causes Syndrome Insulin Resistance, Dyslipidemia and Cardiovascular Changes in a Group of Obese Children Eletronic Pages Subclinical Ventricular Dysfunction Detected by Speckle Tracking Two Years after Use of Anthracycline Clinicoradiological Session Blood Pressure Variation Throughout Pregnancy According to Early Case 4/2015 A 48-year-old Male Patient with Coarctation of the Gestational BMI: A Brazilian Cohort Aorta, Bicuspid Aortic Valve and Normal Ascending Aorta Progression of Blood Pressure and Cardiovascular Outcomes in Case Report Hypertensive Patients in a Reference Center Sickle-cell Anemia and Latent Diastolic Dysfunction: Quality of Life on Arterial Hypertension: Validity of Known Groups of MINICHAL Influence of Spironolactone on Matrix Metalloproteinase-2 in Acute Decompensated Heart Failure Comparison between MDCT and Grayscale IVUS in a Quantitative Analysis of Coronary Lumen in Segments with or without Atherosclerotic Plaques Review Article Treatment of Dyslipidemia with Statins and Physical Exercises: Recent Findings of Skeletal Muscle Responses Echocardiographic Alterations Viewpoint Correct Anatomical Orientation of the Heart and Reflections on the Nomenclature Used in Daily Practice Image Incremental Value Of 3D Transesophageal Echocardiography for The Assessment of Mitral Valve Prolapse A JOURNAL OF SOCIEDADE BRASILEIRA DE CARDIOLOGIA - Published since 1948 Contents Original Articles Pediatric Cardiology Infant Mortality in Novo Hamburgo: Associated Factors and Cardiovascular Causes Camila de Andrade Brum, Airton Tetelbom Stein, Lucia Campos Pellanda .....................................................................................................................................................................page 257 Insulin Resistance, Dyslipidemia and Cardiovascular Changes in a Group of Obese Children António Pires, Paula Martins, Ana Margarida Pereira, Patricia Vaz Silva, Joana Marinho, Margarida Marques, Eduardo Castela, Cristina Sena, Raquel Seiça .....................................................................................................................................................................page 266 Echocardiography - Adults Subclinical Ventricular Dysfunction Detected by Speckle Tracking Two Years after Use of Anthracycline André Luiz Cerqueira de Almeida, Viviane Almeida Silva, Alberto Teófilo de Souza Filho, Vinicius Guedes Rios, João Ricardo Pinto Lopes, Samuel Oliveira de Afonseca, Daniel de Castro Araújo Cunha1, Murilo Oliveira da Cunha Mendes, Danilo Leal Miranda, Edval Gomes dos Santos Júnior .....................................................................................................................................................................page 274 Epidemiology Blood Pressure Variation Throughout Pregnancy According to Early Gestational BMI: A Brazilian Cohort Fernanda Rebelo, Dayana Rodrigues Farias, Roberta Hack Mendes, Michael Maia Schlüssel, Gilberto Kac .....................................................................................................................................................................page 284 Hypertension Progression of Blood Pressure and Cardiovascular Outcomes in Hypertensive Patients in a Reference Center Gilberto Campos Guimarães Filho, Ana Luiza Lima Sousa, Thiago de Souza Veiga Jardim, Weimar Sebba Barroso Souza, Paulo César Brandão Veiga Jardim .....................................................................................................................................................................page 292 Systemic Arterial Hypertension Quality of Life on Arterial Hypertension: Validity of Known Groups of MINICHAL Ana Lúcia Soares Soutello, Roberta Cunha Matheus Rodrigues, Fernanda Freire Jannuzzi, Thaís Moreira São-João, Gabriela Giordano Martini, Wilson Nadruz Jr., Maria-Cecília Bueno Jayme Gallani .....................................................................................................................................................................page 299 Heart Failure Influence of Spironolactone on Matrix Metalloproteinase-2 in Acute Decompensated Heart Failure João Pedro Ferreira, Mário Santos, José Carlos Oliveira, Irene Marques, Paulo Bettencourt, Henrique Carvalho .....................................................................................................................................................................page 308 Arquivos Brasileiros de Cardiologia - Volume 104, Nº 4, April 2015 Cardiovascular Computed Tomography Comparison between MDCT and Grayscale IVUS in a Quantitative Analysis of Coronary Lumen in Segments with or without Atherosclerotic Plaques João L. A. A. Falcão, Breno A. A. Falcão, Swaminatha V. Gurudevan, Carlos M. Campos, Expedito R. Silva, Roberto Kalil-Filho, Carlos E. Rochitte, Afonso A. Shiozaki, Otavio R. Coelho-Filho, Pedro A. Lemos .....................................................................................................................................................................page 315 Review Article Treatment of Dyslipidemia with Statins and Physical Exercises: Recent Findings of Skeletal Muscle Responses Mariana Rotta Bonfim, Acary Souza Bulle Oliveira, Sandra Lia do Amaral, Henrique Luiz Monteiro .....................................................................................................................................................................page 324 Letter to the Editor Left Atrial Volume Index as Predictor of Events in Acute Coronary Syndrome Luciano Barros Pires e Rodrigo Pires dos Santos .....................................................................................................................................................................page 333 Arquivos Brasileiros de Cardiologia - Volume 104, Nº 4, April 2015 Arquivos Brasileiros de Cardiologia - Eletronic Pages Clinicoradiological Session Case 4/2015 A 48-year-old Male Patient with Coarctation of the Aorta, Bicuspid Aortic Valve and Normal Ascending Aorta Edmar Atik, Raul Arrieta, Otávio Rizzi Coelho .................................................................................................................................................................. page e27 Case Report Sickle-cell Anemia and Latent Diastolic Dysfunction: Echocardiographic Alterations André Fattori, Daniela Camargo Oliveira, Roger Frigério Castilho, Otávio Rizzi Coelho .................................................................................................................................................................. page e30 Viewpoint Correct Anatomical Orientation of the Heart and Reflections on the Nomenclature Used in Daily Practice Viviane Tiemi Hotta e Vera Demarchi Aiello .................................................................................................................................................................. page e34 Image Incremental Value Of 3D Transesophageal Echocardiography for The Assessment of Mitral Valve Prolapse Viviane Tiemi Hotta, Mirian Magalhães Pardi, Valdir Ambrósio Moisés .................................................................................................................................................................. page e37 * Indicate manuscripts only in the electronic version. To view them, visit: http://www.arquivosonline.com.br/2014/english/10404/edicaoatual.asp Arquivos Brasileiros de Cardiologia - Volume 104, Nº 4, April 2015 www.arquivosonline.com.br A JOURNAL OF SOCIEDADE BRASILEIRA DE CARDIOLOGIA - Published since 1948 Scientific Director Maria da Consolação Vieira Moreira Interventionist Cardiology Pedro A. Lemos Chief Editor Luiz Felipe P. Moreira Pediatric/Congenital Cardiology Antonio Augusto Lopes Associated Editors Arrhythmias/Pacemaker Mauricio Scanavacca Clinical Cardiology José Augusto Barreto-Filho Non-Invasive Diagnostic Methods Carlos E. Rochitte Surgical Cardiology Paulo Roberto B. Evora Basic or Experimental Research Leonardo A. M. Zornoff Epidemiology/Statistics Lucia Campos Pellanda Arterial Hypertension Paulo Cesar B. V. Jardim Ergometrics, Exercise and Cardiac Rehabilitation Ricardo Stein First Editor (1948-1953) † Jairo Ramos Editorial Board Brazil Aguinaldo Figueiredo de Freitas Junior (GO) Alfredo José Mansur (SP) Aloir Queiroz de Araújo Sobrinho (ES) Amanda G. M. R. Sousa (SP) Ana Clara Tude Rodrigues (SP) André Labrunie (PR) Andrei Sposito (SP) Angelo A. V. de Paola (SP) Antonio Augusto Barbosa Lopes (SP) Antonio Carlos C. Carvalho (SP) Antônio Carlos Palandri Chagas (SP) Antonio Carlos Pereira Barretto (SP) Antonio Cláudio L. Nóbrega (RJ) Antonio de Padua Mansur (SP) Ari Timerman (SP) Armênio Costa Guimarães (BA) Ayrton Pires Brandão (RJ) Beatriz Matsubara (SP) Brivaldo Markman Filho (PE) Bruno Caramelli (SP) Carisi A. Polanczyk (RS) Carlos Eduardo Rochitte (SP) Carlos Eduardo Suaide Silva (SP) Carlos Vicente Serrano Júnior (SP) Celso Amodeo (SP) Charles Mady (SP) Claudio Gil Soares de Araujo (RJ) Cláudio Tinoco Mesquita (RJ) Cleonice Carvalho C. Mota (MG) Clerio Francisco de Azevedo Filho (RJ) Dalton Bertolim Précoma (PR) Dário C. Sobral Filho (PE) Décio Mion Junior (SP) Denilson Campos de Albuquerque (RJ) Djair Brindeiro Filho (PE) Domingo M. Braile (SP) Edmar Atik (SP) Emilio Hideyuki Moriguchi (RS) Enio Buffolo (SP) Eulógio E. Martinez Filho (SP) Evandro Tinoco Mesquita (RJ) Expedito E. Ribeiro da Silva (SP) Fábio Vilas-Boas (BA) Fernando Bacal (SP) Flávio D. Fuchs (RS) Francisco Antonio Helfenstein Fonseca (SP) Gilson Soares Feitosa (BA) Glaucia Maria M. de Oliveira (RJ) Hans Fernando R. Dohmann (RJ) Humberto Villacorta Junior (RJ) Ínes Lessa (BA) Iran Castro (RS) Jarbas Jakson Dinkhuysen (SP) João Pimenta (SP) Jorge Ilha Guimarães (RS) José Antonio Franchini Ramires (SP) José Augusto Soares Barreto Filho (SE) José Carlos Nicolau (SP) José Lázaro de Andrade (SP) José Péricles Esteves (BA) Leonardo A. M. Zornoff (SP) Leopoldo Soares Piegas (SP) Lucia Campos Pellanda (RS) Luís Eduardo Rohde (RS) Luís Cláudio Lemos Correia (BA) Luiz A. Machado César (SP) Luiz Alberto Piva e Mattos (SP) Marcia Melo Barbosa (MG) Maria da Consolação Moreira (MG) Mario S. S. de Azeredo Coutinho (SC) Maurício I. Scanavacca (SP) Max Grinberg (SP) Michel Batlouni (SP) Murilo Foppa (RS) Nadine O. Clausell (RS) Orlando Campos Filho (SP) Otávio Rizzi Coelho (SP) Otoni Moreira Gomes (MG) Paulo Andrade Lotufo (SP) Paulo Cesar B. V. Jardim (GO) Paulo J. F. Tucci (SP) Paulo R. A. Caramori (RS) Paulo Roberto B. Évora (SP) Paulo Roberto S. Brofman (PR) Pedro A. Lemos (SP) Protásio Lemos da Luz (SP) Reinaldo B. Bestetti (SP) Renato A. K. Kalil (RS) Ricardo Stein (RS) Salvador Rassi (GO) Sandra da Silva Mattos (PE) Sandra Fuchs (RS) Sergio Timerman (SP) Silvio Henrique Barberato (PR) Tales de Carvalho (SC) Vera D. Aiello (SP) Walter José Gomes (SP) Weimar K. S. B. de Souza (GO) William Azem Chalela (SP) Wilson Mathias Junior (SP) Exterior Adelino F. Leite-Moreira (Portugal) Alan Maisel (USA) Aldo P. Maggioni (Italy) Cândida Fonseca (Portugal) Fausto Pinto (Portugal) Hugo Grancelli (Argentina) James de Lemos (USA) João A. Lima (USA) John G. F. Cleland (England) Maria Pilar Tornos (Spain) Pedro Brugada (Belgium) Peter A. McCullough (USA) Peter Libby (USA) Piero Anversa (Italy) Sociedade Brasileira de Cardiologia President Angelo Amato V. de Paola Special Advisor to the Presidency Fábio Sândoli de Brito SBC/MG - Odilon Gariglio Alvarenga de Freitas Vice-President Sergio Tavares Montenegro Adjunct Coordination SBC/MS - Mércule Pedro Paulista Cavalcante SBC Newsletter Editor Nabil Ghorayeb e Fernando Antonio Lucchese SBC/MT - Julio César De Oliveira Continuing Education Coordination Estêvão Lanna Figueiredo SBC/NNE - Jose Itamar Abreu Costa President-Elect Marcus Vinícius Bolívar Malachias Financial Director Jacob Atié Scientific Director Maria da Consolação Vieira Moreira Administrative Director Emilio Cesar Zilli Assistance Quality Director Pedro Ferreira de Albuquerque Communication Director Maurício Batista Nunes Norms and Guidelines Coordination Luiz Carlos Bodanese Governmental Integration Coordination Edna Maria Marques de Oliveira Regional Integration Coordination José Luis Aziz Presidents of State and Regional Brazilian Societies of Cardiology SBC/AL - Carlos Alberto Ramos Macias Information Technology Director José Carlos Moura Jorge SBC/AM - Simão Gonçalves Maduro Government Liaison Director Luiz César Nazário Scala SBC/BA - Mario de Seixas Rocha Director of State and Regional Affairs Abrahão Afiune Neto SBC/CE - Ana Lucia de Sá Leitão Ramos Cardiovascular Health Promotion Director - SBC/Funcor Carlos Costa Magalhães Department Director Especializados - Jorge Eduardo Assef Research Director Fernanda Marciano Consolim Colombo Chief Editor of the Brazilian Archives of Cardiology Luiz Felipe P. Moreira SBC/CO - Frederico Somaio Neto SBC/PA - Luiz Alberto Rolla Maneschy SBC/PB - Helman Campos Martins SBC/PE - Catarina Vasconcelos Cavalcanti SBC/PI - João Francisco de Sousa SBC/PR - Osni Moreira Filho SBC/RJ - Olga Ferreira de Souza SBC/RN - Rui Alberto de Faria Filho SBC/RS - Carisi Anne Polanczyk SBC/DF - Wagner Pires de Oliveira Junior SBC/SC - Marcos Venício Garcia Joaquim SBC/ES - Marcio Augusto Silva SBC/SE - Fabio Serra Silveira SBC/GO - Thiago de Souza Veiga Jardim SBC/SP - Francisco Antonio Helfenstein Fonseca SBC/MA - Nilton Santana de Oliveira SBC/TO - Hueverson Junqueira Neves Presidents of the Specialized Departaments and Study Groups SBC/DA - José Rocha Faria Neto SBCCV - Marcelo Matos Cascado GECC - Mauricio Wanjgarten SBC/DECAGE - Josmar de Castro Alves SBHCI - Helio Roque Figueira GEPREC - Glaucia Maria Moraes de Oliveira SBC/DCC - José Carlos Nicolau SBC/DEIC - Dirceu Rodrigues Almeida SBC/DCM - Maria Alayde Mendonça da Silva Grupo de Estudos de Cardiologia Hospitalar Evandro Tinoco Mesquita GERTC - Clerio Francisco de Azevedo Filho SBC/DCC/CP - Isabel Cristina Britto Guimarães SBC/DIC - Arnaldo Rabischoffsky SBC/DERC - Nabil Ghorayeb GAPO - Danielle Menosi Gualandro GEECG - Joel Alves Pinho Filho Grupo de Estudos de Cardio-Oncologia Roberto Kalil Filho GEEC - Cláudio José Fuganti GECIP - Gisela Martina Bohns Meyer SBC/DFCVR - Ricardo Adala Benfati GEECABE - Mario Sergio S. de Azeredo Coutinho SBC/DHA - Luiz Aparecido Bortolotto GECETI - Gilson Soares Feitosa Filho GECN - Ronaldo de Souza Leão Lima SOBRAC - Luiz Pereira de Magalhães GEMCA - Alvaro Avezum Junior GERCPM - Artur Haddad Herdy GECESP - Ricardo Stein Arquivos Brasileiros de Cardiologia Volume 104, Nº 4, April 2015 Indexing: ISI (Thomson Scientific), Cumulated Index Medicus (NLM), SCOPUS, MEDLINE, EMBASE, LILACS, SciELO, PubMed Address: Av. Marechal Câmara, 160 - 3º andar - Sala 330 20020-907 • Centro • Rio de Janeiro, RJ • Brasil Phone.: (21) 3478-2700 E-mail: [email protected] www.arquivosonline.com.br SciELO: www.scielo.br Commercial Department Phone: (11) 3411-5500 Graphic Design and Diagramming SBC - Internal Design Department E-mail: [email protected] Print IMOS Editora e Gráfica Editorial Production Circulation 1.500 copies SBC - Internal Publication Department Affiliated at the Brazilian Medical Association The ads showed in this issue are of the sole responsibility of advertisers, as well as the concepts expressed in signed articles are of the sole responsibility of their authors and do not necessarily reflect the views of SBC. This material is for exclusive distribution to the medical profession. The Brazilian Archives of Cardiology are not responsible for unauthorized access to its contents and that is not in agreement with the determination in compliance with the Collegiate Board Resolution (DRC) N. 96/08 of the National Sanitary Surveillance Agency (ANVISA), which updates the technical regulation on Drug Publicity, Advertising, Promotion and Information. According to Article 27 of the insignia, "the advertisement or publicity of prescription drugs should be restricted solely and exclusively to health professionals qualified to prescribe or dispense such products (...)". To ensure universal access, the scientific content of the journal is still available for full and free access to all interested parties at: www.arquivosonline.com.br. SUPPORT Back to the Cover Original Article Infant Mortality in Novo Hamburgo: Associated Factors and Cardiovascular Causes Camila de Andrade Brum1, Airton Tetelbom Stein2,3,4, Lucia Campos Pellanda1,2 Instituto de Cardiologia/Fundação Universitária de Cardiologia (IC/FUC)1; Universidade Federal de Ciências da Saúde de Porto Alegre (UFCSPA)2; Grupo Hospitalar Conceição (GHC)3; Universidade Luterana do Brasil (ULBRA)4; Porto Alegre, RS - Brazil Abstract Background: Infant mortality has decreased in Brazil, but remains high as compared to that of other developing countries. In 2010, the Rio Grande do Sul state had the lowest infant mortality rate in Brazil. However, the municipality of Novo Hamburgo had the highest infant mortality rate in the Porto Alegre metropolitan region. Objectives: To describe the causes of infant mortality in the municipality of Novo Hamburgo from 2007 to 2010, identifying which causes were related to heart diseases and if they were diagnosed in the prenatal period, and to assess the access to healthcare services. Methods: This study assessed infants of the municipality of Novo Hamburgo, who died, and whose data were collected from the infant death investigation records. Results: Of the 157 deaths in that period, 35.3% were reducible through diagnosis and early treatment, 25% were reducible through partnership with other sectors, 19.2% were non-preventable, 11.5% were reducible by means of appropriate pregnancy monitoring, 5.1% were reducible through appropriate delivery care, and 3.8% were ill defined. The major cause of death related to heart disease (13.4%), which was significantly associated with the variables ‘age at death’, ‘gestational age’ and ‘birth weight’. Regarding access to healthcare services, 60.9% of the pregnant women had a maximum of six prenatal visits. Conclusion: It is mandatory to enhance prenatal care and newborn care at hospitals and basic healthcare units to prevent infant mortality. (Arq Bras Cardiol. 2015; 104(4):257-265) Keywords: Infant Mortality; Perinatal Mortality / epidemiology; Fetal Death / epidemiology; Heart Diseases / epidemiology; Midwifery; Maternal and Child Health. Introduction Infant mortality in Brazil has decreased over the past few decades, but remains high as compared to that of other developing countries 1. In 2010, that rate was 19.88/1000 live births. In that same year, the Rio Grande do Sul state had the lowest infant mortality rate in Brazil (11.2 deaths/1000 live births) 2, while the municipality of Novo Hamburgo, in the Porto Alegre metropolitan region, had the highest infant mortality rate in that region (14.2 deaths/1000 live births)3,4 (Figure 1). The major causes of neonatal mortality in Brazil are intrauterine and intrapartum asphyxia and low birth weight/ prematurity. Conversely, in developed countries, those causes are extreme prematurity and congenital malformation 5. Mailing Address: Lucia Campos Pellanda • Av. Princesa Isabel, 370, Santana. Postal Code 90.620-000, Porto Alegre, RS - Brazil E-mail: [email protected] Manuscript received May 29, 2014; revised manuscript September 05, 2014; accepted September 16, 2014 DOI: 10.5935/abc.20140203 257 Similar to early neonatal mortality, high late neonatal mortality relates to poor maternal health conditions and unsatisfactory prenatal, delivery and newborn care6. Because of the reduction in preventable causes, which result from social determinants, there is an increasing need to study congenital malformations, of which, heart diseases have the greatest impact. This study was aimed at: describing the causes of infant mortality in the municipality of Novo Hamburgo, Rio Garnde do Sul state, from 2007 to 2010; identifying the causes of death related to heart diseases and if they were diagnosed in the prenatal period; and assessing the access to healthcare services of the cases of infant death in the municipality of Novo Hamburgo. Methods This is a population-based case study (deaths). From 2010 to 2011, data of the municipality of Novo Hamburgo were collected from the 2007-2010 infant death investigation records and from the Infant Mortality System by the same highly skilled researcher. This study sample comprised 157 infant deaths. Brum et al. Infant mortality and heart diseases Original Article Municipalities of the Porte Alegre Metropolitan Region Series 1; Novo Hamburgo; 14.2 Series 1; Viamão; 12.7 Series 1; Cachoeirinha; 12.6 Series 1; Alvorada; 11.5 Series 1; São Leopoldo; 11.2 Series 1; Gravataí; 11 Series 1; Porto Alegre; 10.5 Series 1; Canoas; 8.3 Infant Mortality Rate (per 1000 live births) Figure 1 – Comparison of infant mortality in the Porto Alegre metropolitan region in 2010. Source: Health Secretariat of Rio Grande do Sul State. This study included data of infants in the municipality of Novo Hamburgo, who died. Variables not found in the infant death investigation records were excluded. The number of live births was obtained from the Live Birth Information System of the Health Secretariat of Rio Grande do Sul State (Sinasc). Birth and death dates and causes of death were collected from death certificates by the researcher responsible for the infant death investigation, as were the variables ‘gestational age’, ‘birth weight’ and ‘number of prenatal visits’, obtained from the hospital medical records of the newborn or from the maternal medical records. The infant death investigation records are completed by a health professional (nurse or doctor), who investigates death based on the infant’s medical records, the maternal medical records and interviews with family members during home visits. The causes of death were classified according to the Classification of the São Paulo State Data Analysis System (Seade) Foundation, which is used by the Brazilian Ministry of Health to classify the causes de death aiming at prevention. Heart diseases are classified as preventable causes, which can be reduced through early management interventions. For categorical variables, descriptive analysis (percentage) was used, and, for continuous variables, mean and standard deviation. The chi-square test and analysis of residues were used. The 5% significance level was adopted. The SPSS software, version 19, was used for data analysis. This study used secondary data, was approved by the Committee on Ethics and Research of the Institute of Cardiology of Rio Grande do Sul, and no written informed consent was required. Results Of the 157 deaths in the 2007-2010 period, 44.6% occurred in the early neonatal period, 22.3% in the late neonatal period, and 33.1% in the postneonatal period. According to the Seade Foundation Classification, the major causes of infant death in Novo Hamburgo (35.3%) could be reduced through actions of diagnosis, prevention and early treatment; 25% were reducible by use of partnership with other sectors; and 19.2% were non‑preventable (Figure 2). Regarding birth sites, 77.4% of the births occurred at hospitals of the Novo Hamburgo municipality, and 21.3% at hospitals of other municipalities. Regarding the infants who died, 57.2% were males and 64.1% had a birth weight lower than 2,500 g. Regarding maternal characteristics, most women whose infants died were younger than 35 years (84.6%), and 39.7% of them had a gestational age higher than 36 weeks. Considering access to healthcare services, 39.2% of the pregnant women had at least six prenatal visits (Table 1). Heart diseases were the major cause of infant death (13.4%), followed by respiratory distress syndrome of the newborn (8.9%) and unspecified bacterial septicemia of the newborn (8.3%). The causes of mortality related to heart Arq Bras Cardiol. 2015; 104(4):257-265 258 Brum et al. Infant mortality and heart diseases Classification of Death According to the Seade Foundation Original Article 55 (35.3%) 39 (25.0%) 30 (19.2%) 18 (11.5%) 8 (5.1%) 6 (3.8%) Number of children Figure 2 – Causes of infant mortality in the municipality of Novo Hamburgo in 2007-2010 according to the Seade Foundation. diseases in death certificates were: unspecified cardiac malformations (7.6%); malformations related to Edwards syndrome (1.3%); unspecified malformation of the chambers and septal defects (0.6%); unspecified malformation of the great vein (0.6%); coarctation of the aorta (0.6%); congenital mitral stenosis (0.6%); common arterial trunk (0.6%); pulmonary valve atresia (0.6%); and hypoplastic left heart syndrome (0.6%). Most of the deaths related to heart diseases occurred in the postneonatal period (61.9%). There was a statistically significant association between heart disease and the variables ‘age at death’, ‘gestational age’ and ‘birth weight’. A statistically significant association was observed between the cause of death and the following variables studied: ‘age at death’ (p = 0.043), with 23.1% of the postneonatal deaths related to cardiovascular causes; and ‘gestational age’ (p = 0.013), 24.2% of those born after the 36th gestational week had a cardiovascular cause of death. Regarding the variable ‘birth weight’ (p = 0.015), 96.2% of the extremely low birth weight infants (<1,000 g) showed an association with death due to other causes, and 26.7% of those with birth weight between 1,500 and 2,499 g showed an association with death due to heart diseases (Table 2). No heart disease was diagnosed prior to delivery, and no pregnant woman underwent echocardiography. Discussion Reducing infant mortality is a major challenge in Brazil for health managers and professionals and the whole society7. 259 Arq Bras Cardiol. 2015; 104(4):257-265 Although the number of deaths significantly decreased in the past decade, because of the reduction in postneonatal mortality in Brazil, most deaths occurred in the poorest regions, reflecting social inequities. That situation is even worse considering that most of those early deaths could have been prevented with timely access to quality healthcare services8. According to The Lancet – University of Oslo Commission on Global Governance for Health, the objective of the policy for equity and health is not to eliminate all health differences so that everybody has the same health level and quality, but to reduce or eliminate those differences resulting from preventable and unfair factors9. In the early neonatal period, the most common risk factors are prematurity, intrapartum asphyxia, neonatal infections and low birth weight10. The World Health Organization estimates that, in developed countries, approximately two thirds of low-birth-weight newborns are premature, while one third is small for gestational age11. That relationship is inverse in poor countries, where approximately 75% of low-birth-weight newborns are small for gestational age, and low birth weight is almost always strongly associated with conditions of poverty and maternal chronic poor nutrition and insufficient food consumption12. This is the first study to assess the causes of infant death in a developed municipality of Rio Grande do Sul state, Novo Hamburgo, whose per capita Gross Domestic Product (GDP) in 2011 was R$ 23,009.67, and whose Human Development Index (HDI) in 2010 was 0.7472. In the years 2007 to Brum et al. Infant mortality and heart diseases Original Article Table 1 – Characteristics of the sample Variables n = 157 Classification of age at death – n (%) Early neonatal 70 (44.6) Late neonatal 35 (22.3) Postneonatal 52 (33.1) Infant sex – n (%) Male 90 (57.3) Female 67 (42.7) Birth site* – n (%) Hospital of the NH municipality 120 (77.4) Hospital of another municipality 33 (21.3) Other (outside hospital) 2 (1.3) Gestation** – n (%) Single 135 (87.7) Double 19 (12.3) Delivery** – n (%) Vaginal 81 (52.6) Cesarean 73 (47.4) Maternal age*** – n (%) < 35 years 132 (84.6) ≥ 35 years 24 (15.4) Income – n (%) # None/up to 1 minimum wage 17 (18.9) 1-3 minimum wages 53 (58.9) > 3 minimum wages 20 (22.2) Maternal schooling – n (%) ## Illiterate/1-3 years 15 (10.1) 4-8 years 86 (58.1) > 8 years 47 (31.8) Gestational age*** (weeks) – n (%) 22-27 39 (25.0) 28-31 27 (17.3) 32-36 28 (17.9) > 36 62 (39.7) Birth weight*** (grams) – n (%) < 1,000 – extreme low weight 53 (34.0) 1,000-1,499 – very low weight 17 (10.9) 1,500-2,499 low weight 30 (19.2) ≥ 2,500 – eutrophic 56 (35.9) Number of prenatal visits – n (%) 9 (6.3) None 1-3 19 (13.3) 4-6 59 (41.3) >6 56 (39.2) NH: Novo Hamburgo. * Two infants (1.3%) without birth site registration; ** Three infants (1.9%) lacked that information; *** One mother (0.6%) lacked that information; # 67 registries (42.7%) lacked that information. ## Nine registries (5.7%) lacked that information. Arq Bras Cardiol. 2015; 104(4):257-265 260 Brum et al. Infant mortality and heart diseases Original Article Table 2 – Association between cause of death and the variables studied Variables n Death due to CV causes Death due to NCV causes n (%) n (%) Classification of death 0.043 Early neonatal 70 6 (8.6) 64 (91.4) Late neonatal 35 3 (8.6) 32 (91.4) Postneonatal 52 12 (23.1)** 40 (76.9) Male 90 13 (14.4) 77 (85.6) Female 67 8 (11.9) 59 (88.1) Hospital of the NH municipality 120 15 (12.5) 105 (87.5) Hospital of another municipality 33 6 (18.2) 27 (81.8) Other (outside hospital) 2 0 (0.0) 2 (100) Single 135 19 (14.1) 116 (85.9) Double 19 1 (5.3) 18 (94.7) Infant sex 0.827 Birth site 0.597 Gestation 0.470 Delivery 0.625 Vaginal 81 9 (11.1) 72 (88.9) Cesarean 73 11 (15.1) 62 (84.9) < 35 years 132 17 (12.9) 115 (87.1) ≥ 35 years 24 4 (16.7) 20 (83.3) 17 1 (5.9) 16 (94.1) Maternal age 0.744 Income None/up to 1 minimum wage 0.235 1-3 minimum wages 53 4 (7.5) 49 (92.5) > 3 minimum wages 20 4 (20.0) 16 (80.0) 15 1 (6.7) 14 (93.3) 4-8 years 86 12 (14.0) 74 (86.0) > 8 years 47 6 (12.8) 41 (87.2) 22-27 39 2 (5.1) 37 (94.9) 28-31 27 1 (3.7) 26 (96.3) Maternal schooling Illiterate/1-3 years 0.738 Gestational age (weeks) 0.013 32-36 28 3 (10.7) 25 (89.3) > 36 62 15 (24.2)** 47 (75.8) 53 2 (3.8) 51 (96.2)** 16 (94.1) Birth weight < 1,000 – extreme low-weight 0.015 1,000-1,499 – very low weight 17 1 (5.9) 1,500-2,499 – low weight 30 8 (26.7)** 22 (73.3) ≥ 2,500 – eutrophic 56 10 (17.9) 46 (82.1) 9 0 (0.0) 9 (100) Number of prenatal visits None p* 0.235 1-3 19 1 (5.3) 18 (94.7) 4-6 59 6 (10.2) 53 (89.8) >6 56 10 (17.9) 46 (82.1) CV: cardiovascular; NCV: non-cardiovascular; NH: Novo Hamburgo. * Chi-square test. ** Statistically significant association according to the analysis of residues adjusted to 5% significance. 261 Arq Bras Cardiol. 2015; 104(4):257-265 Brum et al. Infant mortality and heart diseases Original Article 2010, 157 infants died, the infant mortality rate being 13.1 deaths/1000 live births. The present study found that the major cause of infant mortality was heart disease (13.4%), and almost half of the pregnant women had at least six prenatal visits. The infant mortality rate in the municipality of Novo Hamburgo was 14.2/1000 live births in 2010, which is higher than the mean rate for the Rio Grande do Sul state, whose rates have decreased (Figure 3) due to the implementation of public health policies in the most needy municipalities13. In 2010, that state registered 11.2 deaths/1000 live births and a mean of 12 deaths/1000 live births in the period studied. The infant mortality in the municipality of Novo Hamburgo is low as compared to that of the municipalities of the Brazilian Northern and Northeastern regions, but, as compared to other similar municipalities of the Porto Alegre metropolitan region, it is high, indicating insufficiently organized primary healthcare and poor quality prenatal care. The interface between primary and secondary healthcare is inadequate, and many patients go to the municipality of Novo Hamburgo, because it is a reference center with neonatal intensive care units of the Brazilian Unified Healthcare System (SUS). In 2010, that municipality was changing its healthcare provision system, leaving the population with an insufficient number of basic healthcare units. From that year on, teams of Family Healthcare Strategy were implemented according to the needs of each neighborhood, and more healthcare units were built. The model of healthcare provided exclusively through basic healthcare units might not ensure the coverage of all pregnant women regarding prenatal visits, which can be facilitated in the presence of a family healthcare strategy. The family healthcare approach widens healthcare access and improves user’s adherence, increasing the capacity to solve problems and the quality of the healthcare provided. In Brazil, neonatal mortality has stabilized at elevated levels, with a small change in its early neonatal component, playing an important role in infant mortality14. This reflects the care provided to pregnant women and fetuses during the antepartum and delivery periods, and the immediate care provided to newborns at birth14. Novo Hamburgo follows that trend, with 66.9% of deaths in the neonatal period. In a study conducted in Porto Alegre between 2000 and 2003, Jobim and Aerts15 have reported 56.9% of the deaths occurring in the neonatal period. Most infant deaths in the period studied (35.3%) could have been reduced through prevention, diagnosis and early treatment actions. That is, they were caused by treatable diseases, such as diseases of the circulatory, respiratory, nervous and endocrine systems, whose treatment could be highly complex. Twenty-five percent of deaths were classified as reducible by means of partnerships with other sectors and could have been prevented by expanding basic sanitation, educational measures (related to AIDS), and prevention of accidents, violence and malnutrition. Non-preventable deaths corresponded to 19.2% of the total and were related to either congenital malformations incompatible with life or birth weight lower than 1,000 g. Adequate pregnancy monitoring could have reduced 11.5% of the deaths, and adequate delivery care, 5.1%16,17. In a study performed in the Brazilian Federal District in 1999 and 2000, classifying death according to preventability, Monteiro and Schmitz18 have reported a similar result, with 35.5% of deaths being reducible by means of prevention, diagnosis and early treatment actions18. In a study carried out from 2000 to 2003 in the city of Porto Alegre, where 1,139 deaths occurred, Jobim and Aerts15 reported that 76.6% were classified as preventable. The present study found that 77% of the deaths were considered preventable. A study conducted in the city of Londrina, Paraná state, has assessed two birth cohorts and found that 71.6% of the infant deaths of the 2000-2001 cohort and 65.5% of those of the 2007-2008 cohort were considered preventable19. Another study, carried out in the city of Recife, Pernambuco state, has reported that, from 2000 to 2009, 76.4% of the infant deaths could have been prevented20. Preventable deaths are those that can be reduced through effective actions of health services. They are also considered sentinel events of healthcare quality, their presence indicating a flaw in healthcare. The classification of deaths as preventable is aimed at: monitoring and assessing healthcare services; analyzing temporal trends; comparing indicators between regions; and planning measures for their reduction20. This study showed that 60.9% of pregnant women had a maximum of six prenatal visits, only 39.2% had more than six prenatal visits, and the infants who died due to heart diseases had not been prenatally diagnosed. It is worth noting that, even with prenatal care and obstetrical echography, the prenatal detection rate of heart disease is very low21. In the study by Soares and Menezes7, the number of prenatal visits had a protective effect against early infant mortality. The newborn, whose mother had none or only one to three prenatal visits, had a four-fold increased risk of dying than that whose mother had at least six prenatal visits. In the present study, 60.9% of the pregnant women had a maximum of six prenatal visits, and most of them (41.3%) had four to six visits. Several studies have shown the importance of prenatal care to prevent neonatal morbidity and mortality22,23. Although infant mortality in Brazil has significantly decreased in past decades, the velocity of neonatal death reduction is lower than desired. A significant number of deaths is still part of the Brazilian social and sanitary reality, being due to preventable causes, mainly related to healthcare actions, such as prenatal, delivery and newborn care. The Brazilian Ministry of Health recommends at least six prenatal visits24. The present study identified that 13.4% of the deaths were due to cardiovascular causes, corresponding to an incidence of 1.8 death/1000 live births. There is agreement between that and the incidence reported by several studies with specific populations (2-10/1000 live births)25. However, a study conducted in the Rio Grande do Sul state, screening 3,980 fetuses by use of echography at a reference service from 1996 to 2000, has reported an incidence of 25.8/100026. Another study, performed at a maternity in the Minas Gerais state from 1990 to 2003, has analyzed a data bank with 29,770 deaths and found a heart disease prevalence of 37.2% of live newborns and of 18.7% of stillbirths27. Arq Bras Cardiol. 2015; 104(4):257-265 262 Brum et al. Infant mortality and heart diseases Original Article 18 16.4 16 Infant Mortality Rate (per 1000 live births) 14 13.3 14.2 12.8 12.8 12.7 12 11.2 10 8.9 NH 8 RS 6 4 2 0 2007 2008 2009 2010 Year of assessment Figure 3 – Comparison of infant mortality in the Rio Grande do Sul state (RS) and municipality of Novo Hamburgo (NH) in 2007-2010. Source: Health Secretariat of Rio Grande do Sul State. When analyzing data regarding deaths due to heart diseases and the variables studied, 23.1% of the infants died in the postneonatal period, which might represent a low diagnosis rate of those diseases, which were neither detected during prenatal care nor diagnosed and treated at birth. The gestation of 24.2% of the infants dying due to heart diseases lasted more than 36 weeks, and the birth weight of 26.7% of them was 1500-2499 g. These data evidence that they had neither extremely low birth weight nor extreme prematurity. If diagnosed at an early phase, they could have been referred to a specialized service and properly treated, preventing some deaths. Regarding the limitations of this study, it is worth noting the lack of information in the infant death investigation records (incomplete medical records, family not found) of some cases. For infants born in other municipalities, not all information on death could be obtained, because the Mortality Information System is centralized in the Brazilian Ministry of Health and not provided to the municipalities. Regarding prenatal care, the infant death investigation records provided the number of prenatal visits, but not the gestational trimester of the visit, which limits prenatal care assessment. In addition, infant death investigation records classified the number of prenatal visits as ‘four to six’ or ‘more than six’, hindering the description of the exact number of visits. Such limitations do not invalidate the results of this study, which are in accordance with the literature. 263 Arq Bras Cardiol. 2015; 104(4):257-265 Conclusion Heart diseases were the major cause of infant mortality in this study. The risk factors related to infant mortality and the circumstances under which the deaths occur need to be known. Thus, better planning of healthcare actions specific for local realities will be possible, resulting in a decrease in childhood mortality rates. By reducing preventable deaths, the early identification of complex situations, such as heart diseases, is increasingly needed. Although the Brazilian Ministry of Health recommends at least six prenatal visits, 60.9% of the pregnant women in this study had a maximum of six visits, which did not prevent infant death. Auditing is thus required to assess the quality of prenatal care at basic healthcare units, as well as planning strategies to facilitate the access of pregnant women to healthcare services. Based on the fact that the major causes of infant death in the municipality of Novo Hamburgo could have been reduced by means of actions of diagnosis, prevention and early treatment, it is mandatory to enhance prenatal care, newborn care at hospitals and at basic healthcare units, and to ensure the availability of tests to assess the fetal heart at prenatal visits to avoid deaths due to cardiovascular diseases. Acknowledgements We thank the Health Secretariat of Novo Hamburgo for providing data for this study. Brum et al. Infant mortality and heart diseases Original Article Author contributions Sources of Funding Conception and design of the research:Pellanda LC, Stein AT. Acquisition of data: Brum CA. Analysis and interpretation of the data:Brum CA, Pellanda LC, Stein AT. Statistical analysis: Brum CA, Pellanda LC, Stein AT. Writing of the manuscript: Brum CA, Pellanda LC, Stein AT. Critical revision of the manuscript for intellectual content: Brum CA, Pellanda LC, Stein AT. Study Association There were no external funding sources for this study. This article is part of the dissertation of master submitted by Camila de Andrade Brum, from Instituto de Cardiologia do Rio Grande do Sul/ Fundação Universitária de Cardiologia. Potential Conflict of Interest No potential conflict of interest relevant to this article was reported. References 1. Portal ODM. Acompanhamento Brasileiro dos objetivos de Desenvolvimento do Milênio. [Acesso em 2011 mar 3]. Disponível em: http://www.portalodm. com.br. 15. Jobim R, Aerts D. Mortalidade infantil evitável e fatores associados em Porto Alegre, Rio Grande do Sul, Brasil, 2000-2003. Cad Saude Publica. 2008;24(1):179-87. 2. Instituto Brasileiro de Geografia e Estatística (IBGE). Home. [Acesso em 2011 mar 3]. Disponível em: http://www.ibge.gov.br/home 16. Halpern R, Barros FC, Victora CG, Tomasi E. Atenção pré-natal em Pelotas, Rio Grande do Sul, Brasil, 1993. Cad Saude Publica.1999;14(3):487-92. 3. Ministério da Saúde.Departamento de Informática do SUS. [Acesso em 2011 abr 2]. Disponível em: http://tabnet.datasus.gov.br 17. Ortiz LP. Características da mortalidade neonatal no estado de São Paulo. [Tese]. São Paulo: Faculdade de Saúde Pública da Universidade de São Paulo. 4. Rio Grande do Sul. Secretaria Estadual da Saúde. [Acesso em 2011 abr 2]. Disponível em: http://www.saude.rs.gov.br. 5. Matijasevich A, Santos IS, Barros AJ, Menezes AM, Albernaz EP, Barros FC, et al. Perinatal mortality in three population-based cohorts from Southern Brazil: trends and differences. Cad Saude Publica. 2008;24 (Suppl 3):S399-408. 6. Novaes HM. Informação para tomadores de decisão em saúde pública: gestão para a redução da mortalidade infantil. São Paulo: Bireme/OPAS/ OMS; 2004. 7. Soares ES, Menezes GM. Fatores associados à mortalidade neonatal precoce: análise de situação no nível local. Epidemiol Serv Saúde. 2010;19(1):51-60. 8. Ministério da Saúde. Agenda de compromisso para a saúde integral da criança e redução da mortalidade infantil. Brasília; 2004. 9. Ottersen OP, Dasgupta J, Blouin C, Buss P, Chonqsuvivatwong V, Frenk J, et al. The political origins of health inequity: prospects of change. Lancet. 2014;383(9917):630-67. 10. Della Latta MT. Mortalidade infantil e políticas públicas de saúde em União da Vitória-PR - 1999 a 2007 [tese]. Canoinhas (SC): Universidade do Contestado; 2008. 11. Duarte CM. Reflexos das políticas de saúde sobre as tendências da mortalidade infantil no Brasil: revisão da literatura sobre a última década. Cad Saude Publica. 2007;23(7):1511-28. 12. Minagawa AT, Biagoline RE, Fujimori E, Oliveira IM, Moreira AP, Ortega LD. Baixo peso ao nascer e condições maternas no pré-natal. Rev Esc Enferm USP. 2006;40(4):548-54. 13. Pelegrini ML, Castro JD, Drachler ML. A equidade na alocação de recursos para a saúde: a experiência do estado do Rio Grande do Sul, Brasil. Ciênc Saúde Coletiva. 2005;10(2):275-86. 14. Lansky S, França E, Leal Mdo C. Mortalidade perinatal e evitabilidade: revisão de literatura. Rev Saude Publica. 2002;36(6):759-72. 18. Monteiro RA, Schmitz BA. Principais causas básicas da mortalidade infantil no Distrito Federal, Brasil: 1999 a 2000. Rev Bras Saúde Matern Infant. 2004;4(4):413-21. 19. Santos HG, Andrade SM, Silva AM, Mathias TA, Ferrari LL, Mesas AE. Mortes infantis evitáveis por intervenções do Sistema Único de Saúde: comparação de duas coortes de nascimentos. Cien Saude Colet. 2014;19(3):907-16. 20. do Nascimento SG, de Oliveira CM, Sposito V, Ferreira DK, do Bonfim CV. Mortalidade infantil por causas evitáveis em uma cidade do Nordeste do Brasil. Rev Bras Enferm. 2014;67(2):208-12. 21. Bacaltchuk T, Antunes P, Zyelinski P. Rastreamento pré-natal de anormalidades cardíacas: papel da ultrassonografia obstétrica de rotina. Rev Bras Ginecol Obstet. 2001;23(9):553-8. 22. Ferrari LS, Brito AS, Carvalho AB, Gonzáles MR. Mortalidade neonatal no município de Londrina, Paraná, Brasil nos anos 1994, 1999 e 2002. Cad Saude Publica. 2006;22(5):1063-71. 23. Araújo BF, Bozzetti MC, Tanaka AC. Mortalidade neonatal precoce no município de Caxias do Sul: um estudo de coorte. J Pediatr (Rio J). 2000;76(3):200-6. 24. Ministério da Saúde. Atenção ao pré-natal de baixo risco. Brasília; 2012. 25. Miyague NI, Cardoso SM, Meyer F, Ultramari FT, Araújo FH, Rozkowsk I, et al. Estudo epidemiológico de cardiopatias congênitas na infância e adolescência. Análise em 4.538 casos. Arq Bras Cardiol. 2003;80(3):269-78. 26. Hagemann LL, Zielinsky P. Rastreamento populacional de anormalidades cardíacas fetais por ecocardiografia pré-natal em gestações de baixo risco no município de Porto Alegre. Arq Bras Cardiol. 2004;82(4):313-26. 27. Amorim LF, Pires CA, Lana AM, Campos AS, Aguiar RA, Tibúrcio JD, et al. Presentation of congenital heart disease diagnosed at a birth: analysis of 29,770 newborn infants. J Pediatr (Rio J). 2008;84(1):83-90. Arq Bras Cardiol. 2015; 104(4):257-265 264 Brum et al. Infant mortality and heart diseases Original Article 265 Arq Bras Cardiol. 2015; 104(4):257-265 Back to the Cover Original Article Insulin Resistance, Dyslipidemia and Cardiovascular Changes in a Group of Obese Children António Pires1, Paula Martins1, Ana Margarida Pereira2, Patricia Vaz Silva1, Joana Marinho1, Margarida Marques3, Eduardo Castela1, Cristina Sena2, Raquel Seiça2 Centro Hospitalar e Universitário de Coimbra1; Laboratório de Fisiologia - Instituto Biomédico de Investigação da Luz e Imagem da Faculdade de Medicina da Universidade de Coimbra2; Laboratório de Estatística da Faculdade de Medicina da Universidade de Coimbra - Instituto Biomédico de Investigação da Luz e Imagem3, Coimbra - Portugal Abstract Background: Obesity-related comorbidities are present in young obese children, providing a platform for early adult cardiovascular disorders. Objectives: To compare and correlate markers of adiposity to metabolic disturbances, vascular and cardiac morphology in a European pediatric obese cohort. Methods: We carried out an observational and transversal analysis in a cohort consisting of 121 obese children of both sexes, between the ages of 6 and 17 years. The control group consisted of 40 children with normal body mass index within the same age range. Markers of adiposity, plasma lipids and lipoproteins, homeostasis model assessment-insulin resistance, common carotid artery intima-media thickness and left ventricular diameters were analyzed. Results: There were statistically significant differences between the control and obese groups for the variables analyzed, all higher in the obese group, except for age, high-density lipoprotein cholesterol and adiponectin, higher in the control group. In the obese group, body mass index was directly correlated to left ventricular mass (r = 0.542; p = 0.001), the homeostasis model assessment-insulin resistance (r = 0.378; p ≤ 0.001) and mean common carotid artery intima‑media thickness (r = 0.378; p ≤ 0.001). In that same group, insulin resistance was present in 38.1%, 12.5% had a combined dyslipidemic pattern, and eccentric hypertrophy was the most common left ventricular geometric pattern. Conclusions: These results suggest that these markers may be used in clinical practice to stratify cardiovascular risk, as well as to assess the impact of weight control programs. (Arq Bras Cardiol. 2015; 104(4):266-273) Keywords: Pediatric Obesity; Insulin Resistance; Dyslipidemias; Cardiovascular Diseases. Introduction The growing prevalence of childhood obesity has led to an increased risk of diabetes and cardiovascular diseases in adulthood1,2. One of the most concerning complications of childhood obesity is insulin resistance, considered a precursor of type 2 diabetes mellitus3. In clinical practice, the homeostasis model assessment-insulin resistance (HOMA-IR) is used to diagnose insulin resistance and it is an independent predictor of cardiac pathology in adulthood4. Clinically acanthosis nigricans, a hyperpigmented, brownish velvety lesion, usually found in skin folds, has been related to obesity and insulin resistance5. Mailing Address: Antonio Manuel Pires • Rua Nova do Rossio, 20, Bairo Novo do Rossio, Anca. Postal Code 3060-011, Coimbra – Portugal Email: [email protected] Manuscript received June 13, 2014; revised manuscript September 24, 2014; accepted October 01, 2014 DOI: 10.5935/abc.20140206 266 In adults, common carotid artery intima-media thickness (cIMT) correlates with the incidence of cardiovascular events, and, as such, is considered a useful tool for cardiovascular risk stratification6. Several studies have shown that cIMT is increased in children with cardiovascular risk factors, possibly making it a useful tool for assessing cardiovascular risk in children7,8. Another cardiovascular risk factor is left ventricular mass (LVM)9. As shown by the Bogalusa Heart Study, childhood adiposity is related to LVM in adults, and left ventricular hypertrophy is strongly and independently related to cardiovascular morbidity and mortality10,11. Although left ventricular hypertrophy is rare in obese children, cardiac remodeling might be present, which in adults has also been found to predict adverse cardiovascular outcomes, particularly in hypertensive patients12-15. Dyslipidemia is another cardiovascular risk factor related to obesity. It is estimated that about 42% of obese children have lipid abnormalities, particularly those with visceral obesity16. In these, the most common lipid abnormality pattern consists of elevated triglycerides, decreased high-density lipoprotein cholesterol and normal to mildly elevated low-density lipoprotein cholesterol. Pires et al. Childhood obesity and related comorbidities Original Article Plasma lipoproteins also seem to be of particular importance in the assessment of dyslipidemic patients. Apolipoprotein B reflects the entire spectrum of atherogenic particles. In contrast, apolipoprotein A-I is considered to have anti-atherogenic properties17. Lipoprotein (a) consists of a cholesterol-rich low-density lipoprotein cholesterol particle. In adults, several studies have identified lipoprotein (a) as a risk factor for premature atherosclerotic disease18. In children, it is a potential marker of cardiovascular risk, and, in this context, some authors have found it to be more sensitive than anthropometric measures19. Methods Subjects We carried out an observational and transversal analysis, in a cohort of obese children, recruited randomly from the Cardiovascular Risk Clinic of the Department of Pediatric Cardiology of Coimbra’s Pediatric Hospital, Portugal. This study complied with the Declaration of Helsinki. All parents gave their informed consent, which had been approved by the local Ethics Committee. The inclusion criteria for the study group was primary obesity [body mass index (BMI) above the 95th percentile (P95) for sex and age] in children aged 6 to 17 years, without recent or chronic illnesses. The control group included healthy children within the same age range with normal BMI. All children had undergone a 12-hour fast prior to clinical evaluation and blood sampling. The study group comprised 121 children and the control group, 40 children, of both sexes. The variables analyzed were age, pubertal age, sex, BMI, waist circumference (WC), percentage fat mass (%FM), acanthosis nigricans, cIMT, leptin, adiponectin, insulin, glucose, HOMA-IR, total cholesterol, high-density lipoprotein cholesterol, low-density lipoprotein cholesterol, triglycerides, apolipoprotein A-I, apolipoprotein B, lipoprotein (a), left ventricular end-diastolic diameter (LVED), left ventricular end-systolic diameter (LVSD), interventricular septum diameter (IVS), left ventricular posterior wall diameter (LVPW), left ventricular mass index (LVMI) and LVM, left ventricular relative wall thickness (RWT). Anthropometric and clinical evaluation Acanthosis nigricans was documented as zero (0) if not present and as one (1) if present. Pubertal stage was based on Tanner’s classification and divided into prepubertal (Tanner stage 1) and pubertal (Tanner stage 2-5). Weight (in kilograms to the nearest 100g) was determined using a SECA 220 digital weight scale (Medical Scales and Measuring Systems, Germany) and, for standing height (in centimeters to the nearest 0.1cm), a stadiometer was used, with the children wearing only underwear. BMI was calculated based on the formula: BMI = (weight/height 2)20. Waist circumference (to the nearest 0.1cm) was measured using a plastic flexible tape placed midway between the last rib and the iliac crest. Its percentile was based on published WC charts21. Percentage fat mass was determined by bioelectric impedance using the BIA 101 Anniversary analyzer (AKERN SRL, Italy), and defined according to %FM charts published by McCarthy22. Blood collection and biochemical analysis Serum and plasma were prepared from collected venous blood samples (15 mL) and then frozen (-80°C) for storage until analysis. Insulin levels were determined by chemiluminescence and processed in the IMMULITE 2000 (Siemens Healthcare Diagnostics Products Ltd) analyzer, and glucose levels were analyzed in the VITROS 5.1 FS system (Ortho Clinical Diagnostics, Johnson & Johnson) with Micro Slide TM technology. HOMA-IR was calculated based on the formula: HOMA-IR = insulin (mU/L) x glucose (mmol/L)/22.5, taking 3 as the cutoff value for the diagnosis of insulin resistance. Total cholesterol, high-density lipoprotein cholesterol, low-density lipoprotein cholesterol and triglyceride levels were measured using an automated biochemical VITROS 5.1 FS analyzer (Ortho Clinical Diagnostics, Johnson & Johnson). Apolipoprotein A-I, B and lipoprotein (a) levels were determined by immunonephelometry and processed in the BN ProSpec® System (Siemens Healthcare Diagnostics Inc.) analyzer. Leptin (eBioscience, San Diego, CA, USA) and adiponectin (BioVendor, Brno, Czech Republic) were evaluated using commercially available enzyme-linked immunosorbent assay kits, and the absorbances were measured at 450 nm (BIO-RAD Microplate Reader Model 680, Hercules, CA, USA). Ultrasonography To determine cIMT, we used a General Electric Vivid 7 Dimension (GE, USA) ultrasound system and a linear, high resolution 12-mHz probe and the technique recommended by Mannheim23. In the same ultrasound system, left ventricular diameters were assessed by 2D M-mode echocardiography in the parasternal long axis view with the patient in the left lateral decubitus position, using a high-resolution 3.5-mHz transducer. Left ventricular mass was calculated using Devereux’s formula: 0.8{1.04[LVED+LVPW+IVS) 3- LVED 3]}+0.6. Left ventricular geometry was assessed based on the LVMI (increased if > P95 for sex and age) and the RWT (increased if > 0.41), and classified as follows: normal, if both parameters were within the normal range; concentric remodeling, if RWT was increased and LVMI was normal; concentric hypertrophy, if both parameters were increased; and eccentric hypertrophy, if LVMI was increased and RWT was normal. Statistical analysis Data were analyzed using the IBM SPSS 20 software. To calculate the case and control population sample size, we used the G*Power 3.1.5 program. Based on a 0.05 level of significance, a 0.80 power, a 0.52 effect size, and a control to study group ratio of 3, our study group and our control group had to include 118 and 40 individuals, respectively. Arq Bras Cardiol. 2015; 104(4):266-273 267 Pires et al. Childhood obesity and related comorbidities Original Article Based on the sample size of the variables included in this study, normality was tested using the Kolmogorov-Smirnov or the Shapiro-Wilk analysis. Results To compare the quantitative variables in both groups, Student t test was used, if the distribution was normal, and Mann-Whitney U test, if not. Chi-square test was used for categorical variables. One hundred and twenty-one obese children, 61 boys and 59 girls, with ages between 6 and 17 years (mean age, 11.65 ± 0.432 years) were included in this study. The control group was made up of 40 healthy, non-obese children, 29 boys and 12 girls, within the same age group (mean age, 12.73 ± 0.270 years). To verify the association between quantitative parameters, we used Pearson’s correlation if their distribution was normal, and Spearman’s correlation, if not. Quantitative variables are expressed as mean and respective standard error of the mean, and qualitative variables, as N(%). For multivariate analysis between the two groups, logistic regression was used. The results were considered statistically significant at p < 0.05. Comparative analysis between the two groups We firstly compared the two groups regarding anthropometric, clinical, analytical and ultrasonographic parameters, whose results are shown in Table 1. As age (p = 0.038) and sex (p = 0.027) showed significant statistical differences between the two groups, with higher age in the control group, the analysis was repeated using logistic regression, but adjusted for these parameters. Table 1 – Anthropometric, analytical and ultrasonographic parameters of the obese and non-obese groups Obese Variable Age (years) Non-obese N Mean ± SEM N Mean ± SEM p-value 121 11.65 ± 0.432 40 12.73 ± 0.270 0.038** BMI 121 28.465 ± 0.438 40 18.933 ± 0.429 < 0.001* WC (cm) 121 93.15 ± 1.197 40 68.16 ± 0.861 < 0.001** %FM (%) 121 36.840 ± 0.647 40 18.544 ± 0.526 < 0.001* Leptin (ng/mL) 118 28.973 ± 1.627 40 4.845 ± 0.706 < 0.001 Adiponectin (µg/mL) 95 3.597 ± 0.140 32 5.173 ± 0.413 0.001 HOMA-IR 118 2.81 ± 0.165 33 1.54 ± 0.151 < 0.001** LVED (mm) 121 45.92 ± 0.54 40 44.28 ± 0.97 NS LVSD (mm) 121 29.29 ± 0.43 40 27.34 ± 0.74 < 0.023* IVS (mm) 121 7.21 ± 0.16 40 7.11 ± 0.22 NS PWD (mm) 121 7.51 ± 0.17 40 6.92 ± 0.24 0.045* LVM (g) 121 108.27 ± 3.75 40 95.80 ± 5.46 NS LVMI 121 34.30 ± 0.79 40 28.80 ± 0.99 < 0.001* RWT 121 0.33 ± 0.080 40 0.32 ± 0.012 NS cIMT (mm) 119 0.49 ± 0.005 40 0.44 ± 0.055 0.001** TC (mg/dL) 121 166.86 ± 2.522 40 163.83 ± 5.394 NS LDL-C (mg/dL) 121 96.45 ± 2.44 40 82.71±3.74 0.003* HDL-C (mg/dL) 121 47.33 ± 0.90 40 59.17 ± 2.04 < 0.001** TG (mg/dL) 121 92.33 ± 4.94 40 59.15 ± 4.28 < 0.001** Apo A-I (g/L) 114 1.34 ± 0.018 33 1.47 ± 0.043 0.001* Apo B (g/L) 114 0.74 ± 0.016 33 0.66 ± 0.032 0.016* Lp (a) (mg/dL) 114 27.42 ± 2.56 33 17.6 ± 2.92 0.014* Male N(%) 121 61 (50.8%) 40 29 (70.7%) 0.027* N: sample number; SEM: standard error of the mean; p-value: level of significance; BMI: body mass index; WC: waist circumference; %FM: percent fat mass; HOMA-IR: homeostasis model assessment for insulin resistance; LVED: left ventricular end-diastolic diameter; LVSD: left ventricular end-systolic diameter; IVS: interventricular septum diastolic diameter; PWD: left ventricular diastolic posterior wall diameter; LVM: left ventricular mass; LVMI : left ventricular mass index; RWT: relative wall thickness; cIMT: common carotid artery intima-media thickness; TC: total cholesterol; LDL-C: low-density lipoprotein cholesterol; HDL-C: high-density lipoprotein cholesterol; TG: triglycerides; Apo A-I: apolipoprotein A-I; Apo B: apolipoprotein B; Lp (a): lipoprotein (a); *Student t test; **Mann-Whitney U test. 268 Arq Bras Cardiol. 2015; 104(4):266-273 Pires et al. Childhood obesity and related comorbidities Original Article Left ventricular mass index above the P95 and RWT > 0.41 were seen in 31.7% and 18.3 % of the sample, respectively. Based on these findings we then subdivided left ventricular geometry into three patterns: eccentric hypertrophy (21.7%); concentric hypertrophy (10%); and concentric remodeling (8.3%). On adjusting, the statistical differences remained, but LVED (p < 0.001) and LVM, both higher in the obese group, (p < 0.001) became significant. Analysis of the obese group Concerning the plasma lipids and lipoproteins profile, high-density lipoprotein cholesterol was the only variable that was inversely, but weakly correlated to BMI (r= -0.30; p < 0.01) and WC (r = -0.26; p < 0.01). Percentage fat mass did not show any significant correlation to plasma lipid and lipoprotein levels. In the obese group, we firstly analyzed the influence of sex and age group (pre- and adolescence) on these variables. Regarding sex, leptin (p = 0.001) and adiponectin (p = 0.04) were significantly higher in girls, and LVED (p = 0.023), LVM (p = 0.011) and LVMI (p = 0.044) were significantly higher in boys. Analysis by age group showed statistically significant differences for LVED (p < 0.001), LVSD (p < 0.001), IVS (p = 0.008) and LVPW (p < 0.001), higher in the pre‑adolescent group, and BMI (p < 0.001), WC (p < 0.001), triglycerides (p = 0.014) and adiponectin (p = 0.010), higher in the adolescent group. Body mass index was directly, but weakly correlated to leptin (r = 0.39; p < 0.001), cIMT (r = 0.21; p = 0.026) and HOMA‑IR (r = 0.38; p < 0.001). Waist circumference was directly, but weakly correlated to leptin (r = 0.34; p < 0.001), cIMT (r = 0.19; p = 0.047) and HOMA-IR (r = 0.36; p < 0.001). Percent fat mass was directly, but weakly correlated to leptin (r = 0.29; p = 0.002) and HOMA-IR (r = 0.36; p < 0.001). Acanthosis nigricans was found in 62% of the obese population (0% in the non-obese group). In the pre-adolescent group, males were more affected (53.7% vs 48.5% in females) and, in the adolescent group, females predominated (51.5% vs 46.3% in males). The HOMA-IR was inversely correlated to high-density lipoprotein cholesterol (r = -0.2999; p = 0.002) and directly, but weakly, correlated to triglyceride levels (r = 0.25; p = 0.006). We then used Pearson’s correlation to establish the association between the indices of adiposity and insulin resistance, dyslipidemia, cIMT and LVMI. In this study, 38.1% of our population was considered insulin resistant, 68.9% had acanthosis nigricans, higher than the non-insulin resistant group (31.1%), although this difference was not statistically significant (p = 0.515). Girls and adolescents represented 60% and 62.2% of the insulin resistant group, the statistical differences being non‑significant (p = 0.088 and p = 0.221, respectively). Regarding the echocardiographic data, as demonstrated in Table 2, BMI was directly and moderately correlated to LVED (r = 0.54; p < 0.001) and LVSD (r = 0.46; p < 0.001), as well as to LVM (r = 0.54; p < 0.001), and less so to LVPW (r = 0.34; p < 0.001), IVS (r = 0.19; p = 0.034) and LVMI (r = 0.26; p < 0.001). Waist circumference showed a similar pattern, whereas %FM was not correlated to any of these parameters. The RWT was not correlated to these indices. The cIMT was directly correlated to LVM (r = 0.21; p = 0.019), LVED (r = 0.30; p = 0.001) and LVSD (r = 0.30; p = 0.001). Table 2 – Correlations between body mass index, waist circumference and percentage fat mass with the echocardiographic parameters, leptin, common carotid artery intima-media thickness and insulin resistance in the obese group BMI (Kg/m2) Variable WC (cm) %FM (%) Pearson correlation p-value Pearson correlation p-value Pearson correlation p-value LVED (mm) 0,54** < 0.001 0.53** < 0.001 -0.05 0.593 LVSD (mm) 0.46** < 0.001 0.47** < 0.001 -0.06 0.497 IVS (mm) 0.20* 0.034 0.16 0.103 0.16 0.082 PWD (mm) 0.34** < 0.001 0.32** 0.001 0.14 0.124 LVM (g) 0,54** < 0.001 0,52** < 0.001 0.09 0.324 LVMI 0.26** < 0.001 0.10 0.298 0.09 0.311 RWT 0.06 0.508 0.05 0.578 0.17 0.064 cIMT (mm) 0.21* 0.025 0.19* 0.047 0.03 0.725 Leptin (ng/mL) 0.34** < 0.001 0.34** < 0.001 0.29** 0.002 Adiponectin (µg/mL) 0.18* 0.046 0.27** 0.004 0.22** 0.016 HOMA-IR 0.38** < 0.001 0.36** < 0.001 0.35** < 0.001 BMI: body mass index; WC: waist circumference; %FM: percent fat mass LVED: left ventricular end-diastolic diameter; LVSD: left ventricular end-systolic diameter; IVS: interventricular septum diameter; PWD: left ventricular posterior wall diameter; LVM: left ventricular mass; LVMI:left ventricular mass index; RWT: relative wall thickness; cIMT: common carotid artery intima-media thickness; HOMA-IR: homeostasis model assessment for insulin resistance; correlation is significant at the *0.05 level and at the ** 0.01 level (2-tailed). Arq Bras Cardiol. 2015; 104(4):266-273 269 Pires et al. Childhood obesity and related comorbidities Original Article Discussion We have demonstrated that there are statistically significant differences between the obese and control groups for the variables analyzed and that adiposity has a clear impact on insulin resistance, dyslipidemia, cIMT and LVM in obese children. Insulin resistance in childhood is predictive of insulin resistance in adult life. It is the most common metabolic abnormality related to obesity and is strongly linked to type 2 diabetes and cardiovascular disorders24,25. Based on the HOMA-IR results, 38% of the obese group individuals were considered insulin resistant. None had type 2 diabetes. In our study the prevalence of insulin resistance is lower than that published (50%-70%)26. This discrepancy may be due to the different HOMA-IR cutoff values used in the various reports to diagnose insulin resistance, as standardized cutoff value has not been put forward27. The association between obesity and acanthosis nigricans has been well documented. The overall prevalence is 62%, similar to that found in our group of obese children (65%), mainly in boys (70.5%). As insulin is related to acanthosis nigricans, some authors have proposed it as a reliable marker of hyperinsulinemia, and hence, insulin resistance28. As expected, we found insulin to be significantly correlated to acanthosis nigricans; however, we failed to establish an association between acanthosis nigricans and insulin resistance, as one third of our obese children with insulin resistance had no evidence of acanthosis nigricans. This observation is consistent with some results published29. Clearly, in our experience, acanthosis nigricans was not a reliable marker of insulin resistance, and, thus, should not be used as a screening marker for type 2 diabetes in obese children, as proposed by some authors5. Nevertheless, as a clinical sign in the context of obesity, it ought to alert clinicians to the underlying pathophysiological mechanisms of insulin resistance and act accordingly. In fact, our observations led to the conclusion that insulin resistance was mostly related to %FM, BMI, WC and leptin, and inversely related to high-density lipoprotein cholesterol. These findings mirror the most important factors related to insulin resistance, namely the interplay between adiposity, adipokines and dyslipidemia. Dyslipidemia was also a prominent cardiovascular risk factor found in our study population, particularly when compared to our control group. Considering the values proposed by the National Cholesterol Education Program Expert Panel on Cholesterol Levels in Children30, 45% had intermediate-high to high levels of triglycerides, 42.5% had intermediate-low to low levels of high-density lipoprotein cholesterol and 31% had intermediate-low to low levels of low‑density lipoprotein cholesterol. As a combined dyslipidemia, it represented 12.5% of our sample. This pattern is different from that found in non‑obese children, namely high total and low-density lipoprotein cholesterol levels, and is considered particularly atherogenic as small dense low-density lipoprotein particles are inefficiently cleared by low-density lipoprotein receptors, elevated total low-density lipoprotein levels increase the risk of entrapment in the subendothelial matrix, and decreased levels of high-density lipoprotein particles limit 270 Arq Bras Cardiol. 2015; 104(4):266-273 reverse cholesterol transport. As observed in our study, insulin resistance was inversely correlated to high-density lipoprotein cholesterol but not to low-density lipoprotein cholesterol, potentially contributing to the mechanisms that trigger early onset atherosclerosis and, hence, cardiovascular disease in young adults. Research shows that this combined dyslipidemia pattern is increasing in prevalence and predicts vascular dysfunction in young adults and early clinical events in adult life. We also compared apolipoprotein A-I, B and lipoprotein (a) between the two groups. Although the obese group undoubtedly had a more atherogenic profile [higher apolipoprotein B and lipoprotein (a) and lower apolipoprotein A-I], none of these variables correlated to insulin resistance. Individually, apolipoprotein B was weakly correlated to leptin (r = 0.33; p < 0.001), apolipoprotein A-I was inversely, but weakly, correlated to BMI (r = -0.19; p = 0.042), and lipoprotein (a) to BMI (r = 0.22; p = 0.019) and leptin (r = 0.21; p = 0.029). Unlike Cunnigham et al19, which found lipoprotein (a) to be a useful cardiovascular risk marker in children, we did not come to the same conclusion, possibly due to differences in population ethnicity. In fact, based on these findings, it appears that plasma lipoproteins do not offer an advantage over lipoprotein cholesterol measures in the management of dyslipidemias and risk stratification during childhood, at least in our population. Along the same lines, studies in obese adults with insulin resistance have concluded that plasma lipoproteins do not provide further prognostic information when compared to the standard lipoprotein cholesterol profile. The atherogenicity induced by insulin resistance and lipid abnormalities during childhood result in structural vascular changes that can be assessed non-invasively by ultrasonography of the cIMT. This variable has been validated as a cardiovascular risk marker in children and adults, although in obese children, observations have not always been consensual31. We sought to correlate cIMT with other cardiovascular risk markers and its usefulness as a surrogate of preclinical atherosclerosis. Contrary to the findings by Tounian et al32, in our analysis, cIMT was significantly higher (p<0.001) in the obese group. In this group, multivariate analysis demonstrated that the most significant correlations were with age (r= 0.26; p= 0.004), BMI (r=0.21; p=0.025) and WC (r= 0.19; p=0.047), suggesting a direct link between adiposity and cIMT, whereas lipids and lipoproteins were not related. The latter finding does not concur with the observations published by Magnussen et al33, a far larger study, where childhood dyslipidemia was related to an increase in cIMT in adulthood. Most likely our smaller sample size accounts for these differences. We also investigated whether LVM and LVMI were linked to adiposity. Left ventricular mass index was above the P95 in 32% of our obese group. Through multivariate analysis, we were able to show a direct correlation to age, BMI and WC, but, when indexed to height2,7, only BMI remained significantly correlated. This confirms previous observations, and highlights the impact of adiposity on left ventricular dimensions, whose adverse effects are already present in our young obese population, and which are known to Pires et al. Childhood obesity and related comorbidities Original Article track into adulthood. In adults, a LVMI > 51g/m2,7 carries prognostic significance as these individuals are known to be more susceptible to cardiovascular events34,35. We also aimed at addressing the relationship between adiposity and abnormal ventricular geometric patterns. Overall, 40% of our population presented abnormal geometric patterns, the most common being eccentric left ventricular hypertrophy (21.7%). Considering that obesity is characterized by chronic volume overload, this would be the expected pattern; however, several adult studies have shown that, in fact, concentric hypertrophy is the most common ventricular geometric abnormality, even in the absence of arterial hypertension, implying that mechanisms other than volume overload play a role. Based on these results we postulate that volume overload is an important contributing factor, as we found no other relevant associations. Nevertheless, 10% of our population had left ventricular concentric hypertrophy, followed by 8% with concentric left ventricular remodeling. The latter condition, although not related to increased LVMI, has also been shown to be associated with adverse cardiac events and provides another marker for assessing cardiovascular risk in children36. This study has a few limitations, our sample size, particularly the control group, being one. Due to our local population characteristics, our sample included Caucasian children only. Implicitly, these factors may represent a bias. Conclusions In conclusion, we have highlighted indices of adiposity as a common link to adverse metabolic and structural changes patent in obese children. As these track into adulthood, efforts should continue to be made to reverse these changes, aiming at lifestyle modifications, and potentially decreasing the socioeconomic burden of cardiovascular disease in adulthood. Author contributions Conception and design of the research:Pires A, Matins P. Acquisition of data: Pires A, Pereira AM, Silva PV, Marinho J. Analysis and interpretation of the data: Pires A, Sena C, Seiça R. Statistical analysis: Pires A, Marques M, Sena C. Writing of the manuscript: Pires A, Matins P. Critical revision of the manuscript for intellectual content: Pires A, Matins P, Silva PV, Marinho J, Castela E, Sena C, Seiça R. Analysis Procedure: Pereira AM. Potential Conflict of Interest No potential conflict of interest relevant to this article was reported. Sources of Funding There were no external funding sources for this study. Study Association This article is part of the thesis of Doctoral submitted by António Pires , from Faculdade de Medicina da Universidade de Coimbra, Portugal. References 1. Freedman DS, Sirinivasan SR, Valdez RA, Williamson DF, Berenson GS. Secular increases in relative weight and adiposity in children over two decades: the Bogalusa Heart Study. Pediatrics. 1997;99(3):420-6. 9. Malcolm DD, Burns TL, Mahoney LT, Lauer RM. Factors affecting left ventricular mass in childhood: the Muscatine Study. Pediatrics. 1993;92(5):703-9. 2. Must A, Jacques PF, Dallal GE, Bajema CJ, Dietz WH. Long term morbidity and mortality of overweight adolescences: a follow up of the Harvard Growth Study of 1922 to 1935. N Engl J Med. 1992;327(19):1350-5. 10. Li X, Li S, Ulusoy E, Chen W, Srinivasan SR, Berenson GS. Childhood adiposity as a predictor of cardiac mass in adulthood. The Bogalusa Heart Study. Circulation. 2004;110(22):3488-392. 3. 11. Lorell BH, Carabello BA. Left ventricular hypertrophy: pathogenesis, detection and prognosis. Circulation. 2000;102(4):470-9. Akinci G, Akinci B, Coskun S,Bayindir P, Hekimosoy Z, Ozmen B. Evaluation of markers of inflammation, insulin resistance and endothelial dysfunction in children at risk of overweight. Hormones (Athens). 2008;7(2):156-62. 4. Kurtoglu S, Hatipoglu N, Mazuioglu M, Kendirci M, Keskin M, Kondolot M. Insulin resistance in obese children and adolescents: HOMA-IR cut-off levels in the prepubertal and pubertal periods. J Clin Res Ped Endo. 2010;2(3):100-6. 5. Kluczynik CE, Mariz LS, Souza LC, Solano GB, Albuquerque FC, Medeiros CC. Acanthosis nigricans and insulin resistance in overweight children and adolescents. An Bras Dermatol. 2012;87(4):531-7. 6. Polak JF, Pencina MJ, Pencina KM, O’Donnell CJ, Wolf PA, D’Agostino RB. Carotid-wall intima-media thickness and cardiovascular events. N Engl J Med. 2011;365(3):213-21. 7. Jarvisalo MJ, Jartti L, Nanto-Salonen K, Iriala K, Ronnemaa T, Hartiala JJ, et al. Increased carotid artery intima-media thickness: a marker of preclinical atherosclerosis in high risk children. Circulation. 2001;104(24):2943-7. 8. Sorof JM, Alexandrov AV, Garami JL, Turner JL, Grafe RE, Lai D, et al. Carotid ultrasonography for detection of vascular abnormalities in hypertensive children. Pediatr Nephrol. 2003;18(10):1020-4. 12. Khoury PR, Mitsnefes M, Daniels SR, Kimball TR. Age-specific reference intervals for indexed left ventricular mass in children. J Am Soc Echocardiogr. 2009;22(6):709-14. 13. de Simone G, Daniels SR, Devereux RB, Meyer RA, Roman MJ, de Divitiis O, et al. Left ventricular mass and body size in normotensive children and adults: assessment of allometric relations and impact of overweight. J Am Coll Cardiol. 1992;20(5):1251-60. 14. Chirinos JA, Segers P, De Buyzere ML, Kronmal RA, Raja MW, De Bacquer D, et al. Left ventricular mass: allometric Scaling, effect of obesity, and prognostic performance. Hypertension. 2010;56(1):91-8. 15. Daniels SR, Meyer RA, Liang YC, Bove KE. Echocardiographically determined left ventricular mass index in normal children, adolescent and young adults. J Am Coll Cardiol. 1988;12(3):703-8. 16. Cook S, Kavey RE. Dyslipidemia and pediatric obesity. Pediatr Clin North Am. 2011;58(6):1363-73. Arq Bras Cardiol. 2015; 104(4):266-273 271 Pires et al. Childhood obesity and related comorbidities Original Article 17. Srinivasan SR, Berenson GS. Serum apolipoproteins A-I and B as markers of coronary heart disease risk in early life: the Bogalusa Heart Study. Clin Chem. 1995;41(1):159-64. 18. Nordestgaard BG, Chapman MJ, Ray K, Boren J, Andreotti F, Watts GF, et al; European Atherosclerosis Society Consensus Panel. Lipoprotein (a) as a cardiovascular risk factor: current status. Eur Heart J. 2010;31(23):2844-53. 19. Cunningham TE, Sayers SM, Singh GR. Lipoprotein(a) identifies cardiovascular risk in childhood: the Australian Aboriginal Birth Cohort Study. J Paediatr Child Health. 2011;47(5):257-61. 20. Butte NF, Garza C, de Onis M. Evaluation of the feasibility of international growth standards for school-aged children and adolescents. J Nutr. 2007;137(1):153-7. 21. Fernandez JR, Redden DT, Pietrobelli A, Allison DB. Waist circumference percentiles in nationally respresentative samples of African-American, European-American, and Mexican-American children and adolescents. J Pediatr. 2004;145(4):439-44. 22. McCarthy HD, Cole TJ, Fry T, Jebb SA, Prentice AM. Body fat reference curves for children. Int J Obes (Lond). 2006;30(4):598-602. 23. Touboul PJ, Hennerici MG, Meairs S, Adams H, Amarenco P, Bornstein N, et al. Mannheim carotid intima-media consensus (2004-2006). An update on behalf of the Advisory Board of the 3rd and 4th Watching the Risk Symposium, 13th and 15th European Stroke Conferences, Mannheim, Germany, 2004, and Brussels, Belgium, 2006. Cerebrovasc Dis. 2007;23(1):75-80. 24. Milani RV, Lavie CJ, Mehra MR, Ventura HO, Kurtz JD, Messerli FH. Left ventricular geometry and survival in patients with normal left ventricular ejection fraction. Am J Cardiol. 2006;97(7):959-63. 25. Lang RM, Bierig M, Devereux RB, Flachskampf FA, Foster E, Pellikka PA, et al; American Society of Echocardiography’s Nomenclature and Standards Committee; Task Force on Chamber Quantification; American College of Cardiology Echocardiography Committee; American Heart Association; European Association of Echocardiography, European Society of Cardiology. Recommendations for chamber quantification. Eur J Echocardiogr. 2006;7(2):79-108. 272 Arq Bras Cardiol. 2015; 104(4):266-273 26. Chiarelli F, Marcovecchio ML. Insulin resistance and obesity in childhood. Eur J Endocrinol. 2008;159 Suppl 1:S67-74. 27. Ascaso JF, Pardo S, Real JT, Lorente RI, Priego A, Carmena R. Diagnosing insulin resistance by simple quantitative methods in subjects with normal glucose metabolism. Diabetes Care. 2003;26(12):3320-5. 28. Viner RM, Segal TY, Lichtarowicz-Krynska E, Hindmarsh P. Prevalence of the insulin resistance syndrome in obesity. Arch Dis Child. 2005;90(1):10-4. 29. Hirschler V, Aranda C, Oneto A, Gonzalez C, Jadzonsky M. Is acanthosis nigricans a marker of insulin resistance in obese children? Diabetes Care. 2002;25(12):2353. 30. National Cholesterol Education Program (NCEP): highlights of the report of the expert panel on blood cholesterol levels in children and adolescents. Pediatrics. 1992;89(3):495-501. 31. Iannuzzi A, Licenziati MR, Acampora C, Salvatore V, Auriemma L, Romano ML. Increased carotid intimal-media thickness and stiffness in obese children. Diabetes Care. 2004;27(10):2506-8. 32. Tounian P, Aggoun Y, Dubern B, Varille V, Guy-Grand B, Sidi D, et al. Presence of increased stiffness of the common carotid artery and endothelial dysfunction in severely obese children: a prospective study. Lancet. 2001;359(9291):1400-4. 33. Magnussen CG, Venn A, Thomson R, Juonala M, Viikari JS, Berenson GS, et al. The association of pediatric low and high-density lipoprotein cholesterol dyslipidemia classifications and change in dyslipidemia status with carotid intima-media thickness in adulthood evidence from the cardiovascular risk in Young Finns study, the Bogalusa Heart study, and the CDAH (Childhood Determinants of Adult Health) study. J Am Coll Cardiol.2009;53(10):860-9. 34. Kharod AM, Ramlogan SR, Kumar S, Raqhuveer T, Drake W, Dai H, et al. Childhood obesity increases left ventricular mass irrespective of blood pressure status. Pediatr Cardiol. 2014; 35(2):353-360. 35. Maggio AB, Aggoun Y, Marchand LM, Martin XE, Hermann F, Beghetti M, et al. Associations among obesity, blood pressure and left ventricular mass. J Pediatr. 2008;152(4):489- 93. 36. Abel ED, Litwin SE, Sweeney G. Cardiac remodeling in obesity. Physiol Rev. 2008;88(2):389-419. Pires et al. Childhood obesity and related comorbidities Original Article Arq Bras Cardiol. 2015; 104(4):266-273 273 Back to the Cover Original Article Subclinical Ventricular Dysfunction Detected by Speckle Tracking Two Years after Use of Anthracycline André Luiz Cerqueira de Almeida1,2, Viviane Almeida Silva2, Alberto Teófilo de Souza Filho2, Vinicius Guedes Rios2, João Ricardo Pinto Lopes2, Samuel Oliveira de Afonseca3, Daniel de Castro Araújo Cunha1, Murilo Oliveira da Cunha Mendes1, Danilo Leal Miranda1, Edval Gomes dos Santos Júnior1,2 Universidade Estadual de Feira de Santana1; Hospital Dom Pedro de Alcântara da Santa Casa de Misericórdia de Feira de Santana2; Unidade de Alta Complexidade em Oncologia (UNACON)3, Feira de Santana, BA - Brazil Abstract Background: Heart failure is a severe complication associated with doxorubicin (DOX) use. Strain, assessed by two-dimensional speckle tracking (2D-STE), has been shown to be useful in identifying subclinical ventricular dysfunction. Objectives: a) To investigate the role of strain in the identification of subclinical ventricular dysfunction in patients who used DOX; b) to investigate determinants of strain response in these patients. Methods: Cross-sectional study with 81 participants: 40 patients who used DOX ±2 years before the study and 41 controls. All participants had left ventricular ejection fraction (LVEF) ≥55%. Total dose of DOX was 396mg (242mg/m²). The systolic function of the LV was evaluated by LVEF (Simpson), as well as by longitudinal (εLL), circumferential (εCC), and radial (εRR) strains. Multivariate linear regression (MLR) analysis was performed using εLL (model 1) and εCC (model 2) as dependent variables. Results: Systolic and diastolic blood pressure values were higher in the control group (p < 0.05). εLL was lower in the DOX group (-12.4 ±2.6%) versus controls (-13.4 ± 1.7%; p = 0.044). The same occurred with εCC: -12.1 ± 2.7% (DOX) versus -16.7 ± 3.6% (controls; p < 0.001). The S’ wave was shorter in the DOX group (p = 0.035). On MLR, DOX was an independent predictor of reduced εCC (B = -4.429, p < 0.001). DOX (B = -1.289, p = 0.012) and age (B = -0.057, p = 0.029) were independent markers of reduced εLL. Conclusions: a) εLL, εCC and the S’ wave are reduced in patients who used DOX ±2 years prior to the study despite normal LVEF, suggesting the presence of subclinical ventricular dysfunction; b) DOX was an independent predictor of reduced εCC; c) prior use of DOX and age were independent markers of reduced εLL. (Arq Bras Cardiol. 2015; 104(4):274-283) Keywords: Heart Failure; Ventricular Dysfunction Left / chemically induced; Echocardiography; Anthracyclines / adverse effects. Introduction Cardiovascular and oncologic disorders are the most prevalent diseases and the main global causes of morbidity and mortality. Together they are associated with more than 70% of the death causes worldwide1. Treatment of cancer has been conducted with a combination of chemotherapy, radiotherapy and surgery in an attempt, often successful, to benefit the patient. In recent years, it has been observed a marked increase in average survival in patients with cancer due to, among other causes, a greater effectiveness of antineoplastic drugs, in particular the anthracyclines 2. However, this Mailing Address: André Luiz Cerqueira de Almeida • Rua Alto do Paraguai, 280, S.I.M. Postal Code 44085-232, Feira de Santana, BA – Brazil E-mail: [email protected]; [email protected] Manuscript received June 19, 2014; revised manuscript August 21, 2014; accepted October 08, 2014. DOI: 10.5935/abc.20140209 274 greater effectiveness occurs at the expense of side effects. Both chemotherapy and radiotherapy are associated with cardiotoxic effects and their cardiovascular complications, which manifest as heart failure, myocardial ischemia, myocardial infarction, hypertension, thromboembolism, pericarditis and cardiac arrhythmias3. The combination of increased survival and consequent aging of the population, associated with the cardiotoxicity of the antineoplastic treatment, has led to increased cardiovascular morbidity and mortality in individuals with cancer4. In clinical practice, cardiotoxicity has been identified by symptomatic or asymptomatic left ventricular (LV) dysfunction. The LV ejection fraction (LVEF), estimated by echocardiography or myocardial scintigraphy, is generally used to evaluate the LV function5. This method presents some limitations, including low sensitivity for detection of initial LV injury. Moreover, the failure to detect changes in LVEF does not exclude subclinical cardiac injury, nor the possibility of cardiac deterioration at a later stage6. Almeida et al. Subclinical LV Dysfunction After Use of Anthracycline Original Article Strain, assessed by two-dimensional speckle tracking (2D-STE), is useful in identifying subclinical heart disease in several pathologies7,8, with the ability to identify early (subclinical) cardiac injury during chemotherapy9. The study was approved by the Ethics Committee for Research Involving Human Subjects of our university and all participants signed an Informed Consent Form. The aims of this study are: a) To investigate the role of strain, evaluated by 2D-STE, in identifying subclinical ventricular dysfunction in patients treated with doxorubicin (DOX); b) to investigate determinants of strain response in cancer survivors. Conventional Doppler Echocardiography Methods Research Subjects Patients who completed treatment with DOX in the oncology unit of our hospital between February 2010 and June 2011 and who lived in our city were invited to participate in this cross-sectional study. Through chart review, we collected demographic data, previous medical history, information about use of adjuvant radiation therapy, doses of anthracycline used (total and indexed to body surface area), as well as the dates of beginning and end of treatment. Members of the administrative staff of the hospital without previous history of neoplasia were invited to participate in the study and composed the control group. In these individuals, we collected demographic data and prior medical history. All participants underwent transthoracic echocardiogram with 2D-STE, as well as clinical evaluation with detailed history and physical examination when the following parameters were obtained: weight, height, heart rate, abdominal circumference (AC), body mass index (BMI), and systolic and diastolic blood pressure (BP). Exclusion criteria were presence of heart failure (HF) by Framingham criteria, history of prior cardiovascular disease (except hypertension), any valvular lesion greater than mild, change in segmental contractile function in transthoracic echocardiogram, LVEF < 55% and/ or prior chemotherapy. The AC was measured at the navel level with a standard tape measure. BMI was obtained by the ratio of the weight to the height squared (Kg/m2). BP was measured three times with participants in the sitting position. The average of the two last measurements was included in the analysis. All participants had LVEF ≥ 55% and showed no clinical manifestations of HF by Framingham criteria. Patients with at least two serum glucose levels > 126mg/dL or in use of oral hypoglycemic drugs and/or insulin were classified as diabetics. Hypertensive were participants in use of antihypertensive medication or who presented systolic BP ≥ 140 mmHg and/or diastolic BP ≥ 90 mmHg on at least two occasions. Patients with dyslipidemia had total cholesterol > 200 mg/dL and/or LDL cholesterol > 130 mg/dL. Smokers were individuals who continued smoking or had left the habit less than 10 years before. Alcohol consumption was categorized in absent, eventual, weekly, or daily. The race of the participants was classified according to self-reported information as white, brown, yellow or black. Physical activity was defined as the practice of exercises at least three times a week, with a minimum duration of 30 minutes per session. Echocardiographic images were obtained by experienced echocardiographers (ALCA, VAS, ATSF and VGR) and were interpreted by a single examiner (ALCA). The tests were carried out on the equipment Artida (Toshiba Medical Systems Corp., Tochigi, Japan). All images were digitalized and stored for later analysis. Doppler echocardiographic images were acquired following the recommendations of the American Society of Echocardiography10. The LV mass was determined by the diastolic thickening of the septum, the LV posterior wall, and the LV end-diastolic diameter, and indexed to body surface area, generating the variable LV mass index (LVMI)11. LVEF was calculated using the modified (biplane) Simpson's rule. The transmitral early diastolic flow velocity (E wave) and late diastolic flow velocity (A wave), as well as the deceleration time were measured using conventional pulsed Doppler. Tissue Doppler evaluates the longitudinal excursion of the mitral ring during systole and diastole. Tissue Doppler velocities were assessed in the four basal segments of the LV in the apical 4-chamber and 2-chamber views, with an angle smaller than 200 between the ultrasound beam and the plane of cardiac motion. We measured the peak systolic (S' wave), early diastolic (E' wave) and late diastolic (A´ wave) velocities. The final result of each of these variables consisted on the average of the values found in the four analyzed segments. The volume of the left atrium (LA) was measured by two-dimensional planimetry using the biplane Simpson's rule in the frame that preceded the opening of the mitral valve, and was indexed to body surface generating the variable left atrial volume index (LAVI)10. Two-Dimensional Speckle Tracking Echocardiography The two-dimensional images were acquired in the short axis of the LV, at the level of the insertion of the papillary muscles, and in the apical 4-chamber and 2-chamber views. They were recorded using a sectorial transducer (frequency range 1.7 to 3.5 MHz) with harmonic imaging, pulse repetition frequency between 40 and 80 cycles/second, maintaining a single focus in the central region of the LV, regulating the sector width (narrowest possible), depth (minimum possible) and the gain to optimize the quality of the two-dimensional image. Longitudinal (ε LL ), circumferential (ε CC ) and radial (ε RR) strains were analyzed with the two-dimensional speckle tracking software by Toshiba (Toshiba 2D Wall Motion Tracking software, Toshiba Medical Systems). Manual delineation of the endocardial border of the LV at end-systole (determined anti-clockwise) was followed by automatic tracing of the epicardial border (which could be manually adjusted) and of a line in the middle region of the LV wall12. A similar approach was made on the apical 4-chamber image, starting the trace on the lateral corner of the mitral valve ring at end-diastole, and in the apical Arq Bras Cardiol. 2015; 104(4):274-283 275 Almeida et al. Subclinical LV Dysfunction After Use of Anthracycline Original Article 2-chamber image (beginning the trace at the junction of the inferior wall with the mitral ring at end-diastole). The software 2D-STE uses the sum of the differences of the squares to find the dot pattern (speckles) most similar to the one obtained in the two-dimensional model in two subsequent cycles (frames)13. Strain (ε, %) was calculated as the change in regional length relative to the length at end-diastole: ε = (L(t) – L0) x 100/0L, in which L(t) is the length at time t and L0 is the length of the segment at the beginning of the QRS segment. Global εLL (Figure 1), global εCC (Figure 2) and global εRR were represented by the peak of the strain averages, and the values of the longitudinal and circumferential strains were those representative of the middle region of the myocardium. Since εLL and εCC reflect shortening of the myocardial segment analyzed, the more negative its value, the greater will be the myocardial deformation relative to the state observed at end-diastole. The regions of the LV short axis and the projections in 4 and 2 chambers were divided according to the recommendations by the American Society of Echocardiography14. Segments of the LV with inadequate image quality were excluded from the analysis due to the presence of acoustic shadows, image artifacts, reverberations or poor quality in the trace of the points by manual evaluation. Figure 1 – Representation of longitudinal strain. 276 Arq Bras Cardiol. 2015; 104(4):274-283 Reproducibility All echocardiographic measurements were performed offline by a single blinded examiner (ALCA). The intraobserver reproducibility for εLL and εCC was evaluated by repeating the measurements in 20 randomly selected participants, with a minimum interval of 30 days from the first test. Statistical Analysis Quantitative variables were expressed as mean ± standard deviation and compared by Student's t test or Wilcoxon signedrank test, whereas qualitative variables were expressed by their frequencies and percentages, and compared by the chi-square test or Fisher's exact test. Univariate analysis was used to evaluate the relationship between εCC and εLL with the variables of interest. Two stepwise multivariate linear regression (MLR) models were created. The dependent variables in models 1 and 2 were εLL and εCC, respectively. We considered as independent those variables with p < 0.20 in the univariate analysis and those with biological plausibility of interference with the strain. Intraobserver variability was assessed by the intraclass correlation coefficient. The level of significance was defined as p < 0.05. The statistical analyses were processed with the software Statistical Package for the Social Sciences, version 17.0 (SPSS Inc., Chicago, Illinois). Almeida et al. Subclinical LV Dysfunction After Use of Anthracycline Original Article Figure 2 – Representation of circumferential strain. Results Cohort Characteristics The main clinical characteristics of the study population are shown in Table 1. Only female patients accepted to participate in the study and reported to the unit for evaluation. Fifty-one women who had used DOX 25.5 ± 4.7 months before the study (median: 24 months; interquartile range [IQR]: 22 to 28 months) comprised the group of patients. Eleven were excluded from the analysis: six due to LVEF < 55%, three had previously undergone chemotherapy and two had echocardiography with inadequate technical quality for analysis. The average age of the patients included in the analysis was 52 ± 11 years. One had history of nonHodgkin lymphoma and 39 of breast neoplasm. The control group was composed of 42 women from the administrative staff of the hospital, without previous history of neoplasia. One was excluded due to LVEF < 55%. The average age of the patients in the control group was 56 ± 10 years. There was no difference between the two groups regarding the percentage of patients with hypertension, diabetes, blacks, smokers and alcohol consumption. Age, AC, BMI and LVMI were similar (p > 0.05 for all). Systolic and diastolic BP values were higher in the control group (p = 0.028 and 0.027, respectively). The average total dose of DOX received was 396 ± 85 mg, which corresponded to 242 ± 43 mg/m². None of the patients received trastuzumab. Fifteen patients (37.5%) also used 5-fluorouracil and 31 (77.5%) received cyclophosphamide. Twenty-one patients (52.5%) underwent adjuvant radiation therapy, which was applied to the right side in 13 (32.5%) patients and to the left side in 8 (20%) patients. Conventional Doppler Echocardiographic Variables The LVEF was normal and showed no difference between the groups: 65.3 ± 4.8% (patients) versus 66.7 ± 4.3% (controls; p = 0.18). The same occurred with LVMI: 75 ± 15 g/m2 (patients) versus 71 ± 16 g/m2 (controls; p=0.34). The absolute diameter of the LA was greater in the control group (p = 0.006). However, there was no difference when LA was indexed to body surface area (p = 0.11), nor when we assessed the LAVI (p = 0.58). The average S' wave velocity on tissue Doppler was higher in controls (6.6 ± 0.9cm/s) when compared with patients (6.1 ± 1.0cm/s; p = 0.035). This was mainly due to the increased velocity of the S' wave side corner of the mitral ring (7.1 ± 1.0cm/s versus 6.3cm/s; p = 0.004). The velocity of the E and E' waves, the mitral flow deceleration time, as well as the relationships E/A and E/E´ were similar between the groups, without difference regarding the results of the LV diastolic function. All other conventional echocardiographic variables were similar between groups (Table 2). Arq Bras Cardiol. 2015; 104(4):274-283 277 Almeida et al. Subclinical LV Dysfunction After Use of Anthracycline Original Article Table 1 – Characteristics of the study cohort Variable Doxorubicin (N = 40) Controls (N = 41) p value Total dose of doxorubicin 396 mg (242 mg/m²). - - 52 ± 11 56±9 0.11 35 39 0.71 10.0 9.8 1 33 41 0.40 Age (years) Hypertension (%) Diabetes (%) Dyslipidemia (%) Race - black (%) 77.5 82.1 0.76 Smoking (%) 22.5 29.3 0.22 Alcohol consumption (%) Abdominal circumference (cm) 27.5 19.5 0.34 93 ± 14 95 ± 9 0.35 BMI (Kg/m²) 25.8 ± 5.3 27.3 ± 3.8 0.15 Body surface area (m2) 1.70 ± 0.21 1.75 ± 0.20 0.30 Systolic BP (mmHg) 130 ± 21 141 ± 22 0.028 Diastolic BP (mmHg) 80 ± 14 87 ± 12 0.027 BMI: body mass index; BP: blood pressure. Table 2 – Characteristics of conventional Doppler echocardiography Variable Aortic root (mm) LA (mm) LA/BSA (mm/m2) Doxorubicin (N = 40) Controls (N = 41) p value 30 ± 3 31 ± 3 0.34 33 ± 3 35 ± 4 0.006 19.3 ± 2.2 20.1 ± 2.1 0.11 LVDD (mm) 46 ± 4 47 ± 4 0.87 LVSD (mm) 30 ± 3 30 ± 3 0.94 Septum (mm) 8±1 8±1 0.44 LVPW (mm) 8±1 8±1 0.36 LVEF (%, Simpson) 65 ± 5 67 ± 4 0.18 LVMI (g/m²) 75 ± 15 71 ± 16 0.34 LAVI (mm) 22 ± 5 21 ± 6 0.58 Mitral E wave (cm/s) 67 ± 15 73 ± 14 0.06 Mitral A wave (cm/s) 71 ± 19 73 ± 18 0.52 E/A Ratio 1.0 ± 0.3 1.0 ± 0.3 0.68 DT 181 ± 41 176 ± 31 0.56 Mitral E' wave (cm/s) 8.9 ± 2.5 9.5 ± 2.3 0.30 Mean S' wave (cm/s) 6.1 ± 1.0 6.6 ± 0.9 0.035 E/E' Ratio 8.0 ± 2.7 8.2 ± 2.5 0.78 LA: left atrium; BSA: body surface area; LVDD: left ventricular diastolic diameter; LVSD: left ventricular systolic diameter; LVPW: left ventricular posterior wall; LVEF: left ventricular ejection fraction; LVMI: left ventricular mass index; LAVI: left atrial volume index; DT: deceleration time. εLL, εCC and εRR Obtained by Two-Dimensional Speckle Tracking Even though the LVEF was normal and showed no difference between groups, the εLL in the patients' group was -12.4 ± 2.6%, representing values 7.5% lower than 278 Arq Bras Cardiol. 2015; 104(4):274-283 the corresponding values for the controls (-13.4 ± 1.7%; p = 0.04; Table 3). εCC was -12.1 ± 2.7% in patients, representing a reduction of 27.5% compared with controls (-16.7 ± 3.6%; p < 0.001). There was no difference between the groups with respect to εRR (p = 0.89). Almeida et al. Subclinical LV Dysfunction After Use of Anthracycline Original Article There was no correlation between the dose of DOX and the strain (DOX versus εLL: p = 0.89; DOX versus εCC: p = 0.95). Intraobserver intraclass correlation coefficient was 0.89 (p < 0.01) for εLL and 0.83 (p = 0.01) for εCC. Determinants of Longitudinal Strain In model 1 of the MLR analysis, previous use of DOX (B = -1.289; 95% confidence interval [CI]: -2.282 to -0.296; p = 0.012) and the age in years (B = -0.057; 95% CI: -0.108 to -0.006; p = 0.029) were the only independent predictors of ε LL (Table 4). Determinants of Circumferential Strain In model 2 of the MLR, previous use of DOX was the only independent predictor of reduction in εCC after adjustments for LVMI, presence of dyslipidemia, age, prior radiotherapy and systolic BP (B = -4.429; 95% CI: -5.907 to -2.952; p < 0.001; Table 5). Discussion The results of this study show that εLL and εCC, evaluated by 2D-STE, are reduced in patients who used DOX 2 years before when compared with healthy controls. This occurred even though the LVEF was normal and did not differ between the groups, suggesting the presence of subclinical ventricular dysfunction in a group considered at high risk for cardiovascular events. Our results also showed that previous use of DOX was an independent predictor of reduction of εCC in cancer survivors, and that previous use of DOX and age were independent markers of reduced εLL in this population. The S' wave, another echocardiographic variable able to identify preclinical changes in LV systolic function, was also reduced in patients who used the anthracycline. With the global trend of population aging, the risk factors for cardiovascular disease will become more prevalent. It is therefore expected that there will be an increase in the occurrence of heart disease. Likewise, there is an increase Table 3 – Strain results in the study population Variable Doxorubicin (N = 40) Controls (N = 41) p value εLL (%) -12.4 ± 2.6 -13.4 ± 1.7 0.04 εCC (%) -12.1 ± 2.7 -16.7 ± 3.6 < 0.001 εRR (%) 30.9 ± 10.4 31.2 ± 10.4 0.89 εLL: longitudinal strain; εCC: circumferential strain; εRR: radial strain Table 4 – Determinants of longitudinal strain Dependent Variable: εLL Independent Variables Univariate Analysis Multivariate Analysis (p = 0.011) B Coef (%) 95% CI p value B Coef (%) 95% CI p value Doxorubicin (Yes) -1.02 (-2.006;-0.038) 0.042 -1.289 (-2.282;-0.296) 0.012 Age (years) -0.052 (-0.102;0.002) 0.044 -0.057 (-0.108;-0.006) 0.029 LV mass index (g/m²) -0.008 (-0.041;0.025) 0.616 - - 0.867 Diabetes (Yes) -0.561 (-2.232;1.110) 0.506 - - 0.65 Obesity (Yes) -0.775 (-1.945;0.395) 0.191 - - 0.246 Systolic BP (mmHg) 0.004 (-0.019;0.028) 0.716 - - 0.842 Prior radiotherapy (Yes) -0.401 (-1.560;0.758) 0.493 - - 0.953 Alcohol (Yes) 0.424 (-0.662;1.512) 0.440 - - - Smoking (Yes) 0.350 (-0.599;1.298) 0.465 - - - Race (Black) 0.583 (-0.827;1.994) 0.412 - - - Physical activity (Yes) 0.230 (-0.914;1.373) 0.690 - - - Abdominal circumference (cm) -0.021 (-0.064;0.022) 0.340 - - - BMI (Kg/m²) -0.051 (-0.159;0.057) 0.347 - - - Hypertension (Yes) -0.501 (-1.552;0.550) 0.345 - - - LV: left ventricle; BP: blood pressure; BMI: body mass index; Coef: coefficient; CI: confidence interval. Arq Bras Cardiol. 2015; 104(4):274-283 279 Almeida et al. Subclinical LV Dysfunction After Use of Anthracycline Original Article Table 5 – Determinants of circumferential strain Dependent Variable: εCC Independent Variables Univariate Analysis Multivariate Analysis (p < 0.001) B Coef (%) 95% CI p value B Coef (%) 95% CI p value Doxorubicin (Yes) -4.539 (-6.010;-3.067) < 0.001 -4.429 (-5.907;-2.952) < 0.001 Dyslipidemia (Yes) -1.077 (-2.921;0.767) 0.248 - - 0.065 LV mass index (g/m²) 0.012 (-0.047;0.071) 0.688 - - 0.206 Prior radiotherapy (Yes) -3.237 (-5.119;-1.354) 0.001 - - 0.851 - - Age (years) 0.04 (-0.05;0.14) 0.349 BMI (Kg/m²) -0.056 (-0.265;0.152) 0.591 0.928 Systolic BP (mmHg) 0.026 (-0.017;0.069) 0.235 - - 0.651 Diabetes (Yes) 0.703 (-2.247;3.653) 0.636 - - - Smoking (Yes) 0.157 (-1.510;1.823) 0.852 - - - 0.124 Alcohol (Yes) -0.168 (-2.126;1.790) 0.865 - - - Physical activity (Yes) 0.464 (-1.558;2.485) 0.649 - - - Abdominal circumference (cm) -0.011 (-0.095;0.072) 0.787 - - - Race (Black) 0.958 (-1.412;3.327) 0.422 - - - Hypertension (Yes) 0.0412 (-1.46;2.248) 0.662 - - - LV: left ventricle; BP: blood pressure; BMI: body mass index; Coef: coefficient; CI: confidence interval. in cancer incidence in older populations15. The effectiveness of antineoplastic treatment has significantly reduced the mortality due to cancer2. These same drugs, however, are associated with increased morbidity and mortality due to cardiovascular causes. Patients treated with DOX who develop signs of HF have a mortality rate at 2 years of 60%, a 3.5 times higher risk than those with idiopathic dilated cardiomyopathy16. Monitoring of myocardial function in patients using chemotherapeutic agents is usually based on clinical findings and on LVEF. These parameters, however, only change in the later stages of cardiovascular disease, usually when there is already structural apoptosis of myocytes and therefore, little likelihood of reversion of the clinical picture3,4. The identification of cardiac injury in the early stages has proven beneficial in patients undergoing cancer treatment17, and the reduction in εLL emerging as an independent predictor of late reduction in LVEF in patients treated with anthracyclines justify early therapy with drugs with cardioprotective effect in these patients18. Sawaya et al18 showed that unlike the longitudinal strain, LVEF and information from LV diastolic function are unable to predict cardiotoxicity, and that LVEF is not sensitive enough to detect early LV injury19. In other words, when the dysfunction is detected, heart injury has already occurred for some time, preventing use of prophylactic strategies. Moreover, the failure to detect changes in LVEF does not exclude subclinical cardiac damage, nor the possibility of later cardiac deterioration6,20. Our results showed that more sensitive markers related to subclinical myocardial injury, such as εLL, εCC and S' wave, are reduced in patients who used the anthracycline, despite normal LVEF which did not differ 280 Arq Bras Cardiol. 2015; 104(4):274-283 between groups. Similar results were obtained by other authors, signaling that the use of these new technologies can be useful in the evaluation of cardiotoxicity in patients undergoing chemotherapy17,21-23. The differences observed in the absolute value of the strain tend to be small when we deal with subclinical ventricular dysfunction8,17. In our study, the relative difference observed in εLL was 7.5% and in εCC of 27.5%, similar to the results obtained in other studies21,24. Even though the qualitative analysis (DOX: yes versus no) have influenced the results of the εCC and the εLL, the variation in DOX dose used in our study was very low (median = 240 mg/m²; IQR: 231-286 mg/m²), justifying the absence of correlation observed between the dose of DOX and the strain. The participants in the control group in this study cannot be considered normal. Although they were included as controls, none of them underwent a stress test and, therefore, did not have potential incipient heart diseases excluded. Additionally, the prevalences of dyslipidemia, diabetes, hypertension, smoking and alcohol consumption in both groups bring our cohort very close to the "real world", which, in our view, reinforce even more the results of the study. In an article from the MESA (Multi-Ethnic Study of Atherosclerosis) trial8, the characteristics of the control group were very similar to those in our control group, and the software used for the analysis of strain was the same used in our study. In that article, longitudinal strain between controls was -13.9 ± 2.3%, a result close to that found in our study (-13.4 ± 1.7%). It is also possible that these values may be slightly lower when compared with truly normal individuals. Almeida et al. Subclinical LV Dysfunction After Use of Anthracycline Original Article The algorithm used by Toshiba's equipment allows measurement of circumferential and longitudinal strain in the endocardial, mid-myocardial and epicardial regions. In the absence of ischemia, strain is greater in the endocardium than in the epicardium, with intermediate values in the middle region of the myocardium12. Experimental data validated by sonomicrometry show that while the circumferential strain in the mid-myocardial region was -13.3 ± 4.7%, the results in the endocardium and epicardium were -25.2 ± 8.7% and -9.4 ± 9.3%, respectively12. In our study, the results of longitudinal and circumferential strains were those representing the middle region of the myocardium, as described in the methodology. According to Feigenbaum et al25, one of the limitations for propagation of the method of strain analysis by speckle tracking is the fact that many manufacturers have not yet presented interchangeable results between different software applications for strain analysis. That is, the results obtained with the Toshiba software, used in our study, are unlikely to be the same results obtained by another manufacturer. Participants in the control group had levels of systolic and diastolic BP higher in the initial clinical evaluation, although there was no difference between groups in the percentage of participants labeled hypertensive. This finding seems contradictory, but it was probably due to greater adherence to antihypertensive therapy among patients who were undergoing medical follow-up after chemotherapy. The increase in BP levels tend to influence the results of εLL and εCC . Marwick et al26 showed that the higher the diastolic BP, the greater will be the impact on the strain. Our results showed that patients who underwent chemotherapy presented lower ε LL and ε CC , despite presenting lower levels of systolic and diastolic BP when compared with healthy controls. Although this contradicts the results reported by Marwick et al26, this information can reinforce the importance of prior use of DOX as an independent predictor of reduced εLL and εCC in our patients. Although the absolute dimension of the LA was higher in controls, there was no difference when it was indexed to body surface area. Similarly, there was no difference in the values of LAVI, which is a more robust index to represent the dimensions of the LA and has a higher correlation with cardiovascular disease10,27. Side effects of mediastinal radiotherapy on the heart can be expressed in the form of cardiomyopathy, valvular injury, coronary artery disease (CAD), and mainly pericardial disease3,28. Pericardial effusion has been reported in earlier phases after radiation. However, constrictive pericarditis, CAD, valvular heart disease and cardiomyopathy usually appear after longer follow-up3, with higher incidence when the radiation is directed towards the left side of the chest29. In our sample, 52.5% of the patients received adjuvant radiotherapy. However, only 20% had it performed on the left side of the chest. In addition, the average time after chemotherapy was only two years, which may justify the absence of signs of pericardial disease in our sample. Cyclophosphamide and 5-fluorouracil were used by 77.5% and 37.5% of our patients, respectively. Both are also associated with cardiotoxicity, but with a frequency much lower than that associated with use of anthracyclines3. Limitations This is a cross-sectional study and as such, is unable to establish a precise causal relationship between the use of anthracyclines and the findings of reduced εLL and εCC. However, the reduction in the values of εLL and εCC in patients who used DOX was observed even in the absence of HF by Framingham's criteria, history of illness, prior cardiovascular disease, valvular lesion greater than mild, change in segmental contractile function in the transthoracic echocardiogram and LVEF <55%. In addition, the participants were examined under stable conditions to prevent changes secondary to the effects of hemodynamic instability. However, larger prospective studies will be necessary to assess the possible effects of confounding variables. Even though the patients had no prior angina or myocardial infarction, they did not undergo stress test. The sample was composed only by women, therefore these results cannot be extrapolated to male patients. The analysis of the echocardiographic findings variables was performed by only one examiner. Conclusions εLL, the εCC and the S' wave are reduced in patients who used DOX ± 2 years prior to the study, despite normal LVEF, suggesting the presence of subclinical ventricular dysfunction in a group considered at high risk of cardiovascular events. Previous use of DOX was an independent predictor of εCC reduction in cancer survivors. Previous use of DOX and age were independent markers of εLL reduction. Author contributions Conception and design of the research: Almeida ALC, Silva VA, Souza Filho AT, Rios VG, Lopes JRP, Afonseca SO, Santos Júnior EG; Acquisition of data and Critical revision of the manuscript for intellectual content: Almeida ALC, Silva VA, Souza Filho AT, Rios VG, Lopes JRP, Afonseca SO, Cunha DCA, Mendes MOC, Miranda DL, Santos Júnior EG; Analysis and interpretation of the data: Almeida ALC, Santos Júnior EG; Statistical analysis and Obtaining financing: Almeida ALC; Writing of the manuscript: Almeida ALC, Santos Júnior EG. Potential Conflict of Interest Dr. André Luiz Cerqueira de Almeida has served as a speaker in activities sponsored by Toshiba Medical Systems. He has also received support from Toshiba Medical Systems in the form of equipment and for participation in meetings. Drs. Viviane Almeida Silva, Alberto Teófilo de Souza Filho, Vinicius Guedes Rios, João Ricardo Pinto Lopes, Samuel Oliveira de Afonseca, Daniel de Castro Araújo Cunha, Murilo Oliveira da Cunha Mendes, Danilo Leal Miranda, Edval Gomes dos Santos Júnior have received support from Toshiba Medical Systems in the form of equipment. Sources of Funding This study was partially funded by Toshiba Medical Systems. Study Association This study is not associated with any thesis or dissertation work. Arq Bras Cardiol. 2015; 104(4):274-283 281 Almeida et al. Subclinical LV Dysfunction After Use of Anthracycline Original Article References 1. Lenihan DJ, Cardinale D, Cipolla CM. The compelling need for a cardiology and oncology partnership and the birth of the international cardioncology society. Prog Cardiovasc Dis. 2010;53(2):88-93. 15. Driver JA, Djousse L, Logroscino G, Gaziano JM, Kurth T. Incidence of cardiovascular disease and cancer in advanced age: prospective cohort study. BMJ. 2008;337:a2467. 2. Herbst RS, Bajorin DF, Bleiberg H, Blum D, Hao D, Johnson BE, et al. Clinical Cancer Advances 2005: major research advances in cancer treatment, prevention, and screening--a report from the American Society of Clinical Oncology. J Clin Oncol. 2006;24(1):190-205 16. Felker GM, Thompson RE, Hare JM, Hruban RH, Clemetson DE, Howard DL, et al. Underlying causes and long-term survival in patients with initially unexplained cardiomyopathy. N Engl J Med. 2000;342(15):1077-84. 3. Kalil Filho R, Hajjar LA, Bacal F, Hoff PM, Diz M del P, Galas FR, et al; Sociedade Brasileira de Cardiologia. I Diretriz Brasileira de CardioOncologia da Sociedade Brasileira de Cardiologia. Arq Bras Cardiol. 2011;96(2 supl.1):1-52. 4. Yeh ET, Bickford CL. Cardiovascular complications of cancer therapy: Incidence, pathogenesis, diagnosis, and management. J Am Coll Cardiol. 2009;53(24):2231-47. 5. Meinardi MT, van der Graaf WT, van Veldhuisen DJ, Gietema JA, de Vries EG, Sleijfer DT. Detection of anthracycline-induced cardiotoxicity. Cancer Treat Rev. 1999;25(4):237-47. 18. Sawaya H, Sebag IA, Plana JC, Januzzi JL, Ky B, Cohen V, et al. Early detection and prediction of cardiotoxicity in chemotherapy-treated patients. Am J Cardiol. 2011;107(9):1375-80. 19. Eidem BW. Identification of anthracycline cardiotoxicity: Left ventricular ejection fraction is not enough. J Am Soc Echocardiogr. 2008;21(12):1290-2. Jensen BV, Skovsgaard T, Nielsen SL. Functional monitoring of anthracycline cardiotoxicity: a prospective, blinded, long-term observational study of outcome in 120 patients. Ann Oncol. 2002;13(5):699-709. 20. Cardinale D, Colombo A, Lamantia G, Colombo N, Civelli M, De Giacomi G, et al. Anthracycline-induced cardiomyopathy: clinical relevance and response to pharmacologic therapy. J Am Coll Cardiol. 2010;55(3):213-20. 7. Mizuguchi Y, Oishi Y, Miyoshi H, Iuchi A, Nagase N, Oki T. The functional role of longitudinal, circumferential, and radial myocardial deformation for regulating the early impairment of left ventricular contraction and relaxation in patients with cardiovascular risk factors: a study with two-dimensional strain imaging. J Am Soc Echocardiogr. 2008;21(10):1138-44. 21. Stoodley PW, Richards DA, Hui R, Boyd A, Harnett PR, Meikle SR, et al. Twodimensional myocardial strain imaging detects changes in left ventricular systolic function immediately after anthracycline chemotherapy. Eur J Echocardiogr. 2011;12(12):945-52. 6. 8. Almeida AL, Teixido-Tura G, Choi EY, Opdahl A, Fernandes VR, Wu CO, et al. [Metabolic syndrome, strain, and reduced myocardial function: multi-ethnic study of atherosclerosis]. Arq Bras Cardiol. 2014;102(4):327-35. 9. Migrino RQ, Aggarwal D, Konorev E, Brahmbhatt T, Bright M, Kalyanaraman B. Early detection of doxorubicin cardiomyopathy using two-dimensional strain echocardiography. Ultrasound Med Biol. 2008;34(2):208-14. 10. Lang RM, Bierig M, Devereux RB, Flachskampf FA, Foster E, Pellikka PA, et al. Recommendations for chamber quantification. Eur J Echocardiogr. 2006;7(2):79-108. 11. Devereux RB, Alonso DR, Lutas EM, Gottlieb GJ, Campo E, Sachs I, et al. Echocardiographic assessment of left ventricular hypertrophy: comparison to necropsy findings. Am J Cardiol. 1986;57(6):450-8. 12. Ishizu T, Seo Y, Enomoto Y, Sugimori H, Yamamoto M, Machino T, et al. Experimental validation of left ventricular transmural strain gradient with echocardiographic two-dimensional speckle tracking imaging. Eur J Echocardiogr. 2010;11(4):377-85. 13. Ogawa K, Hozumi T, Sugioka K, Matsumura Y, Nishiura M, Kanda R, et al. Usefulness of automated quantitation of regional left ventricular wall motion by a novel method of two-dimensional echocardiographic tracking. Am J Cardiol. 2006;98(11):1531-7. 14. Schiller NB, Shah PM, Crawford M, DeMaria A, Devereux R, Feigenbaum H, et al. Recommendations for quantitation of the left ventricle by twodimensional echocardiography. American Society of Chocardiography Committee on Standards, Subcommittee on Quantification of TwoDimensional Echocardiograms. J Am Soc Echocardiogr. 1989;2(5):358-67. 282 17. Fallah-Rad N, Walker JR, Wassef A, Lytwyn M, Bohonis S, Fang T, et al. The utility of cardiac biomarkers, tissue velocity and strain imaging, and cardiac magnetic resonance imaging in predicting early left ventricular dysfunction in patients with human epidermal growth factor receptor ii-positive breast cancer treated with adjuvant trastuzumab therapy. J Am Coll Cardiol. 2011;57(22):2263-70. Arq Bras Cardiol. 2015; 104(4):274-283 22. Khouri MG, Hornsby WE, Risum N, Velazquez EJ, Thomas S, Lane A, et al. Utility of 3-dimensional echocardiography, global longitudinal strain, and exercise stress echocardiography to detect cardiac dysfunction in breast cancer patients treated with doxorubicin-containing adjuvant therapy. Breast Cancer Res Treat. 2014;143(3):531-9. 23. Kang Y, Cheng L, Li L, Chen H, Sun M, Wei Z, et al. Early detection of anthracycline-induced cardiotoxicity using two-dimensional speckle tracking echocardiography. Cardiol J. 2013;20(6):592-9. 24. Negishi K, Negishi T, Haluska BA, Hare JL, Plana JC, Marwick TH. Use of speckle strain to assess left ventricular responses to cardiotoxic chemotherapy and cardioprotection. Eur Heart J Cardiovasc Imaging. 2014;15(3):324-31. 25. Feigenbaum H, Mastouri R, Sawada S. A practical approach to using strain echocardiography to evaluate the left ventricle. Circ J. 2012;76(7):1550-5. 26. Marwick TH, Leano RL, Brown J, Sun JP, Hoffmann R, Lysyansky P, et al. Myocardial strain measurement with 2-dimensional speckle-tracking echocardiography: definition of normal range. JACC Cardiovasc Imaging. 2009;2(1):80-4. 27. Tsang TS, Barnes ME, Bailey KR, Leibson CL, Montgomery SC, Takemoto Y, et al. Left atrial volume: important risk marker of incident atrial fibrillation in 1655 older men and women. Mayo Clin Proc. 2001;76(5):467-75. 28. Adams MJ, Hardenbergh PH, Constine LS, Lipshultz SE. Radiation-associated cardiovascular disease. Crit Rev Oncol Hematol. 2003;45(1):55-75. 29. Paszat LF, Mackillop WJ, Groome PA, Schulze K, Holowaty E. Mortality from myocardial infarction following postlumpectomy radiotherapy for breast cancer: a population-based study in ontario, canada. Int J Radiat Oncol Biol Phys. 1999;43(4):755-62. Almeida et al. Subclinical LV Dysfunction After Use of Anthracycline Original Article Arq Bras Cardiol. 2015; 104(4):274-283 283 Back to the Cover Original Article Blood Pressure Variation Throughout Pregnancy According to Early Gestational BMI: A Brazilian Cohort Fernanda Rebelo1,3, Dayana Rodrigues Farias1,2, Roberta Hack Mendes1, Michael Maia Schlüssel4, Gilberto Kac1 Observatório de Epidemiologia Nutricional1, Departamento de Nutrição Social e Aplicada, Instituto de Nutrição Josué de Castro, Universidade Federal do Rio de Janeiro; Programa de Pós-Graduação em Nutrição2, Instituto de Nutrição Josué de Castro, Universidade Federal do Rio de Janeiro; Programa de Pós-Graduação em Epidemiologia em Saúde Pública3, Escola Nacional de Saúde Pública, Fundação Oswaldo Cruz, Rio de Janeiro - Brazil; Oxford Clinical Trials Research Unit, Centre for Statistics in Medicine, Nuffield Department of Orthopaedics, Rheumatology and Musculoskeletal Sciences, University of Oxford4, Oxford - United Kingdom Abstract Background: The maternal cardiovascular system undergoes progressive adaptations throughout pregnancy, causing blood pressure fluctuations. However, no consensus has been established on its normal variation in uncomplicated pregnancies. Objective: To describe the variation in systolic blood pressure (SBP) and diastolic blood pressure (DBP) levels during pregnancy according to early pregnancy body mass index (BMI). Methods: SBP and DBP were measured during the first, second and third trimesters and at 30-45 days postpartum in a prospective cohort of 189 women aged 20-40 years. BMI (kg/m²) was measured up to the 13th gestational week and classified as normal-weight (<25.0) or excessive weight (≥25.0). Longitudinal linear mixed-effects models were used for statistical analysis. Results: A decrease in SBP and DBP was observed from the first to the second trimester (βSBP=-0.394; 95%CI: -0.600- -0.188 and βDBP=-0.617; 95%CI: -0.780- -0.454), as was an increase in SBP and DBP up to 30-45 postpartum days (βSBP=0.010; 95%CI: 0.006-0.014 and βDBP=0.015; 95%CI: 0.012-0.018). Women with excessive weight at early pregnancy showed higher mean SBP in all gestational trimesters, and higher mean DBP in the first and third trimesters. Excessive early pregnancy BMI was positively associated with prospective changes in SBP (βSBP=7.055; 95%CI: 4.499-9.610) and in DBP (βDBP=3.201; 95%CI: 1.136-5.266). Conclusion: SBP and DBP decreased from the first to the second trimester and then increased up to the postpartum period. Women with excessive early pregnancy BMI had higher SBP and DBP than their normal-weight counterparts throughout pregnancy, but not in the postpartum period. (Arq Bras Cardiol. 2015; 104(4):284-291) Keywords: Arterial Pressure; Pregnant Women; Pregnancy; Body Mass Index; Cohort Studies. Introduction The maternal cardiovascular system undergoes progressive adaptations throughout pregnancy, including decreased vascular resistance, increased blood volume, and other metabolic changes¹. Although the effects of these changes on systemic blood pressure (BP) have been described in many studies, there is no consensus on its normal variation in uncomplicated pregnancies2,3. Hypertensive disorders of pregnancy (HDP) represent a major obstetric complication that affects 5%-10% of pregnancies, depending on characteristics of the study population, and are one of the leading causes of maternal and neonatal morbidity and mortality worldwide4. HDP include chronic hypertension, gestational hypertension, preeclampsia Mailing Address: Gilberto Kac • Rua Viúva Lacerda, 249 bloco 3, ap. 302, Humaitá - Postal code 22260-050 Rio de Janeiro, RJ – Brazil. Email: [email protected]; [email protected]. Manuscript received July 09, 2014; revised manuscript October 07, 2014; accepted December 02, 2014. DOI: 10.5935/abc.20150007 284 and eclampsia, being considered the second most common cause of direct maternal death in developed countries5. The etiology of HDP is not clear; however, there are several risk factors associated with their occurrence, such as body mass index (BMI)6. As the prevalence of obesity increases in women of reproductive age7, BMI [weight (kg)/stature2 (m2)] and its associated complications represent a relevant public health matter. Maternal obesity is a significant risk factor for morbidity and mortality for both mother and fetus8. A systematic review has demonstrated that an increase of approximately 5-7 kg/m² units in BMI was associated with a two-fold increased risk of preeclampsia9. Given these previous findings, this study aims to describe the variation in systolic blood pressure (SBP) and diastolic blood pressure (DBP) levels during uncomplicated pregnancy, according to BMI. Methods This prospective cohort study was conducted at a prenatal care unit in Rio de Janeiro, Brazil. The enrollment of pregnant women occurred freely and continuously between November 2009 and October 2011. The follow-up period lasted until July 2012. A total of 258 women were recruited according Rebelo et al. Blood pressure throughout pregnancy Original Article to the following criteria: being less than 13-week pregnant at enrollment, being 20 to 40 years old and being free from any infectious or chronic diseases (except obesity). The study comprised four follow-up waves: 4th-13th week (first trimester), 14th-27th week (second trimester), 28th-40th week (third trimester), and 30-45 postpartum days. The first follow-up wave included two visits on different days; BP and BMI data were obtained during the first visit, and all other covariates used for adjustment in the analysis were collected during the second visit. Women who underwent the first follow-up visit but quit before the second visit (n=6) were excluded from the analysis, as were those with the following characteristics: twin pregnancies (n=4); diagnosis of an infectious or noncommunicable disease (n=17); miscarriage (n=25); and BP not measured in the specified interval (n=17). The final sample was composed of 189 pregnant women (Figure 1). Systolic and diastolic BP were measured using an automated oscillometric BP monitoring system (HEM-742, OMRON, São Paulo, Brazil) validated according to the international protocol of the European Society of Hypertension10. Blood pressure was measured after the women had rested for at least five minutes and were seated comfortably with their back supported, their legs uncrossed and their feet flat on the floor. Clothing was removed from the arm in which the cuff was placed. The arm was supported at heart level, with the palm facing up and the elbow slightly flexed. The women were advised not to speak during the procedure. Different cuff sizes, based on the upper arm circumference at the time of each measurement, were used. Blood pressure was measured twice at the first trimester (in two distinct days) to determine if the women had chronic hypertension (values of SBP ≥ 140 or DBP ≥ 90 mm Hg, before the 20th gestational week). Each measurement of BP was performed in duplicate, for all follow-up waves, with an approximate 30-minute interval between measurements. The mean values of the duplicate measurements from each timepoint were used for analysis11. The women were weighed with a digital scale (Filizola Ltd., São Paulo, Brazil), and their stature was measured in duplicate with a Seca Portable Stadiometer (Seca Ltd., Hamburg, Germany). The mean of the duplicate standing height values was used to calculate BMI. Early pregnancy BMI was obtained prior to the 13th gestational week. Anthropometric measurements were standardized and performed by trained interviewers12. The BMI was classified into two categories, 934 Pregnant women responded to the study recruitment questionnaire 541 were not eligible: 241 were adolescents; 157 were beyond the 13th gestational week; 81 lived outside of the study programmatic area; 42 had chronic diseases; 10 were > 40 years old; 8 had infectious disease; 2 intended to receive prenatal care in another public health center 393 Potentially eligible to participate in the study 54 signed the term of consent, but did not initiate the protocol: 20 were beyond the 13th gestational week; 16 received prenatal care in another public health center; 10 declined to participate; 8 had spontaneous abortion before the first visit 40 Refused to participate 299 Attended the 1st interview 41 excluded: participated in a nested clinical trial regarding supplementation of n-3 fatty acids 258 participants of the cohort 69 excluded: 6 underwent the first follow-up visit but quit before the second visit; 4 had twin pregnancies; 17 were diagnosed with an infectious or non-communicable disease; 25 had a miscarriage; 17 did not have BP measured in the specified interval Final sample = 189 Figure 1 - Flowchart illustrating the process of recruitment of women attending the prenatal care at a Public Health Center. Rio de Janeiro, 2009 – 2011 Arq Bras Cardiol. 2015; 104(4):284-291 285 Rebelo et al. Blood pressure throughout pregnancy Original Article using the cutoff points proposed by the World Health Organization13 (normal weight, 18.5–24.9 kg/m2; excessive weight, ≥25.0 kg/m2). The two BMI categories were created by joining underweight with normal-weight women and overweight with obese women; only seven women were underweight, and the sensitivity analysis showed no difference in terms of magnitude or significance in the results whether underweight women were included or excluded. values for the first, second and third trimesters and postpartum were 66.7 (65.6 – 67.8), 64.4 (63.3 – 65.4), 67.0 (65.8 – 68.1), and 73.3 (72.0 – 74.7), respectively. The longitudinal regression coefficients for SBP and DBP decreased from the first to the second trimester [βSBP=-0.394 (-0.600 – -0.188), βDBP=-0.617 (-0.780 – -0.454)] and then increased from the second trimester to the postpartum period [βSBP=0.010 (0.006 – 0.014), βDBP=-0.015 (-0.767 – -0.442)] (Figure 2). The gestational age (in weeks) was estimated using, preferably, ultrasound performed before the 26th week of pregnancy or, alternatively, the last menstrual period reported. The following variables were also considered in the analysis: maternal age (years); self-reported skin color (white/black/ brown); parity (nulliparous/multiparous); current smoking status (yes/no); marital status (lives with a partner/does not live with a partner); education (<8/≥8 years) and practice of leisure time physical activity (LTPA) before pregnancy (yes/ no). The dependent variables were tested for normality using the Shapiro-Wilk test. Possible differences in the distributions of the confounders, according to the BMI categories, were assessed using the chi-square test for proportions. The pattern in BP change was assessed using longitudinal linear regression models, which used SBP and DBP as dependent variables and gestational age and quadratic gestational age as time independent variables. In order to improve model adequacy, a quadratic term for gestational age was used. Prospective changes in SBP and DBP, according to early pregnancy BMI, were assessed with longitudinal linear regression after adjustment for confounders, including parity, current smoking status, marital status, years of education and LTPA. Comparisons between eligible women lost during the followup and the final sample were performed with chi-square test for proportions. The mean SBP significantly differed among the BMI groups in all gestational trimesters. The mean DBP was significantly higher among overweight/obese women in the first and third trimesters only. Neither SBP nor DBP differed between BMI groups at postpartum. The longitudinal linear regression model showed that BMI was positively associated with prospective changes in SBP and DBP [β=7.055 (4.499 – 9.610) and β=3.201 (1.136 – 5.266), respectively] throughout pregnancy (Figure 3). The statistical analyses were performed using Stata Data Analysis and Statistical Software (STATA) version 12.0 (Stata Corp., College Station, Texas, USA). Differences were considered statistically significant when the p-value < 0.05. The study protocol was approved by the research ethics committee of the Municipal Secretary of Health of the city of Rio de Janeiro (registration number: 0139.0.314.000-09). All participants signed a two-way term of consent, which was obtained freely and spontaneously after all necessary explanations had been provided. Results The sample characteristics did not differ according to early pregnancy BMI categories (p>0.05). The majority of women were younger than 30 years (73.5%), brown or black (73.5%), multiparous (58.2%), lived with a partner (78.8%), had at least eight years of education (71.4%) and did not participate in LTPA prior to pregnancy (74.3%) (Table 1). None of these variables significantly differed between eligible women lost to follow-up and the final sample, indicating a non-selective loss (data not shown). For the overall sample, the mean SBP values for the first, second and third trimesters and postpartum (95% CI) were 109.7 (108.4 – 111.1), 107.8 (106.4 – 109.2), 111.0 (109.5 – 112.5) and 114.6 (112.9 – 116.3), respectively. The mean DBP 286 Arq Bras Cardiol. 2015; 104(4):284-291 Discussion The main findings of this study corroborate the known BP pattern during healthy pregnancy. The study women experienced a mid-trimester drop, followed by a progressive increase in SBP and DBP up to 30-45 postpartum days. Furthermore, our results indicated a strong association between early pregnancy BMI and SBP/DBP. Women who began pregnancy with a BMI in the overweight or obese categories presented higher values of SBP and DBP in all gestational trimesters. Although many studies have shown this same BP pattern during pregnancy14-17, some authors have found different results, such as a mid-trimester BP rise instead of a drop18-20. For this reason, the publication of new findings is still necessary. The description of usual values and variations of SBP and DBP in healthy pregnancies is important for prenatal practitioners to detect abnormal variations that may be related to the onset of a disorder. Studies to elucidate this issue should be encouraged. Grindheim et al.17 have followed a cohort with four visits during pregnancy to evaluate BP variation. Their sample was very similar to ours in terms of age, parity, BMI, and gestational age at BP measurements. The main finding of this study was the statistically significant drop in SBP and DBP up to midpregnancy (22-24 weeks), followed by a progressive increase until delivery, which corroborates our results. However, their sample was smaller (n = 63) and comprised only Norwegian women, which is a very homogeneous population.17 Nama et al.20 have found a progressive increase in SBP and DBP in a sample of primiparous, healthy, white pregnant women residing in London. The authors have discussed the importance of conducting similar studies with heterogeneous populations, considering factors such as BMI. Other studies have also found progressive increases in SBP in homogeneous populations18-19. However, there are no studies that have monitored BP in healthy, adult, pregnant women from Brazil, a country composed of a very heterogeneous population. Another point to be considered is the mean SBP and DBP valuesin our study. Other similar investigations have found markedly higher values in all pregnancy trimesters19,21-23, similar to the highest BMI group in our sample. In a recent Rebelo et al. Blood pressure throughout pregnancy Original Article Table 1 – General characteristics of the study sample, according to early pregnancy Body Mass Index (BMI) of women followed at a public health center in the city of Rio de Janeiro, Brazil, 2009 - 2012 BMI‡ categories Total n (%) Normal-weight n (%) Excessive weight n (%) < 30 139 (73.5) 78 (72.9) 61 (74.4) ≥ 30 50 (26.5) 29 (27.1) 21 (25.6) White 50 (26.5) 27 (25.2) 23 (28.0) Brown or black 139 (73.5) 80 (74.8) 59 (72.0) 0 79 (41.8) 43 (40.2) 36 (43.9) ≥1 110 (58.2) 64 (59.8) 46 (56.1) Yes 15 (92.1) 7 (6.5) 8 (9.8) No 174 (7.9) 100 (93.5) 74 (90.2) Characteristics p-value* Maternal age (years) 0.818 Self-reported skin color 0.664 Parity 0.608 Current smoking 0.418 Marital status Lives with a partner 149 (78.8) 87 (81.3) 62 (75.6) Do not live with a partner 40 (21.2) 20 (18.7) 20 (24.4) <8 54 (28.6) 31 (29.0) 23 (28.0) ≥8 135 (71.4) 76 (71.0) 59 (72.0) Yes 48 (25.7) 28 (26.4) 20 (24.7) No 139 (74.3) 78 (73.6) 61 (75.3) 0.342 Education (years) 0.889 Practice of LTPA† before pregnancy 0.789 * p-value refers to a chi-square test for proportions; †LTPA: leisure time physical activity; ‡BMI: body mass index (normal-weight < 25 kg/m2; excessive weight ≥ 25 kg/m2). study, MacDonald-Wallis et al.23, in an attempt to establish BP reference values during pregnancy, have found higher mean SBP and DBP values at 12 and 37 weeks of normal pregnancies as compared to our results. Given that the possibility of changing the cutoff points for the diagnosis of HDP has been discussed, it is important to consider the differences in BP values for different populations and BMI categories24. Although a similar pattern of variability in normal-weight and excessive-weight women was observed, those who began pregnancy as overweight or obese showed significantly higher values of SBP in all trimesters and of DBP in the first and third trimesters of pregnancy. Similar results have been observed in other populations16,19. This indicates that the normal variation of BP is different between BMI categories. If a woman with a normal BMI has a SBP or DBP level below 140 or 90 mm Hg, respectively, but above the mean for her BMI, it may indicate an increased risk for adverse outcomes when compared with a woman who initiated pregnancy obese and has similar absolute BP values. Some authors consider postpartum BP as the normal BP of nonpregnant women; postpartum BP is sometimes used as a pre-pregnancy measure17. Extrapolating for our results, it can be said that there is no BP variability outside pregnancy between BMI groups. Putting together, the significant difference of BP between groups in the first trimester indicates that the BP drop in early pregnancy is probably higher among those with a lower BMI. Some strengths and limitations of this study should be highlighted. This is the first study to assess longitudinal BP data in a group of Brazilian pregnant women. Furthermore, we used a robust statistical analysis, considering the data as repeated measures, not merely comparing means. As limitations, the evaluation of additional points during pregnancy would provide a more complete pattern of variability. Moreover, the use of ambulatory blood pressure monitoring to measure variations throughout the day would be important. Another potential limitation is the loss to follow-up of 11.3% of study participants. However, the Arq Bras Cardiol. 2015; 104(4):284-291 287 Rebelo et al. Blood pressure throughout pregnancy ß1=-0.394* (95% CI: -0.600 – -0.188) ß2=0.010* (95% CI: 0.006 – 0.014) 116.3 114.6 114 Mean systolic blood pressure (mmHg) 116 Original Article 112.9 111.1 111.0 109.7 109.5 109.2 108.4 107.8 106.4 106 108 110 112 112.5 10 20 30 40 50 Time elapsed since conception (weeks) ß1=-0.617* (95% CI: -0.780 – -0.454) ß2=0.015* (95% CI: 0.012 – 0.018) 74.7 73.3 72 Mean diastolic blood pressure (mmHg) 74 95% Confidence Interval 68.1 67.8 66.7 67.0 65.6 65.8 65.4 64.4 64 66 68 70 72.0 63.3 10 20 30 40 50 Time elapsed since conception (weeks) 95% Confidence Interval Figure 2 - Mean systolic and diastolic blood pressure changes during pregnancy and 30-45 days post-partum of women followed at a public health center in the city of Rio de Janeiro, Brazil, 2009 - 2012 Note: β1,2: the longitudinal linear regression coefficients for gestational age and quadratic gestational age, respectively; CI: Confidence interval. *p-value < 0.001 refers to maximum likelihood estimator. Mean (95% CI) gestational weeks or days postpartum and number of participants (n) in each follow-up evaluation: 1st trimester: 9.7 (9.4 – 10.0) weeks, n = 189; 2nd trimester = 23.7 (23.4 – 24.0) weeks, n=157; 3rd trimester: 32.4 (32.0 – 32.8) weeks, n = 162; postpartum: 36.4 (34.9 – 37.9) days, n = 153. 288 Arq Bras Cardiol. 2015; 104(4):284-291 Rebelo et al. Blood pressure throughout pregnancy 119.5 ß1=7.055* (95% CI: 4.499 – 9.610) 105 117.1 117.1 114.9 114.7 114.8 115.8 113.7 112.6 112.7 110.4 110.2 112.5 111.6 110 115 Mean systolic blood pressure (mmHg) 120 Original Article 108.2 108.3 108.3 107.5 106.7 106.4 105.8 105.2 110.3 104.1 10 20 30 40 50 Time elapsed since conception (weeks) normal weight excessive weight 95% Confidence Interval 74.6 74.1 ß1=3.201** (95% CI:1.136 – 5.266) 72.7 72.1 71.5 70.5 70.8 70.0 68.8 68.6 67.1 67.5 66.4 65.1 66.0 66.2 64.5 64.7 63.1 63.3 63.8 61.8 60 65 70 Mean diastolic blood pressure (mmHg) 75 76.0 10 20 30 40 50 Time elapsed since conception (weeks) normal weight excessive weight 95% Confidence Interval Figure 3 - Mean systolic and diastolic blood pressure changes during pregnancy according to BMI categories of women followed at a public health center in the city of Rio de Janeiro, Brazil, 2009 - 2012 Note: β1: longitudinal linear regression coefficient for body mass index category excessive weight (reference category: normal weight) adjusted for gestational age, quadratic gestational age, parity, current smoking status, marital status, education, practice of leisure time physical activity before pregnancy. CI: confidence interval; normal-weight <25 kg/m2; excessive weight ≥ 25 kg/m2. *p-value <0.001 and **p-value: 0.002 refers to maximum likelihood estimator. Mean (95% CI) gestational weeks or days post-partum and number of participants (n) in each follow-up evaluation: 1st trimester: 9.7 (9.4 – 10.0) weeks, n = 189; 2nd trimester: 23.7 (23.4 – 24.0) weeks, n = 157; 3rd trimester: 32.4 (32.0 – 32.8) weeks, n = 162; postpartum: 36.4 (34.9 – 37.9) days, n = 153. Arq Bras Cardiol. 2015; 104(4):284-291 289 Rebelo et al. Blood pressure throughout pregnancy Original Article statistical technique employed to investigate the influence of BMI on BP is efficient even when there are some values missing from the study sample25. Conclusions This study provides new data about the pattern of BP variability throughout pregnancy, an issue that has been of great interest in recent years. We found that SBP and DBP decreased from early to mid-pregnancy and then increased up to 30-45 postpartum days. The findings also reinforced the role of BMI on SBP and DBP, highlighting the importance of considering this variable in studies assessing BP in pregnancy, as well as during prenatal care monitoring. Acknowledgments We would like to thank our funding sources: National Council for Scientific and Technological Development (CNPq) and Carlos Chagas Filho Foundation for Research Support of Rio de Janeiro State (FAPERJ). Kac G is research fellow from CNPq. Rebelo F has received a scholarship from National School of Public Health (Oswaldo Cruz Foundation), and Farias DR and Mendes RH have received scholarships from CAPES during the development of the study. Author contributions Conception and design of the research:Rebelo F, Schlüssel MM, Kac G. Acquisition of data: Rebelo F, Farias DR. Analysis and interpretation of the data: Rebelo F, Farias DR, Schlüssel MM, Kac G. Statistical analysis: Rebelo F, Farias DR, Schlüssel MM, Kac G. Obtaining financing:Schlüssel MM, Kac G. Writing of the manuscript: Rebelo F, Farias DR, Mendes RH, Schlüssel MM, Kac G. Critical revision of the manuscript for intellectual content: Rebelo F, Farias DR, Mendes RH, Schlüssel MM, Kac G. Potential Conflict of Interest No potential conflict of interest relevant to this article was reported. Sources of Funding This study was funded by CNPq and FAPERJ. Study Association This study is not associated with any thesis or dissertation work. References 1. Ouzounian JG, Elkayam U. Physiologic changes during normal pregnancy and delivery. Cardiol Clin. 2012;30(3):317-29. Public Education of the American Heart Association Council on High Blood Pressure Research. Circulation. 2005;111(5): 697-716. 2. Metoki H, Ohkubo T, Sato Y, Kawaguchi M, Nishimura M, Watanabe Y. et al. Detection of midpregnancy fall in blood pressure by out-of-office monitoring. Hypertension. 2009;53(2):e12-3, author reply e14. 12. Lohman TG, Roche AF, Martorell R. Anthropometric Standardization Reference Manual. Champaign: Human Kinetics Pub;1988. 3. Tranquilli AL. Mid-trimester blood pressure in pregnancy. Blood pressure fall or fall of a myth? J Hypertens. 2011;29(4):658-9. 4. Report of the National High Blood Pressure Education Program Working Group on High Blood Pressure in Pregnancy. Am J Obstet Gynecol. 2000;183(1):S1-S22. 5. Vest AR, Cho LS.Hypertension in pregnancy. Cardiol Clin. 2012;30(3):407-23. 6. Ehrenthal DB, Jurkovitz C, Hoffman M, Jiang X, Weintraub WS. Prepregnancy body mass index as an independent risk factor for pregnancy-induced hypertension. J Womens Health (Larchmt). 2011;20(1):67-72. 7. Gaillard R, Bakker R,Willemsen SP, Hofman A, Steegers EA, Jaddoe VW. Blood pressure tracking during pregnancy and the risk of gestational hypertensive disorders: the Generation R Study. Eur Heart J. 2011;32(24):3088-97. 8. Scott-Pillai R, Cardwell C, Hunter A, Holmes V. The impact of body mass index on maternal and neonatal outcomes: a retrospective study in a UK obstetric population, 2004-2011. BJOG. 2013;120(8):932-9. 9. O’Brien TE, Ray JG, Chan WS. Maternal body mass index and the risk of preeclampsia: a systematic overview. Epidemiology. 2003;14(3):368-74. 10. Coleman A, Steel S, Shennan A. Validation of the Omron MX3 Plus oscillometric blood pressure monitoring device according to the European Society of Hypertension international protocol. Blood Press Monit. 2005;10(3):165-8. 11. Pickering TG, Hall JE, Appel L J, Falkner BE , Graves J , Hill MN. Recommendations for blood pressure measurement in humans and experimental animals: part 1: blood pressure measurement in humans: a statement for professionals from the Subcommittee of Professional and 290 Arq Bras Cardiol. 2015; 104(4):284-291 13. Maternal anthropometry and pregnancy outcomes. A WHO Collaborative Study. Bull World Health Organ. 1995;73( Suppl): 1-98. 14. Robson SC, Hunter S, Boys, RJ, Dunlop W. Serial study of factors influencing changes in cardiac output during human pregnancy. Am J Physiol. 1989;256(4 Pt 2): H1060-5. 15. Ayala DE, Hermida RC, Mójon A, Fernández JR, Silva I, Ucieda R. Blood pressure variability during gestation in healthy and complicated pregnancies. Hypertension. 1997;30(3 Pt 2):611-8. 16. Thompson ML, Williams MA, Miller RS. Modelling the association of blood pressure during pregnancy with gestational age and body mass index. Paediatr Perinat Epidemiol. 2009;23(3):254-63. 17. Grindheim G, Estensen M, Langesaeter E, Rosseland LA, Toska K. Changes in blood pressure during healthy pregnancy: a longitudinal cohort study. J Hypertens. 2012;30(2):342-50. 18. Silva LM, Steegers EA, Burdorf A, Jaddoe VW, ArendsLR, Hofman A , et al. No midpregnancy fall in diastolic blood pressure in women with a low educational level: the Generation R Study. Hypertension. 2008;52(4):645-51. 19. Miller RS, Thompson ML , Williams MA. Trimester-specific blood pressure levels in relation to maternal pre-pregnancy body mass index. Paediatr Perinat Epidemiol, 2007;21(6):487-94. 20. Nama V, Antonios TF, Onwude J ,Manyonda IT. Mid-trimester blood pressure drop in normal pregnancy: myth or reality? J Hypertens. 2011;29(4):763-8. 21. Bouthoorn SH, Gaillard R, Steegers EA, Hofman A, Jaddoe VW, van Lenthe FJ. Ethnic differences in blood pressure and hypertensive complications during pregnancy: the Generation R study. Hypertension. 2012;60(1):198-205. Rebelo et al. Blood pressure throughout pregnancy Original Article for blood pressure in pregnancy: findings from a prospective cohort. J Hypertens.2015;33(1):96-105. 22. Ohkuchi A, Iwasaki R, Suzuki H, Hirashima C, Takahashi K, Usui R, et al. Normal and high-normal blood pressures, but not body mass index, are risk factors for the subsequent occurrence of both preeclampsia and gestational hypertension: a retrospective cohort study. Hypertens Res. 2006;29(3):161-7. 24. Espinoza J. The need to redefine preeclampsia. Expert Opin Med Diagn. 2012;6(4):347-57. 23. Macdonald-Wallis C, Silverwood RJ, Fraser A, Nelson SM, Tilling K, Lawlor DA, de Stavola BL. Gestational-age-specific reference ranges 25. Pinheiro J, Bates D. Mixed effects models in S and S-Plus. New York: Springer; 2000. Arq Bras Cardiol. 2015; 104(4):284-291 291 Back to the Cover Original Article Progression of Blood Pressure and Cardiovascular Outcomes in Hypertensive Patients in a Reference Center Gilberto Campos Guimarães Filho, Ana Luiza Lima Sousa, Thiago de Souza Veiga Jardim, Weimar Sebba Barroso Souza, Paulo César Brandão Veiga Jardim Liga de Hipertensão da Faculdade de Medicina da Universidade Federal de Goiânia, Goiás, GO - Brazil Abstract Background: Hypertension is a public health problem, considering its high prevalence, low control rate and cardiovascular complications. Objective: Evaluate the control of blood pressure (BP) and cardiovascular outcomes in patients enrolled at the Reference Center for Hypertension and Diabetes, located in a medium-sized city in the Midwest Region of Brazil. Methods: Population-based study comparing patients enrolled in the service at the time of their admission and after an average follow-up of five years. Participants were aged ≥ 18 years and were regularly monitored at the Center up to 6 months before data collection. We assessed demographic variables, BP, body mass index, risk factors, and cardiovascular outcomes. Results: We studied 1,298 individuals, predominantly women (60.9%), and with mean age of 56.7 ± 13.1 years. Over time, there was a significant increase in physical inactivity, alcohol consumption, diabetes, dyslipidemia, and excessive weight. As for cardiovascular outcomes, we observed an increase in stroke and myocardial revascularization, and a lower frequency of chronic renal failure. During follow-up, there was significant improvement in the rate of BP control (from 29.6% to 39.6%; p = 0.001) and 72 deaths, 91.7% of which were due to cardiovascular diseases. Conclusion: Despite considerable improvements in the rate of BP control during follow-up, risk factors worsened and cardiovascular outcomes increased. (Arq Bras Cardiol. 2015; 104(4):292-298) Keywords: Hypertension / complications; Arterial Pressure / physiopathology; Cardiovascular Diseases; Risk Factors; Indicators of Morbidity and Mortality. Introduction High blood pressure (BP) is one of the most important modifiable causes of cardiovascular (CV) morbidity and mortality in the adult population worldwide, and an independent risk factor for CV diseases 1,2. The increased prevalence of high BP, associated with the large number of undiagnosed and inadequately treated hypertensive individuals, promotes hypertension to a serious public health problem3. The efficacy of the services responsible for care of hypertensive patients, with identification of the strengths of their operations, may represent an important tool for management and planning. The fact that hypertension is also the most frequent CV disease has contributed significantly to make it the third most important cause of disability worldwide and the leading risk factor for CV complications such as stroke, acute myocardial infarction (AMI), and terminal renal chronic disease1,4. Considering this background, the present study aimed at evaluating the rate of BP control, and frequency of risk factors and CV outcomes in hypertensive patients undergoing treatment at the Reference Center for Hypertension and Diabetes (Centro de Referência em Hipertensão e Diabetes, CRHD), located in a medium-sized city in the Midwest Region of Brazil. This fact explains 54% of the deaths from stroke and 47% of those due to ischemic heart disease, with little variation Methods Mailing Address: Gilberto Campos Guimaraes Filho • Rua Villa 05, Lote 83, Qd 07 Condomínio Miafiori, Bairro Residencial Miafiori. Postal Code 75900-000, Rio Verde, GO - Brazil E-mail: [email protected]; [email protected] Manuscript received July 28, 2014; revised manuscript August 11,2014; accepted October 20, 2014. DOI: 10.5935/abc.20150001 292 between genders5,6. This reality shows that effective, safe and focused treatment goals are essential, leading to a better prognosis of hypertensive individuals by reducing CV events7. The research project number 128/11 was evaluated and approved by the Ethics Committee of the Hospital das Clínicas, Universidade Federal de Goiás (UFG) and all participants signed an informed consent form. This was a quasi-experimental study including a representative sample of the population of hypertensive patients undergoing follow-up at the CRHD. Guimarães Filho et al. Progression Of Pressure And Outcomes In Hypertensive Individuals Original Article The CRHD was created with the primary purpose of building a system to reorganize the services offered to carriers of these diseases. In its structure, the Center seeks to monitor continually, by a multidisciplinary team, the care through consultations, use of medication, control of risk factors and CV outcomes. The sample size was calculated assuming a significance level of 5%, at a confidence interval of 95%, with an absolute accuracy of 2.5% and an estimated frequency of concurrence of other risk factors associated with hypertension of 73.47% (Lessa et al., 2004) with an estimated frequency of 25% of the patients with controlled BP, according to Burt et al., 1995. Based on these parameters, we obtained 1,298 individuals. From an initial database of 14,000 patients enrolled in the CRHD, we randomly selected the participants for the study. We included individuals of both genders (18 to 95 years), diagnosed with hypertension and undergoing regular treatment, registered at the CRHD between 2003 and 2012 until six months before starting data collection. Exclusion criteria included inability or refusal to sign the consent form, participation in other research protocols, presence of type 1 diabetes mellitus (DM), inability to locate the subject in two home visits, and incomplete initial consultation form. We analyzed data from medical records pertaining the admission to the Center, and then followed up the individuals with new data collection during home visits. The instruments used on the admission to the CRHD and during home visit contained information related to anthropometric parameters, personal data, BP measurements, sedentary lifestyle, smoking, alcohol consumption, DM, dyslipidemia, stroke, AMI, chronic renal failure (CRF), and coronary artery bypass grafting (CABG). We considered individuals as smokers if they consumed at least one cigarette a day8. Alcohol intake was reported by the patient as present or not, without amount quantification. We defined as physically active those individuals who reported engaging in any physical activity at least 3 times a week for at least 30 minutes each time. The investigation of the diet was simplified and the individuals were asked if they were in a low-sodium, low-calorie, low-carbohydrate or low-fat diet. The use of medication was assessed during home visits through medical prescription and/or visual confirmation of the medications. The presence of DM and dyslipidemia was determined by evaluating existing biochemical tests which confirmed the disorder, or use of specific medications. In the absence of both, we performed a rapid test of blood glucose with a glucometer (ACTIVE®, model Accu-Chek), and a lipid profile with biochemical analysis performed in a laboratory of the public health system (SUS). Cardiovascular outcomes considered in the study were AMI, CABG, stroke, CRF and death. The investigation of these outcomes was performed based on report by the participant, a family member or a companion, by complementary tests, medical records or death certificate. We calculated the body mass index (BMI) using the Quetelet index9. The weight was measured with the participant without shoes, using a calibrated electronic scale (Toledo®), with an accuracy of 100 g. The height was measured with an inextensible tape measure 150 inches long, set 50 inches above the ground. The BP measurement on admission was performed with a calibrated aneroid sphygmomanometer (Preminum®). During home visits, the BP was measured with a digital, calibrated and validated automated sphygmomanometer (OMRON 710 CP). We performed two measurements with 1 minute interval between each and considered for analysis the average between them. Both measurements were performed according to the VI Brazilian Guidelines on Hypertension (2010). Statistical Analysis The statistical analysis was performed with the software SPSS v.20.0®. To verify the normality of the data distribution we used the Kolmogorov-Smirnov test. For correlation between variables, we calculated the correlation coefficient of Pearson or Spearman. To compare means between related groups, we used the Wilcoxon test, Student’s t test or ANOVA and the McNemar’s test to compare categorical variables at different moments. To compare proportions, we used the chi-square test (χ2). For all tests, we considered a significance level of 5% and a confidence interval of 95%. Results The initial sample (admission phase) consisted of 1,299 participants. Of these, 123 were not found for the 2nd phase in two contact attempts and/or refused to participate in the study and were replaced by other participants of the initial database. The final sample (home visit) consisted of 1,227 individuals, with 72 deaths recorded. The mean age was 56.7±13.1 years (minimum of 18 years and maximum of 95 years), 60.9% were females and 45.3% were in the age range above 60 years. The frequency of elderly individuals at the admission to the CRHD was 45.3% (n = 588), of which 63.0% (n = 320) were males. Regarding risk factors for CV disease, besides hypertension, we observed at the beginning of the study that 59.4% (n = 772) were sedentary, 21.2% (n = 275) were smokers, 1.3% (n = 17) consumed alcohol, 25.3% (n = 329) were diabetics, 1.5% (n = 20) reported dyslipidemia and 66.8% (n = 858) were overweight. In the beginning of the study, 9.9% (n = 128) of the cohort reported a history of stroke, the same number of participants reported AMI, 12.7% (n = 165) reported CRF and 1.1% (n = 14) reported CABG. The risk factors for CV diseases were also observed equally between men and women, except for excess weight, which was significantly higher among women. As for initial CV outcomes, we observed among men significantly higher frequencies of stroke and CRF. Analysis of the risk factors and CV outcomes relative to the age range (< 60 years and > 60 years) showed no significant differences. Upon admission, 914 patients (70.4%) had a BP outside the control targets. Among diabetics, it was also elevated the Arq Bras Cardiol. 2015; 104(4):292-298 293 Guimarães Filho et al. Progression Of Pressure And Outcomes In Hypertensive Individuals Original Article number of individuals (n = 295) without adequate BP control, corresponding to 89.7% of those. Of 1,299 participants initially analyzed, 1,227 were reevaluated at home visits. The mean follow-up was 4.5 ± 2.2 years (median 5 years), with a maximum of 9 years and a minimum of 1 year. Over time, there was a significant increase in the presence of CV risk factors among the participants, with the exception of smoking for which there were no changes (Table 1). As for CV outcomes, we observed during the home visit a significantly higher frequency of stroke and CABG, and a lower frequency of CRF (Table 2). In both phases of the study, there was a predominance of hypertensive and overweight individuals from both genders, which showed significant increase during follow-up (Table 3). From admission to home visits, there was a significantly greater percentage of patients with controlled BP (Table 4). Of the deaths that occurred during follow-up, 87.5% (n = 63) were due to CV diseases. There was no statistically significant difference in the frequency of deaths according to the age range (< 60 years and > 60 years). Discussion In the study cohort, there was a predominance of women (p < 0.01), which was probably related, among other reasons, to an inability of men to attend appointments during the available hours of operation of the health services. Similar results were also shown by Nascente et al, 201010 and during the last phase of the National Health and Nutrition Examination Survey (NHANES VI)11. The present study showed a large number of overweight participants, which were most frequently women. Similar results were also observed in Goiânia7, Cuiabá12, Nobres13, and São Luiz14. This fact shows the importance of excessive weight as a risk factor and additional obstacle for improved hypertension control. The investigation showed an increased rate of sedentary lifestyle (p < 0.01) during follow-up, which affected 76.3% of the participants. This result is similar to that reported by Duncan et al.15 who found only 30% of the subjects practicing regular physical activity. This is another factor which prevents a more effective implementation, since evidence indicates that a regular routine of exercise lowers BP and reduces CV mortality by 30%16. The possibility of association between hypertension and DM is 50%, which not infrequently requires management of both diseases in the same individual. This is compounded by the fact that this association enhances microvascular and macrovascular damages arising from both diseases, causing high cardiovascular and cerebrovascular morbidity1. Effective treatment for these patients with high CV risk is crucial17. This study also showed Table 1 – Presence of cardiovascular (CV) risk factors at baseline and at follow-up (Rio Verde - GO, 2012) Admission (n = 1,299) Variables Follow-up (n = 1,227) n % n % p* Yes 772 59.4 936 76.3 0.00 No 527 40.6 291 23.7 Yes 275 21.2 268 21.8 No 1,024 78.8 959 78.2 Yes 17 1.3 157 12.8 No 1,282 98.7 1,070 87.2 Yes 329 25.3 415 31.9 No 970 74.7 812 66.2 Sedentarism Smoking 0.73 Alcoholism 0.00 Diabetes mellitus 0.00 Dyslipidemias Yes 20 1.5 367 29.9 No 1,279 98.5 860 70.1 Yes 858 66.1 875 71.3 No 427 32.9 352 28.7 0.00 Excessive weight (*) McNemar’s test. 294 Arq Bras Cardiol. 2015; 104(4):292-298 0.00 Guimarães Filho et al. Progression Of Pressure And Outcomes In Hypertensive Individuals Original Article Table 2 – Distribution of cardiovascular (CV) outcomes at admission and at follow-up (Rio Verde - GO, 2012) Admission (n = 1,299) Variables Follow-up (n = 1,227) n % n % p* 0.003 Stroke Yes 128 9.9 152 12.4 No 1,171 90.1 1,075 87.6 Yes 128 9.9 129 10.5 No 1,171 90.1 1,098 89.5 Yes 165 12.7 129 10.5 No 1,134 87.3 1,098 89.5 AMI 0.372 CRF 0.00 CABG Yes 14 1.1 79 6.4 No 1,285 98.9 1,148 93.6 0.00 (*) McNemar test. AMI: Acute myocardial infarction; CRF: Chronic renal failure; CABG: Coronary artery bypass grafting. Table 3 – Changes in body mass index (BMI) at admission and at follow-up according to gender (Rio Verde - GO, 2012) BMI Admission Follow-up (n = 1,299) (n = 1,227) Mean ± SD Mean ± SD p* Male 27.2 ± 5.1 27.6 ± 5.2 0.00 Female 28.9 ± 6.6 29.3 ± 6.6 0.00 (*) Wilcoxon sign test. SD: Standard deviation. Table 4 – Progression of the rate of blood pressure (BP) control at baseline and at follow-up (Rio Verde - GO, 2012) Admission Uncontrolled BP Controlled BP Total Follow-up n % n % p* RR CI 914 70.4 741 60.4 0.00 1.2 1.1-1.4 385 29.6 486 39.6 1,299 100.0 1,227 100.0 (*) McNemar’s test. CI: confidence interval; RR: Risk ratio. higher presence of DM during follow-up (p < 0.01) which can also be a limiting factor for better control of hypertension and CV outcomes. The complications associated with higher frequency of hypertension and/or DM were stroke and AMI. Similar results were observed by Moreira and Santos in Fortaleza in 201218. Regarding stroke, which is closely related to BP values, it has been occurring at an increasingly earlier age in Brazil19. A study in a northeastern region of the country in 2012 also demonstrated that this complication was the most frequent in 6.2% of the hypertensive patients registered in the records analyzed18. Brescacin et al.20, in a study published in 2010, showed that long-standing hypertension is Arq Bras Cardiol. 2015; 104(4):292-298 295 Guimarães Filho et al. Progression Of Pressure And Outcomes In Hypertensive Individuals Original Article one of the main reasons for a reduction in life expectancy in subjects with stroke. The present study showed that such complication was more frequent among hypertensive individuals, both at admission and during follow-up, even in those with better BP control. The explanation may be the low effectiveness of BP control achieved by the program, and eventually by a greater association with other comorbidities, such as the increased presence of excessive weight and even, age progression. There is a clear need for a critical reassessment of these projects, but it is fundamental to reorganize all primary care. This should be based on a better working relationship with valorization of health professionals (creation of a formal career in health care), in the restructuring of multidisciplinary teams with defined responsibilities, and reorganization of the service itself, with decentralized installations, operation on alternative schedules, valorization of health promotion, and home visits. Coronary heart disease, including AMI, is one of the most common CV outcomes of hypertension21,22. In this study, AMI was the second most frequent complication (10.5%) , similar to that observed in another study, but with an incidence of 4.4%. Among these, half were hypertensive, whereas the other half had hypertension and DM, confirming the significant association with such complication6. Within this line of reasoning, special attention should be paid to care regarding medication adherence to changes in lifestyle habits, with the implementation of continuing education in real hopes of lowering cardiovascular outcomes26,28. The INTERHEART study, which was a multicentric international study planned to systematically assess the importance of risk factors for coronary heart disease in the world, has confirmed that the traditional risk factors explained more than 90% of the risk attributable to AMI23. The study AFIRMAR24, performed in 104 hospitals in 51 Brazilian cities, presented virtually identical findings. Hypertension is closely related to CRF, and may be the cause or the consequence of the renal disease25. A study conducted in the northeast area of Brazil showed 4.4% of CRF, in which half of these subjects were hypertensive and the other half had association of hypertension and DM18. In the present study, surprisingly, we observed a significant decrease in the percentage of individuals with CRF, from 12.7% to 10.5%. The fact that the collection of this variable has been recounted by the patient at the stage of admission in detriment of biomedical criteria for diagnosis of the disease was a major limitation of the study and may explain this result. A significant increase in risk factors and CV complications evidenced in this investigation over five years may be explained by the aging of the population itself, since age is a major risk factor for hypertension and consequently, for their CV outcomes. However, one must consider that the collection of retrospective data (on the admission to the Center) may have represented a bias, which led to some of the results found26,27. The results obtained are far from ideal , since only 39.6% of the patients obtained BP control in the final evaluation and, as incredible as it may seem, this percentage is among the best reported in the literature26,28-30. Similar results were observed in the American study NHANES (2003 -2004), which showed BP controlled in 36.8%11. Similarly in Brazil, among hypertensive patients registered in the program HIPERDIA in the city of Novo Hamburgo, Rio Grande do Sul, the control of hypertension reached 33.7%31. Also in the State of Rio Grande do Sul, a recent investigation32 found that only 10.4% of the individuals undergoing antihypertensive treatment had adequately controlled BP levels, whereas the CARMELA study33 showed a rate of BP control of 24%. If we take into account the philosophy and the objectives for which the CRHD medical unit was created, an alert message should be recorded with the results found. Clearly, there have been significant advances in the structure and form of care, but the results are still not ideal. 296 Arq Bras Cardiol. 2015; 104(4):292-298 This study has the limitations of studies that use in part retrospectively collected data. An important example is the possibility of an underestimation of metabolic changes that were mentioned in the first assessment and which were information effectively obtained from measurements at follow-up visits, which can simulate falsely higher values in the second stage. Despite these limitations, the sample size, and the fact that the final data collection was conducted during home visits, this study offers security for those who consider the provided information sufficiently consistent, to indicate paths in search of an improvement in the primary care population in one of the areas of greatest need and importance. Conclusions The results of this study show that, despite the improvement in the rates of BP control, there was a significant increase in risk factors and CV outcomes in the participants undergoing intervention by the CRHD compared with their stage of admission to the unit. It is noteworthy, therefore, the importance of evaluating mechanisms from the earliest stages, so that over time there is an adequate assessment of the developments of the quality of care. Author contributions Conception and design of the research:Guimarães Filho GC, Sousa ANL, Jardim PCBV. Acquisition of data: Guimarães Filho GC, Sousa ANL, Jardim PCBV. Analysis and interpretation of the data: Guimarães Filho GC, Sousa ANL, Jardim PCBV. Statistical analysis: Guimarães Filho GC, Sousa ANL. Obtaining financing: Guimarães Filho GC. Writing of the manuscript: Guimarães Filho GC, Sousa ANL, Jardim PCBV. Critical revision of the manuscript for intellectual content: Guimarães Filho GC, Sousa ANL, Jardim TSV, Souza WSB, Jardim PCBV. Potential Conflict of Interest No potential conflict of interest relevant to this article was reported. Sources of Funding There were no external funding sources for this study. Study Association This article is part of the thesis of master submitted by Gilberto Campos Guimarães, from Liga de Hipertensão da Universidade Federal de Goiânia (UFG - Goiás). Guimarães Filho et al. Progression Of Pressure And Outcomes In Hypertensive Individuals Original Article References 1. Sociedade Brasileira de Cardiologia, Sociedade Brasileira de Hipertensão, Sociedade Brasileira de Nefrologia. VI Diretrizes brasileiras de hipertensão arterial. Rev Bras Hipertens. 2010;95 (1suppl 1):1-51. 2. Fields LE, Burt VL, Cutler JA, Hughes J, Roccella E, Sorlie P. The burden of adult hypertension in the United States 1999 to 2000: a rising tide. Hypertension. 2004;44(4):398-404. health examination surveys and epidemiological studies with 370 countryyears and 2.7 million participants. Lancet. 2011;378(9785):31-40. 18. Santos JC, Moreira TM. Fatores de risco e complicações em hipertensos/ diabéticos de uma regional sanitária do nordeste brasileiro. Rev esc enferm USP. 2012;46(5):1125-32. 3. Passos VM, Assis TD, Barreto SM. Hipertensão arterial no Brasil: estimativa de prevalência a partir de estudos de base populacional. Epidemiol Serv Saúde. 2006;15(1):35-45. 19. Malta DC, Moura L, Souza FM, Rocha FM, Fernandes FM. Doenças crônicas não transmissíveis: mortalidade e fatores de risco no Brasil, 1990 a 2006. In: Ministério da Saúde. Saúde Brasil 2008: 20 anos de Sistema Único de Saúde (SUS). Brasília; 2009. 4. Kearney PM, Whelton M, Reynolds K, Muntner P, Whelton PK, He J. Global burden of hypertension: analysis of worldwide data. Lancet. 2005;365(9455):217-23. 20. Brescacin L, Alonzo C, Zurru MC, Brienza S, Ortega F, Romano M, et al. Secundary stroke prevention in the very ederly in real life. J Hypertens. 2010;28(Suppl A):139-42. 5. Williams BD. The year in hypertension. J Am Coll Cardiol. 2010;55(1):65-73. 21. Kannel WB. Blood pressure as a cardiovascular risk factor: prevention and treatment. JAMA. 1996;275(20):1571-6. 6. Ibrahim MM, Danaei AD, Finucane MM, Lin JK; Global Burden of Metabolic Risk Factors of Chronic Diseases Collaborating Group (Blood Pressure). National, regional, and global trends in systolic blood pressure since 1980: systematic analysis of health examination surveys and epidemiological studies with 786 country-years and 5.4 million participants. Lancet. 2011;377(9765):568-77. 7. Jardim PC, Gondim MR, Monego ET, Moreira HG, Vitorino PV, Souza WK, et al. Hipertensão arterial e alguns fatores de risco em uma capital brasileira. Arq Bras Cardiol. 2007;88(4):452-7. 8. Ministério da Saúde. Fundação Nacional de Saúde. Inquérito domiciliar sobre comportamentos de risco e morbidade referida de doenças e agravos não transmissíveis. Brasília (DF); 2011. 9. World Health Organization. (WHO). The World Health Report 2002: reducing risks, promoting healthy life. Geneva; 2002. 10. Nascente FM, Jardim PC, Peixoto MR, Monego ET, Moreira HG, Virotino PV, et al. Hipertensão arterial e sua correlação com alguns fatores de risco em cidade brasileira de pequeno porte. Arq Bras Cardiol. 2010;95(4):502-9. 11. Ong KL, Cheung BM, Man YB, Lau CP, Lam KS. Prevalence, awareness, treatment, and control of hypertension among United States adults 19992004. Hypertension. 2007;49(1):69-75. 12. Franco GP, Scala LC, Alves JC, França GV, Cassanelli T, Jardim PC. Síndrome metabólica em hipertensos de Cuiabá-MT: prevalência e fatores associados. Arq Bras Cardiol. 2009;92(6):472-8. 13. Rosário TM, Scala LC, Araújo GV, França GV, Jardim PC. Prevalência, controle e tratamento da hipertensão arterial sistêmica em Nobres-MT. Arq Bras Cardiol. 2009;93(6):622-8, 672-8. 14. França AK, Santos AM, Calado IL, Santos EM, Cabral PC, Salgado JV, et al. Filtração glomerular e fatores associados em hipertensos atendidos na Atenção Básica. Arq Bras Cardiol. 2010;94(6):779-87. 15. Duncan BB, Stevens A, Schmidt MI. Mortalidade por doenças crônicas no Brasil: situação em 2010 e tendências de 1991 a 2010. In: Ministério da Saúde, Brasil 2011. Brasília, DF. 2012. p. 95-103. 16. Guedes NG, Lopes MV, Moreira RP, Cavalcante TF, Araújo TL. Prevalence of sedentary lifestyle in individuals with high blood pressure. Int J Nurs Terminol Classif. 2010;21(2):50-6. 17. Danaei G, Finucane MM, Lu Y, Singh GM, Cowan MJ, Farzadfar F, et al; Global Burden of Metabolic Risk Factors of Chronic Diseases Collaborating Group (Blood Glucose). National, regional, and global trends in fasting plasma glucose and diabetes prevalence since 1980: systematic analysis of 22. National High Blood Pressure Education Program Working Group report on primary prevention of hypertension. Arch Intern Med. 1993;153(2):186-208. 23. Yusuf S, Hawken S, Ounpuu S, Dans T, Avezum A, Lanas F, et al. Effect of potentially modifiable risk factors associated with myocardial infarction in 52 countries (the INTERHEART study): case-control study. Lancet.2004;364(9438):937-52. 24. Piegas LS, Avezum A, Pereira JC, Rossi Neto JM, Hoepfner C, Farran JA, et al; AFIRMAR Study Investigators. Risk factors for myocardial infarction in Brazil. Am Heart J. 2003;146(2):331-8. 25. Moreira HG, Sette JB, Keiralla LC, Alves SG, Pimenta E, Sousa M, et al. Diabetes mellitus, hipertensão arterial e doença renal crônica: estratégias terapêuticas e suas limitações. Rev Bras Hipertens. 2008;15(2):111-6. 26. Pereira MR, Coutinho MS, Freitas PF, D’Orsi E, Bernardi A, Hass R. Prevalência, conhecimento, tratamento e controle de hipertensão arterial sistêmica na população adulta urbana de Tubarão, Santa Catarina, Brasil, em 2003. Cad Saúde Pública. 2007;23(10):2363-74. 27. Longo GZ, Neves J, Luciano VM, Peres MA. Prevalence of high blood pressure levels and associated factors among adults in Southern Brazil. Arq Bras Cardiol. 2009;93(4):387-94, 380-6. 28. Zattar LC, Boing AF, Giehl MWC, D’Orsi E. Prevalência e fatores associados à pressão arterial elevada, seu conhecimento e tratamento em idosos no sul do Brasil. Cad Saúde Pública. 2013;29(3):507-21. 29. Cipullo JP, Martin JF, Ciorlia LA, Godoy MR, Cação JC, Loureiro AA, et al. Hypertension Prevalence and Risk Factors in a Brazilian Urban Population. Arq Bras Cardiol. 2010;94(4):519-26. 30. Basu S, Millett C. Social epidemiology of hypertension in middle-income countries: determinants of prevalence, diagnosis, treatment, and control in the WHO SAGE Study. Hypertension. 2013;62(1):18-26. 31. de Souza CS, Stein AT, Bastos GA, Pellanda LC. Controle da pressão arterial em hipertensos do Programa Hiperdia: estudo de base territorial. Arq Bras Cardiol. 2014;102(6):571-8. 32. Gus I, Harzheim E, Zalavsky C, Medina C, Gus M. Prevalência, reconhecimento e controle da hipertensão arterial sistêmica no estado do Rio Grande do Sul. Arq Bras Cardiol. 2004;83(5):429-33, 424-8. 33. Hernández-Hernández R, Silva H, Velasco M, Pellegrini F, Macchia A, Escobedo J, et al. CARMELA Study Investigators. Hypertension in seven Latin American cities: the Cardiovascular Risk Factor Multiple Evaluation in Latin America (CARMELA) study. J Hypertens. 2010;28(1):24-34. Arq Bras Cardiol. 2015; 104(4):292-298 297 Guimarães Filho et al. Progression Of Pressure And Outcomes In Hypertensive Individuals Original Article 298 Arq Bras Cardiol. 2015; 104(4):292-298 Back to the Cover Original Article Quality of Life on Arterial Hypertension: Validity of Known Groups of MINICHAL Ana Lúcia Soares Soutello1, Roberta Cunha Matheus Rodrigues1, Fernanda Freire Jannuzzi1, Thaís Moreira São-João1, Gabriela Giordano Martini1, Wilson Nadruz Jr.1, Maria-Cecília Bueno Jayme Gallani2 Universidade Estadual de Campinas (Unicamp)1, Campinas, SP - Brazil; Université Laval2 – Canadá Abstract Background: In the care of hypertension, it is important that health professionals possess available tools that allow evaluating the impairment of the health-related quality of life, according to the severity of hypertension and the risk for cardiovascular events. Among the instruments developed for the assessment of health-related quality of life, there is the Mini-Cuestionario of Calidad de Vida en la Hipertensión Arterial (MINICHAL) recently adapted to the Brazilian culture. Objective: To estimate the validity of known groups of the Brazilian version of the MINICHAL regarding the classification of risk for cardiovascular events, symptoms, severity of dyspnea and target-organ damage. Methods: Data of 200 hypertensive outpatients concerning sociodemographic and clinical information and health-related quality of life were gathered by consulting the medical charts and the application of the Brazilian version of MINICHAL. The Mann-Whitney test was used to compare health-related quality of life in relation to symptoms and target-organ damage. The Kruskal-Wallis test and ANOVA with ranks transformation were used to compare health-related quality of life in relation to the classification of risk for cardiovascular events and intensity of dyspnea, respectively. Results: The MINICHAL was able to discriminate health-related quality of life in relation to symptoms and kidney damage, but did not discriminate health-related quality of life in relation to the classification of risk for cardiovascular events. Conclusion: The Brazilian version of the MINICHAL is a questionnaire capable of discriminating differences on the health‑related quality of life regarding dyspnea, chest pain, palpitation, lipothymy, cephalea and renal damage. (Arq Bras Cardiol. 2015; 104(4):299-307) Keywords: Hypertension; Quality of Life; Validation Studies; Clinical Trial; Psychometry; Questionnaires. Introduction Arterial hypertension (AH) is a highly prevalent disease worldwide. It is a major condition for an increased risk of cardiovascular morbidity and mortality 1-3. Studies 4,5 have demonstrated that hypertensive patients with target organ damage (TOD) have a worse prognosis than patients with non‑complicated AH, because of the high risk for cardiovascular events among those with vascular damage6,7. Although common, high-risk AH is underdiagnosed or undertreated, and this has prompted the foreign guidelines to recommend that its management be based on the assessment of blood pressure levels and of the overall cardiovascular risk6-9. Early detection of hypertensive damage enables the introduction of drug therapy, thus contributing for the Mailing address: Thaís Moreira São-João • Faculdade de Enfermagem – Unicamp Rua Tessália Vieira de Camargo, 126, Cidade Universitária “Zeferino Vaz”. Postal Code 13.083-887, Campinas, SP – Brazil. E-mail: [email protected] Manuscript received May 27, 2014; revised manuscript October 13, 2014; accepted November 05, 2014. DOI: 10.5935/abc.20150009 299 reduction of AH-related cardiovascular events and for a better prognosis10, as well as for the improvement of health‑related quality of life (HRQoL). An adequate measurement of HRQoL is a challenge for health professionals, researchers and health policy makers11, and this has encouraged the construction and validation of HRQoL measurement instruments. Among the types of validity, that of known groups, which tests the difference of characteristics measured among two or more groups of subjects12, is of great interest in the clinical practice because it permits the verification of the instrument’s ability to discriminate groups with distinct characteristics such as different levels of severity of disease. In the care of hypertensive patients, it is important for health professionals to have tools to enable them to assess the impact on HRQoL13 according to the severity of AH and the risk for cardiovascular events; this should contribute for the design of specific interventions14. Among the instruments created to assess HRQoL, we point out the Mini-Cuestionario de Calidade de Vida em la Hipertensión Arterial (MINICHAL)15-18, recently adapted for Brazil19. The Brazilian version showed evidences of reliability and validity19-21, and proved to be able to discriminate normotensive from hypertensive individuals19. Soutello et al. Performance of MINICHAL on Arterial Hypertension Original Article Since the severity of AH can be assessed according to different clinical criteria, the objective of this study was to estimate the validity of known groups of the Brazilian version of MINICHAL among hypertensive individuals, in relation to the classification or risk for cardiovascular events, the occurrence of TOD, the presence of symptoms and severity of dyspnea. Methods Research centers This research was carried out in an AH outpatient service of a university hospital and in a Basic Health Unit (UBS – Unidade Básica de Saúde), both located in the State of Sao Paulo. Subjects A total of 200 hypertensive patients with ages 18 years and above, and being followed up on an outpatient basis for at least 6 months were enrolled in this study. Patients with secondary AH, comorbidities of great impact on HRQoL (such as neoplasia and dialytic kidney failure), chronic lung diseases not related to AH (to exclude patients with dyspnea not related to AH), and those unable to comprehend and communicate verbally. Sampling process The sample size was calculated based on the difference between the means of MINICHAL domains observed in a pilot study (n = 27). Considering alpha of 0.05 and a test power of 80% (beta of 0.20), a total of 200 subjects was estimated. In order to achieve the minimum estimated sample size, patients who met the inclusion criteria and did not meet any of the exclusion criteria were enrolled sequentially until the established n was reached. Data collection Data were collected by the principal investigator in the research centers previously mentioned, from May to December 2009, after the participants had given written informed consent (WIC). The method of available data recording was used to obtain sociodemographic data from the medical records (gender, skin color, age and marital status). To determine the overall cardiovascular risk according to international guidelines7, the following clinical variables were obtained: family history of early cardiovascular disease (in women with less than 65 years of age and men with less than 55); history of previous and current cigarette smoking; dyslipidemias; diabetes mellitus (DM) and/ or glucose intolerance (plasma glucose levels between 102 and 125 mg/dL); hyperuricemia (uric acid > 7 mg/dL for men and > 6.5 mg/dL for women); obesity (body mass index – BMI > 30 kg/m2); and abdominal obesity (waist circunference – WC > 102 cm for men and > 88 cm for women7). Definition of target organ damage In the present study, TOD was considered as kidney function abnormalities (microalbuminuria, decreased creatinine clearance and increased serum creatinine), cardiac abnormalities (echocardiographic evidence of left ventricular hypertrophy – LVH, and diastolic dysfunction), vascular diseases, and hypertensive retinopathy. LVH was defined by the ratio left ventricular mass / body surface ≥ 125 g/m2 for men and ≥ 110 g/m2 for women22. Diagnosis of diastolic dysfunction was retrieved from Doppler echocardiography reports. The presence of at least one atherosclerotic plaque (defined as focal thickening > 1.3 mm in any segment of the carotid arteries23 and/or presence of diffuse wall thickening, with mean common carotid artery thickness > 0.9 mm) was considered evidence of vascular abnormalities 7 . Hypertensive retinopathy was diagnosed by the presence of the following abnormalities on fundoscopy, as performed by an ophthalmologist: arteriolar narrowing and light reflex changes (grade 1); arteriolar narrowing, more marked reflex changes and arteriovenous nicking (grade 2); grade 2 abnormalities, retinal hemorrhage and exudates (grade 3); or grade 3 abnormalities and papilledema (grade 4), according to the Keith-Wagener-Barker classification24. After data collection from the medical records, the patients were submitted to interview for collection of sociodemographic data (years of schooling, employment status, and monthly personal and family income) and clinical data, such as the presence of symptoms (dyspnea, chest pain, fatigue, headache, palpitations, and presyncope), measured as dichotomous variables (yes/no). The purpose of interview was also to obtain information regarding HRQoL by means of the administration of the Brazilian version of MINICHAL. For hypertensive patients reporting dyspnea, severity of symptom was assessed by means of the Brazilian version of the instrument Medical Research Council (MRC)25. Instruments MINICHAL consists of the short version18 of Calidad de Vida em la Hipertensión Arterial (CHAL), developed and validated in Spain14-16. This is a self-administered instrument comprised of 16 items divided into the Mental Status (1 to 10) and Somatic Manifestations (11 to 16) dimensions, in addition to one general question on quality of life, which is not included in any of the dimensions. The items address the past 7 days, by means of a Likert scale with the following four possible answers: zero (absolutely not); 1 (yes, a little); 2 (yes, enough); and 3 (yes, a lot). The total score is obtained by the sum of the items, and ranges from zero to 30 for the Mental Status dimension, and from zero to 18 for the Somatic Manifestations dimension; the closer to zero, the better the quality of health. The question on general perception of health is scored with the same possible answers, but is not considered in the total score sum. In the present study, the Brazilian version of MINICHAL was used. However, for the total score sum, the composition of dimensions of the original instrument18 was considered, since in the validation study for the Brazilian context19, item 10 was excluded from the Mental Status dimension and included in the Somatic Manifestations dimension, and the question regarding the overall perception of health was included as the 17th question. The total score was calculated when the number of missing questions did not exceed 25% of the total items administered, i.e., when the number of valid items was equal Arq Bras Cardiol. 2015; 104(4):299-307 300 Soutello et al. Performance of MINICHAL on Arterial Hypertension Original Article to 8 and 5 in the Mental Status and Somatic Manifestations dimensions, respectively21. The question on general perception of health was not considered in the total score sum, like in the validation study18. Although the instrument had been originally developed to be self-administered, given the low level of education of participants, it was decided that it would be administered by means of an interview. MINICHAL reliability was evaluated as for its internal consistency by means of the calculation of Cronbach’s alpha (α) coefficient. α values of 0.85, 0.84 and 0.59 were verified for the total score sum, Mental Status dimension, and Somatic Manifestations dimension, respectively. MRC is an instrument developed and validated in England to measure the severity of dyspnea in patients with obstructive pulmonary diseases 26, and comprises five items, with answer scores ranging from 1 to 5. Grade 1 corresponds to breathlessness on strenuous exercise; grade 2, to breathlessness hurrying on the level or up a slight hill; grade 3, when walking slower than people of the same age because of breathlessness or having to stop for breath even when walking at their own pace; grade 4, when having to stop after walking less than 100 m or after a few minutes; and grade 5, when breathlessness prevents from leaving the house or when dressing. The version adapted for the Brazilian context was used25. hypertensive patients with different levels of dyspnea25, followed by the Tukey’s test to locate differences. The Kruskal-Wallis test was used to compare HRQoL scores among hypertensive patients stratified according to their risk for cardiovascular events7, as follows: low, if stage-1 AH, with no risk factor (RF); moderate, if stage-1 AH, with one to two RF and stage-2 AH, with no RF or with one to two RF; high, if stages 1 or 2 AH, with three or more RF or TOD or DM; and very high, if stages 1 or 2 AH and cardiovascular disease and stage-3 AH, with one to two RF and/or with three or more RF or TOD or DM or cardiovascular disease. Findings were considered significant when p value < 0.05. Ethical aspects The study was approved by the local Research Ethics Committees (report 1083/2008), according to the Declaration of Helsinki. Results Data analysis The sample (n = 200) was mostly comprised of women (58%);with a mean age of 57 (11.3) years; Caucasians (64.5%); living with a partner (61.5%); economically active (59.0%); with a mean schooltime of 6.0 (4.1) years; and mean personal and family income of 1.6 (1.5) and 3.2 (2.1) minimum wages per month, respectively (Table 1). Data were entered into the Excel for Windows 2003 software and transported to the Statistical Analysis System (SAS) for Windows version 9.02 software for descriptive analyses (of frequency for categorical variables; mean, median, standard deviation and variation for continuous variables) and comparison (between means of psycosocial variables). Since the variable of interest was non-normally distributed, non-parametric tests were used. The Mann-Whitney test was used to compare the HRQoL scores in relation to symptoms, and the Analysis of Variance (ANOVA) with rank transformation, to compare HRQoL among The group was characterized by a mean time of 12.6 (10.5) years of AH, with a mean of 3.1 (1.7) associated clinical conditions and/or RF. Half the group showed more than two associated symptoms; 42.5% had TOD, especially LVH and mean use of 3.6 (2.4) medications/day. Half the sample showed high and/or very high risk for the occurrence of cardiovascular events (50.5%); 16.5% of the subjects were considered with no risk for cardiovascular events, since their blood pressure levels fit the optimal/normal/ borderline stage (Table 2). Table 1 – Sociodemographic characteristics of the hypertensive individuals (n = 200) being followed up on an outpatient basis in a university hospital and Basic Health Unit, Campinas, 2009, 2010 Sociodemographic variables Age (years) n % 200 Female gender 116 58.0 Caucasian 129 64.5 Level of education (years) Marital status with partner 123 61.5 Inactive 81 40.5 Active 76 38.0 Housewife 42 21.0 Mean (SD) Median Variation 57 (11.3) 57 21-82 6 (4.1) 4 0-16 Employment status (n = 198) Income, MW* Monthly Personal income 199 1.6 (1.5) 1.29 0.0-8.6 Monthly family income 197 3.2 (2.1) 2.58 0.0-12.9 * 301 MW in the period of data collection was R$465.00 (US$265.71). MW: minimum wage; SD: standard deviation. Arq Bras Cardiol. 2015; 104(4):299-307 Soutello et al. Performance of MINICHAL on Arterial Hypertension Original Article Table 2 – Clinical characteristics of the hypertensive patients (n = 200) being followed up on an outpatient basis in a university hospital and Basic Health Unit, Campinas, 2009, 2010 Clinical variables n Mean (SD) Median Variation 12.6 (10.5) 10 1-53 3.1 (1.7) 3 0-7 Number of associated symptoms 2.1 (1.6) 2 0-6 Number of medications used 3.6 (2.4) 3 0-11 Time of arterial hypertension (years) % 198 Associated risk factors/clinical conditions Dyslipidemia 133 66.5 Abdominal obesity (WC*) 132 66.0 Family history of cardiovascular disease 117 58.5 Obesity (BMI†) 90 45.0 Metabolic syndrome 82 41.0 Glucose intolerance¶ 55 27.5 Diabetes mellitus 32 16.2 Hyperuricemia§ 31 15.5 Current cigarette smoking 21 10.5 Number of associated clinical conditions Acute coronary syndrome and/or myocardial revascularization 26 13.0 Heart failure 12 6.0 Stroke/transient ischemia 10 5.0 Peripheral artery disease 6 3.0 LVH‡ 85 42.5 Diastolic dysfunction 80 40.0 Target organ damage 21 10.5 Hypertensive retinopathy¶¶ 21 10.5 Carotid thickening 6 3.0 Headache 94 47.0 Palpitations 71 35.5 Lipotimia 57 28.5 Dyspnea 57 28.5 Chest pain 54 27.0 Hypertensive renal damage †† §§ Symptoms Risk stratification for cardiovascular events‡‡ No risk 33 16.5 Low risk 29 14.5 Moderate risk 37 18.5 High risk 65 32.5 Very high risk 36 18.0 * WC > 102 cm for men and > 88 cm for women; BMI > 30 kg/m ; blood glucose between 102-125 mg/dL; § uric acid > 7 mg/dL for men and > 6.5 mg/dL for women; LVH ≥ 125 g/m2 ffor men and ≥ 110 g/m2 for women; †† hypertensive renal damage: creatinine clearance ≤ 60 mL/minute and/or serum creatinine > 1.5 mg/dL for men and > 1.4 mg/dL for women and/or microalbuminuria > 300 mg/24 hours; ¶¶ hypertensive retinopathy: arteriolar narrowing and light reflex changes (grade 1); arteriolar narrowing and more marked reflex changes and arteriovenous nicking (grade 2); grade 2 changes, retinal hemorrhages and exudates (grade 3); or grade 3 changes and papilledema (grade 4) on fundoscopy; §§ intima-media > 0.9 mm; ‡‡ according to the European Society of Hypertension/European Society of Cardiology Guidelines7. SD: standard deviation; WC: waist circumference; BMI: body mass index; LVH: left ventricular hypertrophy. † 2 ¶ ‡ Arq Bras Cardiol. 2015; 104(4):299-307 302 Soutello et al. Performance of MINICHAL on Arterial Hypertension Original Article Construct validity: assessment of known groups The construct validity of the Brazilian version of MINICHAL was verified by means of the assessment of known groups. It has been hypothesized that hypertensive patients with symptoms (dyspnea, chest pain, presyncope, palpitations and headache), TOD and high risk for cardiovascular events would have a significantly higher HRQoL score than hypertensive patients with no complications, i.e., with no symptoms, no TOD, and at a low risk for cardiovascular events, according to international guidelines. Significantly higher HRQoL scores were observed among those with renal damage in comparison to hypertensive patients with preserved renal function, as regards the Somatic Manifestations dimension and total MINICHAL score. However, no significant difference was observed in the comparison of HRQoL scores between patients with or without LVH, as well as between those with and without diastolic dysfunction and/or hypertensive retinopathy (Table 3). We verified that hypertensive patients reporting symptoms showed significantly higher scores (worse HRQoL) in both dimensions and total score of the Brazilian version of MINICHAL when compared to those without symptoms. In addition, the Brazilian version of MINICHAL was proven to be able to discriminate HRQoL among hypertensive patients without and with different levels of dyspnea (Table 4). However, no dimension of the Brazilian version of MINICHAL was able to discriminate HRQoL between patients classified as without and/or at a low/moderate risk and those at a high/very high risk for cardiovascular events (Table 5). Discussion The objective of this study was to broaden the assessment of the validity of known groups of the Brazilian version of MINICHAL. Thus, the ability of this instrument to discriminate hypertensive patients in relation to the severity of AH was investigated, according to criteria for the classification of risk for cardiovascular events and the occurrence of TOD, as well as in relation to the presence of symptoms and severity of dyspnea. Our findings showed that the Brazilian version of MINICHAL was not able to discriminate hypertensive patients according to the criteria used for the classification of severity of AH. No significant difference was observed in HRQoL measurement in the different stages of risk for cardiovascular events, or among patients with and without TOD, except for renal dysfunction. However, the instrument was sensitive to show differences in HRQoL according to the presence of all the symptoms analyzed. In this regard, our findings are important and point to a significant perspective to be considered in the follow-up of hypertensive patients. Classically, AH is described as an asymptomatic condition. Nonetheless, in clinical practice, AH is associated with the presence of cardiovascular symptoms, probably because of the presence of other comorbidities14. In the present study, 50% of patients had more than two associated symptoms, and this corroborates the importance of the assessment of cardiovascular symptoms throughout the clinical follow-up of hypertensive patients. 303 Arq Bras Cardiol. 2015; 104(4):299-307 In the validation study of the original version of MINICHAL in the Spanish population18, significant differences were observed in the Somatic Manifestations score among hypertensive patients classified according to the stages of severity of AH proposed by the World Health Organization (stage I, with no signs of TOD; stage II, with one sign or symptom of TOD; or stage III, ≥ 1 sign and symptom of TOD)27. However, it is important to emphasize that the HRQoL measurement was different only regarding the comparison between stage-I patients (no signs of TOD and probably with no symptoms) and those of clustered stages II and III, in which the presence of symptoms was expected. In a previous study assessing HRQoL of hypertensive patients using a generic instrument, correlation between echocardiographic changes resulting from AH and HRQoL was verified only for the group presenting with dyspnea. For the group without this symptom, there was no correlation between variables. Thus, the findings point to dyspnea as an important moderator in the relation between HRQoL and one of the indicators of severity of disease, because of the echocardiographic abnormalities14. Another Brazilian study28 used the Medical Outcomes Study 36 – Item Short – Form Health Survey (SF-36) to evaluate HRQoL of 100 hypertensive patients participating in an interdisciplinary experimental study based on educational activities. No changes in the quality of life were detected among the intervention and control groups, and this was attributed to the characteristic of systemic AH of being asymptomatic. It is possible that the relatively small case series of the present study has contributed to the absence of significant findings as regards the ability of the Brazilian version of MINICHAL to discriminate different stages of severity of AH. However, the low variability of scores in the different stages weakens this hypothesis. It is hypothesized that the severity of AH, when assessed according to the presence or absence of cardiovascular symptoms, is an indicator of changes in HRQoL. This assumption corroborates the importance of the assessment of symptoms throughout the follow-up of hypertensive patients so that the pharmacological and non-pharmacological approaches be adjusted also as a function of HRQoL, which is affected by the manifestation of symptoms. In the present study, the fact that the Brazilian version of MINICHAL was not able to discriminate HRQoL between hypertensive patients with and without LVH may be explained by the inclusion of hypertensive patients with structural cardiac changes, whether symptomatic or asymptomatic. In the Spanish study18, the hypertensive patients were grouped according to the presence of signs and symptoms of TOD, which may have contributed to the discrimination of HRQoL, since MINICHAL seems to be sensitive in the detection of differences in HRQoL in the presence of symptoms. The Brazilian version of MINICHAL was also not able to discriminate HRQoL among patients allocated at the extremes of the classification of risk for cardiovascular events, which considers AH stages, coexistence of RF, cardiovascular disease, and TOD. The small number of patients distributed in the different strata of the classification may have contributed to this finding. Soutello et al. Performance of MINICHAL on Arterial Hypertension Original Article Table 3 – Scores of the Brazilian version of MINICHAL, according to clinical variables of hypertensive patients followed up on an outpatient basis (n = 200), Campinas, 2009, 2010 Domains of the Brazilian version of MINICHAL LVH † Mental Status Somatic Manifestations Total score n Mean (SD) Mean (SD) Mean (SD) Yes 85 6.3 (5.3) 3.3 (2.6) 9.6 (6.8) No 115 7.0 (5.5) 3.5 (2.7) 10.5 (7.2) NS NS NS P value* Hypertensive retinopathy ¶ Yes 21 6.2 (4.3) 3.9 (3.1) 10.1 (6.9) No 179 6.8 (5.6) 3.4 (2.6) 10.1 (7.0) NS NS NS Yes 21 7.7 (4.5) 4.8 (3.2) 12.5 (5.9) No 179 6.6 (5.5) 3.3 (2.5) 9.9 (7.1) NS < 0.05 < 0.05 P value * Renal damage§ P value* Diastolic function‡ Yes 80 6.7 (5.9) 3.4 (2.7) 10.1 (7.5) No 83 6.9 (4.7) 3.7 (2.6) 10.7 (6.2) NS NS NS Yes 57 8.9(6.9) 4.9 (2.9) 13.9 (8.6) No 143 5.8 (4.5) 2.8 (2.3) 8.7 (5.7) < 0.01 < 0.001 < 0.001 P value * Dyspnea P value* Chest pain Yes 54 9.2 (6.7) 5.3 (3.0 ) 14.5 (7.9) No 146 5.8 (4.6) 2.7 (2.1) 8.5(5.9) < 0.001 < 0.001 < 0.001 Yes 57 8.0 (5.9) 4.0 (2.5) 12 (7.3) No 143 6.2 (5.2) 3.2 (2.7) 9.4 (6.8) < 0.05 < 0.05 < 0.05 P value * Presyncope P value* Palpitations Yes 71 9.0 (6.6) 4.9 (3.0) 13.9 (8.1) No 129 5.4 (4.2) 2.6 (2.0) 8.1 (5.4) < 0.001 < 0.001 < 0.001 Yes 94 8.2 (5.7) 4.0 (2.7) 12.2 (7.2) No 106 5.4 (4.9) 2.9 (2.5) 8.3 (6.4) < 0.001 < 0.01 < 0.001 P value Headache * P value* * Mann-Whitney test; left ventricular hypertrophy: ventricular mass/body surface ≥ 125 g/m for men and ≥ 110 g/m for women; hypertensive retinopathy: presence of arteriolar narrowing and venous dilatation (type 1); arteries with spasms and pathological arteriovenous nicking (type 2); obvious arterial narrowing and irregularities, flame-shaped hemorrhage or cotton-wool spots (type 3); or papilledema associated with types 1, 2 and 3 (type 4) on fundoscopy; § renal damage: creatinine clearance ≤ 60mL/minute or serum creatinine > 1.5 mg/dL for men and > 1.4 mg/dL for women or microalbuminúria > 300 mg/24 hours; ‡ diastolic dysfunction: retrieved from Doppler echocardiogram report. SD: standard deviation; NS: not significant; LVH: left ventricular hypertrophy. † Conclusion The findings of this study permit the conclusion that the Brazilian version of MINICHAL is an instrument able to discriminate differences in the health-related quality of life in relation to the symptoms of dyspnea, chest pain, palpitations, presyncope and headache, as well as to the presence of renal damage (target organ damage). However, the Brazilian version of MINICHAL was not able to discriminate health-related quality of life among hypertensive patients allocated at the extremes of the classification of risk for 2 2 ¶ cardiovascular events. Further studies with larger sample sizes are recommended to elucidate the ability of the Brazilian version of MINICHAL to discriminate health-related quality of life in hypertensive patients with different degrees of severity of the disease. Financial disclosure: This studied was financed by the National Council of Scientific and Technological Development (Conselho Nacional de Desenvolvimento Científico e Tecnológico – CNPq), by means of a research grant (PQ) 2010 – 2012, process 308824/2009-1. Arq Bras Cardiol. 2015; 104(4):299-307 304 Soutello et al. Performance of MINICHAL on Arterial Hypertension Original Article Table 4 – Scores of the Brazilian version of MINICHAL, according to the severity of dyspnea in outpatient hypertensive patients (n = 200), Campinas, 2009, 2010 Domains of the Brazilian version of MINICHAL Mental Status Somatic manifestations Total score n Mean (SD) p value* Mean (SD) p value Mean (SD) p value 145 5.8 (4.6) < 0.01† 2.8 (2.3) < 0.001¶ 8.7 (5.8) < 0.001§ Grade 1 – breathlessness on strenuous exercise 9 8.3 (10.0) 2.9 (2.5) 11.2 (12.3) Grade 2 – breathlessness hurrying on the level or up a light hill 18 7.9 (5.7) 4.5 (2.8) 12.4 (7.0) Grade 3 – Walks slower than people of the same age because of breathlessness or has to stop for breath even when walking at his/her own pace 6 10.0 (5.3) 6.7 (3.0) 16.7 (7.4) Grade 4 – Has to stop for breath after walkin less than 100 m or after a few minutes 12 9.9 (7.3) 5.7 (3.0) 15.6 (9.4) Grade 5 – Breathlessness prevents from leaving the house or when dressing 10 10.3 (5.7) 6.0 (2.7) 16.3 (15.2) Grade 0 – no dyspnea * ANOVA with rank transformation, followed by Tukey test: † degree 0 ≠ degree 5; ¶ degrees 3, 4, 5 ≠ 0; § degrees 4, 5 ≠ 0. Table 5 – Scores of the Brazilian version of MINICHAL, according to the risk for cardiovascular events of hypertensive patients followed up on an outpatient basis (n = 200), Campinas, 2009, 2010 Domains of the Brazilian version of MINICHAL Mental Status Somatic manifestations Total score n Mean (SD) p value* Mean (SD) p value Mean (SD) p value No additional risk 33 7.3 (6.8) NS 3.4 (2.5) NS 10.7 (8.5) NS Low risk 29 6.1 (5.0) Cardiovascular risk stratification † 2.9 (2.5) 9.0 (6.6) Moderate risk 37 7.1 (6.0) 3.3 (2.1) 10.4 (7.5) High risk 65 6.8 (5.1) 3.6 (2.8) 10.3 (6.6) Very high risk 36 6.1 (4.5) 3.9 (3.0) 10.0 (6.4) No/ low and/ or moderate risk 99 6.9 (6.0) High/ very high risk 101 6.5 (4.9) Cardiovascular risk stratification¶ NS 3.2 (2.4) NS 3.7 (2.9) 10.1 (7.6) NS 10.2 (6.5) * Kruskal-Wallis test; † European Society of Hypertension/European Society of Cardiology Guidelines7; ¶ Clustered cardiovascular risk stratification. SD: standard deviation; NS: not significant. Author contributions Conception and design of the research:Soutello AL, Rodrigues R, Gallani MCBJ. Acquisition of data: Soutello AL, Jannuzzi FF, Martini GG, Nadruz Jr. W. Analysis and interpretation of the data: Soutello AL, Rodrigues R, SãoJoão TM, Gallani MCBJ. Statistical analysis: Soutello AL, Rodrigues R, São-João TM. Obtaining financing:Soutello AL, Rodrigues R, São-João TM. Writing of the manuscript: Soutello AL, Rodrigues R, Nadruz Jr. W. Critical revision of the manuscript for intellectual content: Soutello AL, Rodrigues R, Jannuzzi FF, São-João TM, Martini GG, Nadruz Jr. W, Gallani MCBJ. 305 Arq Bras Cardiol. 2015; 104(4):299-307 Potential Conflict of Interest No potential conflict of interest relevant to this article was reported. Study Association This article is part of the dissertation of master submitted by Ana Lúcia Soares Soutello, from Universidade Estadual de Campinas. Sources of Funding This study was funded by CNPq (process: 308824/2009-1) e FAEPEX - Unicamp (165/09). Soutello et al. Performance of MINICHAL on Arterial Hypertension Original Article References 1. Chobanian AV, Bakris GL, Black HR, Cushman WC, Green LA, Izzo JL, et al; National Heart, Lung, and Blood Institute Joint National Committee on Prevention, Detection, Evaluation, and Treatment of High Blood Pressure; National High Blood Pressure Education Program Coordinating Committee. The seventh report of the Joint National Committee on Prevention, Detection, Evaluation, and Treatment of high blood pressure: the JNC 7 report. JAMA. 2003;289(19):2560-72. Erratum in: JAMA. 2003 Jul 9;290(2):197 2. Cohuet G, Struijker-Boudier H. Mechanisms of target organ damage caused by hypertension: therapeutic potential. Pharmacol Ther. 2006;111(1):81-98. 3. Mittal BV, Singh AK. Hypertension in the developing world: challenges and opportunities. Am J Kidney Dis. 2010;55(3):590-8. 4. Levy D, Garrison RJ, Savage DD, Kannel WB, Castelli WP. Prognostic implications of echocardiographically determined left ventricular mass in the Framingham Heart Study. N Engl J Med. 1990;322(12):1561-6. 5. Ghali JK, Liao Y, Simmons B, Castaner A, Cao G, Cooper RS. The prognostic role of left ventricular hypertrophy in patients with or without coronary artery disease. Ann Intern Med. 1992;117(10):831-6. 6. European Society of Hypertension, European Society of Cardiology Guidelines Committee. 2003 European Society of Hypertension – European Society of Cardiology guidelines for the management of arterial hypertension. J Hypertens. 2003;21(6):1011-53. Erratum in J Hypertens. 2003;21(11):2203-4, J Hypertens. 2004;22(2):435. 7. Mancia G, De Backer G, Dominiczak A, Cifkova R, Fagard R, Germano G, et al; Management of Arterial Hypertension of the European Society of Hypertension; European Society of Cardiology. 2007 Guidelines for the management of arterial hypertension: the Task Force for the management of arterial hypertension of the European Society of Hypertension (ESH) and of the European Society of Cardiology (ESC). J Hypertens. 2007;25(6):1105-87. Erratum in J Hypertens. 2007;25(8):1749. 8. The sixth report of the Joint National Committee on prevention, detection, evaluation and treatment of high blood pressure. Arch Intern Med. 1997;157(21):2413-46. Erratum in Arch Intern Med. 1998;158(6):573. 9. 1999 World Health Organization-International Society of Hypertension Guidelines for the Management of Hypertension. Guidelines Subcommittee. J Hypertens. 1999;17(2):151-83. 10. Sierra C, de la Sierra A. Early detection and management of the highrisk patient with elevated blood pressure. Vasc Health Risk Manag . 2008;4(2):289-96. 11. Lohr KN. Health outcomes methodology symposium: summary and recommendations. Med Care. 2000;38(9 Suppl):II194-208. 12. Lobiondo-Wood G, Haber J. Pesquisa em enfermagem: métodos, avaliação crítica e utilização. 3a ed. São Paulo: Guanabara Koogan; 2001. p. 189-99. 15. Roca-Cusachs A, Ametlla J, Calero S, Comas O, Fernández M, Lospaus R, et al. Calidad de vida en la hipertensión arterial. Med Clin (Barc). 1992;98(13):486-90. 16. Dalfó Baqué A, Badia Llach X, Roca-Cusachs Coll A, Aristegui Ruiz I, Roset Gamisans M. [Validation of the quality of life questionnaire in arterial hypertension (HQALY) for its use in Spain. Relationship between clinical variables and quality of life. Investigator group of the HQALY study]. Aten Primaria. 2000;26(2):96-103. 17. Dalfó Baqué A, Badia Llach X, Roca-Cusachs A. Cuestionario de calidad de vida en hipertensión arterial (CHAL). Aten Primaria. 2002;29(2):116-21. 18. Badia X, Roca-Cusachs A, Dalfó A, Gascón G, Abellán J, Lahos R, et al; MINICHAL Group. Validation of short form of the Spanish hypertension quality of life questionnaire (MINICHAL). Clin Ther. 2002;24(12):2137-54. 19. Schulz RB, Rossignoli P, Correr CJ, Férnadez-Llimós F, Toni PM. Validação do mini-questionário de qualidade de vida em hipertensão arterial (MINICHAL) para o português (Brasil). Arq Bras Cardiol. 2008;90(2):127-31. 20. Melchiors AC, Correr CJ, Pontarolo R, Santos FO, Paula e Souza RA. Qualidade de vida em pacientes hipertensos e validade concorrente do MINICHAL-Brasil. Arq Bras Cardiol. 2010;94(3):337-44, 357-64. 21. Soutello AL, Rodrigues RC, Jannuzzi FF, Spana TM, Gallani MC, Nadruz Junior W. Psychometric performance of the Brazilian version of the Minicuestionario de calidad de vida en la hipertensión arterial (MINICHAL). Rev Lat Am Enfermagem. 2011;19(4):855-64. 22. Marcus R, Krause L, Weder AB, Dominguez-Meja A, Schork NJ, Julius S. Sex-specific determinants of increased left ventricular mass in the Tecumseh Blood Pressure Study. Circulation. 1994;90(2):928-36. 23. Zanchetti A, Bond MG, Hennig M, Neiss A, Mancia G, Dal Palú C, et al. Risk factors associated with alterations in carotid intima–media thickness in hypertension: baseline data from the European Lacidipine study on Atherosclerosis. J Hypertens. 1998;16(7):949-61. 24. Keith NM, Wagener HP, Barker NW. Some different types of essential hypertension: their course and prognosis. Am J Med Sci. 1974;268(6):336-45. 25. Kovelis D, Segretti NO, Probst VS, Lareau SC, Brunetto AF, Pitta F. Validação do Modified Pulmonary Functional Status and Dyspnea Questionnaire e da escala do Medical Research Council para o uso em pacientes com doença pulmonar obstrutiva crônica no Brasil. J Bras Pneumol. 2008;34(12):1008-18. 26. Bestall JC, Paul EA, Garrod R, Garnham R, Jones PW, Wedzicha JA. Usefulness of de Medical Research Council (MRC) dyspnoea scale as a measure of disability in patients with chronic obstructive pulmonary disease. Thorax. 1999;54(7):581-6. 13. Gusmão JL, Pierin AM. Bulpitt and Fletcher’s specific questionnaire for quality of life assessment of hypertensive patients. Rev Esc Enferm USP. 2009;43(spe):1034-43. 27. Summary of 1993 World Health Organisation-International Society of Hypertension guidelines for the management of mild hypertension. Subcommittee of WHO/ISH Mild Hypertension Liaison committee. BMJ. 1993;307(6918):1541-6. Erratum in BMJ. 1994;308(6920):45. 14. Palhares LC, Gallani MC, Gemignani T, Matos-Souza JR, Ubaid-Girioli S, Moreno H Jr, et al. Quality of life, dyspnea and ventricular function in patients with hypertension. J Adv Nurs. 2010;66(10):2287-96. 28. Cavalcante MA, Bombig MT, Luna Filho B, Carvalho AC, Paola AA, Póvoa R. Qualidade de vida de pacientes hipertensos em tratamento ambulatorial. Arq Bras Cardiol. 2007;89(4):245-50. Arq Bras Cardiol. 2015; 104(4):299-307 306 Soutello et al. Performance of MINICHAL on Arterial Hypertension Original Article 307 Arq Bras Cardiol. 2015; 104(4):299-307 Back to the Cover Original Article Influence of Spironolactone on Matrix Metalloproteinase-2 in Acute Decompensated Heart Failure João Pedro Ferreira1, Mário Santos1, José Carlos Oliveira1, Irene Marques1, Paulo Bettencourt2, Henrique Carvalho1 Centro Hospitalar do Porto1; Centro Hospitalar São João2, Porto – Portugal Abstract Background: Matrix metalloproteinases (MMPs) are a family of enzymes important for the resorption of extracellular matrices, control of vascular remodeling and repair. Increased activity of MMP2 has been demonstrated in heart failure, and in acutely decompensated heart failure (ADHF) a decrease in circulating MMPs has been demonstrated along with successful treatment. Objective: Our aim was to test the influence of spironolactone in MMP2 levels. Methods: Secondary analysis of a prospective, interventional study including 100 patients with ADHF. Fifty patients were non-randomly assigned to spironolactone (100 mg/day) plus standard ADHF therapy (spironolactone group) or standard ADHF therapy alone (control group). Results: Spironolactone group patients were younger and had lower creatinine and urea levels (all p < 0.05). Baseline MMP2, NT-pro BNP and weight did not differ between spironolactone and control groups. A trend towards a more pronounced decrease in MMP2 from baseline to day 3 was observed in the spironolactone group (-21 [-50 to 19] vs 1.5 [-26 to 38] ng/mL, p = 0.06). NT-pro BNP and weight also had a greater decrease in the spironolactone group. The proportion of patients with a decrease in MMP2 levels from baseline to day 3 was also likely to be greater in the spironolactone group (50% vs 66.7%), but without statistical significance. Correlations between MMP2, NT-pro BNP and weight variation were not statistically significant. Conclusion: MMP2 levels are increased in ADHF. Patients treated with spironolactone may have a greater reduction in MMP2 levels. (Arq Bras Cardiol. 2015; 104(4):308-314) Keywords: Heart Failure; Spironolactona/therapeutic use; Matrix Metalloproteinase 2/ therapeutic use. Introduction Matrix metalloproteinases (MMPs) are a family of zincdependent interstitial enzymes important for the resorption of extracellular matrices (ECM) in both health and disease1. Extracellular matrices are a dynamic structure central to the control of vascular remodeling and repair1, mostly due to the ability of MMPs to reabsorb and digest excessive amounts of ECM responsible for structural disruption2,3. Elevated MMPs promote loss of cardiac contractility via cell proteolysis and alterations in the ECM, contributing to cardiac and extra-cardiac remodeling processes4. In fact, clinical and experimental heart failure (HF) models of dilated and ischemic cardiomyopathy have demonstrated an increased activity of matrix metalloproteinase-2 (MMP2)2,5-7. In patients with HF, increased levels of MMP2 were associated with all-cause mortality8. Concordantly, in the acutely decompensated heart Mailing Address: João Pedro Ferreira • Rua Dr. José Oliveira e Silva, nº 52, Salreu-Estarreja. Postal Code 3865-209, Porto – Portugal Email: [email protected] Manuscript received June 26, 2014; revised manuscript September 27, 2014; accepted September 30, 2014. DOI: 10.5935/abc.20140205 308 failure (ADHF) setting a decrease of circulating MMPs has been demonstrated along with successful ADHF treatment3,9. Previous studies have suggested a therapeutic benefit of spironolactone in ADHF setting10. But no studies had looked to the effect of spironolactone in the ECM remodeling. In the present study, we aimed to examine the influence of spironolactone on the ECM remodeling in ADHF patients. We hypothesized that MMP-2 plasma levels of ADHF patients will have a steeper decrease if spironolactone is added to standard treatment. Methods Study Design We analyzed data from a previous pilot, prospective, interventional, clinical trial that we performed between February 2012 and February 2013. During that period, we enrolled 100 consecutive patients who presented at a Portuguese tertiary hospital with ADHF. Patients were eligible for enrollment if they had decompensation of chronic HF with symptoms leading to hospitalization. ADHF was diagnosed based on a history of chronic HF and at least one acute symptom (dyspnea, orthopnea, or edema) and one sign (rales, peripheral edema, ascites, or pulmonary vascular congestion on chest radiography). Ferreira et al. Spironolactone and Matrix Metalloproteinases Original Article Patients were non-randomly assigned in a sequential 1:1 ratio to spironolactone plus standard ADHF therapy or standard ADHF therapy alone, 50 patients in each arm. Patients were alternately assigned to the spironolactone arm or the standard ADHF therapy arm in a sequential manner - the first patient to one arm and the next to the other arm. This sequence was repeated until we reached 100 patients, 50 in the spironolactone group and 50 in the control group. Patients were blinded to the allocation, but the clinicians were not. The recommended spironolactone dose was 100 mg/day. However, the attending physician could decrease that dose to 50 mg/day after 48h upon admission. Furosemide dose and route of administration were clinically adjusted according to the patients’ hydration status. Exclusion criteria were: chronic use of mineralocorticoid receptor antagonists; cardiac surgery within 60 days of enrollment; cardiac mechanical support; cardiac resynchronization-therapy within the last 60 days; comorbid conditions with an expected survival of less than 6 months; acute myocardial infarction at time of hospitalization; uncorrected hemodynamically significant primary cardiac valvular disease; patients requiring intravenous vasodilators or inotropic agents; supine systolic arterial blood pressure < 90 mmHg; plasma creatinine level > 1.5 mg/dL; serum potassium level > 5.0 mmol/L; hemoglobin level < 9 g/dL; and sepsis. Institutional review board or ethics committee approval was obtained. All patients provided written informed consent to participate in the study. Clinical assessment of participants Patients’ clinical status, including physical examination, was prospectively recorded by the same attending physician on day 1 and day 3. Medications and respective dosages were prospectively recorded by the investigators according to the attending physician prescriptions. Blood samples were collected in the first 24 hours after the patient’s admission (baseline) to the hospital, and day-3 samples were collected between 72 and 96 hours of hospitalization. Samples were analyzed at a central core laboratory, and included plasma creatinine and urea, electrolytes, NT-pro BNP and MMP2. Clinical assessment and routine analyses were performed daily during hospital stay. Estimated glomerular filtration rate (eGFR) was determined using the Chronic Kidney Disease Epidemiology Collaboration (CKD-EPI) equation11. All patients performed a transthoracic echocardiography within 72 hours from admission. Left ventricular ejection fraction (LVEF) was calculated according to biplane Simpson method. MMP2 was measured by using enzyme -linked immunosorbent assays (ELISA) - Quantikine Elisa Human MMP-2 Immunoassay (R&D Systems, Inc®). The normal range of MMP2 values published by the manufacturer, expressed as median [interquartile range25-75, IQR25-75], is 199 [161 – 301] ng/mL. The assay sensitivity is 0.047 ng/mL. Of the 100 studied patients we analyzed baseline (day 1) and day 3 blood samples from 87. Thirteen samples were not analyzed due to transport and/or sampling processing errors. Samples were collected in the morning with patients supine. Serum was separated and stored at -80 °C until sample analysis. Variable definitions We classified patients according to spironolactone use and their response to diuretic therapy. We studied the relationships between baseline characteristics, day 3 and changes (Δ, difference between day 3 and baseline values) in MMP2, NT-proBNP and weight regarding the spironolactone use and diuretic response. Statistical Analysis Normally distributed continuous variables are expressed as mean ± standard deviation (SD), and skewed distributions are presented as median [IQR25-75]. Categorical variables are expressed in proportions (%). Comparison between groups was performed using parametric (independent samples t-test), non-parametric (Mann-Whitney test), or Chi-square tests, as appropriate. Correlations of MMP2 were examined by single variable linear regression and presented as correlation coefficient and 95% confidence interval (95% CI). A p value < 0.05 was considered statistically significant. Statistical analysis was performed using SPSS software, version 19 (Chicago, IL, USA). Results Baseline Characteristics in Control and Spironolactone Groups Control group patients were older (78.8 ± 9.3 versus [vs.] 73.2 ± 11.7 years, p = 0.01), and had higher creatinine and urea levels (1.15 ± 0.27 vs. 1.03 ± 0.30 mg/dL, p = 0.026 and 59.32 ± 22.27 vs. 51.10 ± 18.63 mg/dL, p = 0.048). No differences between groups were found regarding the following variables: sex; diabetes mellitus; chronic obstructive pulmonary disease; dementia; sleep apnea; non-invasive ventilation; ischemic heart disease; atrial fibrillation; LVEF; weight; systolic blood pressure; potassium; sodium; hemoglobin; albumin; NT-pro BNP; MMP2; furosemide dose; hospital length of stay; and the proportion of patients on angiotensin converting enzyme inhibitors and beta-blockers (Table 1). Spironolactone Influence on MMP2, NT-pro BNP and Weight Dynamic Changes No differences between control and spironolactone groups were observed regarding baseline and day 3 MMP2 levels (Table 2). However, MMP2 decreased from baseline to day 3 in the spironolactone group, while, in control group, MMP2 levels increased, leading to a tendency towards a reduction in MMP2 levels in the spironolactone group (1.5 [-26 to 38] vs. -21 [-50 to 19] ng/mL, p = 0.06) (Table 2 and Figure 1). The proportion of patients showing a decrease in MMP2 levels from baseline to day 3 was also greater in the spironolactone group. That difference, however, did not reach statistical significance: 21 control patients (50%) vs. 30 spironolactone group patients (66.7%), p = 0.115. Arq Bras Cardiol. 2015; 104(4):308-314 309 Ferreira et al. Spironolactone and Matrix Metalloproteinases Original Article Table 1 - Baseline population characteristics, laboratory results, medications, and hospital length of stay in treatment and control groups Control Group (n = 50) Spironolactone Group (n = 50) p Value 78.8 ± 9.3 73.2 ± 11.7 0.010 Male Sex – % 34 44 0.31** Diabetes Mellitus - % 50 40 0.31** Chronic Obstructive Pulmonary Disease - % 10 26 0.32** Dementia - % 16 8 0.22** Sleep Apnea - % 10 26 0.32** Non-Invasive Ventilation - % 14 20 0.42** Ischemic Heart Disease -% 48 52 0.69** Atrial Fibrillation - % 68 50 0.07** Left Ventricular Ejection Fraction < 40% - % 56 68 0.22** Weight (Kg) 75.6 ± 16.3 76.1 ± 16.4 0.89 Systolic Blood Pressure (mmHg) 140.5 ± 23.9 139 ± 27.9 0.80 Plasma Creatinine (mg/dL) 1.15 ± 0.27 1.03 ± 0.30 0.03 eGFR (mL/min/1,73 m2) 54.5 ± 16.5 68.3 ± 23.6 0.001 Plasma Urea (mg/dL) 59.3 ± 22.3 51.1 ± 18.6 0.05 4.1 ± 0.4 4.0 ± 0.6 0.33 Serum Sodium (mmol/L) 140.5 ± 5.0 140.6 ± 3.7 0.96 Hemoglobin (g/dL) 12.2 ± 1.8 12.7 ± 2.3 0.22 Age (yrs) Serum Potassium (mmol/L) Albumin (mg/dL) NT-pro BNP (pg/mL) MMP2 (ng/mL) Intravenous Furosemide Dose (mg/d) 3.7 ± 0.4 3.6 ± 0.4 0.63 3102 [1797 – 8204] 2701 [1463 – 5004] 0.17* 260 [226 – 299] 268 [207 – 336] 0.52* 75.6 ± 20.7 76.0 ± 25.5 0.93 ACEi/ARB – % 38 50 0.20** Beta-Blocker - % 42 32 0.30** - 100 - - 94.5 ± 23.3 - 9.0 ± 3.7 8.7 ± 3.0 0.59 Spironolactone - % Spironolactone Dose (mg/d) Hospital Length of Stay (days) Continuous variables are presented as mean ± standard deviation [SD], p value or median [interquartile range, IQR], p value. Categorical variables are presented as absolute number (%), p value. *Non-parametric paired sample test; ** Chi-square test. eGFR: estimated glomerular filtration rate; NT-pro BNP: N-terminal pro brain natriuretic peptide; MMP2: matrix metalloproteinase -2; ACEi/ARB: angiotensinconverting enzyme inhibitors/angiotensin receptor blockers. No differences were observed in NT-pro BNP levels at baseline. However, on day 3, the spironolactone group patients showed lower levels of NT-pro BNP (248 [923 – 5502] vs. 1555 [722 – 2554] pg/mL, p = 0.05). No differences between groups were observed in the variation of NT-pro BNP levels probably due to the lower levels (although not significantly lower) of NT-pro BNP at baseline in the spironolactone group, leading to a smaller amplitude of variation in this group (Table 2). A greater weight decrease was also observed in the spironolactone-treated patients (-2.9 ± 2.4 vs. -4.8 ± 2.8 kg, p < 0.001) (Table 2). 310 Arq Bras Cardiol. 2015; 104(4):308-314 Δ MMP2, Δ NT-pro BNP and Δ Weight Correlations No significant correlations were observed between Δ in MMP2, NT-pro BNP and weight (Table 3). Discussion In the present study we observed increased baseline levels of MMP2 in patients with ADHF. The patients treated with spironolactone showed a tendency towards a greater reduction in MMP2 levels. These results are consistent with previous findings demonstrating the impact of mineralocorticoid receptor antagonists on the ECM remodeling and highlight the potential interest about Ferreira et al. Spironolactone and Matrix Metalloproteinases Original Article Table 2 - Comparison of MMP2, NT-pro BNP and weight at baseline, day 3, and change (Delta, Δ) between the study groups Control Group Spironolactone Group p Value MMP2 Baseline Day 3 Δ (day 3 – baseline) 260 [226 – 299] 266 [227 – 298] 1.5 [-26 to 38] 268 [207 – 336] 261 [212 – 307] -21 [-50 to 19] 0.52* 0.49* 0.06* NT-pro BNP Baseline Day 3 Δ (day 3 – baseline) 3102 [1792 – 8204] 2488 [923 – 5502] -945 [-2249 to -62] 2701 [1463 – 5004] 1555 [722 – 2554] -816 [-1833 to -106] 0.17* 0.05* 0.75* Weight Baseline Day 3 Δ (day 3 – baseline) 75.6 ± 16.3 72.8 ± 16.3 -2.9 ± 2.4 76.1 ± 16.4 71.3 ± 16.2 -4.8 ± 2.8 0.89 0.66 < 0.001 Continuous variables are presented as mean ± standard deviation [SD], p value or median [interquartile range, IQR], p value, and independent sample t-test or independent sample non-parametric test were used, respectively. *non-parametric test. NT-pro BNP: N-terminal pro brain natriuretic peptide; MMP2: matrix metalloproteinase -2; Δ: delta or difference between day 3 and baseline values. 200.00 MMP2 Change from Baseline to Day 3 83 19 17 100.00 .00 66 p = 0.06 -100.00 44 93 -200.00 No Spíronolactone Spironolactone Figure 1 - Comparison of Δ MMP2 Levels from baseline to day 3 between control and spironolactone groups. A trend towards a more pronounced reduction in MMP2 levels was observed in spironolactone group. Analysis was performed comparing the variation (Δ, day 3 - baseline) of MMP2 levels between control and spironolactone groups using non-parametric independent sample tests (1.5 [-26 to 38] versus -21 [-50 to 19], p = 0.06). Legend: MMP2 = matrix metalloproteinase-2. Table 3 - Correlation coefficients and 95% confidence intervals (CI) between delta (Δ) MMP2, Δ NT-pro BNP, and Δ weight Δ MMP2 Correlation Coefficient 95%CI p Value Δ NT-pro BNP 0.11 -0.003 to 0.01 0.33 Δ Weight 0.12 -1.97 to 7.05 0.27 MMP2: matrix metalloproteinase-2; NT-pro BNP: N-terminal pro-brain natriuretic peptide; Δ: delta or difference between day 3 and baseline values. Arq Bras Cardiol. 2015; 104(4):308-314 311 Ferreira et al. Spironolactone and Matrix Metalloproteinases Original Article spironolactone for the treatment of ADHF, where those mechanisms are strongly exacerbated. Increased serum levels of MMP2 have been demonstrated in the ADHF setting3,9. In our study, the median [IQR] MMP2 levels at admission were 260 [225 - 312] ng/mL. These values are above the normal range defined by the manufacturer, 199 [161 – 301] ng/mL, and are in accordance with previous reports on patients with HF decompensation. A previous study by Shirakabe A. et al3 has also shown increased serum MMP2 levels in ADHF, with a rapid decrease along with HF compensation. Furthermore, an interventional placebocontrolled trial performed by Tziakas DN. et al9 has shown a significant reduction in MMP2 levels in the group of patients treated with levosimendan. In animal models, exacerbated neurohormonal activation leads to an increase in the levels of several myocardial MMP subtypes12-14. MMPs are important for the proteolysis that can affect the composition of ECM and, consequently, myocardial remodeling. Additionally, increased ECM turnover may be associated with pathological myocardial remodeling, which may be accelerated in decompensated HF 3,15. Consequently, a reduction in markers of ECM turnover may serve as a surrogate marker for deceleration of myocardial turnover and remodeling. Our study showed a greater decrease of MMP2 in the group of patients submitted to spironolactone treatment. Mineralocorticoid receptor antagonists improve survival and reduce morbidity in patients with HF and reduced ejection fraction and mild-to-severe symptoms, and in patients with left ventricular systolic dysfunction and HF after acute myocardial infarction16-18. Additionally, used in natriuretic doses, mineralocorticoid receptor antagonists are likely to improve congestion in ADHF with good tolerability and few side effects19. Several proposed mechanisms explain how mineralocorticoid receptor antagonists improve HF outcomes, and these pathways include a reduction in myocardial remodeling20. Our study provides important information on a better understanding of ECM turnover processes. The steeper MMP2 reduction observed in patients submitted to spironolactone treatment provides a real demonstration of potential mitigation of harmful remodeling through spironolactone use. Interestingly, patients without MMP2 reduction or increase, after an acute HF episode, had poorer prognosis3. Therefore, changes in MMP2 levels are a potentially useful prognostic marker in patients admitted due to ADHF. NT-pro BNP is a well-validated, widely used, and very accurate biomarker for the diagnosis and risk stratification of HF21. Patients submitted to spironolactone treatment had lower levels of NT-pro BNP on day 3, and a more pronounced weight reduction when compared to controls, while patients with slower diuretic response had higher NT-pro BNP levels on day 3 of hospitalization, a tendency towards lower NT-pro BNP reduction, and less weight loss. However, the changes in MMP2 values did not correlate with the variation in NT-pro BNP or weight. The small sample size, the NT-pro BNP and MMP2 elevated variance, and the different mechanisms influencing those biomarkers may all explain the lack of correlation. 312 Arq Bras Cardiol. 2015; 104(4):308-314 Several limitations in our study should be noted. First, this was a single-centre, non-randomized trial with a small number of patients with mixed HF etiologies and treatments. Second, this post-hoc analysis has limitations inherent to observational studies. Third, the decision to withdraw diuretic therapy was based on subjective assessment of congestive signs and symptoms, so we cannot rule out the inter-observer variability. However, in real life, the decision to step down diuretic therapy is also based on subjective clinical evaluation. Fourth, our study excluded HF patients with significant renal impairment, since plasma creatinine level lower than 1.5 mg/dL was an inclusion criterion, leading to a potential selection of a subset of low-risk patients, which can affect the external validity of our results. Fifth, the spironolactone group patients were younger and had lower plasma creatinine and urea levels, which can positively affect the response to that drug. Finally, only MMP2 was evaluated, and other forms of MMPs may have different effects and responses in ADHF patients. Conclusion The present study showed that MMP2 levels can be increased in ADHF, and that patients treated with spironolactone may have a greater reduction in MMP2 levels. Whether these findings have prognostic significance requires further investigation. Acknowledgements The authors acknowledge the lab technicians, especially Mr. Fernando Santos, for technical assistance, and all physicians collaborating in the study. Author contributions Conception and design of the research, Acquisition of data, Statistical analysis and Writing of the manuscript: Ferreira JP; Analysis and interpretation of the data: Ferreira JP, Santos M, Oliveira JC, Bettencourt P; Obtaining financing: Carvalho H; Critical revision of the manuscript for intellectual content: Ferreira JP, Santos M, Marques I, Bettencourt P, Carvalho H. Potential Conflict of Interest No potential conflict of interest relevant to this article was reported. Sources of Funding This study was partially funded by Johnson & Johnson. Study Association This article is part of the thesis of Doctoral submitted by João Pedro Ferreira, from Centro Hospitalar do Porto. Ferreira et al. Spironolactone and Matrix Metalloproteinases Original Article References 1. Dollery CM, McEwan JR, Henney AM. Matrix metalloproteinases and cardiovascular disease. Circ Res. 1995;77(5):863-8. 2. Altieri P, Brunelli C, Garibaldi S, Nicolino A, Ubaldi S, Spallarossa P, et al.Metalloproteinases 2 and 9 are increased in plasma of patients with heart failure. Eur J Clin Invest. 2003;33(8):648-56. 3. Shirakabe A, Asai K, Hata N, Yokoyama S, Shinada T, Kobayashi N, et al.Clinical significance of matrix metalloproteinase (MMP)-2 in patients with acute heart failure. Int Heart J. 2010;51(6):404-10. 4. Rouet-Benzineb P, Buhler JM, Dreyfus P, Delcourt A, Dorent R, Perennec J, et al. Altered balance between matrix gelatinases (MMP-2 and MMP-9) and their tissue inhibitors in human dilated cardiomyopathy: potential role of MMP-9 in myosin-heavy chain degradation. Eur J Heart Fail. 1999;1(4):337-52. 5. Tyagi SC, Campbell SE, Reddy HK, Tjahja E, Voelker DJ. Matrix metalloproteinase activity expression in infarcted, noninfarcted and dilated cardiomyopathic human hearts. Mol Cell Biochem. 1996;155(1):13-21. 6. Thomas CV, Coker ML, Zellner JL, Handy JR, Crumbley AJ 3rd, Spinale FG. Increased matrix metalloproteinase activity and selective upregulation in LV myocardium from patients with end-stage dilated cardiomyopathy. Circulation. 1998;97(17):1708-15. 7. Spinale FG, Coker ML, Heung LJ, Bond BR, Gunasenghe HR, Etoh T, et al. A matrix metalloproteinase induction/activation system exists in the human left ventricular myocardium and is upregulated in heart failure. Circulation. 2000;102(16):1944-9. 8. George J, Patal S, Wexler D, Roth A, Sheps D, Keren G. Circulating matrix metalloproteinase-2 but not matrix metalloproteinase-3, matrix metalloproteinase-9, or tissue inhibitor of metalloproteinase-1 predicts outcome in patients with congestive heart failure. Am Heart J. 2005;150(3):484-7. 11. Levey AS, Stevens LA, Schmid CH, Zhang YL, Castro AF 3rd, Feldman HI, et al. A new equation to estimate glomerular filtration rate. Ann Intern Med.2009;150(9):604-12. 12. Brilla CG, Zhou G, Matsubara L, Weber KT. Collagen metabolism in cultured adult rat cardiac fibroblasts: response to angiotensin II and aldosterone. J Mol Cell Cardiol. 1994;26(7):809-20. 13. Coker ML, Jolly JR, Joffs C, Etoh T, Holder JR, Bond BR, et al. Matrix metalloproteinase expression and activity in isolated myocytes after neurohormonal stimulation. Am J Physiol Heart Circ Physiol. 2001;281(2):H543-51. 14. Peterson JT, Hallak H, Johnson L, Li H, O’Brien PM, Sliskovic DR, et al. Matrix metalloproteinase inhibition attenuates left ventricular remodeling and dysfunction in a rat model of progressive heart failure. Circulation. 2001;103(18):2303-9. 15. Biolo A, Fisch M, Balog J, Chao T, Schulze PC, Ooi H, et al. Episodes of acute heart failure syndrome are associated with increased levels of. Circ Heart Fail. 2010;3(1):44-50. 16. Pitt B, Zannad F, Remme WJ, Cody R, Castaigne A, Perez A, et al. The effect of spironolactone on morbidity and mortality in patients with severe heart failure. Randomized Aldactone Evaluation Study Investigators. N Engl J Med. 1999;341(10):709-17. 17. Pitt B, Remme W, Zannad F, Neaton J, Martinez F, Roniker B, et al. Eplerenone, a selective aldosterone blocker, in patients with left ventricular dysfunction after myocardial infarction. N Engl J Med. 2003;348(14):1309-21. 18. Zannad F, McMurray JJ, Krum H, van Velduisen DJ, Swedberg K Shi H, et al. Eplerenone in patients with systolic heart failure and mild symptoms. N Engl J Med. 2011;364(1):11-21. 19. Ferreira JP, Santos M, Almeida S, Marques I, Bettencourt P, Carvalho H. Mineralocorticoid receptor antagonism in acutely decompensated chronic heart failure. Eur J Intern Med. 2014;25(1):67-72. 9. Tziakas DN, Chalikias GK, Hatzinikolaou HI, Stakos DA, Papanas N, Tentes IK, et al.Levosimendan use reduces matrix metalloproteinase-2 in patients with decompensated heart failure. Cardiovasc Drugs Ther. 2005;19(6):399-402. 20. Zannad F, Gattis Stough W, Rossignol P, Bauersachs J, McMurray JJ, Swedberg K, et al. Mineralocorticoid receptor antagonists for heart failure with reduced ejection fraction: integrating evidence into clinical practice. Eur Heart J. 2012;33(22):2782-95. 10. Ferreira JP, Santos M, Almeida S, Marques I, Bettencourt P, Carvalho H. Tailoring diuretic therapy in acute heart failure: insight into early diuretic response predictors. Clin Res Cardiol. 2013;102(10):745-53. 21. Bettencourt P, Azevedo A, Pimenta J, Frioes F, Ferreira S, Ferreira A. N-terminalpro-brain natriuretic peptide predicts outcome after hospital discharge in heart failure patients. Circulation.2004;110(15):2168-74. Arq Bras Cardiol. 2015; 104(4):308-314 313 Ferreira et al. Spironolactone and Matrix Metalloproteinases Original Article 314 Arq Bras Cardiol. 2015; 104(4):308-314 Back to the Cover Original Article Comparison between MDCT and Grayscale IVUS in a Quantitative Analysis of Coronary Lumen in Segments with or without Atherosclerotic Plaques João L. A. A. Falcão1, Breno A. A. Falcão1, Swaminatha V. Gurudevan2, Carlos M. Campos1, Expedito R. Silva1, Roberto Kalil-Filho1, Carlos E. Rochitte1, Afonso A. Shiozaki1, Otavio R. Coelho-Filho1, Pedro A. Lemos1 Heart Institute (InCor), University of São Paulo Medical School (USP)1, São Paulo, SP - Brazil; Cedars-Sinai Heart Institute2, Los Angeles, California, USA –United States Abstract Background: The diagnostic accuracy of 64-slice MDCT in comparison with IVUS has been poorly described and is mainly restricted to reports analyzing segments with documented atherosclerotic plaques. Objectives: We compared 64-slice multidetector computed tomography (MDCT) with gray scale intravascular ultrasound (IVUS) for the evaluation of coronary lumen dimensions in the context of a comprehensive analysis, including segments with absent or mild disease. Methods: The 64-slice MDCT was performed within 72 h before the IVUS imaging, which was obtained for at least one coronary, regardless of the presence of luminal stenosis at angiography. A total of 21 patients were included, with 70 imaged vessels (total length 114.6 ± 38.3 mm per patient). A coronary plaque was diagnosed in segments with plaque burden > 40%. Results: At patient, vessel, and segment levels, average lumen area, minimal lumen area, and minimal lumen diameter were highly correlated between IVUS and 64-slice MDCT (p < 0.01). However, 64-slice MDCT tended to underestimate the lumen size with a relatively wide dispersion of the differences. The comparison between 64-slice MDCT and IVUS lumen measurements was not substantially affected by the presence or absence of an underlying plaque. In addition, 64-slice MDCT showed good global accuracy for the detection of IVUS parameters associated with flow-limiting lesions. Conclusions: In a comprehensive, multi-territory, and whole-artery analysis, the assessment of coronary lumen by 64-slice MDCT compared with coronary IVUS showed a good overall diagnostic ability, regardless of the presence or absence of underlying atherosclerotic plaques. (Arq Bras Cardiol. 2015; 104(4):315-323) Keywords: Coronary Artery Disease, Plaque, Atherosclerotic / diagnosis; Multidetector Computed Tomography / utilization; Ultrasonography / utilization. Condensed Abstract A total of 21 patients (70 vessels; total length 114.6 ± 38.3 mm per patient) underwent 64-slice MDCT and IVUS imaging. At patient, vessel, and segment levels, average lumen area, minimal lumen area, and minimal lumen diameter were highly correlated between IVUS and 64-slice MDCT. The comparison between 64-slice MDCT and IVUS lumen measurements was not substantially affected by the presence or absence of an underlying plaque (defined as Mailing Address: Ricardo João Westphal • Rua dos Escultores 200, City Boaçava. Postal Code 05469-010. São Paulo, SP - Brazil. E-mail: [email protected]; [email protected] Manuscript received June 03, 2014; revised manuscript July 13, 2014; accepted October 13, 2014. DOI: 10.5935/abc.20140211 315 IVUS plaque burden > 40%). In addition, 64-slice MDCT showed good global accuracy for the detection of IVUS parameters associated with flow‑limiting lesions. List of Abbreviations EEL External elastic lamina HU Hounsfield units IVUS Intravascular ultrasound MDCT Multidetector computed ROC Receiver operating characteristic CTA Computed tomography angiography Introduction Multidetector computed tomography (MDCT) is a reliable noninvasive method for the detection of coronary luminal stenosis. However, most validation studies have compared Lemos et al. MDCT versus IVUS for coronary lumen analysis Original Article MDCT with catheter-based angiography, a method that is known to have limitations1,2. Intravascular ultrasound (IVUS) is currently considered the gold standard for the in vivo assessment of coronary luminal dimensions. Compared with quantitative angiography, morphologic data from IVUS imaging have shown a better correlation with coronary flow measurements and noninvasive detection of ischemia3. Moreover, IVUS is a valuable prognostic parameter for patients deferred from coronary angioplasty4. A number of studies have previously compared MDCT with intravascular ultrasound, indicating a good conformity between these two methods5,6. Recent meta-analysis data showed that, compared with IVUS, coronary computed tomography angiography (CTA) appears to be highly accurate for the estimation of luminal area, percentage of area stenosis, plaque volume, and plaque area and for the detection of plaque7. However, most studies evaluated specific regions of interest within the coronary tree, restricting the analysis to segments with atherosclerotic plaques by IVUS5,6,7. It is important to note that, in clinical practice, MDCT images are commonly analyzed following an all-segment scheme without the aid of a coronary map to focus the assessment on specific regions of interest. It is important to evaluate the diagnostic performance of MDCT in a comprehensive manner, including both coronary segments with atherosclerosis as well as portions without significant disease. Therefore, the present study compared 64-slice MDCT with IVUS for the quantitative assessment of coronary luminal dimensions following an inclusive, whole-artery analytic strategy. Methods Overall Protocol Design and Study Population The study included patients with known coronary artery disease who were scheduled for elective coronary stent implantation. Intravascular ultrasound examination was performed at the time of the percutaneous procedure, before any therapeutic intervention. At least one major epicardial vessel without previous angioplasty or surgical treatment was examined with IVUS, but operators were strongly encouraged to acquire IVUS images from all three coronary territories. MDCT was performed 72 h prior to the IVUS procedure as part of the study protocol. The study protocol was approved by the local ethics committee, and written informed consent was obtained from each patient. Ivus Imaging and Analysis The IVUS examination was carried out after the administration of intracoronary nitrate, utilizing a 20 MHz electronic multi-array 2.9F catheter (Eagle Eye®, Volcano Corporation Inc., San Diego, CA, USA) connected to a dedicated console (InVision Gold®, Volcano Corporation Inc., San Diego, CA, USA). Acquisition was performed during motorized pullback at a constant speed of 0.5 mm/s (R-100® pullback device, Volcano Corporation Inc., San Diego, Ca, USA). Off-line IVUS analyses were performed by operators blinded to other patients’ characteristics, using a dedicated software (pcVH 2.2 ®; Volcano Corporation Inc., San Diego, CA, USA) for the measurement of vessels. The luminal and external elastic lamina (EEL) boundaries were traced semi‑automatically to obtain area measurements. Total plaque plus media area was calculated as EEL area minus lumen area. Plaque burden was calculated as the plaque plus media area divided by the EEL area, multiplied by 100. A coronary plaque was diagnosed to be present in all segments with plaque burden > 40%. A coronary segment was considered to be free of atherosclerosis or having only mild atherosclerotic plaque when the plaque burden was ≤ 40%. Multidetector Computer Tomography Patients with a heart rate greater than 65 bpm received up to 15 mg of intravenous metoprolol before the acquisition of MDCT images, unless contraindicated. Sublingual nitrate was given to all patients prior to the acquisition of MDCT images8. All scans were performed utilizing a 64-slice MDCT scanner (Aquillion 64TM, Toshiba Medical Systems, Japan). Acquisition protocols were applied as previously described9. Patients first underwent calcium scanning performed with prospective electrocardiogram gating and a detector collimation of 64 x 3.0 mm. The trigger delay for prospective gating was adjusted to the heart rate in order to obtain the images during the rest period of the coronary arteries. Only patients with a total calcium score < 600 were included. After calcium scanning, the CT coronary angiography protocol was performed using a 64 x 0.5 mm detector collimation and a minimum gantry rotation time of 400 ms, and the scanner settings including pitch were adjusted according to patient’s sex and weight9. After the intravenous injection of contrast medium (Iopamidol, 370 mg iodine/ml, Bracco) and after reaching a threshold of 180 Hounsfield units (HU), at the descending aorta, the helical scan for CT coronary angiography was performed. Quantitative coronary analysis was performed with a dedicated workstation (Vitrea2, v3.9 loaded with the Coronary Vessel Probe and SURE Plaque software; all by Vital Images Inc, Plymouth, MN, USA). All analyses were performed by operators blinded to clinical and IVUS characteristics, following a predefined analytic plan. First, the average lumen attenuation was measured in the ascending aorta (at the level of the coronary ostia) and used as the parameter to set the threshold for the detection of the coronary lumen borders. Then, the lumen and the vessel borders were semiautomatically reconstructed for the measurement of their areas (Figure 1); thus, permitting the calculation of the plaque plus media area (vessel area minus lumen area) and the percent of plaque burden (plaque plus media area divided by the vessel area, multiplied by 100). IVUS and MDCT Imaging Coregistration and Segment Analysis Intravascular ultrasound and 64-slice MDCT images were matched by using reproducible vessel landmarks (e.g., aorto-ostial junction, side branches, etc.) as anatomical axial references. Visible landmarks through the target vessel length were annotated for both IVUS and 64-slice MDCT, and all vessel portions were carefully scrutinized to match the exact counterpart (Figure 1). The left main coronary Arq Bras Cardiol. 2015; 104(4):315-323 316 Back to the Cover Lemos et al. MDCT versus IVUS for coronary lumen analysis Original Article was computed as a separate vessel for analysis. Repeated measurements by the same operators were performed for 27 segments, randomly selected, and correlation coefficients were used to determine intra-observer and inter-observer variability. Statistical Analysis The present study is an exploratory analysis without a prior formal sample size calculation. Nevertheless, the chosen sample size of 20 patients would be sufficient to demonstrate a significant correlation of any given continuous parameter with a Pearson coefficient of 0.65at an alfa of 0.05 and a power of 0.9. Statistical analyses were performed with software SPSS 21 (IBM Corp. Released 2012, IBM SPSS Statistics for Windows, Version 21.0. Armonk, NY, USA). Categorical variables are presented as percentages and continuous variables as means and standard deviations. Continuous variables were analyzed for correlation using the Pearson’s correlation test. The method proposed by Bland and Altman10,11 was utilized to evaluate the differences between the measurements of 64-slice MDCT and IVUS for mean lumen area, minimal lumen area, and minimal lumen diameter. In Bland and Altman’s method, the average of the two measurements (64-slice MDCT and IVUS) is plotted against the difference between them (64-slice MDCT minus IVUS) with 95% limits of agreement calculated to evaluate the measurement concordance. For all comparison tests, p < 0.05 was considered significant. Results The study population consisted of 21 patients with 70 imaged vessels (3.3 vessels per patient) and a final total length of 114.6 ± 38.3 mm per patient (ranging from 39.5 mm to 181.0 mm) (Table 1). All patients had coronary artery disease with percutaneous coronary intervention indication. Men were 71% of the study population, and mean Figure 1 – Schematic representation of quantitative coronary analysis by 64-slice MDCT (above) and IVUS (below). The upper images show the longitudinal reconstruction for both methods. The lower images show illustrative vessel cross-sections with the outer vessel and lumen (inner) boundaries tracings. 317 Arq Bras Cardiol. 2015; 104(4):315-323 Lemos et al. MDCT versus IVUS for coronary lumen analysis Original Article age was 56 years. There was a high prevalence of diabetes mellitus (48%) and hypertension (71%) (Table 1). All CT scans were considered of diagnostic quality and all vessel segments > 2 mm were considered for analysis (there were no unevaluable segments). A total of 72 plaques were identified by IVUS (plaque burden > 40%) with 95 remaining coronary segments without plaque or with mild atherosclerotic disease (plaque burden ≤ 40%). At patient and vessel levels, the measurements of average lumen area and minimal lumen area were highly correlated between IVUS and 64-slice MDCT (correlation coefficient: patient level 0.75 and 0.78, vessel level 0.91 and 0.93, p < 0.01 for all comparisons) (Table 2). At the patient level there was a moderate correlation between minimal lumen diameter measured by IVUS and by 64-slice MDCT (correlation coefficient: 0.64, p = 0.002) (Table 2). At the segment level, the correlation between 64-slice MDCT and IVUS was similar in segments with or without a plaque burden > 40% (Table 2). However, the average absolute difference in measurements tended to be larger among coronary segments without atherosclerotic plaque (Table 2 and Figure 3). Overall, 64-slice MDCT underestimated the lumen size with a relatively wide dispersion of the differences (Table 2 and Figure 2). The correlation coefficients for repeated IVUS and Table 1 – Patients characteristics (n = 21) Age, years 56.6 ± 9.5 Male 71.4 Weight, kg 69.2 ± 9.9 Height, cm 161.2 ± 7.3 Diabetes 47.6 Hypertension 71.4 Previous myocardial infarction 38.1 Multivessel disease 38.1 Stable coronary disease 52.3 Total length of analyzed vessels, mm 114.6 ± 38.3 Imaged vessel (n = 70) Left main 24.3 Left anterior descending 25.7 Diagonal 1.4 Left circumflex 22.9 Obtuse marginal 1.4 Right coronary 24.3 Numbers are mean ± standard deviation or percentage. Table 2 – Quantitative coronary lumen parameters by IVUS and by 64-slice MDCT at patient, vessel, and segment levels IVUS 64-slice MDCT Difference Correlation coefficient p-value for correlation Mean lumen area, mm2 8.6 ± 2.1 7.8 ± 2.3 -0.7 ± 1.6 0.75 < 0.001 Minimal lumen area, mm2 3.3 ± 1.3 1.8 ± 1.9 -1.5 ± 1.2 0.78 < 0.001 Minimal lumen diameter, mm 1.8 ± 0.3 1.0 ± 0.6 -0.8 ± 0.5 0.64 0.002 Mean lumen area, mm2 10.1 ± 5.3 9.1 ± 4.8 -1.0 ± 2.2 0.91 < 0.001 Minimal lumen area, mm2 6.9 ± 5.3 5.3 ± 4.9 -1.5 ± 1.9 0.93 < 0.001 Minimal lumen diameter, mm 2.5 ± 0.9 1.9 ± 1.0 -0.6 ± 0.5 0.87 < 0.001 Mean lumen area, mm2 10.2 ± 5.2 9.1 ± 4.5 -1.1 ± 2.3 0.89 < 0.001 Minimal lumen area, mm2 8.1 ± 4.6 6.8 ± 4.1 -1.4 ± 2.3 0.87 < 0.001 Minimal lumen diameter, mm 2.8 ± 0.8 2.4 ± 0.8 -0.5 ± 0.5 0.78 < 0.001 7.1 ± 2.9 7.0 ± 3.3 -0.1 ± 1.8 0.84 < 0.001 5.1 ± 2.8 4.3 ± 3.3 -0.9 ± 1.9 0.82 < 0.001 2.2 ± 0.5 1.7 ± 0.8 -0.5 ± 0.5 0.76 < 0.001 Per-patient analysis (n = 21) Per-vessel analysis (n = 70) Per-segment analysis (n = 167) Segments with IVUS-PB ≤ 40% (n = 95) Segments with IVUS-PB > 40% (n = 72) Mean lumen area, mm2 Minimal lumen area, mm 2 Minimal lumen diameter, mm Numbers are mean ± standard deviation. IVUS: intravascular ultrasound; MDCT: multidetector computed tomography; PB: plaque burden Arq Bras Cardiol. 2015; 104(4):315-323 318 Lemos et al. MDCT versus IVUS for coronary lumen analysis Original Article Per- Patient Per-Vessel 5 5 Difference in mean luminal area (mm2) 10 Difference in mean luminal area (mm2) 10 0 –5 –10 3 6 9 12 15 Average mean luminal area (mm2) 0 0 –5 –10 5 5 Difference in minimal luminal area (mm2) 10 Difference in minimal luminal area (mm2) 10 0 –5 –10 30 0 –5 2 3 4 5 6 7 8 Average minimal luminal area (mm2) 0 5 10 15 20 25 30 Average minimal luminal area (mm2) 0 1 2 3 4 5 6 Average minimal luminal diameter (mm) 4 Difference in minimal luminal diameter (mm) 4 Difference in minimal luminal diameter (mm) 5 10 15 20 25 Average mean luminal area (mm2) –10 1 2 0 –2 –4 0 0.5 1.0 1.5 2.0 2.5 3.0 Average minimal luminal diameter (mm) 2 0 –2 –4 Figure 2 –Bland-Altman graphs for 64-slice MDCT and IVUS measurements at patient and vessel levels. Mean lumen area (A), minimal lumen area (B), and minimal lumen diameter (C) in per-patient (left) and per-vessel analyses (right). The solid lines represent the mean difference in measurements, and the traced lines represent the upper and lower 95% confidence intervals for the difference in measurements. 64-slice MDCT lumen area tracings were 0.90 and 0.91, respectively Table 3 shows the diagnostic performance of 64-slice MDCT for detecting luminal areas < 4.0 mm² and lumen diameters < 1.8 mm by IVUS, cutoff values previously shown to be markers of flow-restrictive coronary lesions3. Interestingly, the accuracy to detect these IVUS luminal cutoffs was not notably affected by the presence or absence of atherosclerotic plaques (Table 3). 319 Arq Bras Cardiol. 2015; 104(4):315-323 Discussion Currently, the primary clinical role of 64-slice MDCT is the evaluation of coronary luminal obstructions. This study reports that the assessment of coronary lumen by 64-slice MDCT shows excellent correlation with IVUS, with a good overall diagnostic ability to quantify coronary luminal dimensions regardless of the presence or absence of underlying atherosclerotic plaques. Lemos et al. MDCT versus IVUS for coronary lumen analysis Original Article IVUS plaque burden<=40% IVUS plaque burden >40% 10 Difference in mean luminal area (mm2) Difference in mean luminal area (mm2) 10 5 0 –5 –10 5 10 15 20 25 Average mean luminal area (mm2) –5 30 10 10 5 5 Difference in minimal luminal area (mm2) Difference in minimal luminal area (mm2) 0 –10 0 0 –5 –10 0 5 10 15 Average mean luminal area (mm2) 20 0 5 10 Average minimal luminal area (mm2) 15 0 1 2 3 Average minimal luminal diameter (mm) 0 –5 –10 0 5 10 15 20 25 Average minimal luminal area (mm2) 30 4 4 2 2 Difference in minimal luminal diameter (mm) Difference in minimal luminal diameter (mm) 5 0 –2 –4 0 –2 –4 1 2 3 4 Average minimal luminal diameter (mm) 5 4 Figure 3 – Bland-Altman graphs for 64-slice MDCT and IVUS measurements at segment level. Mean lumen area (A), minimal lumen area (B), and minimal lumen diameter (C) for segments without significant plaques (IVUS plaque burden ≤ 40%; left) and for segments with atherosclerotic plaque (IVUS plaque burden > 40%; right). The solid lines represent the mean difference in measurements, and the traced lines represent the upper and lower 95% confidence intervals for the difference in measurements. A l t h o u g h s i g n i f i c a n t l y c o r r e l a t e d w i t h I V U S, the measurements by 64-slice MDCT slightly underestimate the lumen area and the minimal lumen diameter with a relatively wide margin of error. In a previous study, Cademartiri et al. showed that lumen attenuation measured by CTA significantly affected the measured plaque attenuation12. The higher the lumen attenuation, the higher the plaque attenuation is. In contrast, calcium attenuation and surrounding fat attenuation were not significantly affected. On the basis of this finding, a semiautomatic tool for tracing coronary lumen and plaque borders based on aortic lumen attenuation could underestimate the luminal area of segments with plaque and reduce the specificity of CTA to identify non-significantly diseased segments by IVUS. Nevertheless, 64-slice MDCT showed a good global predictive accuracy for the detection of an IVUS luminal area < 4.0 mm² and an IVUS minimal lumen diameter < 1.8 mm, parameters previously shown to be markers of Arq Bras Cardiol. 2015; 104(4):315-323 320 Lemos et al. MDCT versus IVUS for coronary lumen analysis Original Article Table 3 – 64-slice MDCT sensitivity, specificity, negative predictive value, positive predictive value, and global predictive accuracy* for the detection of luminal area < 4.0 mm2 and luminal diameter < 1.8 mm by IVUS† Luminal area < 4.0 mm2 Luminal diameter < 1.8 mm Prevalence 86% 67% Per-patient analysis (n = 21) Sensitivity 100% 100% Specificity 33% 29% Negative predictive value 100% 100% Positive predictive value 90% 73% Global predictive accuracy 0.82 0.74 Prevalence 44% 24% Sensitivity 90% 94% Specificity 69% 27% Negative predictive value 70% 97% Positive predictive value 70% 41% Global predictive accuracy 0.90 0.90 Per-vessel analysis (n = 70) Per-segment analysis (n = 167) Segments with IVUS-PB ≤ 40% (n = 95) Prevalence 14% 6% Sensitivity 93% 100% Specificity 83% 77% Negative predictive value 99% 100% Positive predictive value 48% 22% Global predictive accuracy 0.92 0.89 Prevalence 49% 21% Sensitivity 83% 93% Specificity 69% 49% Negative predictive value 81% 97% Positive predictive value 73% 33% Global predictive accuracy 0.87 0.89 Segments with IVUS-PB > 40% (n = 72) IVUS: intravascular ultrasound; MDCT: multidetector computed tomography; PB: percent plaque burden * Global predictive accuracy calculated as the area under the receiver operating characteristic curve (C-index) † IVUS parameters previously shown to be associated with flow-limiting lesions.(3) flow-limiting coronary lesions3. In particular, 64-slice MDCT showed excellent sensitivity and negative predictive value for the identification of patients or vessels with the above characteristics at the expense of poor specificity and positive predictive value. These findings reinforce the primary clinical role of 64-slice MDCT for screening and ruling out, rather than ruling in, coronary luminal obstruction. Our findings were obtained in the context of a blinded whole-artery 64-slice MDCT assessment, with no previous indication for focusing on a specific plaque-containing segment. It is important to highlight that this analytic approach 321 Arq Bras Cardiol. 2015; 104(4):315-323 emulates the way 64-slice MDCT is interpreted in clinical practice. The fact that the diagnostic performance of 64-slice MDCT for lumen assessment was not substantially different for segments with or without plaques when using IVUS is reassuring and strengthens the value of 64-slice MDCT as a clinical tool. It must be emphasized that the assessment of segments with minimal coronary disease is of clinical relevance, because of the potential impact on future disease progression and acute events and because of the importance of analyzing segments beyond the stenosis site when planning the therapeutic strategy. Lemos et al. MDCT versus IVUS for coronary lumen analysis Original Article Limitations Author contributions It must be emphasized that the present study is mainly a methodological analysis with limited immediate clinical application. The main limitation of our study is the relatively small sample size included in the analysis. The patient population analyzed had a relatively high risk profile, which may limit our ability to extrapolate the results of this study to other clinical scenarios. Exclusion of patients with coronary calcium score > 600 could have overestimated the correlation between IVUS and CTA for measurements of coronary lumen area. In a previous study, the presence of calcification was found to be independently correlated to coronary CTA inaccuracy in evaluating coronary lumen area13. Each patient contributed with multiple measurements; thus, affecting data independence. Nonetheless, such limitation is a drawback potentially found in every study aiming to evaluate the imaging of coronary atherosclerotic disease. Conception and design of the research: Falcão JLAA, Silva ER, Rochitte CE, Lemos PA. Acquisition of data: Falcão JLAA, Falcão BAA, Gurudevan SV, Campos CM, Silva ER, Shiozaki AA, Coelho-Filho OR, Lemos PA. Analysis and interpretation of the data: Falcão JLAA, Falcão BAA, Gurudevan SV, Campos CM, Rochitte CE, Shiozaki AA, Coelho-Filho OR, Lemos PA. Statistical analysis: Falcão JLAA, Rochitte CE, Lemos PA. Obtaining financing: Falcão JLAA, Rochitte CE, Lemos PA. Writing of the manuscript: Falcão JLAA, Kalil Filho R, Lemos PA. Critical revision of the manuscript for intellectual content: Falcão JLAA, Kalil Filho R, Rochitte CE, Lemos PA. Potential Conflict of Interest No potential conflict of interest relevant to this article was reported. Conclusion This study demonstrates that 64-slice MDCT has a good correlation with IVUS for the evaluation of the coronary artery lumen in segments with significant plaques as well as in segments without plaques. Our data suggest that 64-slice MDCT can be used by the clinician to comprehensively define coronary artery anatomy in patients with coronary artery disease, thereby improving clinical risk stratification and facilitating effective clinical care. Sources of Funding This study was funded by Fundação de Amparo à Pesquisa do Estado de São Paulo (FAPESP) and Technological Development (CNPq). Study Association This article is part of the doctoral thesis of João Luiz de Alencar Araripe Falcão by Universidade de São Paulo. References 1. Meijer AB, O YL, Geleijns J, Kroft LJ. Meta-analysis of 40- and 64-MDCT angiography for assessing coronary artery stenosis. AJR Am J Roentgenol. 2008;191(6):1667-75. 2. Miller JM, Rochitte CE, Dewey M, Arbab-Zadeh A, Niinuma H, Gottlieb I, et al. Diagnostic performance of coronary angiography by 64-row CT. N Engl J Med. 2008;359(22):2324-36. 3. Briguori C, Anzuini A, Airoldi F, Gimelli G, Nishida T, Adamian M, et al. Intravascular ultrasound criteria for the assessment of the functional significance of intermediate coronary artery stenoses and comparison with fractional flow reserve. Am J Cardiol. 2001;87(2):136-41. 4. Abizaid AS, Mintz GS, Mehran R, Abizaid A, Lansky AJ, Pichard AD, et al. Long-term follow-up after percutaneous transluminal coronary angioplasty was not performed based on intravascular ultrasound findings: importance of lumen dimensions. Circulation. 1999;100(3):256-61. 5. Springer I, Dewey M. Comparison of multislice computed tomography with intravascular ultrasound for detection and characterization of coronary artery plaques: a systematic review. Eur J Radiol. 2009;71(2):275-82. 6. Joshi SB, Okabe T, Roswell RO, Weissman G, Lopez CF, Lindsay J, et al. Accuracy of computed tomographic angiography for stenosis quantification using quantitative coronary angiography or intravascular ultrasound as the gold standard. Am J Cardiol. 2009;104(8):1047-51. 7. Fischer C, Hulten E, Belur P, Smith R, Voros S, Villines TC. Coronary CT angiography versus intravascular ultrasound for estimation of coronary stenosis and atherosclerotic plaque burden: a meta-analysis. J Cardiovasc Comput Tomogr. 2013;7(4):256-66. 8. Decramer I, Vanhoenacker PK, Sarno G, Van Hoe L, Bladt O, Wijns W, et al. Effects of sublingual nitroglycerin on coronary lumen diameter and number of visualized septal branches on 64-MDCT angiography. AJR Am J Roentgenol. 2008;190(1):219-25. 9. Miller JM, Dewey M, Vavere AL, Rochitte CE, Niinuma H, Arbab-Zadeh A, et al. Coronary CT angiography using 64 detector rows: methods and design of the multi-centre trial CORE-64. Eur Radiol. 2009;19(4):816-28. 10. Bland JM, Altman DG. Statistical methods for assessing agreement between two methods of clinical measurement. Lancet. 1986;1(8476):307-10. 11. Bland JM, Altman DG. Comparing methods of measurement: why plotting difference against standard method is misleading . Lancet. 1995;346(8982):1085-7. 12. Cademartiri F, Mollet NR, Runza G, Bruining N, Hamers R, Somers P, et al. Influence of intracoronary attenuation on coronary plaque measurements using multislice computed tomography: observations in an ex vivo model of coronary computed tomography angiography. Eur Radiol. 2005;15(7):1426-31. 13. Kruk M, Noll D, Achenbach S, Mintz GS, Pregowsky J, Kaczmarska E, et al. Impact of coronary artery calcium characteristics on accuracy of CT angiography. JACC Cardiovasc Imaging. 2014;7(1):49-58. Arq Bras Cardiol. 2015; 104(4):315-323 322 Lemos et al. MDCT versus IVUS for coronary lumen analysis Original Article 323 Arq Bras Cardiol. 2015; 104(4):315-323 Back to the Cover Review Article Treatment of Dyslipidemia with Statins and Physical Exercises: Recent Findings of Skeletal Muscle Responses Mariana Rotta Bonfim1, Acary Souza Bulle Oliveira2, Sandra Lia do Amaral3, Henrique Luiz Monteiro3 Programa de Pós-Graduação em Ciências da Motricidade, Instituto de Biociências, Universidade Estadual Paulista “Júlio de Mesquita Filho” (UNESP)1, Rio Claro, SP; Setor de Doenças Neuromusculares, Escola Paulista de Medicina, Universidade Federal de São Paulo (UNIFESP)2, São Paulo, SP; Departamento de Educação Física, Faculdade de Ciências, UNESP3, Bauru, SP – Brazil Abstract Statin treatment in association with physical exercise practice can substantially reduce cardiovascular mortality risk of dyslipidemic individuals, but this practice is associated with myopathic event exacerbation. This study aimed to present the most recent results of specific literature about the effects of statins and its association with physical exercise on skeletal musculature. Thus, a literature review was performed using PubMed and SciELO databases, through the combination of the keywords “statin” AND “exercise” AND “muscle”, restricting the selection to original studies published between January 1990 and November 2013. Sixteen studies evaluating the effects of statins in association with acute or chronic exercises on skeletal muscle were analyzed. Study results indicate that athletes using statins can experience deleterious effects on skeletal muscle, as the exacerbation of skeletal muscle injuries are more frequent with intense training or acute eccentric and strenuous exercises. Moderate physical training , in turn, when associated to statins does not increase creatine kinase levels or pain reports, but improves muscle and metabolic functions as a consequence of training. Therefore, it is suggested that dyslipidemic patients undergoing statin treatment should be exposed to moderate aerobic training in combination to resistance exercises three times a week, and the provision of physical training prior to drug administration is desirable, whenever possible. Introduction High serum lipoprotein levels are recognized as one of the most significant risk factors for cardiovascular diseases. Alone, lipid abnormalities are accountable for 56% of heart disease and 18% of cases of infarction, being also associated to one third of deaths worldwide 1. Due to the magnitude of its effects, great efforts have been made by the medical community to prevent Keywords Hydroxymethylglutaryl-CoA reductase inhibitors; Exercise; Muscle, skeletal; Dyslipidemia. Mailling Address: Mariana Rotta Bonfim • Avenida Engenheiro Luiz Edmundo Carrijo Coube, 14-01, Vargem Limpa. Postal Code 17033-360, Bauru, SP – Brazil. E-mail: [email protected] Manuscript received April 30, 2014; revised manuscript October 10, 2014; accepted October 13, 2014. DOI: 10.5935/abc.20150005 324 and control this metabolic condition, with the therapeutic strategies recommended by the Brazilian Society of Cardiology (SBC) and adopted by area specialists being such as encouraging the adoption of healthy eating, increased physical exercise and drug prescription2,3. Specifically on the drug therapy, inhibitors of 3-hydroxy-3methylglutaryl coenzyme A reductase, (HMG-CoA reductase), also known as statins, are most effective class of drugs for the treatment of lipid disorders2-4. Recent evidence indicates that the combination of medical treatment and physical exercise can substantially reduce the risk of cardiovascular mortality in dyslipidemic patients when compared to both treatments separately, suggesting that treatment with statins associated with moderate to high physical fitness level provides additional protection against premature cardiovascular death5. However, the use of statins is associated with the occurrence of undesirable muscle effects such as muscular pain, cramps, and/or stiffness6-8, as well as reduced muscle strength in elderly individuals9. The practice of physical exercises, in turn, is related to the exacerbation of these discomforts, being directly associated with the intensity of the physical effort performed7,8. Evidently, this situation presents as a paradox, as it is not desirable that lack of physical activity be a prerequisite for treatment with statins without complications. It is thus necessary to further assess the evidence of this association, as well as clarify the mechanisms by which these effects are mediated. Considering these facts, the aim of this study was to review recent data from specific technical literature on the effects of statins and physical exercise combination on skeletal muscle. Methods The survey was carried out in the databases PubMed and Scientific Electronic Library Online (SciELO), using the combination of the terms "statin / statins" AND "exercise" AND "muscle" (as well as the equivalent terms in Portuguese), Only original articles in English or Portuguese, published between January 1990 and November 2013 that aimed to evaluate the effect of the association of statins with acute or chronic exercise on skeletal muscle were selected for this update. Review studies, editorials, letters and consensuses were not included. A total of 109 articles were found in the PubMed search, of which 15 were original articles that comprised the established criteria; the search in SciELO, in turn, resulted in a single original article, totaling 16 articles analyzed. Bonfim et al. Muscle Responses to Statins and Exercises Review Article Data on the sample (sample size, gender, age and study groups), on the specific characteristics of the drug therapy (statin type and dose), the physical exercise protocol (type and intensity of exercise, and time of intervention) were extracted from the articles, as well as the results and the conclusions of the studies. Results and Discussion The results of the present study are described in the text and systematized in Chart 1. As the understanding of the effect of statins on skeletal muscle is critical to understand the effects of its association with exercise, it was considered important to contextualize the reader about such aspects and, therefore, the results are shown as two topics. Statins and skeletal muscle Statins work by inhibiting the activity of HMG-CoA reductase enzyme, preventing the formation of mevalonate (Figure 1), which leads to a reduction in the liver synthesis of cholesterol and, consequently, increased synthesis of low-density lipoprotein (LDL) receptors in hepatocytes, thereby increasing its uptake from circulation to restore intracellular cholesterol10. Although well tolerated by most patients, statins are associated with the occurrence of muscle toxicity11,12, which may be mild or severe, ranging from myalgia to rhabdomyolysis, and affecting 5 to 10% of patients6-8,12. According to Parker and Thompson13, identifying the actual incidence of muscle alterations caused by the use of statins may be considered practically impossible, as these problems are usually not evaluated in clinical trials funded by pharmaceutical industries. They point out, however, that clinical reports have confirmed the suspicion that muscle injuries produced by statins are much more frequent. In fact, retrospective studies in medical records have indicated that musculoskeletal injuries and pain are more common among statin users when compared to non-users14, with a high number of reports associated with statins as primary suspects15. A randomized clinical trial on the use of atorvastatin (80 mg/day) or placebo for 6 months using a double-blind16 design found a higher incidence of myalgia among treated individuals and only the symptomatic ones had decreased muscle strength/resistance values17, with no association being observed between creatine kinase (CK) increases and muscle function, indicating that the levels of this injury marker are not predictive of muscle symptoms associated with statins18. This evidence indicates that statins can cause muscle damage to its users; however, the discrepancy on how to identify such alterations limits the identification of their incidence7,12. The most prevalent theories about the mechanisms of muscle damage by statins are related to the inhibition of mevalonate formation by the drug, which, in turn, limits the formation of several intermediates in cholesterol biosynthesis (Figure 1), such as ubiquinone (coenzyme Q10), one of the intermediates in the mitochondrial electron transport chain19-21. Although there is evidence regarding mitochondrial dysfunction due to coenzyme Q10 deficiency (CoQ10) 22, this mechanism of muscle injury by statins is quite controversial in the literature, as ubiquinone supplementation has not shown to improve muscle function23, suggesting possible direct effects of the drug on muscle. A study of the extensor digitorum longus (EDL) muscle of rats (n = 32) indicated that drug treatment with lipid‑lowering drugs alters the expression of proteins involved in cellular defense against oxidative stress, also being observed a significant reduction in the expression of oxidative and glycolytic enzymes, and showing a therapy trend of modifying proteins associated with energy supply systems24. Similarly, Bouitbir et al.25,26 found that low doses of atorvastatin may increase the production and concentration of Reactive Oxygen Species (ROS) and reduce the maximum mitochondrial respiration, muscle glycogen content and mitochondrial DNA content in skeletal muscle of mice, indicating that the statins may induce oxidative stress in skeletal muscle and, consequently, cause mitochondrial dysfunction due to reduction of its biogenesis. Similar results have been found in research with humans. In the study by Stringer et al.27, it was found that the skeletal muscles of symptomatic patients had lower content of mitochondrial DNA than that of asymptomatic ones, suggesting that statins can induce mitochondrial DNA depletion. Moreover, Larsen et al. 28 found that individuals treated with simvastatin had reduced CoQ10 content, antioxidant proteins, compounds of complex IV of the mitochondrial electron transport chain and type 1 fibers, when compared to their peers without medication, suggesting that exposure to statins may limit the maximum capacity of mitochondrial phosphorylation of skeletal muscle. However, the mitochondrial alterations seem to represent the early stage of the cascade of deleterious mechanisms induced by statins. According to Sirvent et al. 19,29,30, alterations in the mitochondrial respiratory chain result in depolarization of the mitochondrial inner membrane, causing calcium extrusion, which in turn would increase its sarcoplasmic concentrations and overload the sarcoplasmic reticulum, resulting in the so‑called "calcium waves" and the consequent statin‑induced myotoxicity. Although isolated effects of statins on calcium homeostasis have been reported in rat muscles31 and in both symptomatic32 and asymptomatic33 individuals, apparently its dysregulation is, in fact, a consequence of mitochondrial lesions. In fact, in a recent study, Sirvent et al.34 observed that the skeletal musculature of patients treated with statins, symptomatic or not, showed alterations in complex I of the electron transport chain, which modified mitochondrial function and deregulated calcium homeostasis, confirming their previous results observed in in vitro experiments. Similar results were found in a double-blind randomized clinical trial developed by Galtier et al.35, who found that atorvastatin-induced muscle toxicity was associated with a physiopathological mechanism, of which changes in mitochondrial respiration caused by the drug resulted in irregular calcium homeostasis . Analyzed together, this evidence explains, in large part, statininduced myotoxicity: mitochondrial and calcium homeostasis Arq Bras Cardiol. 2015; 104(4):324-332 325 Bonfim et al. Muscle Responses to Statins and Exercises Review Article Chart 1 – Description of the studies investigating the effect of statins and physical exercise on skeletal muscle Reference Sample Drug therapy Physical exercise protocol Results n = 80 individuals (59♂ and 21♀) Different statin types and doses (n = 37) Running a marathon Increase in CK after 24 horas in the statin group n = 59 men (18-65 years) Double-blind randomized trial Lovastatin (40 mg/day; n = 22) or placebo (n = 27) for 5 weeks Treadmill (45’; 15% incline; 65% HRmax) Elbow flexion (4x10 repetitions; 50% MF) Increase in CK 24 and 48 hours after the walk in the lovastatin group Reust et al.39 n = 10 men (27-28 years) Double-blind crossover randomized trial Lovastatin (40 mg/day; n = 5) or placebo (n = 5) for 30 days Treadmill (60’; 14% incline; 3 km/h) Maintenance of CK after lovastatin compared with placebo Kearns et al.40 n = 79 men Randomized trial Atorvastatin (10 mg/day, n = 42; or 80 mg/day, n = 37) for 5 weeks Treadmill (3x15’; 15% incline; 65% HRmax) ↑ total CK, CK-MB and muscular pain after exercise Panayiotou et al.41 n = 28 sedentary men (> 65 years) Atorvastatin (10-80 mg/day; n = 14) for ≥ 1 year Knee extension (5x8 maximum EC; 2 sessions) Similar muscular function between groups Urso et al.42 n = 8 sedentary men (18-30 years) Randomized double-blind trial Atorvastatin (80 mg/day; n = 4) or placebo (n = 4) for 4 weeks Knee extension (300 EC) before and after treatment Different expression of genes from the PSU pathway of catabolism and of apoptosis n = 80 male rats (hyperlipidic diet, n = 60; standard diet, n = 20) in 8 groups Simvastatin (20 mg, n = 20), Fluvastatin (10 mg, n = 20) or placebo (n = 20) Treadmill (60’; 9.75 m/min) 5x/week for 8 weeks Higher frequency of morphological alterations after statin, with or without exercise Seachrist et al.44 n = 48 female rats divided into 8 groups Cerivastatin (0.1; 0.5; 1.0 mg/kg/day) or placebo for 14 days Treadmill (25’; 20 m/minute; 15º of incline angle) 5x/week for 2 weeks Exacerbation of muscular degeneration; mitochondrial involvement Meex et al.45 n = 38 sedentary elderly men Different types and doses of statins (n = 14) Cycloergometer (30’; 55% ML) 2x/week and 8 resistance exercises (3x8 repetitions; 55 and 75%) 1x/week, 12 weeks Increase in ML, muscular strength, muscular density and mitochondrial function in both groups Mikus et al.46 n = 37 sedentary individuals with risk factor for MS (13♂ and 24♀; 25-59 years) Simvastatin (40 mg/day) (n = 19) Treadmill (45’; 60-75% rHR) 5x/ week for 12 weeks Increase in LM and decrease in muscular citrate synthase activity Coen et al.47 n = 31 sedentary individuals (15♂ and 16♀; 40-65 years) Randomized trial Rosuvastatin (10 mg/day) for 20 weeks Treadmill (20’; 60-70% rHR) and 8 resistance exercises (70-80% 1MR), 3x/weeks for 10 weeks Increase in CK 48 hours after the 1st session; absence of reports of pain/ fatigue Use of statins in athletes Parker et al.37 Statins and acute physical exercises Thompson et al.38 Statins and chronic physical exercises Accioly et al.43 Mechanisms of muscular responses to statins and to physical exercises Bouitbir et al.26 n = 34 male rats divided into 4 groups Atorvastatin (10 mg/kg/day; n = 18) or placebo for 2 weeks Treadmill (40’; 40 cm/s with increase of 5 cm/s up to exhaustion; 1 session) Increase in ROS and decrease in mitochondrial respiration Wu et al.48 n = 10 subjects (5♂ and 5♀; 35‑69 years) Different types and doses of statins for 4 weeks Plantar flexion (40% ML) for 7’ or up to exhaustion Increase in time of metabolic recovery and CK maintenance n = 14 users of statins (n = 9 symptomatic; n = 6 asymptomatic) Simvastatin or Atorvastatin (10-80 mg) up to myalgia onset (2 weeks to 4 months) Sitting down and getting up from a chair 300 times or up to exhaustion Decrease in the expression of oxidative phosphorylation genes and of mitochondrial proteins in symptomatic individuals Meador and Huey50 n = 59 mice divided in 6 groups Cerivastatin (1 mg/kg/day) or saline solution (days 15-28) Running wheels (adapted: days 1-28; non-adapted: days 15-28) Adaptation to exercise prevented loss of strength and increased fatigue associated with statin Bouitbir et al. n = 20 male rats (trained, n = 10; sedentary, n = 10) Atorvastatin application (4, 10, 40, 100, 200 and 400 µM) to the plantaris muscle Treadmill (30’; 40 cm/s; 15% incline) for 10 days Increased mitochondrial tolerance to the drug and decrease in production of free radicals Hubal et al.49 25 CK: creatine kinase; HRmax: Maximum heart rate; MF: maximum force; CK-MB: cardiac creatine kinase; EC: eccentric contractions; UPS ubiquitin proteasome; ML: maximum load; MS: metabolic syndrome; rHR: resting heart rate; LM: lean mass; MR: maximal repetition; ROS: Reactive Oxygen Species. 326 Arq Bras Cardiol. 2015; 104(4):324-332 Bonfim et al. Muscle Responses to Statins and Exercises Review Article Statins HMG-CoA Reductase Acetyl-CoA HMG-CoA Mevalonate Geranyl-PP Cholesterol Farnesyl-PP Geranyl-Geranyl-PP Prenylated proteins Dolichols Ubiquinone Figure 1 – Cholesterol biosynthesis stages and statin action. The enzyme 3-hydroxy-3-methylglutaryl coenzyme A (HMG-CoA) reductase catalyzes the conversion of HMG-CoA into mevalonate; the action of inhibiting this enzyme by statins results in the reduction of cholesterol synthesis, as well as other intermediates (prenylated proteins, dolichols and ubiquinone), which can contribute to muscle injury resulting from statin use. CoA: Coenzyme A; PP: pyrophosphate. alterations are related to modifications in the production of proteins activated by calcium, such as calpains and caspases, which in turn, are directly related to the apoptotic processes, protein degradation and muscle remodeling; in addition, this condition can modify the excitation-contraction coupling of muscular fibers, causing episodes of muscle weakness, pain and cramps19,33. Effect of statins and exercise on skeletal muscle The negative effects of statins on skeletal muscle, as well as the reported reduction in exercise capacity caused by the drug, culminate in the increasing dissemination of the theory of lesion exacerbation caused by the association of statins and exercise, which can be characterized as a limiting factor for the recommendation of physical activity in dyslipidemic patients. In an attempt to clarify these associations, the literature search information is shown as subtopics, which include the effects of statins in athletes and response to acute and chronic exercises, as well as the mechanisms responsible for muscle responses to this interaction. Use of statins in athletes Regarding physical exercises, it is important to understand what the effects of statins are on athletes’ musculature. In this regard, Sinzinger and O'Grade36 evaluated 22 professional athletes of different modalities, all diagnosed with familial hypercholesterolemia, which were followed for 8 years and who received different classes of statins. Of the assessed athletes, 78% did not tolerate any of the administered compounds; the experienced symptoms were similar between athletes and types of statins administered to them and consisted of muscle pain, cramps and weakness. After drug use cessation, symptoms disappeared in all athletes after approximately 3 weeks. In a more recent study, Parker et al.37 evaluated 37 athletes that used statins for over 6 months and 43 control subjects, before and after a marathon race. The results showed that marathon runners that used statins had more significant increases in CK levels 24 hours after the marathon completion when compared to non-users. It is concluded that athletes may experience deleterious effects on skeletal muscle when using statins, as these may exacerbate muscle injury associated with intense and strenuous exercise, both performed acutely or as part of training (Chart 1). Statins and acute physical exercises The pioneering studies that aimed to identify the exacerbation of muscle injury by exercise were double-blind clinical trials randomized for the use of lovastatin (40 mg/day) or placebo, carried out in adult men (n = 59, 18-65 years)38 or young individuals (n = 10, 27-28 years)39, which found that acute provision of eccentric and strenuous effort by walking downhill after a 4-week treatment with lovastatin (40 mg/day), could increase38 or not39 serum CK levels. A more recent study reproduced the abovementioned research protocol, in which adult males (n = 79, age > 40 years) were randomly exposed to doses of 10 or 80 mg of atorvastatin for 4 weeks, and then submitted to an acute eccentric and strenuous exercise session by walking downhill. It was observed that exposure to physical effort after the drug use increased CK levels and reports of pain in both groups, with no significant differences being identified between treatments with low or high dose40. Together, the results a possible exacerbating effect of muscle injury in response to these associations. In contrast, a cross-sectional study that investigated the effects of acute sessions of isokinetic eccentric exercises of the knee Arq Bras Cardiol. 2015; 104(4):324-332 327 Bonfim et al. Muscle Responses to Statins and Exercises Review Article extensors (five series of eight maximal voluntary repetitions) on muscle function of elderly men (n = 28, age > 65 years) treated with atorvastatin (10-80 mg / day) for more than one year, found no differences in muscle function, in both moments, pre and post-exercise, when compared to control patients. These results indicated that the proposed eccentric exercise did not have a negative impact on torque, range of motion and pain sensation during squatting exercises and walking in statin users41. Similarly, the double-blind trial randomized for the use of atorvastatin (80 mg/day) or placebo for 4 weeks in healthy men (n = 8, age 18 to 30), in which Bear et al.42 provided acute strenuous exercise, characterized by 300 eccentric contractions of the lower limbs before and after drug treatment, showed no significant increases in CK levels with the combination of the drug and the physical effort. However, it was observed that this interaction increased the expression of genes involved in protein catabolism and the ubiquitin proteasome (UPS) pathway, changing the balance between protein breakdown and muscle repair, indicating that the absence of changes in CK may not reflect muscle tissue responses. In general, the studies seem to indicate that men using different statin classes, at low or high doses, show changes in muscle function and injury markers when exposed to acute sessions of eccentric and strenuous exercises walking downhill, but not with lower-limb eccentric exercises alone. However, they warn that this reality does not rule out the occurrence of possible structural and metabolic changes in muscle tissue. It is also noteworthy that the heterogeneity of methodological protocols, as well as the absence of women in the studies significantly limits these conclusions, indicating the need for further studies to satisfactorily establish this association. When comparing previously sedentary adults with risk factors for metabolic syndrome (n = 37, aged 25-59 years), exposed to 12 weeks of moderate exercise on a treadmill, performed five days a week, alone (n = 19 ) or associated with the use of simvastatin (40 mg / day, n = 18), Mikus et al.46 found that, although the association caused more significant reductions in total cholesterol (TC) and LDL-cholesterol levels, the increases in cardiorespiratory fitness and citrate synthase enzyme activity of the vastus lateralis muscle, in response to exercise, were attenuated in subjects treated with statins, indicating that the drug may inhibit some of the body’s adaptive responses to exercise. Despite their significance, these results were obtained in the absence of a group treated with statins only, which considerably limits the advance of knowledge about the exacerbation of the deleterious effects of statins by physical exercise. Considering the body’s adaptation to training, it can be assumed that muscle responses to chronic exercises are different from those observed in acute exercises. An experimental study with an animal model, which evaluated the effects of 60 minutes of moderate aerobic physical activity (9.75 m/min) on a treadmill, performed five times a week for two months, concomitant with simvastatin (20 mg/kg) and fluvastatin (20 mg/kg) treatment in rats showed that the drug use caused mild to severe muscle changes in the soleus muscle, which were more frequent when the drug was associated with exercise43. In this regard, the present literature review found only one study that assessed the effect of adding moderate chronic exercise to regular treatment with rosuvastatin (10 mg/day) in dyslipidemic adults of both sexes (n = 31, aged 40-65 years). In this randomized clinical trial, it was observed that both drug treatment and its association with 12 weeks of aerobic training on a treadmill and resistance exercises, performed three times a week, led to significant decreases in the participants’ lipid profile, with the reduction in oxidized LDL more effective in individuals submitted to exercises47. Statin users that practiced physical exercises had an increase in maximum oxygen consumption compared to their sedentary peers, with a similar effect observed for the muscle strength variables, with no increase in CK levels or the reports of pain, which demonstrates that this combination results in health variable improvements with no additional damage to the musculature of practitioners47. Similarly, in the study carried out with guinea pigs performed by Seachrist et al.44, high doses of cerivastatin were concomitantly administered to the practice of intense physical exercise on a treadmill for 14 days. Results showed that this association increased CK levels and exacerbated degeneration of mitochondria and other organelles of skeletal muscles. Evidence from animal studies indicated that physical training, of both high and moderate intensity, when associated with statin treatment at low or potentially harmful doses, results in muscle damage. However, studies performed in humans have shown different results. In summary, it can be observed that treatment with statins, both in elderly men and the general adult population, when combined with 12 weeks of aerobic training with aerobic and resistance exercises, does not increase reports of pain or CK levels, in addition to leading to gains in muscle and metabolic functions resulting from the training. Despite the little evidence and the need for longer studies, with different exercise modalities and training intensities, and the assessment of alterations in muscle tissue, these results show that performing moderate exercise during statin use is safe and more beneficial than remaining sedentary. Statins and chronic physical exercises 328 In the study performed by Meex et al.45, elderly men, users or not of statins, were exposed to a 12-week training protocol, characterized by the practice of moderate aerobic exercise on a cycle ergometer and resistance exercises three times a week, with the following parameters being evaluated: substrate oxidation, phosphocreatine (PCr) recovery and expression of proteins from the skeletal muscle mitochondrial electron transport chain complex. The results of this study showed that treatment with statins (atorvastatin, rosuvastatin, pravastatin and simvastatin) at different doses did not limit the practice of physical exercise or training-induced gains in muscle mass and mitochondrial quality of those practicing exercises, indicating that the proposed associations were safe. Arq Bras Cardiol. 2015; 104(4):324-332 Bonfim et al. Muscle Responses to Statins and Exercises Review Article Mechanisms of muscle responses to statins and physical exercises To date, evidence from research indicates that the intense training performed by athletes, as well as the practice of eccentric and strenuous exercise may exacerbate muscle injury caused by statin administration. In this regard, Meador and Huey21 proposed, in their review study, some of the mechanisms by which exercise exacerbates muscle injury caused by statins. According to the authors, the mitochondrial damage caused by statins, associated with increased energy flow and glycogen depletion due to the exercise, could be an exacerbation factor; however, they add other possibilities, such as the activation of the protein kinase pathway signaled by isoprenoids and stimulated by muscle contraction, as well as increases in the UPS pathway activity mediated by both statins and exercise. In spite of this theoretical explanatory model of possible muscle injury exacerbation mechanisms, the scientific evidence to support these hypotheses is still scarce. The increased expression of genes involved in protein catabolism and UPS pathway was identified only in the research Urso et al.42, while mitochondrial damages and energy supply disorders have been further explored, having been verified in both the studies by Seachrist et al.44, as in more recent studies. In this regard, Bouitbir et al.26 reported that rats treated with atorvastatin (10 mg / kg / day) showed mitochondrial function loss in the plantar muscle. The exposure of these animals to an exhaustive exercise test on a treadmill produced 226% more ROS than in the placebo group, with a reduction in maximum mitochondrial respiration (-39%) also being observed, which was significantly associated with the shortest distance walked in the test (r = 0.62; p <0.01). ROS are generated in the mitochondria as a result of energy metabolism and their increased production can cause damage to lipids, proteins and cellular DNA, altering mitochondrial function and triggering deleterious effects to muscle. These results indicate that exhaustive exercise, associated with mitochondrial damage resulting from treatment with statins, actually exacerbate metabolic disorders in skeletal muscle, resulting in a more oxidant status in this structure and, consequently, reducing the effort capacity of the animals. This disorder in the muscle energy supply system caused by the use of statins has also been found in humans, as shown in the work by Wu et al.48, which characterized the kinetics of PCr recovery after calf effort in individuals of both sexes (n = 10, 35 to 69 years) treated with statins for 4 weeks. The muscle PCr metabolic recovery rate is a parameter used as an index of muscle oxidative capacity in vivo, with a longer recovery time reflecting impaired oxidative phosphorylation and/or mitochondrial ATP synthesis. The results showed that exposure to statins did not alter CK levels, but resulted in a significant increase in metabolic recovery time after effort (from 28.1 to 55.4 seconds; p = 0.02), suggesting that this drug may impair mitochondrial oxidative function, which could explain the possible muscle involvement caused by its association with physical exercise. Despite evidence indicating non-selective mitochondrial damage in the muscles of statin users, symptomatic individuals are apparently more predisposed to lesions and show more marked injury. In this regard, Hubal et al.49 assessed the global pattern of gene expression on skeletal muscle of patients of both sexes that used myalgia-inducing statins (n = 9) or not (n = 5) in response to eccentric exercise. After 4 months of drug treatment, it was found that patients who had classic signs and symptoms of myalgia had decreased NADH expression of complex I of the electron transport chain, as well as decreased succinate dehydrogenase in complex II, cytochrome c oxidase in complex IV and ATP4B in complex V, indicating that preexisting deficiencies in energy production could contribute to the development of symptoms caused by physical effort during statin therapy49. However, information about the association of statins to moderate chronic exercise suggests that other responses may occur, in addition to muscle injury exacerbation. According to Meador and Huey21, muscle adaptations caused by training, such as increased heat shock protein protection (related to the reduction in oxidative stress, apoptosis inhibition and muscle injury attenuation), direct suppression of apoptotic factors and increased mitochondrial biogenesis may result in muscle injury attenuation. To test this hypothesis, the same authors submitted mice to 14 days of combined treatment consisting of physical exercise and statins, after a previous adaptation of 14 days to exercise or physical inactivity and found that the drug reduced muscle strength and fatigue resistance in sedentary and non-adapted animals, when compared to adapted ones, indicating that adaptation to exercise protects the skeletal muscles against the deleterious effects of statins50. Similarly, Bouitbir et al.25 found that training for 10 days on a treadmill improved the oxidative and antioxidant capacity of the plantar muscle in Wistar rats compared to sedentary animals, and that in vitro exposure of the muscles of sedentary animals to atorvastatin reduced the oxidative capacity in a dose-dependent manner. However, they demonstrated that the impaired mitochondrial function caused by drug exposure was lower in the muscles of trained animals, indicating a protective effect of physical exercise related to the improvement of mitochondrial respiration and antioxidant capacity, aimed at attenuating statin-induced oxidative stress. The extrapolation of these results to humans seems to suggest that physically active individuals prior to treatment with statins may be protected from the deleterious drug effects, indicating that the prescription of exercise training prior to drug therapy with statins might be a preventive measure to muscle effects. Despite the evidence, Bonfim et al.51 recently found that many patients with dyslipidemia undergoing treatment with statins are sedentary and, therefore, would not be previously protected if they chose to carry out changes in their lifestyle. Practical contributions In a recent review study, Opie52 briefly explored the controversies between beneficial heart effects and myopathic side effects of the statin and exercise association, outlining Arq Bras Cardiol. 2015; 104(4):324-332 329 Bonfim et al. Muscle Responses to Statins and Exercises Review Article some practical guidelines for this situation. Based on the findings of Kokkinos et al.5, who found that statin therapy associated with a moderate-to-high physical fitness level offers additional protection against premature cardiovascular death, and a meta-analysis of prospective studies that assessed the association of dose-response between exercise intensity and cardiovascular protection, the author recommends the practice of brisk walking for at least 3 hours a week to maintain cardiovascular protection, but does not provide more specifications regarding the intensity. Considering the side effects on musculature, the author proposes that dyslipidemic individuals using statins that have their running capacity limited due to isolated muscle pain, choose carrying out shorter or slower runs; however, he emphasizes that the lack of evidence in the literature to deal with cases where the pain is accompanied by an increase in CK levels allows both the cessation or reduction in medication dose, as well as reducing the intensity of exercise as possible therapeutic measures, stressing the urgent need to perform further research to find the balance between muscle symptoms and cardiovascular protection levels52. In summary, considering the current state-of-the-art, it is observed that the situations of muscle injury caused by statins may be exacerbated by high-intensity physical training and acute eccentric and strenuous exercises, while the chronic practice of exercises at moderate intensity, both before and concomitantly to treatment with statins, can attenuate the injuries and even improve muscle function of the practitioners (Figure 2). In this sense, it is suggested that dyslipidemic patients on statins be exposed to aerobic exercises combined with resistance exercises of moderate intensity, three days a week. The provision of physical training prior to the administration of drug treatment is desirable; however, in cases when this is not feasible, we suggest caution in prescribing physical activity during the first weeks, when strenuous and eccentric exercises should be avoided. Conclusion The research evidence shows that intense training performed by athletes, as well as the practice of eccentric and strenuous exercises may exacerbate muscle injury resulting from the administration of statins. On the other hand, chronic exercises of moderate intensity, performed both before and concurrently to treatment with statins, can attenuate the harmful effects and improve muscle function in its practitioners. Author contributions Conception and design of the research:Bonfim MR. Acquisition of data: Bonfim MR. Analysis and interpretation of the data: Bonfim MR. Writing of the manuscript: Bonfim MR, Oliveira ASB, Amaral SL, Monteiro HL. Critical revision of the manuscript for intellectual content: Oliveira ASB, Amaral SL, Monteiro HL. Potential Conflict of Interest No potential conflict of interest relevant to this article was reported. Sources of Funding There were no external funding sources for this study. Study Association This article is part of the thesis of Doctoral submitted by Mariana Rotta Bonfim, from Programa de Pós-Graduação em Ciências da Motricidade of Universidade Estadual Paulista UNESP, Campus de Rio Claro. Dysfunction in calcium homeostasis Statins Mitochondrial dysfunction ↑ Reactive oxygen species Strenuous exercise ↑ In up pathway activity Myopathy Mitochondrial function improvement Moderate exercise ↑ Antioxidant capacity ↑ Muscle strength and resistance Figure 2 – Muscle responses of the association of statins with physical exercise. Strenuous exercises are characterized by acute eccentric exercises, maximum capacity tests and/or competitive activities; moderate exercises are characterized by aerobic training, with or without resistance training, usually performed three times a week for 12 weeks. UP: ubiquitin proteasome. 330 Arq Bras Cardiol. 2015; 104(4):324-332 Bonfim et al. Muscle Responses to Statins and Exercises Review Article References 1. World Health Organization (WHO). The World Health Report 2002. Reducing risks, promoting healthy life. Geneva; 2002. 21. Meador B, Huey KA. Statin-associated myopathy and its exacerbation with exercise. Muscle Nerve. 2010;42(4):469-79. 2. Xavier HT, Izar MC, Faria Neto JR, Assad MH, Rocha VZ, Sposito AC; Sociedade Brasileira de Cardiologia. V Diretriz brasileira de dislipidemias e prevenção da aterosclerose. Arq Bras Cardiol. 2013;101(4 supl. 1):1-22. 22. Muraki A, Miyashita K, Mitsuishi M, Tamaki M, Tanaka K, Itoh H. Coenzyme Q10 reverses mitochondrial dysfunction in atorvastatin-treated mice and increases exercise endurance. J Appl Physiol (1985). 2012;113(3):479-86. 3. 23. Deichmann R, Lavie C, Andrews S. Coenzyme q10 and statin-induced mitochondrial dysfunction. Ochsner J. 2010;10(1):16-21. 4. Sposito AC, Caramelli B, Fonseca FA, Bertolami MC, Afiune Neto A, Souza AD, et al.; Sociedade Brasileira de Cardiologia. IV Diretriz brasileira sobre dislipidemias e prevenção da aterosclerose. Arq Bras Cardiol. 2007;88(supl 1):1-18. National Cholesterol Education Program (NCEP) Expert Panel on Detection, Evaluation, and Treatment of High Blood Cholesterol in Adults (Adult Treatment Panel III). Third report of the National Cholesterol Education Program (NCEP) expert panel on detection, evaluation, and treatment of high blood cholesterol in adults (Adult Treatment Panel III) final report. Circulation. 2002;106(25):3143-421. 5. Kokkinos PF, Faselis C, Myers J, Panagiotakos D, Doumas M. Interactive effects of fitness and statin treatment on mortality risk in veterans with dyslipidaemia: a cohort study. Lancet. 2013;381(9864):394-9. 6. Joy TR, Hegele RA. Narrative review: statin-related myopathy. Ann Intern Med. 2009;150(12):858-68. 7. Thompson PD, Clarkson PM, Rosenson RS; National Lipid Association Statin Safety Task Force Muscle Safety Expert Panel. An assessment of statin safety by muscle experts. Am J Cardiol. 2006;97(8A):69C-76C. 8. Bruckert E, Hayem G, Dejager S, Yau C, B´Egaud B. Mild to moderate muscular symptoms with high-dosage statin therapy in hyperlipidemic patients: the PRIMO study. Cardiovasc Drugs Ther. 2005;19(6):403-14. 9. Krishnan GM, Thompson PD. The effects of statins on skeletal muscle strength and exercise performance. Curr Opin Lipidol. 2010;21(4):324-8. 10. Veillard NR, Mach F. Statins: the new aspirin? Cell Mol Life Sci. 2002;59(11):1771-86. 11. Brown WV. Safety of statins. Curr Opin Lipidol. 2008;19(6):558-62. 12. Thompson PD, Clarkson P, Karas RH. Statin-associated myopathy. JAMA. 2003;289(13):1681-90. 13. Parker BA, Thompson PD. Effect of statin on skeletal muscle: exercise, myopathy and muscle outcomes. Exerc Sport Sci Rev. 2012;40(4):188-94. Erratum in: Exerc Sport Sci Rev. 2013;41(1):71. 14. Mansi I, Freil CR, Pugh MJ, Makris U, Mortensen EM. Statins and musculoskeletal conditions, arthropathies, and injuries. JAMA Intern Med. 2013;173(14):1-10. Erratum in: JAMA Intern Med. 2013;173(15):1477. 15. Hoffman KB, Kraus C, Dimbil M, Golomb BA. A survey of the FDA´s AERS database regarding muscle and tendon adverse events linked to the statin drug class. Plos One. 2012;7(8):e42866. 16. Thompson PD, Parker BA, Clarkson PM, Pescatello LS, White CM, Grimaldi AS, et al. A randomized clinical trial to assess the effects of statins on skeletal muscle function and performance: rationale and study design. Prev Cardiol. 2010;13(3):104-11. 17. Parker BA, Capizzi JA, Grimaldi AS, Clarkson PM, Cole SM, Keadle J, et al. Effect of statin on skeletal muscle function. Circulation. 2013;127(1):96103. 18. Ballard KD, Parker BA, Capizzi JA, Grimaldi AS, Clarkson PM, Cole SM, et al. Increases in creatine kinase with atorvastatin treatment are not associated with decreases in muscular performance. Atherosclerosis. 2013;230(1):121-4. 24. Camerino GM, Pellegrino MA, Brocca L, Digennaro C, Camerino DC, Pierno S, et al. Statin or fibrate chronic treatment modifies the proteomic profile of rat skeletal muscle. Biochem Pharmacol. 2011;81(8):1054-64. 25. Bouitbir J, Daussin F, Charles AL, Rasseneur L, Dufour S, Richard R, et al. Mitochondria of trained skeletal muscle are protected from deleterious effects of statins. Muscle Nerve. 2012;46(3):367-73. 26. Bouitbir J, Charles AL, Rasseneur L, Dufour S, Piquard F, Geny B, et al. Atorvastatin treatment reduces exercise capacities in rats: involvement of mitochondrial impairments and oxidative stress. J Appl Physiol (1985). 2011;111(5):1477-83. 27. Stringer HA, Soshi GK, Maguire JA, Côté HC. Decreased skeletal muscle mitochondrial DNA in patients with statin-induced myopathy. J Neurol Sci. 2013;325(1-2):142-7. 28. Larsen S, Stride N, Hey-Mogensen M, Hansen CN, Bang LE, Bundgaard H, et al. Simvastatin effects on skeletal muscle: relation to decreased mitochondrial function and glucose intolerance. J Am Coll Cardiol. 2013;61(1):44-53. 29. Sirvent P, Mercier J, Vassort G, Lacampagne A. Simvastatin triggers mitochondria-induced Ca2+ signaling alteration in skeletal muscle. Biochem Biophys Res Commun. 2005;329(3):1067-75. 30. Sirvent P, Bordenave S, Vermaelen M, Roels B, Vassort G, Mercier J, et al. Simvastatin induces impairment in skeletal muscle while heart is protected. Biochem Biophys Res Commun. 2005;338(3):1426-34. 31. Liantonio A, Giannuzzi V, Cippone V, Camerino GM, Pierno S, Camerino DC. Fluvastatin and atorvastatin affect calcium homeostasis of rat skeletal muscle fibers in vivo ans in vitro by impairing the sarcoplasmic reticulum/ mitochondria Ca²+-release system. J Pharmacol Exp Ther. 2007;321(2):62634. 32. Mohaupt MG, Karas RH, Babiychuk EB, Sanchez-Freire V, Monastyrskaya K, Iyer L, et al. Association between statin-associated myopathy and skeletal muscle damage. CMAJ. 2009;181(1-2):E11-8. 33. Draeger A, Sanchez-Freire V, Monastyrskaya K, Hoppeler H, Mueller M, Breil F, et al. Statin therapy and the expression of genes that regulate calcium homeostasis and membrane repair in skeletal muscle. Am J Pathol. 2010;177(1):291-9. 34. Sirvent P, Fabre O, Bordenave S, Hillaire-Buys D, Raynaud De Mauverger E, Lacampagne A, et al. Muscle mitochondrial metabolism and calcium signaling impairment in patients treated with statins. Toxicol Appl Pharmacol. 2012;259(2):263-8. 35. Galtier F, Mura T, Mauverger ER, Chevassus H, Farret A, Gagnol JP, et al. Effect of a high dose of simvastatin on muscle mitochondrial metabolism and calcium signaling in healthy volunteers. Toxicol Appl Pharmacol. 2012;263(3):281-6. 36. Sinzinger H, O´Grade J. Professional athletes suffering from familial hypercholesterolemia rarely tolerate statin treatment because of muscular problems. Br J Clin Pharmacol. 2004;57(4):525-8. 19. Sirvent P, Mercier J, Lacampagne A. New insights into mechanisms of statinassociated myotoxicity. Curr Opin Pharmacol. 2008;8(3):333-8. 37. Parker BA, Augeri AL, Capizzi JA, Ballard KD, Troyanos C, Gaggish AL, et al. Effects of statin on creatine kinase levels before and after a marathon run. Am J Cardiol. 2012;109(2):282-7. 20. Di Stasi SL, Macleod TD, Winters JD, Binder-Macleod SA. Effects of statins on skeletal muscle: a perspective for physical therapists. Phys Ther. 2010;90(10):1530-42. 38. Thompson PD, Zmuda JM, Domalik LJ, Zimet RJ, Staggers J, Guyton JR. Lovastatin increases exercised-induced skeletal muscle injury. Metabolism. 1997;46(10):1206-10. Arq Bras Cardiol. 2015; 104(4):324-332 331 Bonfim et al. Muscle Responses to Statins and Exercises Review Article 39. Reust CS, Curry SC, Guidry JR. Lovastatin use and muscle damage in healthy volunteers undergoing eccentric muscle exercise. West J Med. 1991;154(2):198-200. 46. Mikus CR, Boyle LJ, Borengasser SJ, Oberlin DJ, Naples SP, Fletcher J, et al. Simvastatin impairs exercise training adaptations. J Am Coll Cardiol. 2013;62(8):709-14. 40. Kearns AK, Bilbie CL, Clarkson PM, White CM, Sewright KA, O´Fallon KS, et al. The creatine kinase response to eccentric exercise with atorvastatin 10 mg or 80 mg. Atherosclerosis. 2008;200(1):121-5. 47. Coen PM, Flynn MG, Markifski MM, Pence BD, Hannemann RE. Adding exercise training to rosuvastatin treatment: influence on serum lipids and biomarkers of muscle and liver damage. Metabolism. 2009;58(7):1030-8. 41. Panayiotou G, Paschalis V, Nikolaidis MG, Theodorou AA, Deli CK, Fotopoulou N, et al. No adverse effects of statin on muscle function ans health-related parameters in the elderly: an exercise study. Scand J Med Sci Sports. 2013;23(5):556-67. 42. Urso ML, Clarkson PM, Hittel D, Hoffman E, Thompson PD. Changes in ubiquitin proteasome pathway gene expression in skeletal muscle with exercise and statins. Asterioscler Thromb Vasc Biol. 2005;25(12):2560-6. 43. Aciolly MF, Camargo Filho JC, Padulla SAT, Lima ALZ, Bonfim MR, Carmo EM, et al. Efeito do exercício físico e estatinas na função muscular em animas com dislipidemia. Rev Bras Med Esp. 2012;18(3):198-202. 44. Seachrist JL, Loi C, Evans MG, Criswell KA, Rothwell CE. Roles of exercise and pharmacokinetics in cerivastatin-induced skeletal muscle toxicity. Toxicol Sci. 2005;88(2):551-61. 45. Meex RC, Phielix E, Schrauwen-Hinderling VB, Moonen-Kornips E, Schaart G, Schrauwen P, et al. The use of statins potentiates the insulin-sensitizing effect of exercise training in obese males with and without type 2 diabetes. Clin Sci. 2010;119(7):293-301. 332 Arq Bras Cardiol. 2015; 104(4):324-332 48. Wu JS, Buettner C, Smithline H, Ngo LH, Greenman RL. Evaluation of skeletal muscle during calf exercise by 31-phosphorus magnetic resonance spectroscopy in patients on statin medications. Muscle Nerve. 2011;43(1):76-81. 49. Hubal MJ, Reich KA, Biase A, Bilbie C, Clarkson PM, Hoffman EP, et al. Transcriptional deficits in oxidative phosphorylation with statin myopathy. Muscle Nerve. 2011;44(3):393-401. 50. Meador B, Huey KA. Statin-associated changes in skeletal muscle function and stress response after novel or accustomed exercise. Muscle Nerve. 2011;44(6):882-9. 51. Bonfim MR, Hansen A, Turi BC, Zanini GS, Oliveira AS, Amaral SL, et al. Aderência ao tratamento por estatinas e fatores associados em usuárias do SUS. Rev Esc Enferm USP. 2014;48(3):477-83. 52. Opie LH. Exercise-induced myalgia may limit the cardiovascular benefits of statins. Cardiovasc Drugs Ther. 2013;27(6):569-72. Back to the Cover Letter to the Editor Left Atrial Volume Index as Predictor of Events in Acute Coronary Syndrome Luciano Barros Pires and Rodrigo Pires dos Santos Instituto de Cardiologia do Rio Grande do Sul, Porto Alegre, RS – Brazil Dear Editor, The Left Atrial Volume Index (LAVi) is a measurement that has gained importance in daily clinical practice due to evidence of its capacity to predict mortality, in patients followed after an Acute Myocardial Infarction (AMI), as well as in the general population1. The study by Secundo Junior et al. sought to evaluate the role of LAVi as a predictor of late events in patients with acute coronary syndrome2. This study was able to corroborate previous findings in patients with AMI and demonstrated that increased LAVi may also be able to predict major cardiovascular events in patients with unstable angina. Correspondingly, it showed that patients with increased LAVi were those with higher prevalence of systemic arterial hypertension (SAH), previous AMI and angioplasty, of older age, with higher body mass index (BMI), lower left ventricular (LV) ejection fraction and more severe diastolic dysfunction, showing that the index may be a marker related to a higher occurrence of cardiovascular diseases and comorbidities. In cohort studies, a significant problem is the presence of non-controlled variables, which are potential confounding factors that can possibly interfere with the results. The degree of reperfusion success (assessed by TIMI flow, myocardial blush or ST-segment recovery), which maintains significant correlation with better survival, can be one of those factors not measured in this study3. Another confounding factor could be the incidence of atrial fibrillation (AF) in the extra-hospital period. The causal association between AF and ischemic cerebrovascular accident (CVA) has been documented, regardless of echocardiographic findings. It is associated with a four to five-fold increase in the risk of ischemic CVA4 and it is responsible for more than 15% of these events in individuals in all age ranges and 30% in individuals older than 80 years5. Thus, it is not clear, in the results of Secundo Junior et al., whether the high incidence of CVA in the non-hospital follow-up was due only to the increase in LAVi or the possible occurrence of this arrhythmia, and one cannot say that there was no influence of better or worse reperfusion on the incidence of events in either group. Keywords Organ Size; Heart Atria; Myocardial reperfusion; Atrial Fibrillation; Acute Coronary Syndrome/mortality. Mailing Address: Luciano Barros Pires • Rua Pinheiro Machado, 467, Centro. Postal Code 96180000, Camaquã, RS – Brazil E-mail: [email protected], [email protected] Manuscript received December 09, 2014; revised manuscript January 07, 2015; accepted January 12, 2015 DOI: 10.5935/abc.20150030 References 1. Moller JE, Hillis GS, Oh JK, Seward JB, ReederGS, Wright RS, et al Left atrial volume: a powerful predictor of survival after acute myocardial infarction. Circulation, 2003;107(17):2207-12. 2. Santos MA, Faro GB, Soares CB, Silva AM, Secundo PF Jr,et al. Indice de volume atrial esquerdo e predição de eventos em síndrome coronária aguda: registro solar. Arq Bras Cardiol. 2014; 103(4): 282-91 3. Sattur S, Sarwar B, Sacchi TJ, Brener SJ. Correlation between markers of reperfusion and mortality in ST-elevation myocardial infarction: a systematic review. J Invasive Cardiol. 2014; 26(11):587-95. 333 4. Wolf PA, Abbolt RD, Kannel WB. Atrial fibrillation as an independente risk factor for stroke: the Framinghan Study. Stroke. 1991;22(8):983-8. 5. Wolf PA, Abbott RD, Kannel WB. Atrial fibrillation: a major contributor to stroke in the elderly: the Framingham Study. Arch Intern Med. 1987;147(9):1561-4. Pires & Santos LAVi and Cardiovascular Events Letter to the Editor Answer to Letter to the Editor Thank you for your comments and interest in our research and the SOLAR registry. Regarding the potential influence of atrial fibrillation on the higher incidence of ischemic cerebrovascular accident (CVA) in patients with high Left Atrial Volume Index (LAVi), we believe it has not occurred in a significant manner in our study. As shown in Table 3, no significant difference was found regarding atrial fibrillation as a late event between the groups (p = 0.14). As for the possible inclusion of the degree of reperfusion success, we consider it unlikely the presence of any influence of this factor, as the aforementioned table showed no difference regarding hospital treatment between the high LAVi and low LAVi groups, for both clinical treatment alone (p = 0.42) and for angioplasty (p = 0.56), as well as for myocardial revascularization (p = 0.68). Additionally, we believe that the chosen model was the most adequate to the study design and statistical analysis. This was demonstrated by the number of factors (eight) considering the sample size, avoiding overfitting and remaining within a prudent association between predictors and achieved number of events. Several post hoc tests were used, such as landmark analysis, proportional hazards assumption test and obtaining Schoenfeld residuals. These tests showed absence of violations, robust estimates and satisfactory fit of the final model which, incidentally, included factors of extreme clinical relevance and that are easy to acquire, such as the age, gender, presence of diabetes or hypertension acute coronary syndrome type and ejection fraction, then adjusted to LAVi. Finally, because this is a registry, it is indeed necessary to consider the virtual presence of confounding factors and interactions, which was duly explained in the midst of the article, when we describe the potential limitations of this study. Sincerely, Marcos Antônio Almeida Santos Antônio Carlos Sobral Sousa José Alves Secundo Júnior Arq Bras Cardiol. 2015; 104(4):333-334 334 Back to the Cover Clinicoradiological Session Case 4/2015 A 48-year-old Male Patient with Coarctation of the Aorta, Bicuspid Aortic Valve and Normal Ascending Aorta Edmar Atik, Raul Arrieta, Otávio Rizzi Coelho Instituto do Coração, Faculdade de Medicina, Universidade de São Paulo – USP, São Paulo, SP - Brazil Clinical data: The patient reported that, at the age of 23 years, he had been diagnosed with hypertension, which was controlled with five antihypertensive medications. An ultrasound study performed one month ago detected low blood flow through the abdominal aorta. Coarctation of the aorta was suspected, and further confirmed by angiographic CT scan. He had no cardiovascular complaints, but had a sedentary lifestyle. Physical examination: normal breathing; acyanotic; brisk pulses in upper limbs, absent in lower limbs. Weight: 77 kg; height: 168 cm; Blood pressure − BP = right arm = left arm = 125/75 mmHg; BP legs = 75 mmHg; heart rate − HR: 86 bpm. Aorta clearly palpable on the suprasternal notch. Mild grade 1/4 systolic murmur on the suprasternal notch. Apical impulse not palpable in the precordium; absence of systolic impulses on the left sternal border. Normal heart sounds; grade 1/4 coarse systolic murmur in the aortic area, with no irradiation. No murmurs in the back. Liver not palpable. Laboratory tests Electrocardiogram: Normal sinus rhythm, no chamber overload. Sokoloff index = 20 mm; mild ventricular repolarization abnormality. Left anterior hemiblock and septal fibrosis. PA: +60o; QRSA: -45o; TA: +100o (Figure 1). Chest radiograph: Normal cardiac silhouette (cardiothoracic ratio: 0.48). Normal pulmonary vascular network and concave arch of pulmonary artery. The posterior aortic arch was not bulged; hyperdensity in some rib borders (Figure 1). Echocardiogram: Bicuspid aortic valve with maximum and mean pressure gradient of 14 and 7 mmHg, respectively. The ascending aorta (AscAo) was not dilated (35 mm); aortic arch = 37 mm; narrowing in the isthmic region (3 mm), with pressure gradient of 51 mmHg. Cardiac chambers of normal size. No myocardial hypertrophy; septum and posterior wall with 9-mm thickness. Normal left ventricular function (69%). CT angiography of the aorta: AscAo = 40 mm; aortic crossing and descending aorta (DescAo) = 32 mm; Keywords Coarctation of Aorta, Bicuspid Aortic Stenosis; Percutaneous; Aortic Treatment. Mailing Address: Edmar Atik • Rua Dona Adma Jafet, 74, conj. 73, Bela Vista. Postal Code 01308-050. São Paulo, SP – Brazil E-mail: [email protected]; [email protected] Manuscript received July 23, 2014; revised manuscript August 08, 2014; accepted August 08, 2014. DOI: 10.5935/abc.20140215 e27 narrowing at isthmus = 3 mm and at diaphragm = 25 mm. Marked collateral circulation, corresponding to the intercostal, bronchial and mammary arteries. Cardiac catheterization: (Figure 2). Pressure levels were as follows: left ventricle − LV = 160/12, AscAo = 130/80 and DescAo = 90/80 mmHg. Angiography showed clear narrowing at the aortic isthmus of approximately 2.5 cm past the left subclavian artery, with no AscAo or DescAo dilatation distal to the obstruction. Clinical diagnosis: Severe coarctation of the aorta at the isthmic region and mild aortic valve stenosis in bicuspid valve with no AscAo dilatation or hypertrophy, in natural course. Clinical reasoning: The clinical elements of coarctation of the aorta are clear and easy to identify, and are mainly represented by contrasting pulses and BP between the upper and lower limbs, as occurred in this case, although detected late by indirect means of abdominal ultrasound. Noteworthy, despite the long-standing heart disease with pressure overload, no myocardial hypertrophy, signs of electric overload or symptoms are observed. This results from the fact that, in this obstructive anomaly, there is formation of collateral vessels that deviate blood in order to nourish the general circulation. Chest radiograph with normal cardiac silhouette expresses preserved ventricular function, and surprisingly there is no AscAo dilatation despite the presence of bicuspid aortic valve and coarctation of the aorta. Differential diagnosis: Aortic obstructions in adulthood usually result from previous aortitis, as occurs in Takayasu and Kawasaki disease, as well as in connective tissue and infectious diseases. Management: In view of the long-standing systolic impact, even without myocardial hypertrophy and with increased pressures in the proximal aorta circuit, operation is mandatory aiming at relieving the arterial obstruction, which would imply a greater possibility of development of myocardial fibrosis, heart failure, arrhythmias and earlier death. Dilatation of the isthmic region was chosen using therapeutic cardiac catheterization from the right femoral artery with placement of a 40 x 18-mm stent just past the origin of the left subclavian artery. Systolic BP immediately decreased to 100 mmHg even without the use of antihypertensive drugs. Adequate enlargement of the region was achieved (Figure 2) with equalization of pressures between limbs. The mild systolic murmur of aortic valve stenosis remained unchanged. Commentaries: Cardiac compensation with maintained antegrade flow, in coarctation of the aorta, is achieved by the myocardial hypertrophy and/or development of collateral circulation, which alleviates the aortic obstruction and satisfactorily nourishes the circulation. In this case, the marked aortic obstruction detected in adulthood and manifested Edmar Atik Coarctation of the Aorta and Bicuspid Aortic Valve Clinicoradiological Session Figure 1 – Chest radiography showing normal cardiac silhouette. 40 x 18-mm stent positioned in the beginning of the descending aorta, corresponding to the arch of the pulmonary artery. Hyperdensity can be observed in the lower border of some ribs. On electrocardiogram, left anterior hemiblock, septal fibrosis and upper lateral ischemia. by hypertension, was compensated by exuberant collateral circulation. Hence the favorable outcome until the fifth decade of life. Left anterior hemiblock and septal fibrosis on the electrocardiogram are difficult to explain in the absence of myocardial hypertrophy. Even when hemodynamically compensated, this obstructive anomaly should be treated early so as to prevent an unfavorable outcome in relation to the development of myocardial fibrosis, arrhythmias and heart failure. In the course of bicuspid aortic valve, unfavorable elements such as AscAo dilatation arise, and these invariably should be treated surgically in a timely manner. However, in this patient, the expected aortic dilatation was not observed, and this makes a good outcome possible even for a longer term. Aortic dilatation seems to be more related to inherent factors of the arterial wall (adequate morphology of the parietal muscle) than to hemodynamic aspects1. Arq Bras Cardiol. 2015; 104(4):e27-e29 e28 Edmar Atik Coarctation of the Aorta and Bicuspid Aortic Valve Clinicoradiological Session Figure 2 – Upper angiographic images (A and B) show marked isthmic coarctation of the aorta with normal ascending aorta, and exuberant collateral circulation; C and D show images of the descending aorta after placement of a 40 x 18-mm stent, with uniform diameters and no post-stenotic dilatation. Reference 1. Jackson V, Petrini J, Caidahl K, Eriksson MJ, Liska J, Eriksson P, et al. Bicuspid aortic valve leaflet morphology in relation to aortic root morphology: a study of 300 patients undergoing open-heart surgery. Eur J Cardiothorac Surg. 2011;40(3):e118-24. Erratum in: Eur J Cardiothorac Surg. 2012;41(2):471. e29 Arq Bras Cardiol. 2015; 104(4):e27-e29 Back to the Cover Case Report Sickle-cell Anemia and Latent Diastolic Dysfunction: Echocardiographic Alterations André Fattori, Daniela Camargo Oliveira, Roger Frigério Castilho, Otávio Rizzi Coelho Faculdade de Ciências Médicas da Universidade Estadual de Campinas – Unicamp, São Paulo, SP - Brazil Introduction Sickle-cell anemia (SCA) is a disease that can cause systemic complications, such as multiple organ dysfunction due to vaso - occlusion and endothelial activation. The genetic cause of the disease is a substitution of the amino acid glutamic acid for valine in the position 6 of the beta globin chain1. Stress factors in the vascular microenvironment (cellular dehydration, hypoxemia, increased corpuscular hemoglobin concentration, decreased red blood cell transit time in the microcirculation, and decreased blood pH) trigger intracellular hemoglobin polymerization, forming paracrystalline structures that cause sickling of erythrocytes and increased blood viscosity, hemolysis, and vaso-occlusion 1,2. Simultaneously, free hemoglobin in the plasma sequesters nitric oxide (NO), leading to decreased NO bioavailability and increased endothelial adhesion (in physiological conditions, NO inhibits of platelet aggregation, platelet activation, transcription of platelet adhesion proteins)1. The increase in cardiac output (CO), the afterload reduction due to the peripheral vasodilation as a response to hypoxemia, the increase in blood viscosity secondary to the morphological alterations, and the loss of the deformability of the sickle red blood cells are factors involved with the systolic ventricular overload and progressive enlargement of the cardiac chambers3-5. Case Report In the present paper, we report the adverse effects after volume expansion observed in a single patient with SCA. Initial examination showed borderline left ventricular systolic function, without evident diastolic dysfunction on echocardiography, which was performed as part of a study protocol for cardiac complications in adults with SCA and was previously approved by the local ethics committee. We present the details of the case below. The patient was a 40-year-old male SCA patient without history Keywords Ventricular Dysfunction; Heart Rate; Anemia, Sickle Cell; Echocardiography, Doppler Mailing Address: André Fattori • Rua Joaquim de Paula Souza, 52, Proença. Postal Code: 13026-210, Campinas – SP, Brazil E-mail: [email protected]; [email protected] Manuscript received, March 6, 2014, revised August 16, 2014, accepted August 26, 2014. DOI: 10.5935/abc.20150027 e30 of symptoms except for the complaint of sporadic palpitations related to moderate physical effort at presentation. Cardiac function was evaluated using two-dimensional echocardiography in M-mode, pulsed wave Doppler, continuous wave Doppler, color Doppler, and tissue Doppler6,7. Baseline laboratory examinations showed serum hemoglobin levels of 10.1 mg/dL, lactate dehydrogenase (LD) levels of 1,002 U/L, ferritin levels of 280.9 ng/mL, NT-pro-BNP levels of 250.0 pg/ml; the electrophoretic profile of hemoglobin determined by high‑performance liquid chromatography showed 82.6% HBS and 3.8%, HA2, with the remainder being HBF. After the initial examination, the patient underwent normal saline infusion. After 12 min of infusion (400 ml), he complained of palpitation and dyspnea. Physical examination showed an elevated jugular venous column and pulmonary crepitations. Echocardiography was repeated and isolated periods of supraventricular bigeminy and supraventricular extrasystoles were observed (Table 1); these findings persisted for up to 10 min after the infusion was stopped. When echocardiography was repeated again after restarting intravenous normal saline infusion, important variations were observed in chamber sizes and parameters indicating diastolic function compared with the values obtained at baseline. The left atrium (LA), which initially showed a small increase in volume (34.0 ml/m²), showed marked dilatation (56.0 ml/m²); the ejection fraction was normal, as assessed by the Teicholtz (60%) and Simpson (54%) methods (Figures 1 and 2). Discussion With regard to the parameters of diastolic function analyzed in the present case, a progression to an abnormal diastolic filling pattern was observed in the second echocardiographic examination, as shown in Table 1. The E/A ratio showed a marked increase, compatible with an abnormal diastolic filling pattern, as observed in type II diastolic dysfunction. These findings were corroborated by the appearance of the L wave and the inversion of the S/D flow in the pulmonary vein7. Other characteristic indicators of diastolic dysfunction, such as increased isovolumic relaxation time and E wave deceleration time, were compatible with myocardial overload. The expected change in diastolic function during pressure overload of LA would be a reduction of E and mitral E velocities and the maintenance of an elevated E/E’ ratio proportional to the degree of diastolic dysfunction. In the present case, mitral flow velocities were paradoxically decreased; however, E’ velocity increased. Thus, mitral flow velocities were not considered to be a reliable marker of diastolic dysfunction for this patient. The pulmonary venous flow was a more accurate Fattori et al. Diastolic dysfunction in sickle-cell anemia Case Report Table 1 – Echocardiographic measures at baseline and after the volume load (400 mL of 0.9% saline solution) Parameter Aortic root diameter (cm) Baseline Value at overload 3.1 3.3 Left atrial diameter (cm) 4.4 4.4 Left atrial volume (end of the ventricular systole), ml/m2 34.0 56.0 Maximum right atrial volume (ml) 44.0 47.0 LV end-diastolic diameter (cm) 5.5 5.5 LV end-systolic diameter (cm) 3.8 3.7 Thickness of the interventricular septum (cm) 0.80 0.90 Thickness of LV posterior wall (cm) 0.80 0.80 RV end-diastolic diameter (cm) 2.4 2.3 Left ventricular mass (g) 122 142 LEV mass/volume ratio 0.80 0.90 Teichholz ejection fraction 58% 60% Simpson ejection fraction 50% 54% Mitral E/A ratio 1.27 2.67 Deceleration time (ms) 0.150 0.217 Isovolumic relaxation time (ms) 0.046 0.096 E wave (cm/s) 86.8 80.8 A wave (cm/s) 68.5 30.2 Mitral/Septal S’ wave (cm/s) 8.70 8.70 Mitral/Septal E’ wave (cm/s) 12.80 13.40 Septal/mitral E/E’ ratio 6.78 6.03 Septal/mitral E’/A’ ratio 1.47 2.4 TEI index 0.23 0.34 Acceleration time/ejection time 0.48 0.47 Mitral gradient 28.0 25.0 >1 <1 Systolic flow/diastolic flow of the pulmonary vein marker of the alteration from the normal pattern to an abnormal diastolic filling pattern. It is possible that this phenomenon is related to a hyperdynamic cardiac state secondary to anemia, probably because of increased recruitment of cardiac muscle fibers during volume overload (evidenced by the increased E’ velocity and increased ejection fraction). An important characteristic that was also evaluated was the rate of global ventricular performance, or the Tei index, a parameter indicated for the standardization and comparison of results obtained by different studies. In this patient, the Tei index increased from 0.23 to 0.34 after normal saline infusion. This worsening of performance can be explained by the increase in the duration of isovolumic contraction and relaxation, combined with decreased ventricular compliance. It is interesting to note that the heart rate did not change in the observation period. The echocardiographic follow-up used independent measures of volume load because the hemodynamic characteristics of SCA, such as increased CO, may mask diastolic dysfunction, thus leading to the underdiagnosis of the condition. The patient described in this case showed two biochemical markers associated with unfavorable outcomes. Elevated LD values are indicators of marked hemolysis and predictors of clinical complications in SCA, mainly those associated with endothelial activation and chronic inflammation.8-10 Another characteristic was the elevation in NT-pro-BNP levels, which were at 250.0 pg/ml at baseline in the present case; this may suggest the subclinical impairment of cardiac function. NT-pro‑BNP levels > 160.0 pg/mL have been associated with the diagnosis of pulmonary hypertension, and they are considered an independent risk factor for high mortality.8-10 The importance of this case lies in the fact that cardiopulmonary complications are the main cause of death in SCA patients. In particular, in the present case, a normal echocardiographic pattern was observed before volume stress. This suggests that some SCA patients can present with potentially fatal complications even if few abnormalities are observed at examination. Additional studies are needed to better understand the alterations in ventricular/atrial Arq Bras Cardiol. 2015; 104(4):e30-e33 e31 Fattori et al. Diastolic dysfunction in sickle-cell anemia Case Report Figure 1 – (A) Parasternal view in M-mode showing the aorta and the left atrium. (B) The same view as figure A, with ECG showing isolated ventricular extrasystoles. (C) Baseline spectral Doppler recording of the mitral flow. (D) Postinfusion spectral Doppler recording, showing mitral reflux and the development of the L wave. Figure 2 – Apical views of the four chambers before (A) and after (B) volume expansion, showing left atrial volumes of 34 mL/m2 and 56 mL/m2, respectively. e32 Arq Bras Cardiol. 2015; 104(4):e30-e33 Fattori et al. Diastolic dysfunction in sickle-cell anemia Case Report compliance and diastolic function as well as to identify patients at risk of hemodynamic decompensation and adverse outcomes. Potential Conflict of Interest No potential conflict of interest relevant to this article was reported. Author contributions Conception and design of the research: Fattori A, Oliveira DC, Coelho OR; Acquisition of data and Writing of the manuscript: Fattori A, Oliveira DC; Analysis and interpretation of the data and Critical revision of the manuscript for intellectual content: Fattori A, Oliveira DC, Castilho RF, Coelho OR; Statistical analysis and Obtaining financing: Fattori A; Fattori A, Oliveira DC, Castilho RF, Coelho OR. Sources of Funding This study was funded by FAPESP. Study Association This article is part of the thesis of Doctoral submitted by Daniela Camargo Oliveira, from Faculdade de Ciências Médicas - UNICAMP. References 1. Kato GJ, Gladwin MT, Steinberg MH. Deconstructing sickle cell disease: reappraisal of the role of hemolysis in the development of clinical subphenotypes. Blood. 2007; 21(1):37-47. 2. Eaton WA, Hofrichter J. Sickle cell hemoglobin polymerization. Adv Protein Chem.1990;40:63-279. 3. Covitz W, Espeland M, Gallagher D, Hellenbrand W, Leff S, Talner N. The heart in sickle cell anemia. The Cooperative Study of Sickle Cell Disease (CSSCD). Chest. 1995; 108(5):1214-9. 4. Eddine AC, Alvarez O, Lipshultz SE, Kardon R, Arheart K, Swaminathan S. Ventricular structure and function in children with sickle cell disease using conventional and tissue Doppler echocardiography.Am J Cardiol.2012;109(9):1358-64. 5. Martins WA, Mesquita ET, Cunha DM, Ferrari AH, Pinheiro LAF, Filho LJ.et al. Alterações cardiovasculares na anemia falciforme. Arq Bras Cardiol.1998;70(5):365-70. 6. Cheitlin MD, Alpert JS, Armstrong WF, Aurigemma GP, Beller GA, Bierman FZ et al. ACC/AHA guidelines for the clinical application of echocardiography. A report of the American College of Cardiology/American Heart Association Task Force on Practice Guidelines (Committee on Clinical Application of Echocardiography). Developed in collaboration with the American Society of Echocardiography. Circulation. 1997;95(6):1686-744. 7. Nagueh SF, Appleton CP, Gillebert TC, Marino PN, Oh JK, Smiseth OA et al. Recommendations for the evaluation of left ventricular diastolic function by echocardiography. J Am Soc Echocardiogr. 2009;22(2):107-33. 8. Voskaridou E, Tsetsos G, Tsoutsias A, Spyropoulou E, Christoulas D, Terpos E. Pulmonary hypertension in patients with sickle cell/beta thalassemia: incidence and correlation with serum N-terminal pro-br92(6):738-43.ain natriuretic peptide concentrations. Haematologica. 2007;92(6):73-43. 9. Takatsuki S, Ivy DD, Nuss R. Correlation of N-terminal fragment of B-type natriuretic peptide levels with clinical, laboratory, and echocardiographic abnormalities in children with sickle cell disease. J Pediatr. 2012;160(3):428-33. 10. Aliyu ZY, Suleiman A, Attah E, Mamman AI, Babadoko A, Nouraie M et al. NT-proBNP as a marker of cardiopulmonary status in sickle cell anaemia in Africa. Br J Haematol.2010;150(1):102-7. Arq Bras Cardiol. 2015; 104(4):e30-e33 e33 Back to the Cover Viewpoint Correct Anatomical Orientation of the Heart and Reflections on the Nomenclature Used in Daily Practice Viviane Tiemi Hotta1,2 and Vera Demarchi Aiello1 Instituto do Coração/Faculdade de Medicina da Universidade de São Paulo1; Fleury Medicina e Saúde2, São Paulo, SP – Brazil In daily clinical practice and during the preparation of a scientific publication, it is important to use the appropriate nomenclature for an enhanced understanding of the descriptions provided. The correct use of anatomical terminology is the basis for universal communication in the field of health, and it is based on the Latin nomenclature originally published in 1895 (Basel Nomina Anatomica). In addition, it allows the standardization of reports, manuscripts, and scientific communication between different specialties and imaging techniques. The first Brazilian edition of the Anatomical Terminology was published in 2001 and was used as reference for this report. This study is the result of a joint effort of the Federative Committee on Anatomical Terminology (FCAT) and 56 associations composed of members of the International Federation of Associations of Anatomists (IFAA). The Brazilian edition was translated by the Anatomical Terminology Commission of the Brazilian Society of Anatomy1. With regard to cardiac nomenclature, some terms suggested by FCAT are not the most commonly used; therefore, terms incorporated by usage may be employed more frequently but do not necessarily represent the correct way to designate anatomical structures. In particular, some terms deserve special attention because of their frequency of use. In addition, some of the terms present in the Basel Nomina Anatomica have been questioned for not representing the appropriate description of the anatomical position or even the shape of the structure2-4. A term that is usually used imprecisely in cardiology refers to the heart valves: mitral, tricuspid, aortic, and pulmonary, often referred to as “valvules.” As a matter of fact, the components or functional units of the heart valves that are designated by the Terminology Commission as valvules, which are defined as “small valves.” This same committee has long attempted to modify the term cuspid—which is defined as apex, acute end, peak, vertex— by another term considered more appropriate: valvules or leaflets, which are the subdivisions of the atrioventricular valves. Anatomically, the FCAT considers that the description of the valve Keywords Terminology as Topic; Systematized Nomenclature of Medicine; Cardiology/classification. Mailing Address: Viviane Tiemi Hotta • Unidade Clínica de Miocardiopatias do InCor/FMUSP. Avenida Doutor Enéas Carvalho de Aguiar, 44. Postal Code 05403-000, São Paulo, SP – Brazil E-mail: viviane.hotta@grupofleury,com,br; [email protected] Manuscript received August 27, 2014; revised manuscript January 10, 2015; accepted January 12, 2015. DOI: 10.5935/abc.20150029 e34 shape as cusp or peak is not appropriate for the functional units (or valvules) of the atrioventricular valves1. In addition to the use of inappropriate terms with regard to the shape of the cardiac structures, another relevant concern is the failure to describe their location relative to the conventional anatomical position. In 2002, Cerqueira et al.5 published recommendations from the Cardiac Imaging Committee of the American Heart Association in an attempt to standardize the nomenclature of different cardiac imaging techniques, including nuclear medicine, magnetic resonance, computed tomography, echocardiography, and coronary angiography5. Despite the technical differences between these techniques, all of them aim to describe the heart and adjacent structures as accurately as possible. However, each of these techniques have evolved independently with respect to the description of cardiac orientation, number and classification of the myocardial segments, and distribution of coronary arteries, considering the inherent capabilities and limitations of each technique. Therefore, to facilitate communication and the correlation between the cardiac imaging techniques, the authors suggested that all techniques should guide and show the heart along its longitudinal axis, and the remaining planes should be oriented orthogonally with respect to the longitudinal axis of the heart. A simple Internet search (October 2014) indicates that this study has been cited in the literature more than 2000 times; therefore, it became an important reference in cardiovascular nomenclature. In this study, the authors—who belong to a committee of the American Heart Association that met specifically to discuss nomenclature—corrected a clear failure in the nomenclature of the inferior cardiac wall, formerly and incorrectly designated as “posterior.” However, they continued naming the wall opposite the inferior (diaphragmatic) wall as “anterior.” The simple observation of Figure 1, showing the heart on a CT scan, leaves no doubt that the wall opposite the inferior wall is located superiorly. In addition, Figure 1 shows that the anterior portion of the left ventricular wall is in fact the ventricular septum. This inconsistency should be taken into consideration by those who examine the heart in its natural position within the chest. A similar inconsistency is related to the current designation of the papillary muscles of the left ventricle. The group known as “anterior-lateral” is in fact located posteriorly in relation to the group usually designated as “posterior-medial” (Figure 1). In addition, in the anatomical position, the heart chambers designated “right” are in reality located superoranteriorly to the chambers referred to as “left” (Figure 1). This standard nomenclature facilitates the description of right-left shunts, or vice versa, but does not reflect the true anatomical position. Hotta & Aiello Correct Anatomical Orientation: Will We Adapt To It? Viewpoint Figure 1 – Left, schematic representation of the location of the heart in relation to its anatomical position within the thorax, showing the cardiac longitudinal axis (above). View of the heart when the cardiac longitudinal axis is positioned with the heart in the anatomical position (middle) and according to the vertical orientation used in the conventional nomenclature that is currently employed (below), considering the heart removed from the chest and resting on its apex. Right (above), computed tomography images showing the position of the heart in relation to the spinal cord and the sternum (A). B, CT scan image of the ventricular mass in short (transverse) axis at the level of the papillary muscles shows the anterior location of the “posterior-medial” muscle group (orange arrow) in relation to the “anterior-lateral” papillary muscle group. The location of the myocardial walls in relation to the anatomical position is evidenced (correlate with Table 1). A: anterior; H: head-cranial or superior; F: foot-caudal or inferior; RV: right ventricle; LV: left ventricle. In another example, the coronary artery known as the posterior descending artery is located on the diaphragmatic surface of the heart and has an interventricular and inferior trajectory (not descending and posterior)6,7. Its occlusion leads to an infarction designated by cardiologists as “infarction of the inferior wall,” despite the name of the coronary artery involved. The issue of the use of nomenclature considering the anatomical position of the heart has been treated with great attention and care by electrophysiologists to facilitate the teaching and understanding of the diagnostic and interventionist catheterization performed by doctors in training2. During the insertion of a catheter into the inferior vena cava towards the apex of Koch’s triangle, where the atrioventricular node is located, the direction of movement was, in a not too distant past, described as “anterior,” in view of the incorrect habit of describing the heart out of the chest and supported vertically on its apex. However, the apex of Koch’s triangle is located superiorly in relation to the vena cava orifice, when considering the anatomical position of the heart. These old habits of nomenclature can lead to errors in learning and even iatrogenic errors. Cosio et al.2 suggested a nomenclature of the cardiac walls taking into consideration the correct anatomical orientation of the heart (Table 1). Closing remarks This study does not intend to exhaust the subject nor recommend an immediate change in the current nomenclature. It aims to acknowledge and educate the reader about the frequent use of terms that are not completely adequate in describing the cardiac morphology evaluated with different imaging techniques. The nomenclature based on the correct anatomical orientation significantly facilitates the spatial location of the cardiac structures and the relationship of the heart with the other organs. It also allows the exchange and comparison of information between different imaging techniques and guides diagnostic and therapeutic procedures, e.g., in electrophysiology or multimodal examination. However, the adoption of changes in nomenclature already established by usage will require increased user awareness and recognition of the need for change and efforts towards the implementation and acceptance of these changes. Acknowledgments We thank Dr José Rodrigues Parga Filho for the cardiac computed tomographic images that illustrate this article. Arq Bras Cardiol. 2015; 104(4):e34-e36 e35 Hotta & Aiello Correct Anatomical Orientation: Will We Adapt To It? Viewpoint Author contributions Sources of Funding Conception and design of the research: Hotta VT, Aiello VD. Writing of the manuscript: Hotta VT, Aiello VD. Critical revision of the manuscript for intellectual content: Hotta VT, Aiello VD. Study Association Potential Conflict of Interest There were no external funding sources for this study. This study is not associated with any thesis or dissertation work. No potential conflict of interest relevant to this article was reported. Table 1 – Conventional nomenclature vs. nomenclature that considers the anatomical position Myocardial wall (Conventional nomenclature) Myocardial wall (Nomenclature that considers the anatomical position) 1. Inferior-septal Inferior-septal (maintained) 2. Anterior-septal Superior-septal 3. Anterior Superior 4. Anterior lateral Posterior superior 5. Inferior lateral or posterior Posterior inferior 6. Inferior Inferior (maintained) Source: Adapted from Cosío et al.2 References 1. Sociedade Brasileira de Anatomia. Terminologia anatômica. São Paulo: Ed. Manole Ltda.; 2001. 4. Message MA, Anderson RH. Towards a new terminology for clinical anatomy, with special reference to the heart. Clin Anat. 1996;9(5):317-29. 2. Cosío FG, Anderson RH, Kuck KH, Becker A, Borggrefe M, Campbell RW, et al. Living anatomy of the atrioventricular junctions. A guide to electrophysiologic mapping. A Consensus Statement from the Cardiac Nomenclature Study Group, Working Group of Arrhythmias, European Society of Cardiology, and the Task Force on Cardiac Nomenclature from NASPE. Circulation. 1999;100(5):e31-7. 5. Cerqueira MD, Weissman NJ, Dilsizian V, Jacobs AK, Kaul S, Laskey WK, et al. Standardized myocardial segmentation and nomenclature for tomographic imaging of the heart. A statement for healthcare professionals from the Cardiac Imaging Committee of the Council on Clinical Cardiology of the American Heart Association. Circulation. 2002;105(4):539-42. 3. Selvester RH. Nomina anatomica contradicta revisited: especially as it relates to cardiac imaging and electrocardiology. J Electrocardiol. 2008; 41(5):421-2. e36 Arq Bras Cardiol. 2015; 104(4):e34-e36 6. Anderson RH, Loukas M. The importance of attitudinally appropriate description of cardiac anatomy. Clin Anat. 2009; 22(1):47-51. 7. Cook AC, Anderson RH. Attitudinally correct nomenclature. Heart. 2002; 87(6):503-6. Back to the Cover Image Incremental Value Of 3D Transesophageal Echocardiography for The Assessment of Mitral Valve Prolapse Viviane Tiemi Hotta1,2, Mirian Magalhães Pardi1,2, Valdir Ambrósio Moisés1,3 Fleury Medicina e Saúde1; Instituto do Coração da Faculdade Medicina da Universidade de São Paulo (USP)2, São Paulo, SP; Escola Paulista de Medicina, Universidade Federal de São Paulo (Unifesp)3, São Paulo, SP – Brazil A 90-year-old asymptomatic patient with atrial fibrillation underwent a transesophageal echocardiography (TEE) for the assessment of thrombus. The TEE examination evidenced mitral valve anterior leaflet prolapse with moderate to severe eccentric regurgitation. Three-dimensional (3D)-TEE was performed and showed chordal rupture (A2) related to the anterior scallop of the mitral valve (Figure 1 e video 1). In this case, 3D-TEE provided additional anatomical information regarding the mitral valve, allowing the diagnosis of flail leaflet and chordal rupture, not assessed by the 2D evaluation. B A LA LA RA RV LV LV C LA D LA AO RV LV LV E F Figure 1 – 2D-TEE, four-chamber view showing mitral valve prolapse at 0° (A) e 34° (B) rotation of imaging array. C and D. 2D TEE color flow mapping evidencing eccentric mitral regurgitation, directed posteriorly at 0° (C) and 138° (D) rotation of imaging array. E and F. 3D-TEE images showing the mitral valve prolapse of the anterior leaflet (A2) (E, arrow), in a surgical view (from the left atrium, LA) and chordal rupture (F, arrow). TEE: transesophageal echocardiography; RA: right atrium; RV: right ventricule; LV: left ventricule; AO: aorta. Keywords Echocardiography, Transesophageal / utilization; Echocardiography, Three Dimensional / utilization; Mitral Valve Prolapse. Mailing Address: Viviane Tiemi Hotta • Unidade Clínica de Miocardiopatias do InCor/FMUSP. Avenida Doutor Enéas Carvalho de Aguiar, 44. São Paulo, Postal Code 05403-000. São Paulo, SP - Brazil. E-mail: [email protected], [email protected] Manuscript received September 1, 2014; revised manuscript Sptember 8, 2014; accepted September 8, 2014. DOI: 10.5935/abc.20140200 37 Hotta et al. Incremental Value Obtained By 3D-TE For Mitral Prolapse Image Video 1 – Additional Supporting Information: Real time 3D TEE cine loops evidence chordal rupture (A2) associated with mitral valve prolapse. Arq Bras Cardiol. 2015; 104(4):e37-e38 38
Download