Anais XVII Simpósio Brasileiro de Sensoriamento Remoto - SBSR, João Pessoa-PB, Brasil, 25 a 29 de abril de 2015, INPE
Spectral signature of Diatraea saccharalis attack in sugarcane using Landsat 8
image and in-situ data.
1
1
2
Fabio Veiga de Camargo , Marcelo de Carvalho Alves , Marcio Goussain , Jair Campos
Moraes3, Rita de Cássia Santos Goussain4
1
Departamento de Engenharia - Universidade Federal de Lavras (UFLA) Caixa Postal
3037 – 3720-000 – Lavras – MG – Brazil{fabio, marcelo} [email protected] &
[email protected]
2
Assist consultoria e experimentação agronômica - Campo Verde - MT - Brazil
[email protected]
3
Departamento de Entomologia - Universidade Federal de Lavras (UFLA) - Lavras, MG,
Brazil. [email protected]
4Instituto
Federal de Mato Grosso (IFTM) - São Vicente, MT, Brazil
[email protected]
Abstract
The sugarcane crop production and processing represents a large part of Brazilian agricultural business. The
objective of this work was to evaluate the spatial signature of sugarcane damaged by different incidences of
sugarcane borer using Landsat 8 images and in-situ data collection. The experiment was carried out at Vista
Alegre do Alto, SP, Brazil in March of 2014. The Atmospheric Topographic Correction for Satellite
Imagery was used to perform atmospheric corrections of the images and calculate meteorological indices.
The sugarcane borer infestation was quantified in five georeferenced points and compared with the
reflectance in the bands 2, 4 and 10 and also ground albedo, latent heat and net radiation. Based on
summary statistics and regression analyses, there was increased correspondence between borer infestation
and meteorological indices. The points with lower borer infestation, presented lower reflectance in band 2
and 4 , medium wavelengths 0.483 and 0.655μm respectively and lower surface temperature and ground
albedo. Nevertheless latent heat and net radiation were higher in points with less borer infestation. Probably,
the sugarcane borer larvae consumed plant tissue, diminishing the amount of water and nutrients
translocated in the plant. For that reason, the evapotranspiration was lower in points with higher borer
infestation.
Keywords: Saccharum officinarum, remote sensing, heat flux, ground albedo, reflectance signature.
1. Introduction
The sugarcane (Saccharum officinarum L.) crop is highly important in Brazil due to
alcohol and sugar production. Monitoring diseases and pests may contribute to the
definition of strategies and tactics to the integrated pest management in sugarcane
production system. The sugarcane borer, Diatraea saccharalis, is native in the western
hemisphere and causes indirect damage to plant population density. The borer opens a
gallery and is a vector of fungi stalk rot, Colletotrichum falcatum. This microorganism
uses the sacarose for its metabolism, therefore stand density decreases between 16% till
32%, with a reduction of sugar production up to 2.5 metric tonnes per hectare Ogunwolu
et al. (1991). There are a few problems over different life stage of the plant and the insect.
The cycle begins with eggs being deposited on both the lower and upper surface of the
4322
Anais XVII Simpósio Brasileiro de Sensoriamento Remoto - SBSR, João Pessoa-PB, Brasil, 25 a 29 de abril de 2015, INPE
leaves. The egg stage last 4 to 6 days. Than the larvae tend to gather in the whorl to drill
into the stalks. This stage takes 25 to 30 days to develop the pupa. Pupation takes place
inside the plant, leaving a thin layer of plant tissue for the adult insect crack at emergence,
during 8 to 9 days. The adults are nocturnal and oviposition starts at dusk and lasts
throughout the evening for up to 8 days. In mature plants, the borer debilitates or kills the
tops. For young plants, the internal whorl kills the leaves causing the condition known as
“dead hearth”. There are two problems of damage by tunneling inside the stalk. The first,
affects the purity and amount of nectar that can be extracted and the borers can lower the
sucrose yield from 10% to 20%. The second, makes the plant susceptible to secondary
invaders like bacterial, viral disease and fungi to enter and increase the damage Capinera,
(2011).
Remote sensing data has a large potential for monitoring crop production due to the
periodicity of the satellites. This information can be used to alert the farmer about pest
infestation before the threshold point, in order to assist the farmer in the decision making
process. In February 2013, Landsat 8 was launched and it can generate images in the
Spectral bands of 1, 2, 3, 4 (visible), 5 (NIR), 6, 7, 9 (SWIR) with resolution of 30 meters.
Panchromatic band 8 has a resolution of 15 meters and Thermal Infrared Bands 10 and 11
(TIR) have a resolution of 100 meters. The satellite orbits the Earth at an altitude of 705
km in a polar orbit and provides global coverage in 16 days after returning to the first
location Loveland and Dwyer (2012).
2. Materials & Methods
2.1 Study area
The experiment was located in Vista Alegre do Alto, coordinates . This south central
region is well known for sugarcane planting and processing in Sao Paulo state, which is
the largest producer of sugarcane in Brazil, with 5,303,342 hectares in 2010/2011 Rudorff
et al. (2010). The area has the sugarcane variety RB 86-7515 in the fourth month of
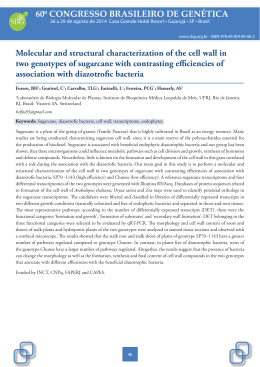
development, in a total area of 10,13 ha. The studied had 5 geo-referenced points (Figure
1) fairly spaced between each other and removed from the road, in order to diminish the
interference of the surrounding areas in the pixel image. The infestation of sugarcane
borer was quantified in 10 meter lines, counting the number of insect larvae inside the
plants.
2.2 Satellite images
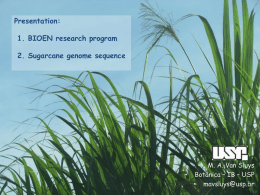
Landsat 8 OLI / TIRS images were selected to evaluate the spectral signature of
sugarcane and the infestation of sugarcane borer (Diatraea saccharalis). The spectral
signature of all the points shows the peaks of lower and higher reflections [Figure 2]. This
study compared the bands 2, 4 and 10 versus infestation of sugarcane borer and these
band were chosen because the optimum wavelengths for chlorophyll A functioning is 0.43
and 0.66 µm. For chlorophyll B, the values are 0.45 and 0.64 µm. The Glovis scene ID
LC82200732014094LGN00, from 4th April 2014, NASA (2014) was acquired and then
processed with Atmospheric / Topographic Correction for Satellite Imagery (ATCOR)
methodology to estimate several vegetation and energy balance indices that assist in
4323
Anais XVII Simpósio Brasileiro de Sensoriamento Remoto - SBSR, João Pessoa-PB, Brasil, 25 a 29 de abril de 2015, INPE
characterization of the earth surface. The surface energy balance or net radiant energy Rn,
can be obtained by sum of the following heat fluxes: ground albedo, sensible heat flux
and latent heat. The quantity of energy employed in photosynthesis is minimum, hence it
is ignored here. The ground albedo covers 10% to 50% of net radiation and it is obtained
using the green, red, and near-infrared wavelength. The sensible flux can cool or warm
the surface and it is conditioned on the difference of air and surface temperature. The
latent heat measures the energy available to evaporate water from the surface,
evapotranspiration Richter and Schläpfer (2014). The reflected energy versus sugarcane
borer infestation for ground albedo, latent heat and net radiation were the analyzed heat
fluxes.
3. Results and Discussion
The sugarcane borer was found in different quantities along the experimental area. The
Reflectance signature presented distinct patters of reflectance in each band, according to
the borer infestation. The increase in sugarcane borer infestation directly influences the
reflectance, which also augmented with the infestation. The data show a small variation in
the band 2, minimum and maximum value 3.30% and 3.73%. Nevertheless bands 4 and
10 had a reasonable variance with variations from 4.79% - 5.74% in band 4 and 31.5o 32.50o Celsius in band 10 [Figure 3].
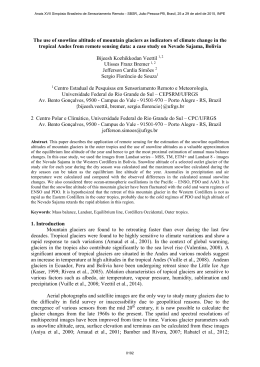
According to Alves (2012), in Brazil’s Mato Grosso state, the damaged caused on maize
by nematodes and dark sword-grass had a divergent spatial signature with peaks of higher
reflectance within the middle wavelengths of the bands 1, 3 and 4. The regression
analyses of the data indicated correlation between reflectance and sugarcane borer
infestation. In the band 2, the r-squared value R2 = 0.839, showing high correlation
between infestation and reflectance. The band 2 spectrum is similar to the chlorophyll B
absorption, consequently the reflectance will be higher in plants with less chlorophyll.
There was an ascendant linear trend line, which describe the strong correlation between
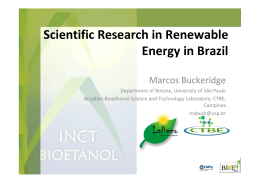
the points [Figure 4.a]. The band 4 spectrum covered the peak of absorption by
chlorophyll A and B. Healthier plants are associated with a lower reflectance once most of
the radiation is absorbed. The occurrence of sugarcane borer and reflectance had an
elevated, with R2 = 0.957, evidenced by the linear trend line [Figure 4.b]. The thermal
band 10 suffered influence by the vegetation density, because the areas with less vigorous
vegetation absorbed less heat, making the reflectance higher. A linear trend line shows the
link among the plants sanity and heat flux, R2 = 0.951 [Figure 4. c].
The heat flux was directly influenced by the presence of sugarcane borer. The ground
albedo had a decreasing value along the infestation level, with R2 = 0.802, the linear trend
line indicates connection between infestation and ground albedo [Figure 4.d]. This pest
damages plant tissue, which led to a decrease in heat absorption. The ground albedo
represents the heat variation on the surface. A healthy canopy maintained an expressive
part of the heat and released it slowly, whereas bare soil retained less and lost heat
quickly. The latent heat was higher for healthier plants, decaying along the infestation
(Figure 4.e), R2 = 0.982. The sugarcane borer larvae consumed plant tissue, that
diminishing the amount of water trans-located inside the plant. For that reason the
4324
Anais XVII Simpósio Brasileiro de Sensoriamento Remoto - SBSR, João Pessoa-PB, Brasil, 25 a 29 de abril de 2015, INPE
evapotranspiration was lower in the points with higher borer infestation. The
evapotranspiration is the latent heat flux. The water flux from the surface to the
atmosphere come by soil evaporation and plants evapotranspiration, which happens by
leaf stomata transpiration, where most of the water absorbed is lost by transpiration. There
are several factors influencing the evapotranspiration, such as vegetation development
stage, management, plant architecture, cultivation practices, ground cover, canopy
characteristics, insect damage and diseases Teixeira (2010). The net radiation, Rn, was
higher for healthier plant, declining with the infestation [Figure 4. f], R2 = 0.952. The Rn
available is determined by shortwave radiation, which causes air and surface temperature
changes. The Rn is the radioactive energy available at the surface that influences
biological and physical processes. The Rn may be positive or negative. A negative Rn
means fluxes of energy from the surface and a positive Rn indicates energy flux to the
surface Lima et al (2012).
4. Conclusion
The monitoring of agricultural zones using satellites gives a new perspective of the plants
and pests biology. Considering that there is a great demand for agricultural remote sensing
products, there are several issues of interest. We addressed in this paper some new
knowledge about the spectral signature of borer attack in sugarcane and heat fluxes of
sugarcane with incidences of sugarcane borer using Landsat 8 and field data. The
performance of bands 2, 4 and 10 and also ground albedo, latent heat and net radiation
were evaluated for detecting pest damage. Further studies are necessary to fully
understand the co-relation among sugarcane borer infestation and the reflectance in the
spectral bands.
Acknowledgements
To the Brazilian Conselho Nacional de Pesquisa, CNPq, for the financial support.
4325
Anais XVII Simpósio Brasileiro de Sensoriamento Remoto - SBSR, João Pessoa-PB, Brasil, 25 a 29 de abril de 2015, INPE
!
Sugarcane borer infestation
3
4
6
8
0
150m
Figure 1. Location of the georreferenced points. Google
earth image - 2014 CNES / Astrium.
!
Figure 2. Reflectance signature of the 5 georreferenced points in wavelength
0.443µm till 10.90 µm.
4326
Anais XVII Simpósio Brasileiro de Sensoriamento Remoto - SBSR, João Pessoa-PB, Brasil, 25 a 29 de abril de 2015, INPE
!Band
Resolution
Wavelenght
1!
2!
3!
4!
5!
9!
6!
30m!
30m!
30m!
30m!
30m!
30m!
30m!
0.443
µm
0.483
µm
0.563
µm
0.655
µm
0.865
µm
1.375
µm
1.610
µm
7!
10!
30m! 100m
2.2
µm
10.9
µm
Minimum
4.38!
3.39!
6.54!
4.79! 41.81! 27.13! 20.00!
Mean
4.56!
3.50!
6.84!
5.25! 43.03! 28.06! 21.13! 10.29! 31.89!
Maximum
4.81!
3.73!
7.20!
5.74! 44.75! 29.13! 22.30! 11.58! 32.50!
Stdeviation
0.20!
0.19!
0.31!
0.37!
1.25!
0.98!
0.95!
9.35! 31.50!
0.85!
0.39!
!Table 1. Characteristic of Landsat 8, bands 1, 2, 3, 4, 5, 9, 6, 7 and 10, pixel resolution and
medium wavelength. Descriptive statistics, minimum, mean, maximum maximum and standard
deviation for 5 georrefenced points.
y = 17.875x + 43.56
2
R = 0.957
y = 8.75x + 305.85
R2 = 0.839
!
!
4.d
Ground Albedo[(%]
20
19
!
y = -3.625x + 245.13
R2 = 0.982
y = 0.275x + 17.10
2
R = 0.802
y = 1.925x + 30.93
R2 = 0.951
y = -2.875x + 383.18
R2 = 0.952
19
18
18
0
!
2
4
6
8
10
!
!
Figure 4. Infestation of Diatrea saccharalis vs band 2 reflectance (a), band 4 reflectance (b),
band 10 temperature ºC (c), ground albedo (d), latent heat (e), net radiation (f). Linear trend
line with the equation and coefficient of determination (R2).
4327
Anais XVII Simpósio Brasileiro de Sensoriamento Remoto - SBSR, João Pessoa-PB, Brasil, 25 a 29 de abril de 2015, INPE
5. References
5.1 Periodic Journal
Almeida, T. I. R.; Souza, C. R. D. F.; Rosseto, R. 2006. ASTER and Landsat ETM + images applied to sugarcane
yield forecast. International Journal of Remote Sensing. Vol 27: 4057–4069.
ALVES, M. C. 2012. Signature of Pest-Organisms in Mato Grosso Agroecosystems Using WorldView-2 Imagery.
White Paper, Intergraph Erdas.
Capinera, J. L. 2007. Sugarcane borer, Diatraea saccharalis (Fabricius) (lnsecta: Lepidoptera: Pyralidae).
Gainesville: University of Florida; Institute of Food and Agricultural Sciences.
Lima, E. P.; Sediyama g.c.; Silva B. B.; Gleriani J. M.; Soares V. P. 2012. Seasonality of net radiation in two subbasins of Paracatu by the use of MODIS Sensor products. Eng. Agríc., 32: 1184-1196.
Loveland, T.; Dwyer, J. 2012. The Landsat Program: Current Status and Future Plans. Sentinel - 2 Preparatory
Symposium Abstract book.
Loyd, C. 2014. Putting Landsat 8’s Bands to Work. https://www.mapbox.com/blog/putting-landsat-8-bands-towork/ . Accessed 10th August 2014.
NASA Landsat 8 program, 2014, Landsat ETM+ L1T scene LC82200732014094LGN00, 4th April 2014, USGS,
Vista Alegre do Alto, 4/4/2014.
Richter, R.; Schläpfer, D. 2014. ATCOR-2/3 User Guide, Version 8.3.1 Accessed 20th August 2014.
Teixeira, A. H. C. 2010. Determining Regional Actual Evapotranspiration of Irrigated Crops and Natural
Vegetation in the São Francisco River Basin (Brazil) Using Remote Sensing and Penman-Monteith Equation.
Remote Sensing 2010, 2, 1287-1319.
Rudorff, B. F. T.; Sugawara, L. M.; Aguiar, D. A.; Aulicino T. L. I. N.; Silva, W. F. 2011. Uso de imagens de
satelites de sensoriamento remoto para mapear a área cultivada com cana-de-açucar no estado de São Paulo Safra 2010/11. São José dos Campo: INPE.
Ogunwolu, E. O.; Reagan, T. E.; Flynn, J. L.; Hensley, S. D. 1991. Effects of Diatraea saccharalis (F.)
(Lepidoptera: Pyralidae) damage and stalk rot fungi on sugar- cane yield in Louisiana. Crop Protection. Vol 10:
57-61.
4328
Download