UNIVERSIDADE FEDERAL DE PERNAMBUCO
PROGRAMA DE PÓS-GRADUAÇÃO EM ENGENHARIA DE PRODUÇÃO
NEW TAXONOMY AND MODEL OF ERROR SEQUENCE PROCESS
FOR HUMAN ERROR ASSESSEMENT IN HYDROELECTRIC POWER
SYSTEMS
A thesis presented to the Universidade
Federal de Pernambuco in partial fulfillment
of the requirements for the degree of Doutor
by
RÔMULO FERNANDO TEIXEIRA VILELA
Advisor: Enrique López Droguett, Ph.D.
RECIFE, february 2013
i
Catalogação na fonte
Bibliotecária: Rosineide Mesquita Gonçalves Luz / CRB4-1361 (BCTG)
V699n
Vilela, Rômulo Fernando Teixeira.
New Taxonomy and model of error sequence process for human error
assessement in hydroelectric power systems / Rômulo Fernando Teixeira
Vilela. – Recife: O Autor, 2013.
x, 190f., il., figs., gráfs., tabs.
Orientador: Prof. Enrique López Droguett, Ph.D.
Tese (Doutorado) – Universidade Federal de Pernambuco.
CTG. Programa de Pós-Graduação em Engenharia de Produção, 2013.
Inclui Referências Bibliográficas e Anexos.
1. Engenharia de Produção. 2. Human error. 3. Human Reliability
Analysis (HRA). 4. Taxonomy. 5. Electric Power System. 6. Bayesian
Networks. 7. Performance. 8. Shaped Factrs (PSFs). 9. Expert opinion. II.
Droguett, Enrique López (Orientador). II. Título.
658.5 CDD (22.ed)
UFPE/BCTG-2013 / 087
ii
UNIVERSIDADE FEDERAL DE PERNAMBUCO
PROGRAMA DE PÓS-GRADUAÇÃO EM ENGENHARIA DE PRODUÇÃO
PARECER DA COMISSÃO EXAMINADORA
DE DEFESA DE TESE DE
DOUTORADO DE
RÔMULO FERNANDO TEIXEIRA VILELA
“NEW TAXONOMY AND MODEL OF ERROR SEQUENCE PROCESS FOR HUMAN
ERROR ASSESSEMENT IN HYDROELECTRIC POWER SYSTEMS”
ÁREA DE CONCENTRAÇÃO: PESQUISA OPERACIONAL
A comissão examinadora, composta pelos professores abaixo, sob a presidência do(a)
primeiro(a), considera o candidato RÔMULO FERNANDO TEIXEIRA VILELA,
APROVADO.
Recife, 27 de fevereiro de 2013.
_________________________________________
Prof. ENRIQUE ANDRÉS LÓPEZ DROGUETT, PhD (UFPE)
________________________________________
Prof. FERNANDO MENEZES CAMPELLO DE SOUZA, PhD (UFPE)
_________________________________________
Prof. CRISTIANO ALEXANDRE VIRGINIO CAVALCANTI, Doutor (UFPE)
_________________________________________
Prof. PAULO FERNANDO FERREIRA FRUTUOSO E MELO, Doutor (COPPE/UFRJ)
_________________________________________
Prof. MARCELO RAMOS MARTINS, Doutor (USP)
iii
DEDICATION
To my father Jorge Vilela and my mother Gerusa Vilela (in memorian);
To my family Carol, Rodrigo, Rômulo Fernando and Polyana;
To my advisor and fellows from CEERMA;
To my co-advisors Marcelo Martins and Paulo Frutuoso;
To all who helped me in CHESF.
iv
ABSTRACT
With advances in hardware reliability engineering in the last 30 years, we have seen
equipment and complex systems with very low levels of failure. Complex systems in the
nuclear industry, aerospatiale sector, chemical industries, electrical industries and others now
have equipment and systems with levels of reliability that has adequately served the society.
However, the operation and maintenance of these systems do not rely solely on intrinsec
performance of the corresponding equipment, but they also depend on human action. Major
accidents in the recent past such Chernobyl, Bhopal, the Challenger shuttle and major recent
power blackouts in Brazil, highlighted the need to reduce human error in complex systems.
The human reliability assessment emerges as a support to the analisys of the operation and
maintenance of these type of systems. Since the late 80th some advances have emerged in the
study of human reliability. Techniques such as THERP, ATHEANA, CREAM and IDAC,
have been consolidated over time for the study, measure and prediction of human error.
However performance shaped factors used in almost all the aforementioned techniques have
proven difficult to be estimated from a practical standpoint. In addition, the specifics of the
Hydroelectric Power Industry defined in the Grid Procedures of the National System Operator
(Operador Nacional so Sistema, ONS) and the regulatory instruments of ANEEL (Agencia
Nacional de Energia Eletrica) Regulatory Agency have led to the necessity of a taxonomy that
can adapt for this important strategic sector. In this thesis, it is proposed a taxonomy and
model of error sequence process for assessment of human error specifically designed to meet
the context of operation and maintenance of Hydroelectric Power System. To illustrate the
new taxonomy it was collected and analyzed data from about ten years of human error records
related to the generation and transmission of Hydroelectric Power Company in Brazil. It was
collected 605 reports by human error shutdown from 1998 to 2009. A BBN-Base
methodology for the quantification of human error is also discusses. The taxonomy, model for
error sequence process as well as the BBN-Based model are illustrated via an example of
application in the context of the Brazilian Hydroelectric Power Industry.
Keywords: Human error; Human Reliability Analysis (HRA); taxonomy; Electric Power
System; Bayesian networks; Performance; Shaped Factors (PSFs), expert opinion.
v
RESUMO
Com os avanços em hardware, a engenharia de confiabilidade nos últimos 30 anos, tem nos
mostrado equipamentos e sistemas complexos com níveis de falha muito baixos. Sistemas
complexos na indústria nuclear, aeroespacial, química, elétrica entre outras possuem hoje em
dia equipamentos e sistemas com níveis de confiabilidade que tem atendido adequadamente a
sociedade. Entretanto, a operação e manutenção destes sistemas não dependem
exclusivamente do desempenho intrínseco dos correspondentes equipamentos, dependem
também da ação humana. Grandes acidentes no passado recente como Chernobyl, Bhopal, da
nave Challenger e os grandes apagões no Brasil, colocaram em evidência a necessidade de
redução do erro humano em sistemas complexos. A análise da confiabilidade humana surge
assim como um apoio para a análise destes sistemas de operação e manutenção. Desde a
década de 80 alguns avanços foram surgindo no estudo da confiabilidade humana. Técnicas
como THERP, ATHEANA, CREAM e IDAC, se consolidaram ao longo do tempo como boas
aplicações práticas para estudar, medir e prever o erro humano. Porém os fatores de
desempenho utilizados em quase todas as técnicas supracitadas, tem se mostrado difíceis de
serem estimados de um ponto de vista particular. Além disso, as particularidades do setor
Hidroelétrico de Potência, definidas nos Procedimentos de Rede do Operador Nacional do
Sistema (ONS) e nos instrumentos normativos da Agencia Reguladora ANEEL têm levado a
necessidade de uma taxonomia que possa se adaptar a este importante e estratégico setor.
Nesta tese, é proposta uma taxonomia e um modelo da sequência do processo de erro, para
avaliação deste erro humano especificamente concebido para atender ao contexto de operação
e manutencão do Sistema Hidroelétrico de Potência. Para ilustrar a nova taxonomia, foram
coletados e analisados dados de cerca de dez anos de registro de erro humano de uma empresa
de geração e transmissão de energia elétrica brasileira.
Foram coletados 605 relatórios de
desligamento por erro humano desde 1998 até 2009. Uma metodologia BBN-Base para a
quantificação do erro humano é também discutida. A taxonomia e o modelo da sequência do
processo de erro humano tanto quanto o modelo BBN-Based são ilustrados via um exemplo
de uma aplicação no contexto de uma indústria Brasileira Hidroelétrica de Potência.
Palavras-chave: Erro humano; Análise de Confiabilidade Humana (HRA); Taxonomia;
Sistema Elétrico de Potência; Redes Bayesianas; Fatores de desempenho (PSFs); Opinião de
especialistas.
vi
LIST OF FIGURES
Figure 1. Categories of human errors _______________________________________
11
Figure 2. Stress level effect on human error rate_______________________________
14
Figure 3. The ATHEANA Method_________________________________________
23
Figure 4. Improved x Reduced reliability______________________________________ 25
Figure 5. IDAC perspective of viewing system and operating crew as an integrated system
______________________________________________________________ 27
Figure 6. An overview of the performance influencing factors influencing an individual
worker behavior and their dependencies, and the interaction of an individual
worker interact with the surrounding
objects_________________________________________________________ 28
Figure 7. The Hierarchical structure of human behavior influencing factors, and their
paths of influencing_______________________________________________30
Figure 8. IDAC methodology_______________________________________________ 31
Figure 9. Flowchart of methodology__________________________________________ 34
Figure 10. The poposed taxonomy____________________________________________ 48
Figure 11.Taxonomy example 1______________________________________________ 52
Figure 12.Taxonomy example 2______________________________________________ 53
Figure 13. Error sequence process____________________________________________ 53
Figure 14. The paths of human error___________________________________________ 54
Figure 15. Sequence of error process example 1_________________________________ 56
Figure 16. Sequence of error process example 2__________________________________57
Figure 17. Sequence of error process example 3__________________________________58
Figure 18. Sequence of error process example 4__________________________________59
Figure 19. Human error____________________________________________________ 62
Figure 20. Human error with load interrupted___________________________________ 63
Figure 21. Human error annual seasonality_____________________________________ 63
Figure 22. Elementary behavior annual seasonality_______________________________ 64
Figure 23. Error type annual seasonality_______________________________________ 65
Figure 24. Domain annual seasonality_________________________________________ 65
Figure 25. Error domain____________________________________________________ 66
Figure 26. Error type_______________________________________________________66
Figure 27. Berliner process_________________________________________________ 67
Figure 28. Elementary behavior______________________________________________ 67
vii
Figure 29. Failure mode____________________________________________________ 68
Figure 30. Action deficiencies X Elementary behavior____________________________ 70
Figure 31. Biased review X Elementary behavior________________________________ 70
Figure 32. Confirmation bias X Elementary behavior_____________________________ 74
Figure 33. Sings, countersigns and non sings X Elementary behavior________________ 71
Figure 34. Encoding deficiencies X Elementary behavior__________________________ 71
Figure 35. First exceptions X Elementary behavior_______________________________ 72
Figure 36. General rule X Elementary behavior_________________________________ 72
Figure 37. Information overload X Elementary behavior__________________________ 73
Figure 38. Inversions X Elementary behavior___________________________________ 73
Figure 39. Omission X Elementary behavior___________________________________ 74
Figure 40. Omission following interruptions X Elementary behavior________________ 74
Figure 41. Overconfidence X Elementary behavior_______________________________75
Figure 42. Perceptual confusion X Elementary behavior__________________________ 75
Figure 43. Rigidity X Elementary behavior____________________________________ 76
Figure 44. Rule strength X Elementary behavior________________________________ 76
Figure 45. Action deficiencies X Berliner process________________________________77
Figure 46. Biased reviewing X Berliner process_________________________________ 77
Figure 47. Confirmation bias X Berliner process________________________________ 78
Figure 48. Sings, countersigns and non sings X Berliner process____________________ 78
Figure 49. Encoding deficiencies X Berliner process_____________________________ 79
Figure 50. First exceptions X Berliner process__________________________________ 79
Figure 51. General rule X Berliner process_____________________________________ 80
Figure 52. Information overload X Berliner process_____________________________ 80
Figure 53. Inversions X Berliner process______________________________________ 81
Figure 54. Omission X Berliner process______________________________________ 81
Figure 55. Omission following interruption X Berliner process____________________ 82
Figure 56. Overconfidence X Berliner process_________________________________ 82
Figure 57. Perceptual confusions X Berliner process____________________________ 83
Figure 58. Rigidity X Berliner process_______________________________________ 83
Figure 59. Rule strength X Berliner process___________________________________ 84
Figure 60. Lapse X Elementary behavior_____________________________________ 85
Figure 61. Mistake X Elementary process____________________________________ 85
Figure 62. Slip X Elementary process_______________________________________ 86
Figure 63. Lapse X Berliner process_________________________________________ 86
viii
Figure 64. Mistake X Berliner process_______________________________________ 87
Figure 65. Slip X Berliner process__________________________________________ 87
Figure 66. Knowledge X Elementary behavior_________________________________ 88
Figure 67. Rule X Elementary behavior______________________________________ 89
Figure 68. Skill X Elementary behavior______________________________________ 89
Figure 69. Knowledge X Elementary behavior________________________________ 90
Figure 70. Rule X Berliner process__________________________________________ 90
Figure 71. Skill X Berliner process__________________________________________91
Figure 72. Register Database _______________________________________________93
Figure 73. Sequence of error process RDFH GRP-04/04__________________________95
Figure 74. Sequence of error process RDFH GRP-04/06 _________________________96
Figure 75. Sequence of error process RDFH GRL-06/99 _________________________97
Figure 76. Sequence of error process RDFH GRS-04/07 ________________________ 99
Figure 77. Sequence of error process RDFH GRO-02/09 ________________________100
Figure 78. Sequence of error process RDFH STC-01/05 _________________________102
Figure 79. Sequence of error process RDFH GRL-05/03 _________________________103
Figure 80. Bayesian network for the problem of excessive workload________________107
Figure 81. Serial conection_________________________________________________108
Figure 82. Conection type common cause_____________________________________108
Figure 83. Conection type common effect_____________________________________109
Figure 84. Inclusion of a subjective evidence in Bayesian network of figure 15_______ 111
Figure 85. Bayesian network of task_________________________________________ 115
Figure 86. Bayesian network of the error_____________________________________ 116
Figure 87. Sequence of error process RDFH n.083 _____________________________ 124
Figure 88. Bayesian network for Toy Model ___________________________________125
Figure 89. E & P Office 3 __________________________________________________128
Figure 90. Simulation – Failure Mode _______________________________________ 129
Figure 91. Simulation – Elementary Behavior __________________________________130
Figure 92. Simulation with Evidence _________________________________________135
ix
LIST OF TABLES
Table 01. Common question about the operator’s performance___________________________ 13
Table 02. Cognitive activities and cognitive functions____________________________
26
Table 03. Human Error taxonomy by Rasmussen/Reason__________________________ 38
Table 04. Common Performance Conditions____________________________________ 43
Table 05. Berliner Taxonomy________________________________________________ 45
Table 06. Number of Human Errors x Year_____________________________________ 49
Table 07. Register Database 1 ________________________________________________95
Table 08. Register Database 2 ________________________________________________96
Table 09. Register Database 3 ________________________________________________98
Table 10. Register Database 4 ________________________________________________99
Table 11. Register Database 5 _______________________________________________101
Table 12. Register Database 6 _______________________________________________102
Table 13. Register Database 7 _______________________________________________104
Table 14. Joint probabilities related to the problem of excessive workload_____________110
Table 15. Posterior probabilities for the problem of excessive workload_______________110
Table 16. Values assumed by variables________________________________________116
Table 17. CTP X1_________________________________________________________118
Table 18. CTP X2_________________________________________________________119
Table 19. CTP X3_________________________________________________________119
Table 20. CTP X4<9______________________________________________________ 120
Table 21. CTP 8<X4<18___________________________________________________ 121
Table 22. CTP X4>17_____________________________________________________ 122
Table 23. Berliner Process _________________________________________________ 125
Table 24. Domain _______________________________________________________ 126
Table 25. CTP Elementary Behavior _________________________________________126
Table 26. CTP – Failure Mode ______________________________________________127
x
LIST OF ACRONYMS
ANEEL – Agência Nacional de Energia Elétrica
ATHEANA – A Thecnique for Human Error Analysis
BN – Bayesian Network
CREAM – Cognitive Reliability and Error Analysis Method
CTP – Conditional Probabilities Table
GEMS – Generic Error Modeling System
HE – Human Error
HEP – Human Error Probability
HET – Human Error Taxonomy
HFE – Human Failure Event
HRA -Human Reliability Analysis
HTA – Hierarchical Task Analysis
IDAC - Information Perception, Diagnosis and Decision Making, and Action Taking in Crew
Perspective
MW – Mega Watt
ONS – Operador Nacional do Sistema
PRA – Probabilistic Risk Analysis
PSA – Probabilistic Safety Analysis
PSF – Performance Shaped Factors
RDFH – Human Error Shutdown Report (Relatório de desligamento por falha humana)
SRK – Skill-Rule-Knowledge
THERP – Technique for Human Error Rate Prediction
xi
SUMMARY
1. INTRODUCTION
1.1 OVERVIEW______________________________________________________1
1.2 MOTIVATION AND JUSTIFICATIONS_______________________________2
1.3 OBJECTIVES_____________________________________________________3
1.3.1 GENERAL OBJECTIVE_______________________________________ 3
1.3.2 SPECIFIC OBJECTIVE_______________________________________ 3
1.3.3 THESIS LAYOUT____________________________________________ 4
2. HYDROELECTRIC POWER SYSTEM______________________________________ 5
3. HUMAN ERROR OVERVIEW_____________________________________________ 10
3.1 HUMAN ERROR_________________________________________________ 10
3.2 HUMAN RELIABILITY__________________________________________ 14
3.3 HUMAN ERROR TAXONOMY____________________________________ 36
4. NEW TAXONOMY AND MODEL OF ERROR SEQUENCE PROCESS FOR HUMAN
ERROR ASSESSEMENT__________________________________________________ 45
4.1 NEW TAXONOMY_______________________________________________45
4.1.1 HOW HUMAN ERROR DATA WERE COLLECTED_______________48
4.1.2 HOW TO PERFORM THE PROPOSED TAXONOMY______________50
4.2 MODEL OF ERROR SEQUENCE PROCESS_________________________ 53
4.2.1HOW TO PERFORM THE PROPOSED MODEL__________________ 55
5. DESCRIPTIVE STATISTICS USING THE NEW TAXONOMY __________________61
6. ASSESSEMENT OF HUMAN ERROR USING THE NEW TAXONOMY AND
MODEL OF ERROR SEQUENCE PROCESS___________________________________92
6.1 QUALITATIVES APPLICATIONS__________________________________ 92
6.2 BAYESIAN NETWORKS_________________________________________104
6.3 QUANTITATIVE APPLICATIONS USING BAYESIAN NETWORKS____112
6.4 EXAMPLE OF APPLICATION ____________________________________123
7. CONCLUSION________________________________________________________ 132
8. REFERENCES_________________________________________________________134
9. ANNEX______________________________________________________________ 136
9.1 ANNEX 1 HUMAN ERROR REPORT – RDFH-DMS __________________136
9.2 ANNEX 2 HUMAN ERROR REPORT – RDFH-GRP 04/04______________140
9.3 ANNEX 3 HUMAN ERROR REPORT – RDFH-GRP 04/06_____________ 145
9.4 ANNEX 4 HUMAN ERROR REPORT – RDFH-GRL 06/99_____________ 150
9.5 ANNEX 5 HUMAN ERROR REPORT – RDFH-GRO 02/09_____________ 154
9.6 ANNEX 6 HUMAN ERROR REPORT – RDFH-STC 01/05______________157
9.7 ANNEX 7 HUMAN ERROR REPORT – RDFH-GRL 05/03_____________ 160
9.8 ANNEX 8 HUMAN ERROR DATABASE: ERROR TABLE ____________ 165
9.9 ANNEX 9 SUMMARY OF OCCURRENCE_________________________ 169
xii
Chapter 1
Introduction
1. INTRODUCTION
1.1 Overview
As long as electricity is available, no one thinks much about it. The importance is realized
when the power goes out. Whether it is during the day or at night, electricity keeps people
lives in order. It affects their business, schedule and even their entertainment. Electricity runs
everything in people’s everyday life. Gas stations can not pump gas without it. Businesses
have to close because their cash registers would not work without it. Restaurants can not
cook food without it. Everything nowadays depends on having power to keep them running.
The main effort is thus against its outage. A power outage (also known as a power cut, power
failure, power loss, or blackout) is a short- or long-term loss of the electric power to an area.
There are many causes of power failures in an electricity network. Examples of these causes
include faults at power stations, damage to power lines, substations or other parts of the
electricity system, a short circuit, or the overloading of electricity mains. The major causes of
power system downtime include utility outages, human error, externally and internally
generated disturbances, and maintenance of power system components and failure of power
system components. Disruptions in incoming utility power are unavoidable, whether caused
by lightning strikes, construction projects or problems with power equipments.
A widespread blackout can affect large areas. This demonstrates just how quickly a small
problem in one area can ripple across the grid to create a widespread outage. To avoid power
outages or blackouts, for decades the focus has been on increasing the reliability of electric
equipments and increase the flexibility and interconnection of transmission systems. As a
result, the reliability of hydroelectric power system has improved.
With more reliable
equipments and safer work process the focus has shifted to human error. In fact, human error
has become one of the main factors for systems reliability measurement, not only on power
electric systems but also in areas like Nuclear Power Plants, Aviation, Shipping Industry,
Communication Networks, Chemical Industry and the like. According to Rasmussen (1999),
the analyses of industrial accidents have often concluded that human error is a determining
factor in 70-80% of the cases.
Based on Rasmussen (2003), in the 1970s and 1980s there was great interest among applied
psychologists and systems reliability engineers in analyzing accidents and “near miss”
incidents in large scale systems where public safety was a primary concern. Efforts to define
1
Chapter 1
Introduction
and develop taxonomies of human error were then in curse. Works from authors such
Rasmussen (1999), Reason (2005) and Hollnagel (1998), have provided the basis for the
structured and systematic formalism for developing and implementing human error
taxonomies. The main reasoning is that the development of human error taxonomies emerge
as the first step to understand the human error process and then propose alternatives to
mitigate and/or to avoid these undesirable events.
Since the late 80th great advances have emerged in the study of human reliability. Techniques
such as THERP, ATHEANA, CREAM and IDAC, have been consolidated over time for the
study, measure and prediction of human error. However performance shaping factors used in
almost all the aforementioned techniques have proven difficult to be estimated. In addition,
the specifics of the Electric Power Sector defined in the Grid Procedures of the National
System Operator (Operador Nacional so Sistema, ONS) and the regulatory instruments of
ANEEL (Agencia Nacional de Energia Eletrica) Regulatory Agency, have led to the necessity
of a taxonomy that can adjust for this important strategic sector.
1.2 Motivations and justifications
It is observed that 1st generation techniques for Human Reliability Analysis have some
shortcomings. Among them, unrealistic assumptions of independence and simple binary
representation of events. This is because 1st generation techniques try to adapt tools from
Equipment Reliability Engineering such as event tree and fault tree analysis to quantification
probability of human errors. These techniques fail on modeling human actions. Human
behavior is much more complex than behavior of equipments and analytical systems.
In 1982, Rasmussen presented the concepts of Performance Shaped Factors (PSFs) as an
attempt to introduce psychological questions on modeling human behavior. The classification
Skill-Rule-Knowledge (SRK) for human error proposed by Rasmussen in this same paper
represented an important advance. The concept of Failure Mode (FM) firstly presented by
Rasmussen in 1982 and after developed by Reason in 1990 consolidated the human error
assessment not as an analytical system but as a system with human beings. Among these
techniques, in 1998, Hollnagel presented the Cognitive Reliability and Error Analysis Method
(CREAM) as an attempt to quantify more explicitly the influence of psychological factors on
workers performance. Hollnagel proposed a polychotomous classification as a generalization
of the event tree. However, the assumption of independence among events and not able to
deal dynamic contexts remained a problem. A methodology developed by Chang & Mosleh
2
Chapter 1
Introduction
(1999) brought a major evolution for HRA, as they incorporated many advances in relevant
areas of cognitive psychology, behavioral sciences, neuroscience, and human factors, among
others. This progress made it possible to consider the independence among most of the PSFs.
However, the independent relationship between external factors and psychology factors is not
considered which is a shortcoming of this method. Other disadvantages were also observed
such as not being possible to quantify the influence between two workers and not to consider
the influence between events. These problems arise because of the difficulty in modeling
human actions through event trees. It is clear that the major challenge for HRA have been to
model the existing causality in human actions. Some of the 3rd generation uses Bayesian
network to solve this problem. Menezes and Droguett (2005) presented a methodology for
using Bayesian network for evaluating human reliability in activities of replacement of
insulator chain in transmission lines. Bayesian networks provide greater flexibility as they
allow a more realistic representation of the dynamic nature of the interface between system
and man-man events in normal or abnormal process, and also allows for representation the
relationship of dependency between events and between the performance factors despite the
use of Bayesian network, the use of PSFs have been a problem to get data about human
behavior even. The elicitation about the influence of PSFs on human error is difficult [Souza,
Firmino & Droguett (2010)]. Thus, this work proposes a taxonomy and model for the error
sequence process in the context of human error in hydroelectric ower ystems. It also makes
use of BBN to develop a quantification model for Human Error Probabilits.
1.3 Objectives
1.3.1 General Objective
A new taxonomy and model of error sequence process to assess the human error in
Hydroelectric Power Systems.
1.3.2 Specific Objectives
Develop a new taxonomy for human error assessment based on the hibridism of
Rasmussen(1982)/Reason(1990)
taxonomy
and
the
elementary
behavior
of
Berlinner(1964);
Develop a model that describes the sequence of the error process when human error
occurs during interventions (operation/maintenance) in hydroelectric power systems;
3
Chapter 1
Introduction
Apply the proposed taxonomy and model to a real case in the context of a
hydroelectric company in northeastern Brazil;
Develop a BBN-based model for quantification human error based on the proposed
taxonomy and model of sequence error process.
1.3.3 Thesis lay-out
This thesis is organized as follows: Chapter 2 presents an overview about the Brazilian power
electric system, the importance of electricity nowadays and problems when blackouts are
caused by operational discontinuity of the power electric system. Chapter 3 presents a
literature review about human error involving human reliability, human error and human error
taxonomy. Chapter 4 presents a new taxonomy to classify the human error and a new model
to describe the sequence of human error on power electric systems. In sequence, Chapter 5, is
presented the importance of analysis of human error, the form of registration these human
errors and a descriptive statistics of human between 1998 and 2009 in the company object of
this study. Chapter 6 develops applications about this new model with the new taxonomy.
Examples contribute to validate the new taxonomy and the new model is here presented. First,
a qualitative application is presented to investigate human error occurred and proposal adjusts
on prevention program. In sequence, a Bayesian network application is developed to
quantification the human error probability during tasks of operation/maintenance of power
electric systems, and a Toy Model is presented to validate the model. The last chapter
(Chapter 7) presents conclusions and opportunity to develop new approach about the human
error for power hydroelectric system.
4
Chapter 2
Hydroelectric Power System
2. HYDROELECTRIC POWER SYSTEM
This chapter presents an overview about the Brazilian hydroelectric power system, its history;
importance to development of the country; capability and current resources. Also, shows the
failure of the electric system and its consequences when a blackout occurs.
According to Eletrobrás (source: www.eletrobras.com) electricity was introduced in Brazil in
the 19th century through the concession of privileges for the exploration of public illumination
given by Emperor D. Pedro II to Thomas Edison. In 1930, the installed power in Brazil
reached 350 MW in power plants that are now considered of low power, owned by industries
and municipal administrations, most of them hydropower plants. In 1939, in Varga’s
Administration, the Waters and Energy National Council was created, a regulatory and
inspection organ, later replaced by the Waters and Electric Energy National Department –
DNAEE – under the authority of the Ministry of Mines and Energy. The first half of the 20th
century represents the phase that confirms electricity generation as an activity of economic
and strategic importance for the country. From the Second World War on, the Hydroelectric
power system has a large thrust with the construction of the first large power plant, namely
Paulo Afonso I, with a power of 180 MW, followed by the Furnas, Três Marias and other
power plants with large reservoirs. In June 11, 1962 the Eletrobrás (Brazilian Electric Power
Company) was established, in a solemn session of the Conselho Nacional de Aguas e Energia
Eletrica (Cnaee) at Laranjeiras Palace in Rio de Janeiro. Eletrobrás is a mixed economy and
open capital company controlled by the Brazilian government, which operates in the areas of
generation, transmission and distribution of electricity. With shares traded on stock exchanges
in Sao Paulo, New York, USA and Madrid, Spain, and focus on profitability, competitiveness,
sustainability and integration, the company manages 12 subsidiaries - Eletrobrás Furnas,
Eletrobrás Chesf, Eletrobrás Eletronorte, Eletrobrás Eletrosul, Eletrobrás Eletronuclear,
Eletrobrás CGTEE, Eletrobrás Amazon Energy, Eletrobrás Boa Vista Energia, Eletrobrás
Ceal, Eletrobrás Cepisa, Eletrobrás Ceron and Eletrobrás Eletroacre. Also, Eletrobrás
Eletropar, a shareholdings company, an Electric Power Systems Research Center (Cepel) and
still owns 50% of Itaipu Binacional, one company shared with the government of Paraguay.
Together these companies form Eletrobrás. Eletrobrás generating capacity, including half of
the Itaipu Binacional, is 39,413 MW, which corresponds to about 38% of total generation in
the country. This energy is produced by 30 hydroelectric plants, 15 thermoelectric plants and
5
Chapter 2
Hydroelectric Power System
two thermonuclear plants. Eletrobrás has 59,856 km of transmission lines, representing about
56% of the total lines that cut through Brazil, as well as 247 substations. At the end of the
sixties, the Interconnected Operation Coordination Group (GCOI) was created, giving birth to
the Interconnected National System. During its 100 years of existence, the Brazilian electric
system has predominantly been a hydraulic one. Today, the power electric matrix is 85% of
hydraulic power plants and 15% thermo power plants The Brazilian electric power system
nowadays has a generation capability of 92TW. In 2005 were generated on the average of
46TW of power with a maximum consumption of 60TW. This energy corresponds to 55% of
production on South America and is equivalent to that of countries like Italy and the UK.
Besides, it operates and maintains this system in compliance with the performance and quality
standards required by the National Agency of Electrical Power (ANEEL). The Brazilian
electric power system has been actively taking part in the transmission and generation
expansion through concessions in auctions promoted by ANEEL, solely or by means of
consortiums, as well as through authorizations to reinforce the current system. The Brazilian
power electric system has developed an important role in the development of the country.
Today’s society is very demanding with the maintenance of continuity of supply of electric
power. A power outage, power cut, power failure, power loss, or blackout, is nowadays a very
serious undesirable event with bad consequences. Power outages are categorized into three
different phenomena, relating to the duration and effect of the outage:
* A transient fault is a momentary (a few seconds) loss of power typically caused by a
temporary fault on a power line. Power is automatically restored once the fault is cleared.
* A ''brownout'' or ''sag'' is a drop in voltage in an electrical power supply. The term
brownout comes from the dimming experienced by lighting when voltage sags.
* A ''blackout'' refers to the total loss of power to an area and is the most severe form of
power outage that can occur. Blackouts which result from or result in power stations tripping
are particularly difficult to recover from quickly. Outages may last from a few minutes to a
few weeks depending on the nature of the blackout and the configuration of the electrical
network. Power failures are particularly critical at sites where the environment and public
safety are at risk. Institutions such as hospitals, sanitary sewage treatment plants, mines, etc.,
will usually have backup power sources, such as emergency power system generators, which
will automatically start up when electrical power is lost. Other critical systems, such as
telecommunications, are also required to have emergency power. Telephone exchange rooms
usually have arrays of lead-acid batteries for backup and also a socket for connecting a
6
Chapter 2
Hydroelectric Power System
generator during extended of outage periods. Different types of electrical apparatus will react
in different ways to sag. Some devices will be severely affected, while others may not be
affected at all.
* Commutated electric motors, such as electric motors, whose mechanical power output also
varies with the square of the applied voltage, will run at reduced speed and reduced torque.
Depending on the motor design, no harm may occur. However, under load, the motor will
draw more current due to the reduced back-EMF developed at the lower armature speed.
Unless the motor has ample cooling capacity, it may eventually overheat and burn out.
* An AC induction motor will draw more current to compensate for the decreased voltage,
which may lead to overheating and burnout.
* An unregulated direct current linear power supply (consisting of a transformer, rectifier and
output filtering) will produce a lower output voltage for electronic circuits, with more ripple
(electrical) ripple, resulting in slower oscillation and frequency rates. On a television monitor,
this can be seen as the screen image shrinking in size and becoming dim and fuzzy. The
device will also attempt to draw more current in compensation, potentially resulting in
overheating.
* A switching power supply may be affected, depending on the design. If the input voltage is
too low, it is possible for a switching power supply to malfunction and self-destruct.
*Brownouts can cause unexpected behavior in systems with digital control circuits. Reduced
voltages can bring control signals below the threshold at which logic circuits can reliably
decide which state is being represented. As the voltage returns to normal levels the logic can
find itself latched into an incorrect state; even can not happens states become possible. The
seriousness of this effect and whether steps need to be taken by the designer to prevent it
depends on the nature of the equipment being controlled; for instance a brownout may cause a
motor to begin running backwards.
Under certain conditions, a network component shutting down can cause current fluctuations
in neighboring network segments, though this is unlikely, leading to a cascading failure of a
larger section of the network. This may range from a building, to a block, to an entire city, to
an entire electrical grid. Modern power systems are designed to be resistant to this sort of
cascading failure, but it may be unavoidable. Moreover, since there is no short-term economic
benefit to preventing rare large-scale failures, some observers have expressed concern that
7
Chapter 2
Hydroelectric Power System
there is a tendency to erode the resilience of the network over time, which is only corrected
after a major failure occurs. It has been claimed that reducing the likelihood of small outages
only increases the likelihood of larger ones. In that case, the short-term economic benefit of
keeping the individual customer satisfied increases the likelihood of large-scale blackouts.
Restoring power after a wide-area outage can be difficult, as power stations need to be
brought back on-line. Normally, this is done with the help of power from the rest of the grid.
In the total absence of grid power, a so-called black start needs to be performed to
Bootstrapping (electronics) bootstrap the power grid into operation. The means of doing so
will depend greatly on local circumstances and operational policies, but typically electric
power transmission utilities will establish localized 'power islands' which are then
progressively coupled together. To maintain supply frequencies within tolerable limits during
this process, demand must be reconnected at the same pace that generation is restored,
requiring close coordination between power stations, transmission and distribution
organizations. Cascading failure becomes much more common close to this critical point.
The power law relationship is seen in both historical data and model systems. The practice of
operating these systems much closer to their maximum capacity leads to magnified effects of
random, unavoidable disturbances due to aging, weather, human interaction and so on, while
near the critical point these failures have a greater effect on the surrounding components due
to individual components carrying a larger load. This results in the larger load from the
failing component having to be redistributed in larger quantities across the system, making it
more likely for additional components not directly affected by the disturbance to fail, igniting
costly and dangerous cascading failures. These initial disturbances causing blackouts are all
the more unexpected and unavoidable due to actions of the power suppliers to prevent
obvious disturbances (cutting back trees, separating lines in windy areas, replacing aging
components etc). The complexity of most power grids often makes the initial cause of a
blackout extremely hard to identify. The effects of trying to mitigate cascading failures near
the critical point in an economically feasible fashion are often shown not to be beneficial and
often even detrimental. On hydroelectric power systems, most human errors do not produce
bad outcomes such discontinuity in the supply of electrical energy , because they could had
been immediately corrected by the operator that committed this error or the subsystem and/or
equipment was delivered to maintenance (out of operation), or because the consequences
were only lost of time to
make a re-work. On the other hand, some human error on
hydroelectric power systems could produce catastrophic outcomes like blackouts. Some
blackouts may last for hours and even days. The operational discontinuity of electricity
became great loses for the company who provides energy and even more for the society
8
Chapter 2
Hydroelectric Power System
around affected by blackout. Nowadays, human error arises in importance due to the great
developed of equipment and material reliability on last decades. This enormous development
has reduced the relative failure rate from equipment and material on global failure in complex
industrial systems. Growing in importance in the 20th century, human element researches have
been received many resources. “Human error has been cited as the dominant cause of many
of the major industrial disasters in recent history. Perhaps the main reason for the visibility of
human cause of failure of complex technological systems is the enormous progress made in
the 20th century in improving the levels of reliability and safety of such systems leaving the
human element behind”, according to Chang & Mosleh (1999).
9
Chapter 3
Human Error Overview
3. HUMAN ERROR OVERVIEW
This chapter presents initial concept of human error, a literature review on human reliability
and taxonomy of human error proposed by Rasmussen and Reason
“An erroneous action can be defined as an action which fails to produce the expected result
and/or which produces an unwanted consequence”, according to Hollnagel (1998). Another
important definition of human error is the one proposed by Reason (1990): “Error will be
taken as a generic term to encompass all those occasions in which a planned sequence of
mental or physical activities fails to achieve its intended outcome, and when these failures
cannot be attributed to the intervention of some chance agency.”
In general, the human behavior is a fundamental contributor to decrease the efficiency and
safety of critical systems. However, it is important to note that one can not dismiss the human
element of this interaction. Therefore, it is important to study and look for mitigate the
outcomes from human error in complex systems like power hydroelectric systems.
3.1 Human Error
According to Duarte (2003), human error is responsible for approximately 70% of accidents.
This fact could be see in results published by Boeing in 1989 (Duarte 2003) involving aircraft
accidents; analysis of 162 false alarms at a nuclear plant in California where two thirds were
caused by human error; and in the chemical processing industry, 40% of crashes involving
pipe can be attributed to operator error. In one Brazilian company of power hydroelectric are
committed an average of 50 human errors per year and of these 50, 11 cause serious outcomes
(See chapter 5). Studies by the Brazilian Corporate Management Committee of the Power
Industry have shown that in the electricity sector, 82.6% of accidents result from
administrative errors, of which 63.04% are failures of supervision and planning, and 19.56%
are caused by the use of improper procedures by workers. Also according to Duarte (2003),
claiming that accidents are due to human error, and merely recommending that the operator is
more careful, although true, does not lead to constructive actions. In fact, we need a change of
attitude that is not limited to informing the executor that he/she could have done better. Upon
the occurrence of a particular accident, there is only the figure of the performer, but also the
need for greater awareness of risk management since the project involving the installation,
even better procedures, training more appropriate, etc. that will result in taking the necessary
steps to prevent it or avoid it. For it is always easier to admit that we can do better than accept
10
Chapter 3
Human Error Overview
the error. As human error may have different causes and effects, different actions are
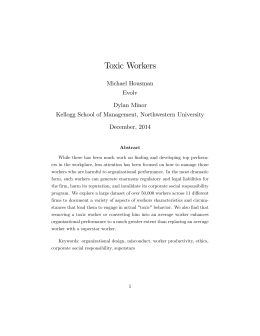
necessary to prevent it. The first step to analyze human error is to identify how these errors
are made, or better determine its failure mode. Human errors could be grouped into two
categories: slips or lapses and errors of intention named mistakes, Figure 1. Besides the errors
of slip (lapse) or mistake, the executor may deliberately decide not to follow proper
procedures. Or rather, he/she may reject the information. The errors arising from the rejection
of information are named violations. The human error paths, will be best detailed in chapter 4.
Mistake
Slip
No
oo
No
oo
Worker chooses the
rule correctly?
Yes
Yes
Worker performed the
action correctly?
Success
Yes
Mistake
No
oo
Worker created
correct rule?
Figure 1. Categories of human errors
A slip (lapse) may occur even when the operator knows what to do and how. In other words,
the error from a slip might result from a failure to perform a procedure, although the executor
is qualified (has physical and mental conditions, and is appropriately trained) and has all the
necessary conditions to perform the procedure successfully.
Routine procedures usually are performed without close supervision of our consciousness,
like on autopilot. When, for some reason, the pilot mechanism fails, it is very likely that an
error could occur. Errors of lapse and slip were studied by Reason (1990). On the other side,
errors of intent (mistake) are due to badly designed procedures or poor or insufficient training.
Or rather, the operator does not know how to perform the procedure although he/she thinks he
knows. An error of intent can occur when the operator follows the procedures with which he
could not to be familiarized. Or when an unusual situation occurs and a new sequence of
actions is needed, usually during an emergency situation.
Training means giving the operator an understanding of the methodology and technology
used, their responsibilities, and look for to develop their skills to diagnose faults and make
decisions. It is necessary to explain the instructions and procedures for those who will run
them. And this should be discussed and clearly understood for all. Even when the systems are
11
Chapter 3
Human Error Overview
simple to operate and maintain, its instructions are well written and sufficiently detailed, it is
unlikely that these instructions and procedures can predict everything that might go wrong. It
is important that the instructions and/or procedures only transmit to the operator what he/she
must do or not. The instructions and procedures must prevent errors based on rules of
behavior. According to Rasmussen (1999), the errors of intent should be prevented based on
the development of operator skills and his/her knowledge.
The need to train the operator to diagnose and make personal decisions is important because
even when the intervention to be performed is very simple and only a few procedures are
sufficient, given the complexity of current systems, these procedures, even well detailed will
always be incomplete and it is impossible to cover all the aspects to be considered.
Errors of intent can be reduced through proper training; however slips (lapse) errors do not.
Slips error becomes evident that the practice does not lead to perfection. As the errors of
intention, thus are failures in diagnosis, decision making and planning, can be avoided by
giving the operator more time to think. Conversely, when an operator makes a mistake due to
a slip, he/she was not necessarily under pressure, and more time to think would not matter
One of the most important aspects in a risk management program is to understand the causes
of accidents and human factors that influence the operator performance. Human errors can be
induced by a combination of organizational factors, cultural, technical, environmental, and
others. On the other hand, some initiating events can trigger these factors into a sequence of
actions that could result in an accident unless there is some kind of barrier or mitigation
measures that may prevent the occurrence of human errors.
If the operator does not eat well or sleep well, he/she indeed shows fatigue signs. This fatigue
can affect his/her motor performance and may also decrease his/her concentration. On the
other hand, the quality of operating procedures, oral or written, may also affect the operator
performance. Table 1 shows some performance factors and challenges associated with them.
Later, these performance factors will be detailed. The existence of written instructions and
normalized, represent an important factor for good performance of the operator during a task.
According to studies in nuclear power plants in emergency situations (Duarte 2003), detailed
procedures result in quicker and more correct actions. The success or failure of the performer
to play a given intervention will depend on intrinsic factors, environmental and stress.
Intrinsic factors are motivation (the executor wishes to perform the procedures correctly?),
Temperament and physical and mental ability (the executor will be able to maintain emotional
balance when subjected to an abnormal situation?), concentration (the executor is able to
exclude other influences during an intervention?), response speed (the executor will respond
12
Chapter 3
Human Error Overview
quickly when subjected to an abnormal situation?) and knowledge (the executor has been
properly trained to conduct the intervention?).
Table 1. Common question about the operator’s performance. Source: Duarte (2003)
Performance Shaping Factors
Definition
Team expertise
What is an expertise team?
Time
How much time is needed to performance an intervention?
What kind of stress the operator is submitted to during an
Stress
Necessary procedures
intervention?
The operator needs some kind of procedure to performance
the intervention? Is the procedure followed by the operator?
Scope of procedures
Scope of procedures covers all tasks performed by
operator?
Quality of procedure
Are the procedures in accordance with code and standard
currents? Are they complex? What is the necessary level of
scholar from operator to understand the procedure?
Knowledge of procedure
The operator understands the procedure? What’s the
intelligence quotient needed to understand the procedure?
What is the level of emotional intelligence needed to
understand and implement the procedure?
Performed versus written
What was performed in filed is according to written
procedure?
Prevention
Is it possible to verify whether the operator performed the
task correctly? How? Is it possible to introduce some kind
of protection or mitigated measures that can stop the
sequence of chain errors?
Interdependence
Tasks what must be executed in an intervention depend on
one each other?
Dynamic issues
Are there tasks in an intervention that is executed
simultaneously?
Toys and dresses
Are necessary special equipments and special tools during
an intervention? They are available? They are in good state
of conservation?
Behavior
Parameters such as temperature, humidity, electromagnetic
fields, among others affect the performance of the operator?
13
Chapter 3
Human Error Overview
Environmental factors are characterized by the physical and wheather conditions (wind and
humidity) and shift work. Environmental factors also include the organizational aspects
(relationship with colleagues, supervisor, manager, job satisfaction, job safety) and personal
aspects such as hunger, haste, among others.
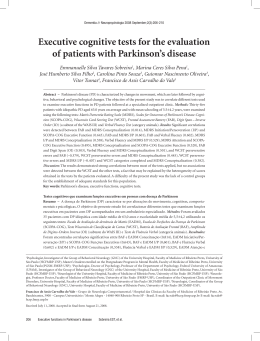
The reliability provided by the performance of an operator during an intervention in a given
environment, in the organization context and/or in the physical and personal, depends on level
of stress. Figure 2 shows qualitatively the relationship between human error and the stress
level. It is observed that there is a level of stress to which the rate of human error is minimal.
Likewise, if the operator is upset or excited, the error rate is higher. It is noteworthy that the
rate of human error also tends to increase with the complexity of the task to be performed.
Figure 2. Stress level effect on human error rate. Source:Duarte, Dayse (2003)
3.2 Human Reliability
The most important measure of performance in assessing risk is human reliability. Human
reliability analysis is an important part of risk analysis. It has long been recognized that
human error has a significant impact on the reliability of complex systems. The accidents at
the Three Mile Island nuclear plant and many failures of aircraft show how human error can
destroy the safeguards of engineering as barriers against the dangers and play a dominant role
in the progression of accidents and exposure risks. At least 70% of aviation accidents with
injuries are caused by human being, according Duarte (2003), this statistic can similarly apply
to shipping and industrial process. Studies on reactors safety have revealed that over 50% of
the potential for accidents in the nuclear industry are related to human error. In general, the
14
Chapter 3
Human Error Overview
human contribution to limiting the overall hazard is as important as the reliability of
equipment.
HRA (Human Reliability Analysis) has been used to study human actions and their
interactions with a system, taking into account their limitations and factors influencing the
human performance according to Menezês and Droguett (2005). Human reliability is the
probability that a person properly run an activity required by the system within a set time (if
applicable), which would not degrade the system according to Swain and Guttmann (1983). In
this way, one can notice the fundamental need of resources provided by an adequate
taxonomy for performing HRA; without these prerequisites, HRA would naturally become
useless or inconsistent with the system being modeled.
To obtain a precise and accurate measurement of system reliability, human error must always
be taken into consideration. System analysis through drawings, procedures, and reports of
investigation accident have shown that human error can be the immediate initiator of the
accident or can play a dominant role in the progress of undesirable events. Without
incorporating the probability of human error (HEP), the results of risk analysis are incomplete
and often underestimated according Duarte (2003).
To estimate HEP (and therefore the human reliability), there is a need to understand human
behavior. However, human behavior is very difficult to be modeled. According Duarte (2003)
literature shows that there is not a strong consensus on how to best capture all human actions
and quantify the HEPs. The assumptions, mechanisms and approaches to a specific model can
not be applied to all human activities. In general, human reliability models need further
improvement, particularly in the capture and quantification of unintentional human error.
Current limitations and difficulties in HRA predictions according Duarte (2003) are:
Human behavior is a complex issue that can not be described as a simple machine part
of a system. Human performance can be affected by social, environmental,
psychological, physical which are difficult to quantify;
Human actions can not be seen as binary states: success and failures just like with
equipment failure. In addition, the full range of human interactions has not yet been
fully analyzed by HRA methods. The most difficult problem with HRA is the lack of
adequate data on human behavior in extreme situations;
Human error can occur at any stage of design, manufacturing, construction and
operation of a complex system. Mistakes made in the design, fabrication and
construction can also be a source of errors that are committed during the operation of
systems. For some human errors, the negative outcome is almost immediate, for others
15
Chapter 3
Human Error Overview
situations the consequences of human error will be known only after some time. In
this way, Reason and Maddox (2005) define:
Active failures are the result of unsafe acts (errors and violations) committed by those at the
"sharp end" of the system (pilots, air traffic controllers, etc.). They are the people at the
human-system interface whose actions can, and sometime do, have immediate adverse
consequences.
Latent failures are created as the result of decisions, taken at the higher echelons of the
organization. Their damaging consequences may lie dormant for a long time, becoming
evident only when they combine with local triggering factors (e.g., errors, violations and local
conditions) to break the system defenses.
Additional concern occurs during operation of the system because there is errors where the
human remains supervise and control the performance of complex systems.
In others cases, major errors are dependent on faults whose occurrence can lead to loss of
multiple barriers to hazards and redundancy in the system. Typically, quality assurance
programs are designed and implemented to minimize the occurrence of these types of human
error.
In the sequel, will be a literature review of some HRA approaches more important according
Hollnagel (1998).
First Generation Techniques
The first models to analyze human reliability appeared in 1975, in the nuclear industry. The
first-generation models are so classified because they have some general characteristics in
common, such as:
Human reliability is described in the same way as equipment reliability. This hypothesis
should no longer be applied, because when one analyzes human reliability, one should take
into account the entire process of cognitive activity;
Binary representation of human action (success or failure): is just a specific case of the
above item, because the equipment when required for an activity can provide answers to
failure or success. That is, this is treating the response of the human being as if it were a
machine;
Errors of omission and commission: There are the two types of errors that can occur when a
person is asked to perform a task. Errors of commission are those committed in the execution
of the task, while errors of omission are errors when the worker omits a step in the task;
16
Chapter 3
Human Error Overview
Focus on aspects of human action: first-generation models emphasize the errors of omission
and commission because they can be easily observed, but other types of errors are not
handled;
Little worry with the cognitive aspects of human actions: which comes to a severe failure,
because to understand properly human actions should be taken into account the cognitive
aspects;
Emphasis on quantification: first generation models have the need to estimate the
probability of human error (HEP) identified by event tree, as it is done for the analysis of
equipment reliability;
Indirect approach to the context: how the analysis is proposed, each performance factor is
independent of each other. This hypothesis is not true in practice, because the performance
factors are connected with each other, as will be seen in the 2nd generation models;
Pr(HEP/context) Pr(HEP_basic) * (
PSFi * Wi )
(3.1)
HEP: human error probability;
HEP_basic: likely to commit the error regardless of the environment the activity is being
developed
PSF: performance shaped factors;
Wi: Weight of influence of each performance factor.
The literature presents about 35 models of first generation, but this figure is questioned,
because many models presented as new are just enhancements of models previously proposed.
The following will be detailed the main characteristics of the model’s method more discussed
in literature, according to Hollnagel (1998).
Accident Investigation and Progression Analysis (AIPA)
According to Hollnagel (1998), AIPA was developed to estimate the probability of a worker
response, operating a gas-cooled reactor at high temperatures. The purpose of the AIPA was
to determine the probability of whether the action would be carried out, described in terms of
the mean time to operator response. According to Swain (1989) the AIPA method included
the following basic modelling assumtions:
The worker had a probability of zero for making any response instantaneously –
defined as the interval from 0.2 to 40 seconds after an event.
Given enough time, the worker eventually take some action, which most likely would
not increase the potential event consequences.
17
Chapter 3
Human Error Overview
If the worker found that the first action were insufficient, he would then take further
corrective action until a mitigating condition was achieved. (This seems to be a very
optimistic point of view!).
AIPA cannot be said to include an worker model as . The workerblack box that emits a –
possibly sucessful – response according to an unknown “mechanism”.
Operator Action Tree (OAT)
The OAT or OATS was developed by John Wreathall in the early 1980s and has been
described by Wreathall (1982). The OAT approach to HRA is based on the premisse that the
response to an event can be described as consisting of three stages: (1) observing or noting the
event, (2) diagnosing or thinking about it, and (3) responding to it. It is further assumed that
errors that may occur during the third phase, i. e., carrying out the necessary response actions,
are not the most important. The primary concern should rather be on the errors that may occur
during the second stage, the diagnosis. The OAT approach therefore concentrates on the
probability that the worker correctly diagnoses accident and identifies the responses that are
necessary in terms of system operations.
Technique for Human Error Rate Prediction (THERP)
According to Hollnagel (1998) THERP is probably the best known technique presented as the
1st generation. The aim of THERP is to calculate the probability of successful performance of
the activities necessary for the accomplishment of a task. The calculations are based on predefined error rates (the so-called HEPs), and success is defined as the 1`s complement to the
probability of making an error. THERP involves performing a task analysis to provide a
description of the performance characteristics of the human tasks being analysed. The result
of the task analysis are represented graphically in an HRA event tree that is a formal
representation of the required sequence of actions. The nominal probability estimates from the
analysis of the HRA event tree are modified for the effects of sequence-specific PSFs, which
may include factors such as dependence between and within workers, stress levels,
experience, quality of information provided, display types, etc.
The basis for applying THERP is a schematic representation of human actions and related
system events, the so-called HRA event tree. The method consists of the following six steps:
Define the system failures that can be influenced by human error and for which
probabilities are to be estimated.
Identify, list, and analyse human operations performed and their relationships to
system tasks and funtions of interest.
18
Chapter 3
Human Error Overview
Estimate the relevant human error probabilities.
Determine the effects of human errors on the system failure events of interest.
Recommend changes to the system in order to reduce system failure rate to an
acceptable level.
Review the consequences of proposed changes with respect to availability, reliability
and cost-benefit.
Human Cognitive Reliability (HCR)
According to Hollnagel (1998) the basis for the HRC approach is actually a normalised timereliability curve, where the shape is determined by the dominant cognitive process associated
with the task being performed. The analyst determines the type of cognitive process, estimates
the median response time and the time window, and uses the HRC model to quantify the nonresponse probability.
The HCR method can be described as having the following sis steps:
Identify the action that must be analysed by the HRA, using e. g. a task analysis method
Classify the types of cognitive processing required by the actions. This classification in
itself uses a sequence of binary choices, resulting in a classification in terms of skillbased, rule-based and knowledge-based actions according Rasmussen (1982).
Determine the median response time of a crew to perform the required tasks.
Adjust the median response time to accont for performance influencing factors.
For each action, determine the system time window in which action must be taken.
Finally, divide the system time window with median response time to obtain a
normalised time value. On the basis of this, the probability of non-response is found
using a set of time-reliability curves.
The median response time is obtained from simulator measurements, task analysis, or expert
judgement. The effects on crew performance of operational-induced stress, control room
equipment arrangement, etc., are accounted for by modifying the median time to perform the
task.
Maintenance Personnel Performance Simulation (MAPPS)
According to Hollnagel (1998) the MAPPS computer model was developed to provide a tool
for analysing maintenance activities in nuclear power plants. A principal focus of the model is
to provide maintenance-oriented human performance reliability data for PRA purposes. The
influence of select PSFs is also included, such environmental, motivacional, task, and
19
Chapter 3
Human Error Overview
organisational variables. The output from MAPPS provides information about predicted
errors, personnel requeriments, personal stress and fatigue, performance time, and required
ability levels for any corrective or preventive maintenance actions.
Socio-Technical Assessment of Human Reliability (STAHR)
According to Hollnagel (1998) STAHR differs in many ways from other approaches of the 1st
generation of human reliability. The consensus of this method is based on a psychological
scale to assess human reliability in complex technical systems, and consists of a technical and
social component. The technical component is a diagram that shows the influence of the
network of causes and effects, factors linking the outcome of the situation. The social
component refers to the discovery, by group consensus, the experts' judgments of conditional
probability of various factors shown in the diagram of influences as well as their respective
weights of evidence.
Analyzing
the
first-generation
methods,
Hollnagel
(1998)
listed
some
common
shortcommings, such as:
Data less than adequate: Due to shortage of human performance data that are useful to
quantify human behavior in complex systems;
Misunderstanding the use of the judgments of experts in the methods, so far no one
has satisfactorily demonstrated the level of consistency among the experts, let alone
the accuracy of prediction;
Difficult calibration of simulation data, such as simulators are not the real situation,
there is a problem as it should be done to transform the simulation data for the real
world;
Psychological reality less than adequate in some approaches to HRA: many
approaches to human reliability analysis are based on highly questionable assumptions
about human behavior;
Less than adequate treatment of some important performance factors.
Second Generation Techniques
First-generation models have several weaknesses, as have been previously presented. The
first-generation models must not be viewed as methods for estimating the value (number) for
human reliability, but it allows us to assess the impact of action and compare different
alternatives. Therefore, 2nd generation models have emerged in order to overcome these
20
Chapter 3
Human Error Overview
shortcomings. Second-generation models are still emerging, and there is little consensus about
what they are. This is mainly because they were defined in terms of what should not be. The
following will be a description of the main tecniques found in literature.
Cognitive Environment Simulator (CES)
According to Hollnagel, CES is a tool developed for computer simulation analysis. This tool
was used to explore the intentional formation of man. So, instead of defining theoretically the
possibility of error mode, CES will create it by simulation, taking into account the
characteristics of the simulation. The goal of the CES is to see how the worker will respond to
a given situation. The input data of the simulator is a set of values that correspond to a given
situation in the plant. These values are generated by process simulation and provided via a
display. The values read on the display are used to produce the intent to share in a given
situation. This intention to return the process simulator, which generates new values for the
CES.
The CES has three types of activities during a session:
The system state is monitored via a display;
The explanations are generated to account for the observations, particularly when
some event happens. These explanations make use of a detailed knowledge-based
process;
The CES finally selects the appropriate responses (intentions for action). Each action
is intended to correct an abnormality of the system and adapt pre-planned responses to
unusual circumstances.
As CES generates intention in action instead of individual actions, it does not have a
classification of errors or wrongful actions explicit. He obviously can generate intentions are
wrong, but the classification is more subtle than the binary classification models typically
used in 1st generation. The CES does not provide estimates of probabilities of specific actions
and there is no need to classify actions as successes or failures. The CES is several ways to
generate actions that the worker is likely to play under different operating conditions. The
classification of actions is better in terms of possible strategies for solving problems.
The model used in the CES worker is well detailed and is adapted from a model of artificial
intelligence (EAGOL). This model can use several strategies to solve problems.
Intent
According to Hollnagel, the background for the development of INTENT was the recognition
that THERP only treats a few “errors of comission”, namely “errors of selection” and “errors
21
Chapter 3
Human Error Overview
of execution”. It was felt that there was a need to enlarge the scope to cover other types of
commission errors, notably “errors of intention”. On the surface, INTENT therefore addressed
the same issue as the CES
The method describes only the steps necessary to determine and quantify the probabilities for
errors of intent. The same basic method is applied to THERP. The steps below are used in
INTENT:
Compile errors of intention: This was done by observing errors of intent from two
sources of data, and NUCLARR READ. The category defined by intention includes
consequent action, response adjustment, attitudes, and sources of dependencies;
Quantify the errors of intention: This was achieved by a method of direct estimation,
which includes HEP to determine the lower and upper band, as well as performance
factors and their respective weights;
Determine composite PSFs: Each PSF was rated on a site and scenario specific basis
on a scale from 1 to 5, where a low value corresponded to an unfavourable rating. The
composite PSF for each error type used the common principles of multiplying and
summing;
Determine site specific HEPS for intention: Finally, the site specific HEPs were
calculated using a specially developed equation.
Only step 1 is specific for INTENT, and even this is generic in the sense that “errors of
intention” can be replaced by another error type.
Project on Methods for Addressing Human in Safety Analysis (EPRI)
The structure of the method is similar to those applied in the first-generation techniques, as
mentioned previously here in this section, but the difference is the emphasis on the specific
steps listed below:
Identifying expressions of errors: This model recognized the need to use a
combination of modes of errors, making them more complete instead of using only the
traditional, omission and commission errors. Thus, diagnostic errors are errors in the
different expressions of PSA event tree;
Characterization of performance shaping factors (PSFs): This model also clearly
recognized that the PSFs should be described at a level relevant to the ways of error.
Thus, the effects of PSFs could be directly included in the qualitative analysis.
The classification scheme presented in detail the ways of their errors, and their possible
causes. The modes of errors were grouped according to the model structure of the worker.
Therefore, the classification scheme is based on the model of the worker. The model used in
22
Chapter 3
Human Error Overview
the EPRI worker, was a simple processing model composed of three modules: Information,
Decision and Action was set up a graphical notation used to explain the possible combinations
of information processing that may correspond to modes of typical errors. The model of the
worker has the virtue of simplicity. However, it is extremely important that the project
explicitly considers not only the ways of error, but also the PSFs.
A Technique for Human Error Analysis (ATHEANA)
According to Hollnagel, the purpose of ATHEANA was to develop a model of human
reliability analysis that could improve the ability PRA/PSA to identify important interactions
between man and system, represents the most important sequence of the accident, and
provides recommendations for improving human performance based on analysis of possible
causes. The method used by ATHEANA is clearly described, and can be represented
graphically in Figure 3, which is summarized in the following steps:
The method begins by identifying possible Human Failure Events (HFE), which are described
by the event tree PRA / PSA. These events are characterized in terms of unsafe actions (slips,
lapses and mistakes);
At this stage, we consider the Error-forcing Context (EFC) system, which is defined by the
combined effects of the PSFs and the conditions that cause human errors.
Identify and define
the HFE
Define the accident scenario
Model PRA/
PSA
Identify the unsafe
actions
Separation/refinement model
PRA/ PSA
Error forcing context
(EFC)
Estimated frequency by EFC’s
Estimated probability of HFE’s
Integration with the PRA/PSA
Figure 3: The ATHEANA Method. Source:Hollnagel (1998)
ATHEANA has two major loops. The first loop is a characterization of EFCs to identify the
HFEs. This loop recognizes that an improved description of the context may be sufficient to
23
Chapter 3
Human Error Overview
identify the best HFEs and can correct the flaws of an inappropriate context. The second loop
is a characterization of the model for CME PRA / PSA. This loop suggests that the qualitative
result of the HRA can be used to modify the base model, thereby improving the conditions of
human-system interaction, which may be missing in the first part.
The final quantification is done according to the following expression:
P( E \ S )
(3.2)
Pij (S )
asi epcj
where:
P(E\S): is the probability of the HFE in scenario S and Pij(S) is the probability of
unsafe actioni resulting from EFCj in scenario S.
ATHEANA uses the classification scheme in two different ways. The first is in compliance
with the PRA / PSA traditional distinction between omissions and commissions as HFEs
basic. The second is related to the characterization of Reason (1990) for unsafe actions for
improvement of basic HFEs. Although ATHEANA recognizes various recent developments
in cognitive psychology and cognitive engineering, this technique does not go very far in
terms of classification scheme. As for the model worker, ATHEANA make a link between the
CME and HFEs, referring to the information processing model with the following stages,
detection, situation assessment, response planning, and implementation of the response.
Cognitive Reliability and Error Analysis Method (CREAM)
According Hollnagel (1998), unlike most first-generation methods, CREAM is based
explicitly on a set of principles of cognitive modeling. The basic notion is that of modeling
contextual control, that is, describing human cognition in terms of responsibility for the
actions and the way in which actions are controlled - with a simple model of cognition
(SMoC) or a contextual control model (COCOM) more detailed. This is combined with a
detailed list of actions. The classification describes the relationships between causes and
effects by defining a number of subgroups or tables. Tables are provided by way of errors,
cognitive functions required by the model, and causes general system and organizational. In
each table, the causes and consequences are subdivided into general categories and specific.
This enables the analysis to occur in different levels of detail, reflecting the quality of
information available.
CREAM is divided into two stages of analysis that are complementary to each other, which
will be discussed below:
24
Chapter 3
Human Error Overview
CREAM – Basic Method
The purpose of the basic method is to provide an overall assessment of the reliability of
performance expected of the task. The evaluation is expressed in general terms of probability
of failure of actions, that is, an estimate of the likely performance of a wrong action for the
task as a whole. This method can be divided into three steps:
Description of task to be analyzed;
Evaluate common performance conditions (Common Performance Conditions CPCs);
Determine the possible mode of control (control mode).
For a description of the task should be to use a systematic method, such as Hierarchical Task
Analysis - HTA and Goals - Means Task Analysis - GMTA.
The basic method considers a list of nine CPCs, which are, adequacy of the organization,
working conditions, adequacy of man-machine interface and operational support, availability
of procedures / plans, number of simultaneous goals to be achieved, time available, period
days, adequacy of training and experience, and team collaboration for quality. Check each
CPC as an influence on performance for the task, and may "improve", "reduced" or "not
significant" for the assignment. There are four types of control modes considered: the
strategic, tactical, opportunistic, and "dispersed" (scrambled). To find out which mode of
control is the task, it is the sum of the number of CPCs that "improvement" and that "reduces"
the performance of the task. Through a graph are related to these sums and the type of control
mode considered. As can be seen in the Figure 4:
Figure 4: Improved x Reduced reliability. Source:Hollangel (1998)
For each type of control mode there is a range of probability of error associated action.
25
Chapter 3
Human Error Overview
CREAM – Extended Method
The purpose of this method is to produce the probability of failure of a particular action. The
method is based on the fundamental principle that the odds of failure are identified through
the features of the task as a whole, that is, the action takes place within a context and not in
isolation. The execution of the method consists of three steps:
Building a profile of cognitive demand of the task;
Identify the likely failure of cognitive functions;
Determine the probability of failure of specific action.
For the construction of the cognitive profile should first relate each activity a task with predefined cognitive activity. And in turn, each cognitive activity is related to cognitive function
of the model. Table 2 shows the relationship between cognitive activities and cognitive
functions of the model.
Table 2: Cognitive activities and cognitive functions
Cognitive
Cognitive Functions of COCOM
action
Observing
Interpreting
Coordinate
Planning
Executing
x
X
Communicate
X
Compare
x
Diagnose
x
x
Assess
x
x
Execute
X
Identify
x
Maintenance
x
Monitor
x
Observe
x
X
x
Plan
x
Remember
x
Regular
x
Copy
x
Check
x
X
X
x
For each type of errors are associated with cognitive function, and according to the
distribution of these errors is possible to determine the profile of task failure, that is, this
26
Chapter 3
Human Error Overview
profile will indicate the most frequently used cognitive functions and activities most likely to
occur at fault. After mounting the cognitive profile should determine the probability of failure
of action, which is performed through three steps:
Determine the probability of cognitive failure nominal (Cognitive Failure Probability CFP) for each of the probable values of a failure of cognitive function;
Correct values CFP’s with CPC’s;
Incorporate the adjusted value of the CFP in the tree of events.
The probability rating of cognitive failure can be found through in Swain & Guttman (1983).
The correction of nominal values of CFP’s is done through the CPC’s weights measured,
according to the level of interference with each CPC that the error associated with cognitive
function.
IDAC - Information Perception, Diagnosis and Decision Making, and Action Taking in
Crew Perspective. Chang & Mosleh (1999).
The concept of developing the IDAC operating crew behavior model is seeing the system and
operating crew as an integrated system, as the circle surrounding these two blocks shown in
Figure 5.
System
Information
Action
Operating
Crew
Figure 5: IDAC perspective of viewing system and operating crew as an integrated system.
Source: Cheng & Mosleh (1999)
This tight connection between the system and the operating crew, modeled in IDAC, becomes
clear at the concept of developing the behavior (cognition and action) rules. The IDAC
models the “rational” or “expected” industrial workers cognitive behavior only. Irrational
behaviors are out of the scope of IDAC. The rational behaviors are the behaviors that the
worker has desire of doing or not doing them irrespective the correctness of the motivations
whether the actions are carried out as intended. Based on the definitional, even the
consequence is not desired, the workers’ behavior of the TMI accident is “rational”. The
27
Chapter 3
Human Error Overview
examples of irrational behaviors are behaviors under drunk or drug. The methodology was
implemented as part of a more comprehensive platform for conducting a dynamic PRA. The
Accident Dynamic Simulator (ADS) models multiple workers, function as a team, interacting
with their surrounding objects, which include the system, the other workers (teammates), or
the external resources (e.g., consulting personnel not in the working team). IDAC models an
individual worker’s behavior, in a teamwork environment, interacting with the system, and
the worker’s behavior is influenced by four groups of factors: external factors, organizational
factors, team-related factors, and individual-related factors. The four-group classification is
“blunt” classification since in some cases it is hard to draw a clear line between different
groups. In such situation, the task of classifying a factor in one group but not the other
becomes uneasy.
The external factors are the unexpected working environment such as the unexpected harsh
environmental conditions or system hidden errors. The organizational factors are the taskrelated factors affecting individual behavior that, in common sense, can be controlled by
management. For example, the quality of man-machine interface, work (safety) culture,
procedural availability and quality etc. The team-related factors reflect the different aspects of
the crew interacting and functioning as a team. For example, the backup, mutual performance
monitoring, error detection, and error correction etc. are in this category. The individualrelated factors are the individual psychological (e.g., stress) and physiological related factors.
All the factors in these four groups, which eventually influence a worker’s behavior, are
called as performance shaping factors (PSFs). Locating a PSF in its appropriate group is
based on the PSFs proximate impact on the individual and the level of detail of the analysis
interest. See Figure 6 to understand the relation among these factors.
Figure 6: An overview of the performance influencing factors influencing an individual
worker
behavior and their dependencies, and the interaction of an individual worker interact with the
surrounding objects. Source: Chang & Mosleh (1999)
28
Chapter 3
Human Error Overview
In IDAC, like in most second generation models, the mental state of the worker is relevant to
assess the human error. IDAC models Mental State (MS) by dividing the gestalt of
psychological character into three stages. The first stage is the perception and appraisal of the
external world. The second stage is the generation of the stimulus and the specific covert
feeling. The final stage is the mood or the overt psychological behavior. Another component
affecting MS is the inertia relating individual’s intrinsic characteristics. Figure 7 shows the
influencing diagram of a worker’s behavior.
In Figure 7, three blocks including the MS, WM, and the physiological factors are the
individual related factors. The other three blocks in the bottom are the factor external to the
individual which including the team related factors, organizational factors, and external
factors. The top of Figure 7 shows that the individual behavior eventually must be affected by
the individual related factors. The factors external to the individual must affect the individual
related factors in someway, and that could be memory, MS, or physical factors. Perceived raw
information is temporarily stores in the WM that serves as the stimuli to change the MS. The
stimuli is amplified or damped after passing through the worker’s intrinsic psychological
characteristics then be appraised. Feelings are generated in response to the appraisal and,
eventually, revealed as the mood of the worker, which can be sensed by the other workers.
Although the stream of feeling go through the three stages (perception and appraisal, stimulus
and feelings, and mood), however, the worker’s behavior (on the top of Figure 7) could be
influenced by any factor directly. For example, unavailable procedure (represented by the
factor of the availability of procedure of the organizational factors) prevents the worker from
using procedure to solve the problem. It is a complex issue to clarify the paths of influence of
the reified MS element shown in Figure 7. For simplicity reason, a factor could influence the
factors at higher level but not below or at the same level. According to the flow diagram of
the worker cognitive behavior, the MS is updated constantly and equity. The worker behavior
affected by the high-level MS elements could affect the information perception. Different
perception of the new information could affect the low-level MS elements. Thus, even though
only the bottom-to-top influence are considered, in the course a scenario both bottom-to-top
and top-to-bottom influences are considered. A significant number of studies have been
reviewed to identify the completeness of the factors in each group. Introducing the technique
in more practice form, according to Menêzes and Droguett (2005), this methodology consists
of coupling the IDAC models with tree events. From an initiator event, attempts to model the
operator behavior in a dynamic system.
29
Chapter 3
Human Error Overview
Figure 7: The Hierarchical structure of human behavior influencing factors, and their
paths of influencing. Source: Chang & Mosleh (1999)
30
Chapter 3
Human Error Overview
Through the event tree, it is possible to see the different stages of the cognitive model IDAC,
and alternatives of choice that the operator has in each stage. Each alternative model is
influenced by PSFs which receive a weight set by experts or by an equation that reflects
dependencies between the factors and different types of influence (direct or indirect). At each
stage of the model, the factors are updated, i.e., the factors of the stage of perception are not
the same factors of the action performed. Once defined, by experts, the weights of each
alternative, the probability of an alternative is calculated by dividing the weight of this
alternative by the sum of the weights of all alternative of the stage considered. Finally, by
multiplying the probabilities of belonging to a same path of the tree, it is possible to find the
probability of a given sequence of the tree.
P1 = P(Perceived) × P21× P31
(3.3)
See Figure 8
Figure 8: IDAC methodology. Source: Menezês & Droguett (2005)
This new technique, seen as an advancement of 2nd generation techniques, looks for details
all factors that influence human performance during the execution of tasks in a control
system, as well as quantify their cause and effect relationships. This technique is based on
findings from relevant areas of cognitive psychology, science behavior, neuroscience, human
factors and others. According to Chang and Mosleh (1999), on occurrence of an abnormal
event, the natural reaction of a person, usually includes physical consequences (fatigue,
nausea, tremors muscle, etc), cognitive effects (memory impairment, difficulty in decision
making, confusion, etc.) and emotional consequences (anxiety, frustration, helplessness, etc.).
These reactions are interdependent and affect the behavior of the worker.
31
Chapter 3
Human Error Overview
The influence diagram shown in Figure 8, proposed by the IDAC model, shows cause and
effect relationship between factors. This diagram shows a trend towards relationship much
more stochastic than deterministic because stochastic models have one or more random
variables as input; these inputs lead to random outputs, which can only be considered as
estimates of the true characteristics of a model, while deterministic models have a known set
of inputs that result in a single set of outputs. Moreover, the diagram has a set of random
variables that describe the evolution of a process in time (mental state); this is the true
definition of a stochastic process. The relationship assumed in this diagram is based on the
development of available empirical and theoretical models, event analysis, simulations, as
well as in other reviews researchers and clinicians expressed in the literature on HRA. The
mental state records the mental and psychological evolution of an operator during the course
of an event. Chang & Mosleh (1999) say that the mental state represents the combination of
cognition and emotion, and these are two continuous, parallel and independent processes. The
mental state is divided into five levels grouped hierarchically to represent the mental and
psychological process. These five levels represent different stages of mental and
psychological states. The following description relates these stages.
When the worker receives a stimulus or information from the outside world, its activity mind
is triggered to “assessment the situation”. However, this evaluation can vary from person to
person due to individual differences. The group “internal factors” represents some aspects of
such differences, which may affect the quality of perception. Personality involves: morale,
motivation, attitude, and confidence, among other features intrinsic to individual. The
perception and evaluation result in situational awareness. This awareness causes specific
sensations undeclared represented by effort and sensations. The PSFs in this phase represent
the specific sensations and related to an internal situation. This phase involves, for example,
feeling an excessive workload, feeling insufficient time to complete the task, among other
sensations. The stage of “effort and feeling” active some effects declared represented by
phase: “emotional stimulation”. The PSFs in this phase represent the aggregate effects on
feelings of a situation, which are revealed and can be felt by other workers. This involves, for
example, stress from frustration, pressure, conflict and uncertainty. Finally, the PSFs in
cognitive ways and trends represent cognitive patterns of worker resulting from state of the
other phases. A practical example of the stages of mental state can be given when the worker
perceives, for example, the amount, intensity and importance of the task and therefore feels
that the time is insufficient to accomplish it. This feeling provokes an emotional stimulus
revealed by stress, which can come from pressure. Depending on the level of stress received,
the worker may be or may not be to their level of adequate attention. The mental state also
32
Chapter 3
Human Error Overview
receives influences of psychological factors and information memorized. The psychological
factors are all factors related to performance ergonomic compatibility and physical endurance
of workers. These factors involve: fatigue, physical limitations, among others. The stored
information refers to the quality of information and motor skills of the worker, as for
example: knowledge of rules, experience, skills and memories of long and short term.
Regarding the practical example given, the experience and skill of the worker can make a big
difference, because once present, it is possible that the level of stress felt by the worker is
irrelevant, not compromising their level of attention. Therefore, the information stored may
affect the assessment that the worker makes the situation after having realized a new input of
information. Psychological states (represented in mental status) and physiological states are
interdependent. For example, fatigue cans loss of vigilance. On the other hand, lack of
motivation can increase the level of fatigue. It is important to realize that external factors
affect all factors related to individual (psychological, mental status and stored information).
External factors involve environmental factors (physical access, discomfort of environment),
event conditions (software, hardware), organizational factors (environment work, availability
of tools), work team factors (leadership, unity, among others). The factors presented in Figure
8 can be classified as static or dynamic, depending on the context and applications. If the task
is performed in a relatively small period, one can consider that the psychological,
environmental constraints, organizational and group are static, while the internal factors
individuals are sensitive to changes in even short periods of time.
The most remarkable features of this technique are as follows:
Findings of the relevant areas of cognitive psychology, science behavioral
neuroscience, human factors, among others;
Consider the relationship of dependency between the majorities of PSFs; with the
exception of interdependent relationship between external factors, which also have a
relation of cause and effect, for example, the organizational can influence the quality
of team communication, as well as in equipment design. Likewise, the psychological
factors also have a relationship interdependence, which was disregarded in this model;
Do not allow to quantify the influence of two workers, not considering interaction;
Given the difficulty in using event trees to model the dynamic of a system, the influence of an
event in another is not considered. 1st and 2nd generation HRA techniques, as well as the
IDAC model presented deficiencies rendering them not sufficiently effective and need of an
evolution bring significant improvements to the human interface system. Therefore, it is clear
to model the existing causality in human action has become a major challenge for HRA over
33
Chapter 3
Human Error Overview
the years and therefore, the development of a methodology for assessing human reliability is
extremely necessary.
Human Reliability Analysis using Bayesian Networks (BBN)
In 2005 Menezês, R, C & Droguett, E. L. presented a model using Bayesian Networks to
quantify the human error. This model is presented here with more details.
It is clear that modeling of causalities in human actions has become a great challenge for
HRA. This model describes a methodology for modeling human actions through Bayesian
Belief Networks (BBN). The methodology provides a greater flexibility as not only allows for
a more realistic representation of the dynamic nature of man-system and man-man interface
under normal and abnormal process states, but also represents the relationship of dependence
among the events and performance shaping factors. It clearly models human actions, as well
as the methods used to build the network, with emphasis on the Bayesian networks
quantification mechanisms. The flowchart in Figure 9 systematically presents a methodology
for HRA.
Figure 9: Flowchart of methodology. Source:Menezês & Droguett (2005)
The mains processes are described as follows:
Familiarization with the intervention procedure: this step corresponds to obtaining the
necessary knowledge about the intervention procedure to describe the task (the next step
flowchart). This knowledge is acquired through the study of labor standards of the company
and through observations of the procedure in practice. At this stage, the contest, i.e. conditions
or circumstances on which the intervention procedure occurs is also analyzed. From the
context are extracted factors that somehow alter the performance of the workers involved in
the intervention, these are the PSFs.
Construction of the HTA: the information acquired in the previous step, related to the
intervention procedure will be described and organized by HTA (Hierarchical Task Analysis),
which is a methodology that systematically describes tasks. The above steps comprise the
34
Chapter 3
Human Error Overview
initial phase of this method that is, collecting information and analysis. The next steps
correspond to the qualitative analysis of information received through the modeling of human
actions via Bayesian Networks (BN).
Construction of the dynamic Bayesian Network regarding the relevant HTA steps: this
step will be identified the critical steps of HTA in terms of danger to the workers involved.
From these steps, will be build the dynamic Bayesian Network of the task, which represents
the actions of workers through different scenarios and sequences, while allowing a
visualization of the interaction between them.
Identification of the likely human error: through the constituent’s scenarios of the Bayesian
Network of the task and knowledge gained in the initial phase, it is possible to identify the
probable errors of each worker, as well as the consequences associated with them. This
identification enables a better understanding of the behavior of workers, allowing through the
reported probable human error, are known their likely causes.
Identification of relevant PSFs: once identified the likely human errors is possible to
identify the probable factors responsible for such errors. At this stage, will be identified each
relevant PSFs for each worker involved.
Construction of Bayesian Network of PSFs: this step will be identified relationships cause
and effect between the factors selected in the previous step. Later, will be constructed a
Bayesian Network for each specific role assumed by workers in intervention. The next steps
correspond to the data collection for quantitative analysis by modeling of human actions via
BN.
Integrated model to quantify the likelihood of human error (HEP): this stage will be held
the integration of BNs from PSFs with the BNs of the task. So, each worker represented by a
node in the BN of the task will have his/her BN regarding his/her relevant PSF. Later there
will be the “eduction” process to obtain the conditional probabilities needed to mains supply
for the intergraded model.
Interpretation of results: data from the “eduction” process will be modeled to obtain the
HEPs, which will be interpreted in this step.
35
Chapter 3
Human Error Overview
3.3. Human Error Taxonomy
One of the main challenges to analyze the occurrence of human error is the need of a formal
language to standardize the concepts, i. e. a framework to link common code between
multiple projects. In fact, it is the main target when developing taxonomy. The subject of
interest is thus to homogeneously classify errors to provide adequate data to be compared
and/or aggregated for analytical studies. In an effort to evolve with this theme, Rasmussen
(1982) presents a framework to discuss the worker behavior characteristic, during a
performance task, in three domains:
Skill-based, tasks that require manual skills; “In the skill-based domains, including
automated, more or less subconscious routines, performance is controlled by stored patterns
of behavior in a time-space domain. Errors are related to variability of force, space or time
coordination”;
Rule-based, tasks based on predefined procedures, require training; “The rule-based domain
includes performance in familiar situations controlled by stored rules for coordination of
subroutines, and errors are typically related to mechanisms like wrong classification or
recognition of situations, erroneous associations of tasks, or to memory slips in recall of
procedures”;
Knowledge-based, complex tasks, require decision and attention; “The third behavioral
domain is called upon in case of unique, unfamiliar situations for which actions must be
planned from an analysis and decision based on knowledge of the functional, physical
properties of the system and the priority of the various goals. In this domain, the internal data
processing functions used for the task are very person and situation dependent and vary with
details in the task context, with the extent and type of knowledge immediately available to the
person, and with his/her subjective preferences. In general, errors in this domain can only be
defined in relation to the goal of the task and generic error mechanisms can only be defined
from very detailed studies based on verbal protocols which can supply data on the actual data
process”.
This taxonomy proposed by Rasmussen (1982) classifying the human error in three domains
had emerged as a promising way for classifying these kinds of events. However, a criticism to
be made to such alternative concerns of this generality in the sense that the resulting
classification does not achieve the causes of human error, an important information for
dealing with complex systems like the power ones. It was yet necessary a deeper analysis to
understand the worker behavior during a performance task that produced a human error in an
intervention in power hydroelectric systems, for instance.
36
Chapter 3
Human Error Overview
In response to this claim, in 1990, Reason presented a classification deeper than the
Rasmussen’s one. He proposed a taxonomy based on the worker behavior during a
performance task based on cognitive characteristics. “Three distinctions have proved useful in
identifying the various origins of less than adequate (LTA) performance. Such distinctions are
also important since different types of human error have different psychological origins,
occurring in different parts of the system, and requiring different methods for remediation”
according to Reason and Maddox (2005). Reason firstly proposes two ways in which this
error can occur: slips and mistakes.
Slips: “First, the plan of action may be perfectly adequate, but the actions do not go as
planned. That is, we planned to do the right thing, but something happened that prevented us
from doing it properly. Some necessary act(s) may be omitted or an unwanted act(s) may
intrude. Alternatively, the right actions can be carried out, but in the wrong order, or in
relation to the wrong objects, or poorly timed, or clumsily executed. These are execution
failures and are commonly termed slips, lapses, trips, or fumbles” according Reason and
Maddox (2005).
Mistakes: “The second potential locus of error is in the planning itself. Actions may go
entirely as planned, but the plan itself is not adequate to achieve its intended outcome. These
are higher-level failures, termed mistakes, associated with the formulation of the plan.”
according to Reason and Maddox (2005).
“Slips and lapses are errors which result from some failure in the execution and/or storage
stage of action sequence, regardless of whether or not the plan which guided them was
adequate to achieve its objective”, Reason (1990). The main difference between slip and lapse
is that whereas slips are observable as externalized actions not as planned, lapses involve
failures of memory. “Mistakes may be defined as deficiencies or failure in the judgmental
and/or inferential process involved in the selection of an objective or in the specification of
the means to achieve it, irrespective of whether or not the actions directed by this decisionscheme run according to plan” Reason (1990). Derivate in large part from Rasmussen’s
classification, Reason proposed a conceptual framework – the generic error modeling system
(GEMS), integrating the skill-rule-knowledge classification from Rasmussen with the sliplapse-mistake from Reason. Using this framework, Reason subdivides the human error
behavior in a sort of deeper modes of failure to characterize the error. Reason and Maddox
(2005) define modes of failure: “in that errors arise from being in the wrong control mode
with respect to current demands of the task. That is, the higher levels of the cognitive system
are running open-loop (in relation to the moment-to-moment control of the actions) when they
should have been closed-loop, and conversely”. Analyzing the worker behavior when he is
37
Chapter 3
Human Error Overview
erring, it is possible to classify this behavior according to the Reason’s framework. See
table 3.
Table 3: Human Error taxonomy by Rasmussen/Reason source: Reason (1990)
Domain
Type
Failure modes
Skill-based
Slip
Double
Descriptions
capture Performing a routine task or in a family
slips
environment, at the time of decision making,
some external or internal event diverts attention
from the operator who makes the decision
automatically, by force of habit.
Slip
Omission
When performing a routine task, the operator is
following
interrupted by an event and when he returns to
interruptions
resume what he was doing, he can not remember
at what point he was before the break, failing to
execute a step.
Slip
Slip
Slip
Reduced
of The operator has a goal to achieve, but for some
intentionality
reason, he forgets the proposed objective
Perceptual
Operators perform tasks without paying due
confusions
attention to what they are doing
Interference
Is presented in the form of "mixing" of speech,
errors
action or implementation of actions within the
same sequence, producing a behavioral mixture
Slip
Omissions
The operator, while performing a task, omits the
next step that he should perform for the task, or
he can omit all the accomplishment of the task
from a certain point. This usually occurs when
he failure checking the state between two
actions. This is required to determining when
the first action is completed and the next should
start.
Slip
Repetitions
This type of behavior occurs when an error is
assumed that a task is not as long as it really is
and the step between the assumed location and
the current location (within the sequence of
38
Chapter 3
Human Error Overview
action) is repeated.
Slip
Inversions
The
original
sequence
of
the
task
is
reversed.
Rule-based
Mistake Firsts exceptions
In the first time that the operator is faced with
an exception to the general rule that he had
always used, and as the general rule has been
applied successfully in the past, he tends to
apply it to the situation exception, leading to
error.
Mistake Sings,
The operator is faced with ambiguous situation,
countersigns and as the presence of correct signals to trigger a
non signs
given action, as also countersigns, to not trigger
and also to the lack of signs, sometimes
simultaneously, which leads to error.
Mistake Informational
overload
The abundance of information is sometimes
undesired, because the local state indication
almost invariably exceeds the operator cognitive
system ability to apprehend them, which can
lead to error.
Mistake Rule strength
When a rule, this rule became a strong rule, and
the operator can trigger this rule when some but
not all conditions are satisfied.
Mistake General rules
General rules are likely to be stronger
Mistake Redundancy
It has long been known that the acquisition of
human skills depends critically upon the gradual
appreciation of the redundancy present in the
informational input. In fact, certain sequences or
grouping
of
signs
tend
to
occur
with
redundancy, and this can lead to error.
Mistake Rigidity
The operator tends to reapply, over and over, a
rule that achieved successful outcomes at the
past.
Mistake Encoding
deficiencies
Certain properties of the problem space are not
encoded at all.
39
Chapter 3
Human Error Overview
Certain properties of the problem space may be
encoded inaccurately;
An erroneous general rule may be protected by
the existence of domain-specific exception
rules.
Mistake Action
deficiencies
Wrong rules;
Inelegant rules are performed even when best
rules are availed;
Inadvisable (imprudent) rules lead to dangerous
risks of accidents.
Knowledge-
Mistake Selectivity
based
Mistakes will occur if attention is given to the
wrong features or not given to the right features.
Slip
Workspace
The conscious workplace has finite resources.
limitations
The load or cognitive strain imposed upon the
workspace varies critically with the form of
problem presentation.
Mistake Out of sight, out The operator sometimes gives undue weight to
of mind
facts that come readily to mind, otherwise
ignores facts which are not immediately present
Mistake Confirmation
A current hypothesis is put apart in the face of
bias
contradictory evidence and produces ambiguity
that favors one available pre-interpretation.
Mistake Overconfidence
The operator will tend to justify his chosen
course of action by focusing on evidence that
favors it and by disregarding contradictory
signs.
Mistake Biased reviewing
The check-off illusion. The operator imagined
that he checked all different factors, but he
didn’t.
Mistake Illusory
correlation
Mistake Halo effect
The operator is poor at detecting many types of
co variation
The
operator
has
difficult
in
processing
independently two separate orderings of the
same people or objects.
40
Chapter 3
Human Error Overview
Mistake Problems
of The operator tends to oversimplify causality.
causality
Mistake Problems
complexity
with Problems with delayed feed-back, lends the
operator has a confusion between tasks and
facts;
Insufficient considerations of process in time,
subjects were more interested in the way things
are now than in considering how they had
developed over previous years;
Difficulties with exponential developments
Thinking in causal series not causal nets
Thematic vagabonding, this involves flitting
from issues to issues quickly, treating each one
superficially
Encysting, this seems to be exact opposite of
vagabonding, some topics are treating over and
small details, instead other more important are
disregarded
Mistake Problems
of The root of the problem in diagnosis appears to
diagnosis
be located in the complex interaction between
two logical reasoning tasks
In 1998 Hollnagel (1998) presented a new HRA technique (CREAM) in order to overcome
some limitation from previous techniques. The main limitation was binary representation of
human actions, and context-dependence actions. Therefore, the method is an attempt to
generalize trees of events through a categorization polychotomous to quantify more explicitly
the influence of factors on the performance workers. The CREAM taxonomy describes the
relationship between causes and manifestations. Causes represent the description of the
occurrence of effects and expressions refer to everything what is observed. Regarding the
causes, the classification scheme is described in three levels:
1. Individual: consists of causes that are associated with personality characteristics,
psychological workers;
41
Chapter 3
Human Error Overview
2. Technological: ergonomic factors, and includes everything that represents the state of
the components;
3. Organizational: consists of causes that characterize the organization, work
environment, the interaction between people and environmental conditions.
These three levels can be expanded to represent a more detailed analysis. The CREAM model
has two basic principles:
Competence: describes what the worker is able to perform;
Control: describes the ability of the worker in terms of level of control that it
has in certain situations.
The CREAM technique has two methods: The Basic CREAM method and the Extended
CREAM method. In Basic CREAM, a task analysis is carried out prior to further assessment.
Common Performance Conditions (CPCs) are assessed according to the descriptors given in
Table 4 to judge their expected effect on performance. However, these assessments are then
adjusted according to some specified rules in order to take account of synergistic effects.
Finally, a simple count is performed of the number of CPCs which are improving reliability
and the number that are reducing it. On the basis of this number, the probable control mode is
determine, by determining the region given in Bedford, Bayley and Clare (2008). The
Extended CREAM method works slightly differently. Given the task analysis, a cognitive
activity is associated to each of the tasks (taken from a standard list which includes activities
such as co-ordinate, communicate, compare, etc). This model consists of the Simple Model
Cognition (SMoC) and Contextual Control Model (COCOM). The SMoC has these follow
fundamental characteristics:
1.Distinguishing between observation and inference, emphasizes the need to distinguish
clearly between what can be observed and what can be deduced from observation;
2.Cyclical nature of cognitive action, cognitive functions mean that if both extend to a
context of past events and anticipate events future.
42
Chapter 3
Human Error Overview
Table 4: Common Performance Conditions source: Hollnagel (1998)
COCOM has four control modes:
1. Scrambled control: situation of danger where there is little or no correspondence
between the situation and action. The actions are chosen randomly little or no
cognitive reflection involved;
43
Chapter 3
Human Error Overview
2. Opportunistic control: choice of inefficient actions, where the worker can master the
situation somewhat because of his ability and experience;
3. Tactical control: the worker’s performance is based on rules, where the same has a
reasonable knowledge.
4. Strategic control: optimal control, where the worker has the most robust and efficient
performance based on his knowledge and his ability.
Through four levels of the COCOM, it is possible to question if the worker maintains or lose
control in certain situations and predict the expected level of reliability performance,
according to Bedford, Bayley and Clare (2008). The mechanics of the calculation imply that
the CPCs play a role in scaling a basic probability up or down. Hence in Extended CREAM,
the CPC acts mathematically rather like a Performance Shaping Factor does in other methods,
by adjusting a nominal probability. This implies that while CPCs determine the absolute level
of failure probability in Basic CREAM (through the determination of the control mode), they
determine the relative level of failure probability in Extended CREAM. This is a major
difference between the two methods. Another major difference is that within Basic CREAM
the underlying task analysis does not appear to play a role in determining the control mode:
the control mode only depends on the CPC values. Note that Hollnagel (1998) also describes
what might be called a simplified-extended version of the method in which the adjustments to
nominal probabilities are determined through the control mode.
It should be made clear that Hollnagel presents the numbers he provides – weights and
probabilities – as plausible rather than as definitive. (Indeed, the qualitative classes are
provided on the same basis with acknowledgement that other categories would be required to
model HRA problems outside the environment that he has worked in.) Hence, our exploration
of the consistency of Basic and Extended CREAM contributes to a discussion of what
adjustments could be considered.
44
Chapter 4
New Taxonomy and Model of Error Sequence Process for Human Error Assessement
4. NEW TAXONOMY AND MODEL OF ERROR SEQUENCE PROCESS
FOR HUMAN ERROR ASSESSEMENT
This chapter presents a new taxonomy to classify human errors using the concepts proposed
by Rasmussen and Reason and the classification of elementary behavior proposed by
Berliner. The combination of these concepts builds a new taxonomy that classifies human
error of the worker when he/she is performing an intervention (operator/maintenance) in
hydroelectric power systems.
Next is presented a model that describes the mental sequence of the error process, when the
worker performs without success an intervention on hydroelectric power systems, and the
cause of this unsuccessful intervention was characterized as human error.
4.1. The Proposed Taxonomy
The knowledge of error failure mode, according to the taxonomy proposed by Reason (1990),
says nothing about the elementary behavior of the worker during the failed action. What
action the worker was doing when the error occurred? Was he/she verifying? comparing?
locating? It is necessary to add this elementary behavior that caused the human error, in the
taxonomy proposed by Reason (1990), to get a deeper level of detail. This knowledge of the
elementary behavior is necessary to complete the diagnosis of the human error on
hydroelectric power systems.
Berliner (1964) proposed a taxonomy to classify elementary behavior (see Table 5). In this
table, Berliner proposes 32 verbs, divided in a set of 4 process, which define the type of task
the worker was performing during the intervention on hydroelectric power system.
The proposed taxonomy is presented in Figure 10. It consists on the hybridism of the
taxonomies proposed by Rasmussen, Reason and Berliner. Figure 10 shows, in sequential
order, all terms necessary to classify a human error, during an intervention
(operaton/maintenance) in a hydroeletric power systems.
45
Chapter 4
New Taxonomy and Model of Error Sequence Process for Human Error Assessement
Table 5: Berliner Taxonomy
TASK
To solve
problems and
to make a
decision.
To process
information.
To look for
and to receive
information
To identify
objects,
events and
actions
Simple/
discrete
Complex/
continue
COGNITIVE PROCESS
ELEMENTARY BEHAVIOR
DEFINITION
To solve a problem using math process.
Calculate
To select after considering all options.
Chose
To get a conclusion based on a disposal information.
Decide
To examine the characteristics or qualities of two or more
Compare
objects or concepts, aiming to identify similarities or differences.
To determine or to estimate intermediate values among two
Interpolate
given values.
To confirm.
Verify
To hold information (short term memory) or to recover
Remember
information (long term memory).
PERCEPTIVE PROCESS
To examine carefully, and to see with critical sense.
Inspect
To take conscious visually the presence or state of an object,
Observe
indication or event
To examine visually the information presented in symbolic form.
Read
To follow up the process during a period of time.
Monitored
To examine quickly displays to get a general impression.
Explorer
To take conscious of presence/absence of physical stimulus.
Detected
To acknowledge the nature or indication of an object, according
Identify
to its implicit or predetermined characteristics.
To look for and determine the object’s right place.
Located
Move
Hold
Push/Pull
Give
Remove
Discard
Give back
Position
Adjust
Typing
Install
Answer
Inform
Request
Register
Order
Receive
MOTOR PROCESS
To change the position of an object.
To apply a continue pressure over a control.
Exert force for far/near the body of agent.
Placed an object in possession of another person to use it.
Highlight and move out of position.
To take off an object unusual or unnecessary.
To return an object to its owner.
Operate a control that has states discrete
To operate a continue control.
To type on a keyboard.
Put in place or position indicated
COMUNICATION PROCESS
To answer a requested information.
To disclose an information.
To request information.
To document something, in written form.
To order an action.
To be an information target.
This taxonomy presents five words, which classify human error committed by a worker. The
five words, one in each block, are chosen by the analyst in the blocks of Figure 10, according
to RDFH (Relatorio de Desligamento por Falha Humana). The first block is the Berliner
Process. One of the four words is chosen according to the task. If the worker needs to solve
problems and make a decision or to process information, the analyst chooses cognitive
process. If the worker needs to looking for and to receive information or needs to identify
objects, events and actions, the analyst chooses perceptive process. If the worker needs to
perform motor tasks as move, adjust etc, he/she chooses motor process. If the worker needs to
perform communications tasks as answer, request, order etc, he/she chooses communication
46
Chapter 4
New Taxonomy and Model of Error Sequence Process for Human Error Assessement
process. The second block is domain. One of the three words is chosen according to the
standardization of the task. If the task is unique, it is written step by step, the worker does not
choose between several tasks, he/she choose the domais of skill. If tasks are written step by
step but the worker needs to choose between several similar tasks, he/she chooses the domais
of rule. If the task is not written, the worker needs to create a specific task for the event, and
he/she chooses the domais of knowledge. The third block is elementary behavior. Elementary
behavior is connected with the Berliner process. Each Berliner process has a set of elementary
behaviors. Elementary behavior is a set of 32 verbs that define the action of the worker at the
time of execution of the task. The analyst chooses elementary behavior according to the task
being performed by the worker and the Berliner process already chosen. The fourth block is
failure mode. Failure mode is connected with domain. Each domain has a set of failure
modes. The analyst chooses failure mode according to the human error committed. The fifth
block is error type. Error type is connected with domain and failure mode. The analyst
chooses error type according to domain and failure mode.
The company that was studied in this thesis presents human error events in descriptive reports
called RDFH (Human Error Shutdown Report). See Annex 1 to 7 for examples. Next, it will
be presented how these reports (RDFH) are prepared. Examples of how to build the proposed
taxonomy via the analysis of RDFH will also be presented.
This more comprehensive classification allows the analyst to build a table with the human
error description and classifications of a set of occurrences collected in the field about
interventions (operaton/maintenance) on the hydroelectric power system that resulted in
shutdown (blackout) caused by human error. This new taxonomy does not use Performance
Shaping Factors (PSFs). In Menezes & Droguett (2005), an attempt was made for the
application of PSFs to the quantification of human error in cases of replacement string
insulators in transmission lines, and the difficulties were too great. In hydroelectric power
companies, data about the influence of PSFs in human error generally are scarce when mostly
non-existent. Additionally, most companies have difficulties to talk about human errors.
These give rise the difficulty in building a human error database delivered for all interested in
human error research. In order to illustrate as well as analyze the proposed taxonomy, it is
useful to get with a real case.
Indeed, by using the proposed taxonomy and data collected (RDFHs) from a Brazilian
Hydroelectric Power Company, a table with 131 real cases was built. See Annex 8 and
Annex 9.
This table with the collected human error, forms a data base that allows to
statistically explore the reasons and outcomes of these human errors. This statistical analysis
could show possible sources of bias, correlation and allow to look for answers that can point
47
Chapter 4
New Taxonomy and Model of Error Sequence Process for Human Error Assessement
to possible changes of procedures to reduce human error. Applying descriptive statistics to
this table (see Annex 9) it is possible to infer recurrent features of human error that can be
worked out internally in the organization to minimize the outcome of power electric system
interruptions during required interventions.
Berliner Process
Cognitive
Domain
Elementary Behavior
Skill
Calculate
Choose
Decide
Compare
Interpolate
Verify
Remember
Inspect
Observe
Read
Monitored
Explorer
Detected
Identify
Located
Perceptive
Rule
Motor
Knowledge
Communication
Failure Mode
If Skill:
Double capture slip
Omission following interruptions
Reduced of intentionality
Perceptual confusions
Interference errors
Omissions
Repetitions
Inversions
If Rule:
First exceptions
Sings, countersigns, no signs
Information overload
Rule strength
General rules
Redundancy
Rigidity
Encoding deficiencies
Action deficiencies
Move
Hold
Push/pull
Give
Remove
Discard
Give back
Position
Adjust
Typing
Install
Error type
Slip
Mistake
If Knowledge:
Selectivity
Workspace limitations
Out of sight out of mind
Confirmation bias
Overconfidence
Biased reviewing
Illusory correlation
Halo effect
Problems of causality
Problems with complexity
Problems of diagnosis
Answer
Inform
Request
Register
Order
Receive
Figure 10: The proposed taxonomy
4.1.1. How human error data were collected
The following describes the data collection in a power hydroelectric company according to
the proposed taxonomy. Additionally, examples are presented to show how to apply the
taxonomy to real cases. First it is describes how the human error data were collected; how
the human error reports (RDFH) were analyzed and how the table Summary of Occurrences,
in Annex 9 was built, using the proposed taxonomy.
A Brazilian hydroelectric power company has collected and classified human errors since
1998. The resulting data has been used as a decision index to formulate its non-interrupted
48
Chapter 4
New Taxonomy and Model of Error Sequence Process for Human Error Assessement
system safety policy. Discontinuities in the hydroelectric power system are penalized with
fines by the regulatory agency (ANEEL). These fines are of high values and proportional to
the time of power system interruption and the interrupted load. In this context, the human
error represents an important index about the quality of the energy offered to consumers.
These human error reports (RDFH) are recorded in a private data base. From 1998 to 2009,
there are 605 available
reports relating human errors in hydroelectric power system
interventions. Each human error in complex systems such as the hydroelectric power systems
must be analyzed so that the error mechanisms are understood. As it is not possible to analyze
all available records in a time effective way, it is necessary to choose the main events to apply
the proposed taxonomy. Each of the 605 human error reports were analyzed and 474 of them
did not cause load interruption as, for example, the load was immediately transferred to other
power source or the load did not energize, or it was released for maintenance. These 474
human errors reports were not considered because they do not represent significant losses for
the company. On the other hand, the 131 remaining human errors (see Table 6), caused load
interruption due to human error. One by one these 131 human errors reports were analyzed in
detail and classified according to the proposed taxonomy (See Annexes 8 and 9).
Table 6: Number of Human Errors x Year
YEAR
NUMBER OF
HUMAN ERROR
2009
2008
2007
2006
2005
2004
2003
2002
2001
2000
1999
1998
Total
31
27
38
56
49
54
62
57
43
75
49
64
605
NUMBER OF HUMAN
ERROR WITH LOAD
INTERRUPTED
6
6
10
11
13
14
12
10
11
19
14
5
131
LOAD INTERRUPTED
DUE HUMAN ERROR
(MW)
1.009,12
99,26
386,91
656,47
799,63
947,08
596,54
1.572,20
584,92
836,90
740,26
515,90
8.745,19
The human error report is elaborated by an expert group. They analyze the undesirable event
going in loco; interviewing the employees involved; analyzing the power system
configuration; analyzing sequences of causes and effects and after that, by writing a report.
These reports are written with strong technical language with terminology of electrical
engineering and hydroelectrical power systems. This way, it is difficult for an electric power
system outsider to be able to analyze these reports. The information is posted on the reports in
49
Chapter 4
New Taxonomy and Model of Error Sequence Process for Human Error Assessement
discursive form without fixed fields to fill, so each report has its own features. As a result, it
is difficult to built a database to statistically study the undesirable events.
The company does not use a taxonomy to classify the human error type. This fact makes it
difficult to analyze the root causes of the failure event to prevent new undesirable events.
Sometimes the specialists use an Ishikawa diagram as in Ishikawa (1993) to find causes about
the failure event, but this step is not standardized. Without a taxonomy it is impossible to
classify the human errors and find the biases, trends and similarities among events. Another
important point is that the company only registers human error, building RDFH, when this
error causes shutdown. Human errors that only caused incidents are not registered. Thus
important information about the human behavior is lost and a indeep analysis is not possible.
Analyzing the reports recommendations it can be seen that they are mainly of three types:
safety engineering solution using devices to block the possible erroneous action, or changes
on procedures or electrical configuration to avoid the human erroneous behavior, or
enhancing the training program to employees. Each human error report has the follow
information about the system configuration:
An event description: with date, time, place and a summary description of the human
error;
Electrical System configuration;
Historical occurrence: with the task describes step by step and on chronological
sequence;
Relevant facts and data about the event;
Task analysis;
Discursive analysis of the performance of the teams involved;
Ishikawa diagram;
Action plan to avoid the repetition of this event;
Conclusions
Name and signature of experts responsible for drafting the report.
These reports have enough information to enable an expert on electrical engineering to know
the real cause of the human error.
Each of the 131 RDFH was analyzed and based on the proposed taxonomy Annex 9 was
built. From the classification built in the last column of the table in Annex 9, the table in
Annex 8 was built, which is the basis for the descriptive statistical analysis presented in the
50
Chapter 4
New Taxonomy and Model of Error Sequence Process for Human Error Assessement
next chapter. To illustrate how the analyzes were performed under the new taxonomy, two
real cases extracted from “Summary of Occurrences” (see Annexes 8 and 9) are presented.
4.1.2.How to perform the proposed taxonomy
Example 1: The operator shut off the 12J1 circuit breaker instead of the 12J2 circuit breaker
in the same panel.
Report error n. 046 April, 20 2001, load interrupted 8,00MW.
Summarized description:
After the team had completed the maintenance, the responsible team (leader) began the
process of concluding the intervention (maintenance) and return of equipment to normal
operation. The operator on the substation was ordered by the responsible team maintenance to
perform maneuvers re-energizing the circuits that were under maintenance. The operator left
the substation control building and went to the fenced enclosed area and performed the
procedure inspection standards. Then back to building control, the operator initiated the reenergizing of circuits, closing circuit breaker 12J2. The operator has confirmed the closure of
the breaker 12J2 observing the corresponding signaling panel. The responsible team (leader)
for the maintenance, hearing the noise characteristic of the circuit-breaker closing, signalized
for the operator, confirming the close of the circuit breaker. Then the operator went to the
panel 12J1, (identical to the neighbor 12J2), made the opening of 12J1, committed an human
error (thinking that he is opening 12J2), confirmed the signs on the panel and got a positive
sign of the maintainer (which also had moved into the control building), and once again heard
the characteristic sound of the circuit breaker opening. The operator recorded the time (16:15
h), signed the card confirming receipt of the breaker, and consulted the program maneuvers
normalization of 12J2. At this moment, the operator received a call from CROL (central
control) questioning what was going on in the installation, because there was a complaint of
COSERN (costumer) about the lack of tension in the city of Tangará. At this moment, the
operator became aware that he had opened the wrong circuit breaker.
Using the Proposed Taxonomy
In according to Table 5, the operator used the perceptive process (to identify objects, events
and action), in order to identify the breaker to shutdown. Then he noticed that the rule was
written and mentally he decided to use the skill-based domain to perform the task. When the
operator mentally decided to perform the task, he had a perceptual confusion: perform task
without paying due attention to what they are doing and committed a slip, and the task was
performed without success. Figure 11 presents the taxonomy of these example. This Figure 11
51
Chapter 4
New Taxonomy and Model of Error Sequence Process for Human Error Assessement
presents five words that classify human error committed by the operator in the example
presented. Analysing Figure 11, it is known that a slip was committed, due to a perceptual
confusion, that is a failure concentration of identify the correct circuit breaker should be open.
As this maneuver is routine, there was a written rule to be followed by the operator, so he was
in the domain of skill. The operator performed the rule correctly, however he wrongly
identified the circuit breaker. Since the elementary behavior of the operator was “identify”, he
mentally chose the perceptive process to perform the task.
Perceptive
Skill
Identify
Perceptual Confusion
Slip
Figure 11: Taxonomy for example 1
Example 2: the maintenance technician did not make correct rely adjust. When the operator
push the breaker bottom, occurred the interruption.
Report error n. 012 March, 03 1999, load interrupted 11,00MW.
Summarized description:
It was observed that the reason for automatic shutdown of the transmission line LT 02V6 was
the relay operation of low frequency. The underfrequency relay is calibrated to shutdown LT
when the frequency drops to a specified value during a certain time interval. This is to
protected them. Later inspection in the relay that disconnect the LT showed that the technical
of maintenance acted improperly adjusting the relay to operate in 5.0 seconds when the rule
recommended this relay set to operate in 11.0 seconds. The technical of maintenance also
observed that the relay was defective, not accepting adjustments in excess of 10.0 s. This
incorrect adjustment was made nearly three years before the shutdown of LT.
Using the Proposed Taxonomy
The worker used the Perceptive process (to identify objects, events and action) to identify the
relay to adjust. Then he perceived that the rule was written and mentally he decided to use the
rule-based domain to perform the task. When the operator mentally decided to perform the
task, he had a encoding deficiencies (certain properties of the problem space are not encoded
at all) and committed a mistake and the task was performed without success. Figure 12
presents the taxonomy of this example. This Figure 12 presents five words that classify
human error committed by the technical of maintenance in the example presented. Analysing
Figure 12, it is known that a mistake was committed, due to a encoding deficiencies, that is a
52
Chapter 4
New Taxonomy and Model of Error Sequence Process for Human Error Assessement
failure observation of inspect the correct adjust of the relay. As this task is routine, there was
a written rule to be followed by the technical of maintenance. The operator chose the incorrect
rule. He was under the domain of rule. Since the elementary behavior of the technical of
maintenance was “inspect”, he mentally chose the perceptive process to perform the task.
Perceptive
Rule
Inspect
Encoding Deficiencies
Mistake
Figure 12: Taxonomy for example 2
4.2. Model of Error Sequence Process
As seen in Annex 8 and Annex 9, the proposed taxonomy satisfactorily translates the
information in the RDFHs. However, only the taxonomy is not sufficient to show the
sequence of mental events and the relations of cause and effect that can lead a worker to
commit human errors in the operation and maintenance of power hydroelectric systems. The
model proposed here is based on the taxonomy discussed in Section 4.1, and shows the
sequence of mental choices and the relations of cause and effect between the five words
chosen by the analyst, which are made by the worker from the moment he becomes aware of
the task that he will have to perform. This sequence of choices may lead the worker to
perform the task successfully or a human error.
Figure 13 shows the proposed model of the sequence of mental choices which the worker
performs.
Berliner Process
Domain
Elementary Behavior
Failure Mode
Error type
Figure 13: Error sequence process
The first step is when the worker becomes aware of the task he ought to perform. Mentally he
chooses one of the 4 Berliner Processes: Cognitive; Perceptive; Motor or Communication.
Cognitive is when the worker needs to solve problems and to make a decision or to process
information. Perceptive is when the worker needs to look for and to receive information or to
identify objects, events and actions. The Motor process is when the worker needs to move,
hold, push/pull, give, remove, discard, give back, position, adjust, type or install.
Communication is when the worker needs answer, inform, request, register, order or receive.
Then, the worker mentally decides what domain he chooses to perform the task. For this the
53
Chapter 4
New Taxonomy and Model of Error Sequence Process for Human Error Assessement
worker has to mentally follow the flow diagram shown in Figure 14. In sequence, worker
mentally decides what elementary behavior he will use to perform the task. Elementary
behavior is an internal decision of the worker and is linked to the Berliner process already
decided by the worker. If the worker chooses a wrong or inadequate elementary behavior, the
task will probably not be performed and usually the worker corrects the choice and starts
again the process. According to the diagram shown in Figure 14, if the rule was correctly
written or it was correctly created and the worker performed the rule correctly, the task will be
performed with success. If not, a latent failure or three types of error could be committed:
54
Chapter 4
New Taxonomy and Model of Error Sequence Process for Human Error Assessement
Figure 14: The paths of human error
1. Latent failure: There was a written rule, worker does not choose a rule, worker
performed the rule correctly but the rule was written incorrectly;
2. Skill-based slip: there was a written rule, worker does not choose a rule, rule was
correctly written, worker performed the rule incorrectly duded a failure mode;
3. Rule-based mistake: there was a written rule, worker chooses a rule, worker chooses
incorrect rule;
4. Knowledge-based mistake: there was not a written rule, worker creates a new rule,
and this new rule is a wrong rule.
It is important to note that this entire model is totally mental, i.e. it starts and ends in the
worker’s mind. The materializing of error that produces an undesirable event happens after
the worker has decided to commit the error mentally, but the consequence of these decision
55
Chapter 4
New Taxonomy and Model of Error Sequence Process for Human Error Assessement
remains undesirable. The failure mode causes a confusion of mind, which decouples the
decision to take the wrong action of consequence of error, causing an undesirable
consequence. Both error type, slip and the mistake, are caused by failure modes at the time the
worker will perform the task. The probability of a given failure mode occurrence for a given
task within this model of sequence error is quantified using Bayesian networks in Chapter 6.
To illustrate these concepts and clarify the model, the next section presents some examples
taken from real cases.
4.2.1.How to perform the proposed model
Example 1
Report error n. 046 April, 20 2001, load interrupted 8,00MW.
Summarized description: The operator of the substation following the general program of
maneuvers made improper shutdown of circuit breaker 12J1when he had to turn off breaker
12J2 which is positioned near 12J1 on the same electric panel.
The detailed analysis of this event revels that:
1. The operator was conducting a program of maneuvers previously elaborated by a
team of engineers;
2. This program about appropriate step asks the operator to shutdown breaker12J2;
3. Shutdown of a circuit breaker is a step of the maneuver program;
4. Shutdown of a circuit breaker is a maneuver that the operator knows how to make,
and has made many times during his professional life;
5. The operator read the step which he has to shutdown breaker12J2;
6. The operator perceived that he had to go to the appropriated electric panel and he did
it;
7. The operator looked the electric panel, and saw breaker12J2;
8. The operator decided to shutdown breaker12J2;
9. The operator had a perceptual confusion and positioned his hand in front of breaker;
12J1
10. The operator shutdown breaker 12J1 committing a slip.
Comments:
The operator had a perceptual confusion reading incorrectly the maneuver
program and/or simply confounding the codification or positioning of the
breaker on the electric panel;
56
Chapter 4
New Taxonomy and Model of Error Sequence Process for Human Error Assessement
The codification is 12J1 and 12J2 so that it is easy to make confusion;
12J1 is positioned next to 12J2 on the electric panel;
The maneuver program was correct;
The rule to shutdown breakers was correct, and the operator choose the correct
rule;
Sequence of error process:
Figure 15 shows sequence of error process for example 1.
Berliner Process
Perceptive
Domain
Elementary Behavior
Skill
Identify
Failure Mode
Perceptual Confusion
Error type
Slip
Figure 15: Sequence of error process for example 1
The operator used the Perceptive process (to identify objects, events and action) to identify
the breaker to shutdown, then he perceived that the rule was written and mentally he decided
to use the Skill-based domain to perform the task. When the operator decided to perform the
task, he had a perceptual confusion (perform task without paying due attention to what they
are doing) and committed a slip and the task was performed without success. Figure 15 shows
the taxonomy and model to example 1.
Example 2
Report error n. 007 May, 26 1999, load interrupted 9,54MW.
Summarized description:
The responsible for the intervention detected a fault in the
supervision circuit: “abnormality of breaker and disconnector”. Then in order to correct the
problem, he pressed the relay 62X of the protective chain of LT04L1, causing the
abnormality.
The detailed analysis of this event revels that:
1. The worker was conducting a program of maintenance previously elaborated by a
team of engineers;
2. The worker detected an abnormality in the supervisor circuit;
3. This abnormality was not part of the maintenance program;
57
Chapter 4
New Taxonomy and Model of Error Sequence Process for Human Error Assessement
4. The worker decided to correct the abnormality;
5. The worker based on his experience and for rule strength, chose a rule to correct the
abnormality;
6.
The worker chose a wrong rule committing a mistake.
Comments:
The worker trusting in his expertise, used a rule that he figured that was the
correct rule to correct the abnormality.
The rule chosen by the worker was not part of the maintenance program;
The worker knew all rules to perform the task
Sequence of error process:
Figure 16 shows sequence of error process for example 2.
Berliner Process
Perceptive
Domain
Rule
Elementary Behavior
Failure Mode
Observe
Error type
Rule Strength
Mistake
Figure 16: Sequence of error process for example 2
The worker used the Perceptive process that is: to look for and to receive information, to
observe an abnormality on supervision circuit, then he knew that there was a written rule that
he mentally decided to use the Rule-based domain to perform the task. When the operator
decided to use a rule already known to perform the task, he was victim of the failure mode
named rule strength that is: a rule became a strong rule, and the worker can trigger this rule
when some but not all conditions are satisfied and committed a mistake and the task was
performed without success. Figure 16 shows the taxonomy and model for example 2.
Example 3
Report error n. 035 July, 28 2000, load interrupted 52MW.
Summarized description: The lack of procedure of the mechanical maintenance and poor
identification terminals led the mechanic maintenance worker to wrongly connect hoses for
interconnection between the pumping unit and fixed pipes, generating a non-compliance
which was not detected by subsequent inspection of the operation, keeping the abnormality
that caused the shutdown of the generating unit.
58
Chapter 4
New Taxonomy and Model of Error Sequence Process for Human Error Assessement
The detailed analysis of this event revels that:
1. The worker was not conducting a program of maintenance previously elaborated by a
team of engineers;
2. The worker had a mission to make a maintenance;
3. The worker was a very experienced employee;
4. The worker did not consider the deficiency of terminals identification and worked
under ambiguity;
Comments:
The worker did not know a specific rule so, he improvised a rule to make the
maintenance of the unit;
The rule chosen by the worker was not part of the maintenance program;
Sequence of error process:
Figure 17 shows sequence of error process for example 3.
Berliner Process
Cognitive
Domain
Knowledge
Elementary Behavior
Decide
Failure Mode
Overconfidence
Error type
Mistake
Figure 17: Sequence of error process for example 3
The worker used the Cognitive process that is: to solve problems and to make a decision,
decided make maintenance, then he knew that there was not a written rule he mentally
decided to use the Knowledge-based domain to create a new improvising rule to perform the
task. When the operator decided to create a new rule to perform the task, he was a victim of
the failure mode named overconfidence that is: the worker tends to justify his choice of action
by focusing on evidence that favors it and by disregarding contradictory signs, and committed
a mistake and the task was performed without success. Figure 17 shows the taxonomy and
model to example 3.
Example 4
Report error n. 004 September, 08 1998, load interrupted 70MW.
Summarized description: After a complete shutdown of the substation, caused by an
explosion of the 11E2 breaker, the operator incorrectly performed the sequence of maneuvers.
59
Chapter 4
New Taxonomy and Model of Error Sequence Process for Human Error Assessement
The detailed analysis of this event revels that:
1. The substation after the explosion was completely shutdown;
2. The operator had to re-energize the substation immediately in the shortest possible
time;
3. There is a specific rule to re-energize the substation;
4. The operator knew the specific rule to re-energize the substation, he was trained for
that;
Comments:
When a substation is completely shutdown, the work climate is hard;
The pressure to immediately re-energize the substation is high;
The sequence of re-energization is not easy and has many steps
Sequence of error process:
Figure 18 shows sequence of error process for example 4.
Berliner Process
Perceptive
Domain
Skill
Elementary Behavior
Monitored
Failure Mode
Inversions
Error type
Slip
Figure 18: Sequence of error process for example 4
The operator used the Perceptive process that is: to looking for and to receive information, to
monitor the process of restoring power of the substation. He perceived that the rule was
written and mentally decided to use the Skill-based domain to perform the task. When the
operator decided to perform the task, he committed a failure mode named inversions that is:
the original sequence of the task is reversed, and committed a slip and the task was performed
without success. Figure 18 shows the taxonomy and model to example 4.
For more examples see Annex 9. Using this model it is possible to analyze the human error in
hydroelectric power systems. Of course, a team of experts to analyze shutdown events and
build the diagrams of sequence of error process is necessary. By building a data bank with
events, it is possible to understand the nature of human error on a specific company using
descriptive statistics as is described in Chapter 5, and using Bayesian networks it is possible
to know what failure modes are more probable for a given task, given a particular error
sequence occurs (as will be seen in Chapter 6).
60
Chapter 5
Descriptive Statistics using the New Taxonomy
5. DESCRIPTIVE STATISTICS USING THE NEW TAXONOMY
This chapter presents a statistic analysis of data collected from a Brazilian hydroelectric
power company. Data collected through the RDFH reports were classified according to the
proposed taxonomy and organized following the model of the sequence of error as presented
in Chapter 4. See Annex 8 and Annex 9. The statistical information was generated by a free
software named RTM (GNU project), and is presented through tables and graphs with
comments and examples showing trends, frequency, seasonality and contingencies.
In this chapter it was made use of a statistical software named RTM to provide a statistical
analysis of the data from the table put together from the human error reports collected and
organized following the proposed taxonomy and model of sequence of error.
It was designed an ExcelTM table using the data from the reports of human error collected
from a Brazilian power electric company. This table, see annex 9, has the follow fields: day,
month and year that a human error happened; time in minutes between the start of interruption
because of a human error and the recovery system; interrupted load in MW; error domain;
type of error; failure mode; Berliner process and elementary behavior.
Number of human errors
The following information in the form of tables and graphs were generated: frequency of
elementary behavior; frequency error type; frequency of Berliner process; frequency of failure
process; frequency of error domain; human error seasonality; domain annual seasonality; error
type annual seasonality; contingencies between failure mode and Berliner process and
contingencies between failure mode and elementary behavior.
From 1998 to 2009, the company registered 605 human errors, an average of 50.42 human
errors per year. The year of 2000 was the worse and had 75 human errors, whereas 2008 with
27 human errors was the best year. Figure 19 shows the number of human errors from 1998 to
2009. Analysing Figure 19, it is clear that the number of human errors during this period is
decreasing.
61
Chapter 5
Descriptive Statistics using the New Taxonomy
HUMAN ERROR
80
70
60
50
40
30
20
10
0
1998 1999 2000 2001 2002 2003 2004 2005 2006 2007 2008 2009
Figure 19 – Human Errors
Most human errors do not cause on important outcome, but some of them cause operational
discontinuity. These errors include interruptions output load and lost the electrical energy to
costumers. This fact is quite serious because the company image and financial resources are
involved. From the collected data, 131 of 605 human errors caused load interruptions in the
amount of 8,745.19MW. Only the 131 human error events with load interrupted were
considered. Figure 20 shows the some trend of Figure 19, i.e.: reduction of the number of
human errors per year.
HUMAN ERROR WITH LOAD INTERRUPTED
20
18
16
14
12
10
8
6
4
2
0
1998 1999
2000
2001 2002 2003
2004
2005 2006 2007
Figure 20 – Human Error with Load Interrupted
62
2008 2009
Chapter 5
Descriptive Statistics using the New Taxonomy
Seasonality of human errors
Other interesting information is about the seasonality of human error. Figure 21 shows that
there are more human errors on the second semester than on the first one, because the
workload is concentrated on the second semester to get done the work program. January and
February are holiday months so that the activities are reduced and after the carnival holidays,
it is observed a peak of human error. Therefore, it is very important to consider seasonality
when elaborating of a human error prevention program.
HUMAN ERROR ANNUAL SEASONALITY
D
EC
EM
BE
R
BE
R
R
O
VE
M
N
TO
BE
O
C
EM
BE
R
US
T
SE
PT
AU
G
LY
JU
NE
JU
M
AI
IL
AP
R
M
AR
CH
Y
UA
R
FE
BR
JA
NU
AR
Y
18
16
14
12
10
8
6
4
2
0
Figure 21 – Human Error Annual Seasonality
In Figure 22, the elementary behaviors “compare” and “identify”, emerge as more frequent
than the others, but due to the quantities of elementary behavior, it is not easy to see
seasonality issues.
Figure 23 shows the number of human errors month by month during the analysed period.
From this graph, it is impossible to see any kind of seasonality. Figure 23 reveals that the
error type lapse, (a type of slip when the memory failed), occurs less frequently than the
others, ("mistake" and "slip"). It is worth noting another thing: mistakes are predominant on
January and February and the slips on November and December.
Figure 24 presents month by month the domains of human error: Knowledge, Rule and Skill.
Although seasonality is not perceptived on this graph, it is possible to observe that the skill
domain is more frequent on this period.
63
Chapter 5
Descriptive Statistics using the New Taxonomy
ELEMENTARY BEHAVIOR ANNUAL SEAZONALITY
60,00
50,00
40,00
30,00
20,00
10,00
AD
JU
ST
CO
M
PA
RE
DI
SC
AR
D
ID
EN
TI
FY
LO
CA
TE
D
M
O
VE
PO
SI
T
RE ION
G
IS
TE
R
RE
M
O
VE
TY
PI
NG
0,00
JANUARY
FEBRUARY
MARCH
APRIL
MAI
JUNE
JULY
AUGUST
SEPTEMBER
OCTOBER
NOVEMBER
DECEMBER
Figure 22 – Elementary Behavior Annual Seasonality
ERROR TYPE ANNUAL SEAZONALITY
LAPSE
MISTAKE
AU
GU
ST
SE
PT
EM
BE
R
OC
TO
BE
R
NO
VE
M
BE
R
DE
CE
M
BE
R
JU
LY
JU
NE
AI
M
AP
RI
L
AR
CH
SLIP
M
JA
NU
AR
Y
FE
BR
UA
RY
80,00
70,00
60,00
50,00
40,00
30,00
20,00
10,00
0,00
Figure 23 – Error Type Annual Seasonality
64
Chapter 5
Descriptive Statistics using the New Taxonomy
DOMAIN ANNUAL SEAZONALITY
KNOWLEDGE
RULE
AU
GU
ST
SE
PT
EM
BE
R
OC
TO
BE
R
NO
VE
M
BE
R
DE
CE
M
BE
R
JU
LY
JU
NE
AI
M
AP
RI
L
AR
CH
SKILL
M
JA
NU
AR
Y
FE
BR
UA
RY
80,00
70,00
60,00
50,00
40,00
30,00
20,00
10,00
0,00
Figure 24 – Domain Annual Seasonality
Frequency of human errors
Figure 25 shows the frequency of human error considering the domains: skill-based; rulebased and knowledge-based.
Error Dom ain
Skill-based
Rule-based
Know ledge-based
Skill
53,43%
Rule 24,43%
Know 22,14%
Figure 25 – Error Domain
Figure 25 shows that the domain of skill-based is predominant and the domain of rule-based
and knowledge-based are equally distributed. The reason for that is probably because the
nature of electrical job as this needs a good hand skill to work in electrical racks on command
house, power substation patio and power transmissions lines.
65
Chapter 5
Descriptive Statistics using the New Taxonomy
On the other hand, on the frequency of error type, Figure 26 shows that mistakes and slips are
almost equally distributed. The mistake type or error is linked with the plan to execute the
task. This error is associated with the bad formulation of the plan to execute the task. The slip
error is when the action is correctly planned but something happened and the actions do not
go as planned. It is necessary to make a study to separate operational errors and maintenance
errors to understand where the mistake and/or slip are predominant.
Error Type
Mistake
Slip
Lapse
Mistake 46,56%
Slip
44,27%
Lapse
9,17%
Figure 26 – Error Type
The Berliner processes are: cognitive, motor, perceptive and communication. Figure 27 and
28 show the error on Berliner process frequencies and the frequency of elementary behavior.
Clearly the communication process is good and almost free of error, but the cognitive process
has the higher frequency. Motor and perceptive processes have almost the same frequency.
The cognitive process is to solve problems and to make a decision or to process information
like: calculate, choose, decide, compare, interpolate, verify and remember. Compare,
remember and decide are the elementary behaviors linked to the cognitive process, which has
the higher frequency. Compare and identify are interlinked and are processes to find
similarities and differences between two or more objects or concepts. Remember is about
deficiencies to hold information on memory.
66
Chapter 5
Descriptive Statistics using the New Taxonomy
Berliner Process
Cognitive
Motor
Perceptive
Comunication
Cognitive
Motor
Perceptive
Comunication
39,69%
30,53%
28,24%
1,54%
Figure 27 – Berliner Process
Identify
Elementary Behavior
Compare
22,14%
17,56%
Move
11,45%
Remember 10,69%
9,17%
Decide
Figure 28 – Elementary Behavior
Remove
9,16%
Push/Pull
3,83%
Position
3,06%
Monitored
2,30%
Adjust
1,52%
Choose
1,52%
Inspect
1,52%
Observe
1,52%
Discard
0,76%
Hold
0,76%
Located
Register
Figure 29 is about frequency of failure modes. 74% of errors are related to failure mode of:
Perceptual confusions, biased reviewing, encoding deficiencies and omission. Perceptual
confusion is clearly the higher frequency mode of failure, 42.75%. This mode of failure is
when the operator performs tasks without paying due attention to what is being done.
Attention is the key word.
67
Chapter 5
Descriptive Statistics using the New Taxonomy
Failure Mode
Figure 29 – Failure Mode
Perceptual
confusions
42,75%
Biased reviewing
16,04%
Encoding
deficiences
9,92%
Omissions
5,34%
Countersigns and
nonsigns
4,58%
Inversions
3,81%
Action deficiences
3,06%
Overconfidence
3,06%
Confirmation bias
Contingencies
Here the relations between different variables will be observed, searching for similarities
among them. The following relations will be analyzed: each “failure mode” and “elementary
behavior”; each “failure mode” and “Berliner process”; each “error type” and “elementary
behavior”; each “error type” and “Berliner process”; each “error domain” and “elementary
behavior”; each “error domain” and “Berliner process”. This information compares
sometimes relations that do not have similarity or there’s no observable relation between
them, or there is no significative relations between them. However, in many cases, there is an
important and significant relation among them. When this relation is significant, it could have
important information to understand the error mechanism. Here, it all possibilities among all
variables were analyzed (see Annex 9).
The first relation is between failure mode x elementary behavior.
Failure mode x elementary behavior
According to Reason (1990), the failure modes are (See Table 3): action deficiencies;
confirmation bias; countersigns and nonsigns; encoding deficiencies; first exceptions; general
rules; information overload; inversions; omission; omission following interruptions;
overconfidence; perceptual confusions; rigidity and rule strength. According to Berliner
(1964), the elementary behaviors are (see Table 5): adjust; choose; compare; decide; discard;
68
Chapter 5
Descriptive Statistics using the New Taxonomy
hold; identify; inspect; located; monitored; move; observe; position; push-pull; register;
remember; remove; request and typing. The relation among these variables is analyzed below.
Figure 30 shows the relationship between action deficiencies and elementary behavior. Action
deficiencies is when the operator, during the execution of the task, performs wrong rules even
though best rules are available, and a mistake is committed. Inadvisable (imprudent/wrong
rule) rules leads relevant risks of accidents. It is clear that during the observed period, action
deficiencies did happen when the operator was deciding or inspecting or moving or observing.
ACTION DEFICIENCES X ELEMENTARY BEHAVIOR
30,00
25,00
20,00
15,00
10,00
5,00
ov
e
Ob
se
rv
e
Po
sit
ion
Pu
sh
/P
ull
Re
gis
te
Re
r
me
m
be
r
Re
mo
ve
Re
qu
es
t
Ty
pi
ng
M
d
Id
en
t if
y
In
sp
ec
t
Lo
ca
te
d
M
on
it o
re
d
Ho
l
Ad
jus
t
Ch
oo
se
Co
mp
ar
e
De
cid
e
Di
sc
ar
d
0,00
Figure 30 – Action deficiencies x Elementary Behavior
Figure 31 shows the relation between biased reviewing and elementary behavior. Biased
reviewing is the check-off illusion, i e: when the operator imagined that he checked all
different factors, but he did not, and a mistake is committed. Analyzing the graph, it is clear
that during the elementary behavior of compare, the operator does not use to check all factors
that could affect his/her performance.
Figure 32 shows the relationship between confirmation bias and elementary behavior.
Confirmation bias is when the operators put apart a current hypothesis in face of contradictory
evidence and produce ambiguity that favors one available pre-interpretation. This behavior
leads to a mistake. Remember that it is the elementary behavior that was observed during the
studied period. When the operator has problems with memory, it is usual contradictory
evidence that leads to ambiguity and the understanding about performing the rule is damaged,
and favors other wrong interpretations.
69
Chapter 5
Descriptive Statistics using the New Taxonomy
BIASED REVIEWING X ELEMENTARY BEHAVIOR
60,00
50,00
40,00
30,00
20,00
10,00
ov
e
Ob
se
rv
e
Po
sit
ion
Pu
sh
/P
ull
Re
gis
te
Re
r
me
m
be
r
Re
mo
ve
Re
qu
es
t
Ty
pi
ng
M
y
In
sp
ec
t
Lo
ca
te
d
M
on
it o
re
d
d
Id
en
t if
Ho
l
Ad
jus
t
Ch
oo
se
Co
mp
ar
e
De
cid
e
Di
sc
ar
d
0,00
Figure 31 – Biased reviewing x Elementary Behavior
CONFIRMATION BIAS X ELEMENTARY BEHAVIOR
120,00
100,00
80,00
60,00
40,00
20,00
Ob
se
rv
e
Po
sit
ion
Pu
sh
/P
ull
Re
gis
te
Re
r
me
m
be
r
Re
mo
ve
Re
qu
es
t
Ty
pi
ng
ov
e
M
Id
en
t if
y
In
sp
ec
t
Lo
ca
te
d
M
on
it o
re
d
d
Ho
l
Ad
jus
t
Ch
oo
se
Co
mp
ar
e
De
cid
e
Di
sc
ar
d
0,00
Figure 32 – Confirmation Bias x Elementary Behavior
Figure 33 shows the relation between signs, countersigns, non signs and elementary behavior.
Countersign and non sign is when the operator is faced with an ambiguous situation, as the
presence of correct signals to trigger a given action, as also countersigns, to not trigger and
also to the lack of signs, sometimes simultaneously, which leads to error. This situation
occurred during the elementary behavior: compare, identify located, register and remove.
Figure 34 shows the relations between encoding deficiencies and elementary behavior.
Encoding deficiencies is when the operator does not encode at all or encodes inaccurately
certain properties of the problem space or an erroneous general rule may be protected by the
existence of domain-specific exception rules. The elementary behavior of compare was
observed in the sample collected.
70
Chapter 5
Descriptive Statistics using the New Taxonomy
COUTERSIGNS AND NONSIGNS X ELEMENTARY BEHAVIOR
ov
e
Ob
se
rv
e
Po
sit
ion
Pu
sh
/P
ull
Re
gis
te
Re
r
me
m
be
r
Re
mo
ve
Re
qu
es
t
Ty
pi
ng
M
d
Id
en
t if
y
In
sp
ec
t
Lo
ca
te
d
M
on
it o
re
d
Ho
l
Ad
jus
t
Ch
oo
se
Co
mp
ar
e
De
cid
e
Di
sc
ar
d
18,00
16,00
14,00
12,00
10,00
8,00
6,00
4,00
2,00
0,00
Figure 33 – Sings, countersigns and non signs x elementary behavior
ENCODING DEFICIENCIES X ELEMENTARY BEHAVIOR
60,00
50,00
40,00
30,00
20,00
10,00
Ob
se
rv
e
Po
sit
ion
Pu
sh
/P
ull
Re
gis
te
Re
r
me
m
be
r
Re
mo
ve
Re
qu
es
t
Ty
pi
ng
ov
e
M
Id
en
t if
y
In
sp
ec
t
Lo
ca
te
d
M
on
it o
re
d
d
Ho
l
Ad
jus
t
Ch
oo
se
Co
mp
ar
e
De
cid
e
Di
sc
ar
d
0,00
Figure 34 – Encoding Deficiencies x Elementary Behavior
Figure 35 shows the relation between first exceptions and elementary behavior. First
exceptions are when the operator is faced for the first time with an exception to the general
rule that he/she had always used, and as the general rule has been applied successfully in the
past, he/she tends to apply it to the exceptional situation. Thus leading to error. Only the
elementary behavior: position was observed on failure mode: first exceptions, during the
period studied.
Figure 36 shows the relations between general rule and elementary behavior. The operator
wrongly choices a general rule because it is likely to be stronger than an error is committed.
71
Chapter 5
Descriptive Statistics using the New Taxonomy
FIRST EXCEPTIONS X ELEMENTARY BEHAVIOR
120,00
100,00
80,00
60,00
40,00
20,00
ov
e
Ob
se
rv
e
Po
sit
ion
Pu
sh
/P
ull
Re
gis
te
Re
r
me
m
be
r
Re
mo
ve
Re
qu
es
t
Ty
pi
ng
M
d
Id
en
t if
y
In
sp
ec
t
Lo
ca
te
d
M
on
it o
re
d
Ho
l
Ad
jus
t
Ch
oo
se
Co
mp
ar
e
De
cid
e
Di
sc
ar
d
0,00
Figure 35 – First exceptions x Elementary Behavior
GENERAL RULE X ELEMENTARY BEHAVIOR
120,00
100,00
80,00
60,00
40,00
20,00
Ob
se
rv
e
Po
sit
ion
Pu
sh
/P
ull
Re
gis
te
Re
r
me
m
be
r
Re
mo
ve
Re
qu
es
t
Ty
pi
ng
ov
e
M
d
Id
en
t if
y
In
sp
ec
t
Lo
ca
te
d
M
on
it o
re
d
Ho
l
Ad
jus
t
Ch
oo
se
Co
mp
ar
e
De
cid
e
Di
sc
ar
d
0,00
Figure 36 – General Rule x Elementary Behavior
Figure 37 shows the relation between information overload and elementary behavior.
Information overload is when there is abundance of information, sometimes undesired,
because the local state indication almost invariably exceeds the operator cognitive system’s
ability to apprehend them, which can lead to error. Position and decide are the elementary
behavior observed in this case.
Figure 38 shows the relation between the failure mode “inversion” and the elementary
behavior. Inversion is when the original sequence of the task is reversed by the operator. In
this case, the elementary behaviors remember and move are observed.
72
Chapter 5
Descriptive Statistics using the New Taxonomy
INFORMATION OVERLOAD X ELEMENTARY BEHAVIOR
ov
e
Ob
se
rv
e
Po
sit
ion
Pu
sh
/P
ull
Re
gis
te
Re
r
me
m
be
r
Re
mo
ve
Re
qu
es
t
Ty
pi
ng
M
d
Id
en
t if
y
In
sp
ec
t
Lo
ca
te
d
M
on
it o
re
d
Ho
l
Ad
jus
t
Ch
oo
se
Co
mp
ar
e
De
cid
e
Di
sc
ar
d
80,00
70,00
60,00
50,00
40,00
30,00
20,00
10,00
0,00
Figure 37 – Information overload x Elementary behavior
INVERSIONS X ELEMENTARY BEHAVIOR
ov
e
Ob
se
rv
e
Po
sit
ion
Pu
sh
/P
ull
Re
gis
te
Re
r
me
m
be
r
Re
mo
ve
Re
qu
es
t
Ty
pi
ng
M
Id
en
t if
y
In
sp
ec
t
Lo
ca
te
d
M
on
it o
re
d
d
Ho
l
Ad
jus
t
Ch
oo
se
Co
mp
ar
e
De
cid
e
Di
sc
ar
d
90,00
80,00
70,00
60,00
50,00
40,00
30,00
20,00
10,00
0,00
Figure 38 – Inversions x Elementary behavior
Figure 39 shows the relation between the failure mode “omission” and elementary behavior.
Omission is when the operator, while performing a task, omits the next step that he should
perform for the task, or he can omit all the steps accomplished of the task from a certain point.
This usually occurs when he fails to check the state between two actions. This is required to
determine when the first action is completed and the next should start. Remember is the
elementary behavior presents in this case.
Figure 40 shows the relation between the failure mode “omission following interruptions” and
elementary behavior. Omission following interruptions is when the operator performing a
routine task, he is interrupted by an event and when he returns to resume what he was doing,
he can not remember at what point he was before the break, failing to execute a step. From the
analyzed data, only the elementary behavior monitored was observed.
73
Chapter 5
Descriptive Statistics using the New Taxonomy
OMISSION X ELEMENTARY BEHAVIOR
120,00
100,00
80,00
60,00
40,00
20,00
M
ov
e
Ob
se
rv
e
Po
sit
ion
Pu
sh
/P
ull
Re
gis
te
Re
r
me
m
be
r
Re
mo
ve
Re
qu
es
t
Ty
pi
ng
d
Id
en
t if
y
In
sp
ec
t
Lo
ca
te
d
M
on
it o
re
d
Ho
l
Ad
jus
t
Ch
oo
se
Co
mp
ar
e
De
cid
e
Di
sc
ar
d
0,00
Figure 39 – Omission x Elementary behavior
OMISSION FOLLOWING INTERRUPTIONS X ELEMENTARY BEHAVIOR
120,00
100,00
80,00
60,00
40,00
20,00
M
ov
e
Ob
se
rv
e
Po
sit
ion
Pu
sh
/P
ull
Re
gis
te
Re
r
me
m
be
r
Re
mo
ve
Re
qu
es
t
Ty
pi
ng
Ho
ld
Id
en
t if
y
In
sp
ec
t
Lo
ca
te
d
M
on
it o
re
d
Ad
jus
t
Ch
oo
se
Co
mp
ar
e
De
cid
e
Di
sc
ar
d
0,00
Figure 40 – Omission following interruptions x elementary behavior
Figure 41 shows the relation between “overconfidence” and elementary behavior.
Overconfidence is when the operator will tend to justify his chosen course of action by
focusing on evidence that favors it and by disregarding contradictory signs. Four elementary
behaviors on this case were observed: decide, identify, position and typing.
Figure 42 shows the relation between “perceptual confusions” and elementary behavior.
Perceptual confusions is when operators perform tasks without paying due attention to what
they are doing. Many elementary behaviors are present in this case, but “identify” is the most
relevant.
74
Chapter 5
Descriptive Statistics using the New Taxonomy
OVERCONFIDENCE X ELEMENTARY BEHAVIOR
30,00
25,00
20,00
15,00
10,00
5,00
M
ov
e
Ob
se
rv
e
Po
sit
ion
Pu
sh
/P
ull
Re
gis
te
Re
r
me
m
be
r
Re
mo
ve
Re
qu
es
t
Ty
pi
ng
d
Id
en
t if
y
In
sp
ec
t
Lo
ca
te
d
M
on
it o
re
d
Ho
l
Ad
jus
t
Ch
oo
se
Co
mp
ar
e
De
cid
e
Di
sc
ar
d
0,00
Figure 41 – Overconfidence x Elementary behavior
PERCEPTUAL CONFUSIONS X ELEMENTARY BEHAVIOR
M
ov
e
Ob
se
rv
e
Po
sit
ion
Pu
sh
/P
ull
Re
gis
te
Re
r
me
m
be
r
Re
mo
ve
Re
qu
es
t
Ty
pi
ng
Id
en
t if
y
In
sp
ec
t
Lo
ca
te
d
M
on
it o
re
d
d
Ho
l
Ad
jus
t
Ch
oo
se
Co
mp
ar
e
De
cid
e
Di
sc
ar
d
50,00
45,00
40,00
35,00
30,00
25,00
20,00
15,00
10,00
5,00
0,00
Figure 42 – Perceptual confusions x Elementary behavior
Figure 43 shows the relation between “rigidity” and elementary behavior. Rigidity is when the
operator tends to reapply, over and over, a rule that achieved successful outcomes in the past.
This situation emerges during the elementary behavior adjust and decide.
Figure 44 shows the relation between “rule strength” and elementary behavior. Rule strength
is when this rule became a strong rule and the operator can trigger this rule when some but not
all conditions are satisfied. This failure mode emerges when the elementary behavior decide,
identify and push-pull occurred.
75
Chapter 5
Descriptive Statistics using the New Taxonomy
RIGIDITY X ELEMENTARY BEHAVIOR
60,00
50,00
40,00
30,00
20,00
10,00
M
ov
e
Ob
se
rv
e
Po
sit
ion
Pu
sh
/P
ull
Re
gis
te
Re
r
me
m
be
r
Re
mo
ve
Re
qu
es
t
Ty
pi
ng
d
Id
en
t if
y
In
sp
ec
t
Lo
ca
te
d
M
on
it o
re
d
Ho
l
Ad
jus
t
Ch
oo
se
Co
mp
ar
e
De
cid
e
Di
sc
ar
d
0,00
Figure 43 – Rigidity x Elementary Behavior
RULE STRENGHT X ELEMENTARY BEHAVIOR
Ob
se
rv
e
Po
sit
ion
Pu
sh
/P
ull
Re
gis
te
Re
r
me
m
be
r
Re
mo
ve
Re
qu
es
t
Ty
pi
ng
ov
e
M
Id
en
t if
y
In
sp
ec
t
Lo
ca
te
d
M
on
it o
re
d
d
Ho
l
Ad
jus
t
Ch
oo
se
Co
mp
ar
e
De
cid
e
Di
sc
ar
d
40,00
35,00
30,00
25,00
20,00
15,00
10,00
5,00
0,00
Figure 44 – Rule strength x Elementary behavior
Failure mode x Berliner process
The relation among these variables is analyzed below.
Figure 45 shows the relation between action deficiencies and Berliner process. Only during
communication it was not observed the failure mode action deficiencies.
76
Chapter 5
Descriptive Statistics using the New Taxonomy
ACTION DEFICIENCIES X BERLINER PROCESS
60,00
50,00
40,00
30,00
20,00
10,00
0,00
cognitive
comunication
motor
perceptive
Figure 45 – Action deficiencies x Berliner process
Figure 46 shows the relation between biased reviewing and Berliner process. The failure
mode biased reviewing was strongly observed during the Berliner cognitive process and with
less importance than the motor process.
BIASED REVIEWING X BERLINER PROCESS
100,00
90,00
80,00
70,00
60,00
50,00
40,00
30,00
20,00
10,00
0,00
cognitive
comunication
motor
perceptive
Figure 46 - Biased reviewing x Berliner process
Figure 47 shows the relation between confirmation bias and Berliner process. The failure
mode confirmation bias was observed only during the cognitive process.
77
Chapter 5
Descriptive Statistics using the New Taxonomy
CONFIRMATION BIAS X BERLINER PROCESS
120,00
100,00
80,00
60,00
40,00
20,00
0,00
cognitive
comunication
motor
perceptive
Figure 47 – Confirmation bias x Berliner process
Figure 48 shows the relation between countersigns and non signs and the Berliner process.
The failure mode countersigns and non signs was observed for all the Berliner process.
COUNTERSIGNS AND NOSIGNS X BERLINER
PROCESS
35
30
25
20
15
10
5
0
cognitive
comunication
motor
perceptive
Figure 48 – Countersigns and non signs x Berliner process
Figure 49 shows the relation between encoding deficiencies and Berliner process. The
cognitive process is more relevant.
78
Chapter 5
Descriptive Statistics using the New Taxonomy
ENCODING DEFICIENCIES X BERLINER
PROCESS
90
80
70
60
50
40
30
20
10
0
cognitive
comunication
motor
perceptive
Figure 49 – Encoding deficiencies x Berliner process
Figure 50 shows the relation between first exceptions and Berliner process. Only motor
process was observed in relation to the failure mode first exceptions.
FIRST EXCEPTIONS X BERLINER PROCESS
120,00
100,00
80,00
60,00
40,00
20,00
0,00
cognitive
comunication
motor
perceptive
Figure 50 – First exceptions x Berliner process
Figure 51 shows the relation between general rule and non signs and Berliner process. Only
the cognitive process was observed in relation to the failure mode general rule.
79
Chapter 5
Descriptive Statistics using the New Taxonomy
GENERAL RULE X BERLINER PROCESS
120,00
100,00
80,00
60,00
40,00
20,00
0,00
cognitive
comunication
motor
perceptive
Figure 51 – General rule x Berliner process
Figure 52 shows the relation between information overload and Berliner process. Cognitive
and motor process were observed.
INFORMATION OVERLOAD X BERLINER
PROCESS
80,00
70,00
60,00
50,00
40,00
30,00
20,00
10,00
0,00
cognitive
comunication
motor
perceptive
Figure 52 – Information overload x Berliner process
Figure 53 shows the relation between inversions and Berliner process. Mainly the cognitive
process and the less motor process were observed in relation to the failure mode inversions
80
Chapter 5
Descriptive Statistics using the New Taxonomy
INVERSIONS X BERLINER PROCESS
90,00
80,00
70,00
60,00
50,00
40,00
30,00
20,00
10,00
0,00
cognitive
comunication
motor
perceptive
Figure 53 – Inversions x Berliner process
Figure 54 shows the relation between the failure mode “omission” and Berliner process. In
this case, only the cognitive process was observed.
OMISSION X BERLINER PROCESS
120,00
100,00
80,00
60,00
40,00
20,00
0,00
cognitive
comunication
motor
perceptive
Figure 54 – Omission x Berliner process
Figure 55 shows the relation between the failure mode: “omission following interruptions”
and Berliner process. In this case only the perceptive process was observed.
81
Chapter 5
Descriptive Statistics using the New Taxonomy
OMISSION FOLLOWING INTERRUPTIONS X
BERLINER PROCESS
120,00
100,00
80,00
60,00
40,00
20,00
0,00
cognitive
comunication
motor
perceptive
Figure 55 – Omission following interruptions x Berliner process
Figure 56 shows the relation between the failure mode: “overconfidence” and Berliner
process. In this case only the communication process was not observed.
OVERCONFIDENCE X BERLINER PROCESS
60,00
50,00
40,00
30,00
20,00
10,00
0,00
cognitive
comunication
motor
perceptive
Figure 56 – Overconfidence x Berliner process
Figure 57 shows the relation between “perceptual confusions” and Berliner process. Only
communication was not observed in this case.
82
Chapter 5
Descriptive Statistics using the New Taxonomy
PERCEPTUAL CONFUSIONS X BERLINER
PROCESS
60,00
50,00
40,00
30,00
20,00
10,00
0,00
cognitive
comunication
motor
perceptive
Figure 57 – Perceptual confusions x Berliner process
Figure 58 shows the relation between “rigidity” and Berliner process. Both cognitive and
motor are relevant in this case.
RIGIDITY X BERLINER PROCESS
60,00
50,00
40,00
30,00
20,00
10,00
0,00
cognitive
comunication
motor
perceptive
Figure 58 – Rigidity x Berliner process
Figure 59 shows the relation between the failure mode: “rule strength” and Berliner process.
Only communication was not observed in this case.
83
Chapter 5
Descriptive Statistics using the New Taxonomy
RULE STRENGHT X BERLINER PROCESS
40,00
35,00
30,00
25,00
20,00
15,00
10,00
5,00
0,00
cognitive
comunication
motor
perceptive
Figure 59 – Rule Strength x Berliner process
Error type x elementary behavior
According to Reason (1990), there are three types of error: Slip, Lapse and Mistake. “Slips
and lapses are errors which result from some failure in the execution and/or storage stage of
action sequence, regardless of whether the plan which guided them was adequate to achieve
its objective”. The main difference of slip and lapse is that whereas slips are observable as
unplanned externalized actions, the lapses involve memory failures. “Mistakes may be
defined as deficiencies or failure in the judgmental and/or inferential process involved in the
selection of an objective or in the specification of the means to achieve it, irrespective of
whether or not the actions directed by this decision-scheme run according to plan”.
Figure 60 shows the relation between “lapse” and elementary behavior. The elementary
behaviors: adjust, decide, monitor and move were observed in this case but “remember”
presents is more frequent.
84
Chapter 5
Descriptive Statistics using the New Taxonomy
LAPSE X ELEMENTARY BEHAVIOR
M
ov
e
Ob
se
rv
e
Po
sit
ion
Pu
sh
/P
ull
Re
gis
te
Re
r
me
m
be
r
Re
mo
ve
Re
qu
es
t
Ty
pi
ng
d
Id
en
t if
y
In
sp
ec
t
Lo
ca
te
d
M
on
it o
re
d
Ho
l
Ad
jus
t
Ch
oo
se
Co
mp
ar
e
De
cid
e
Di
sc
ar
d
80,00
70,00
60,00
50,00
40,00
30,00
20,00
10,00
0,00
Figure 60 – Lapse x Elementary behavior
Figure 61 shows the relation between “mistake” and elementary behavior. Although many
elementary behaviors are observed, “compare” and “decide” are more frequent.
MISTAKE X ELEMENTARY BEHAVIOR
Ob
se
rv
e
Po
sit
ion
Pu
sh
/P
ull
Re
gis
te
Re
r
me
m
be
r
Re
mo
ve
Re
qu
es
t
Ty
pi
ng
ov
e
M
Id
en
t if
y
In
sp
ec
t
Lo
ca
te
d
M
on
it o
re
d
d
Ho
l
Ad
jus
t
Ch
oo
se
Co
mp
ar
e
De
cid
e
Di
sc
ar
d
40,00
35,00
30,00
25,00
20,00
15,00
10,00
5,00
0,00
Figure 61 – Mistake x elementary behavior
Figure 62 shows the relation between “slip” and elementary behavior. Decide, discard, hold,
monitor, move observe, position, push-pull, remember and remove are elementary behaviors
that take to slip, however, identify is more frequent.
85
Chapter 5
Descriptive Statistics using the New Taxonomy
SLIP X ELEMENTARY BEHAVIOR
ov
e
Ob
se
rv
e
Po
sit
ion
Pu
sh
/P
ull
Re
gis
te
Re
r
me
m
be
r
Re
mo
ve
Re
qu
es
t
Ty
pi
ng
M
Ho
ld
Id
en
t if
y
In
sp
ec
t
Lo
ca
te
d
M
on
it o
re
d
Ad
jus
t
Ch
oo
se
Co
mp
ar
e
De
cid
e
Di
sc
ar
d
50,00
45,00
40,00
35,00
30,00
25,00
20,00
15,00
10,00
5,00
0,00
Figure 62 – Slip x Elementary behavior
Error type x Berliner process
Figure 63 shows the relation between “lapse” and Berliner process. Only “communication”
was not observed in this case.
LAPSE X BERLINER PROCESS
80,00
70,00
60,00
50,00
40,00
30,00
20,00
10,00
0,00
cognitive
comunication
motor
perceptive
Figure 63 – Lapse x Berliner process
Figure 64 shows the relation between “mistake” and Berliner process. All Berliner processes
were observed in this case, however the Berliner process “cognitive” is more frequent.
86
Chapter 5
Descriptive Statistics using the New Taxonomy
MISTAKE X BERLINER PROCESS
70,00
60,00
50,00
40,00
30,00
20,00
10,00
0,00
cognitive
comunication
motor
perceptive
Figure 64 – Mistake x Berliner process
Figure 65 shows the relation between “slip” and Berliner process. Only “communication” was
not observed in this case.
SLIP X BERLINER PROCESS
60,00
50,00
40,00
30,00
20,00
10,00
0,00
cognitive
comunication
motor
perceptive
Figure 65 – Slip x Berliner process
Error domain x elementary behavior
Rasmussen (1982) presents the human error in three domains:
Skill-based, tasks that require manual skills; “In the skill-based domains, including
automated, more or less subconscious routines, performance is controlled by stored patterns
of behavior in a time-space domain. Errors are related to variability of force, space or time
coordination”
87
Chapter 5
Descriptive Statistics using the New Taxonomy
Rule-based, tasks based on predefined procedures, require training; “The rule-based domain
includes performance in familiar situations controlled by stored rules for coordination of
subroutines, and errors are typically related to mechanisms like wrong classification or
recognition of situations, erroneous associations to tasks, or to memory slips in recall of
procedures”; and
Knowledge-based, complex tasks, require decision, require attention; “The third behavioral
domain is called upon in case of unique, unfamiliar situations for which actions must be
planned from an analysis and decision based on knowledge of the functional, physical
properties of the system and the priority of the various goals. In this domain, the internal data
processing functions used for the task are very person and situation dependent and vary with
details in the task context, with the extent and type of knowledge immediately available to the
person, and with his subjective preferences. In general, errors in this domain can only be
defined in relation to the goal of the task and generic error mechanisms can only be defined
from very detailed studies based on verbal protocols which can supply data on the actual data
process”.
Figure 66 shows the relation between the domain “knowledge” and elementary behavior. In
this domain, the elementary behaviors: compare, decide and remember, were more observed.
KNOWLEDGE X ELEMENTARY BEHAVIOR
60,00
50,00
40,00
30,00
20,00
10,00
M
ov
e
Ob
se
rv
e
Po
sit
ion
Pu
sh
/P
ull
Re
gis
te
Re
r
me
m
be
r
Re
mo
ve
Re
qu
es
t
Ty
pi
ng
d
Id
en
t if
y
In
sp
ec
t
Lo
ca
te
d
M
on
it o
re
d
Ho
l
Ad
jus
t
Ch
oo
se
Co
mp
ar
e
De
cid
e
Di
sc
ar
d
0,00
Figure 66 – Knowledge x Elementary behavior
Figure 67 shows the relation between the “rule” domain and elementary behavior. In this case,
almost all elementary behaviors were present on “rule” domain, however compare and decide
were more frequent.
88
Chapter 5
Descriptive Statistics using the New Taxonomy
RULE X ELEMENTARY BEHAVIOR
30,00
25,00
20,00
15,00
10,00
5,00
ov
e
Ob
se
rv
e
Po
sit
ion
Pu
sh
/P
ull
Re
gis
te
Re
r
me
m
be
r
Re
mo
ve
Re
qu
es
t
Ty
pi
ng
M
d
Id
en
t if
y
In
sp
ec
t
Lo
ca
te
d
M
on
it o
re
d
Ho
l
Ad
jus
t
Ch
oo
se
Co
mp
ar
e
De
cid
e
Di
sc
ar
d
0,00
Figure 67 – Rule x Elementary behavior
Figure 68 shows the relation between “skill” domain and elementary behavior. The
elementary behavior “identify” was more frequent.
SKILL X ELEMENTARY BEHAVIOR
ov
e
Ob
se
rv
e
Po
sit
ion
Pu
sh
/P
ull
Re
gis
te
Re
r
me
m
be
r
Re
mo
ve
Re
qu
es
t
Ty
pi
ng
M
d
Id
en
t if
y
In
sp
ec
t
Lo
ca
te
d
M
on
it o
re
d
Ho
l
Ad
jus
t
Ch
oo
se
Co
mp
ar
e
De
cid
e
Di
sc
ar
d
40,00
35,00
30,00
25,00
20,00
15,00
10,00
5,00
0,00
Figure 68 – Skill x Elementary behavior
Error domain x Berliner process
Figure 69 shows the relation between the domain “knowledge” and Berliner process. The
Berliner process “communication” was not observed, whereas “motor” and “perceptive”
appeared a few, however the Berliner process “cognitive” was more frequent.
89
Chapter 5
Descriptive Statistics using the New Taxonomy
KNOWLEDGE X BERLINER PROCESS
90,00
80,00
70,00
60,00
50,00
40,00
30,00
20,00
10,00
0,00
cognitive
comunication
motor
perceptive
Figure 69 – Knowledge x Berliner process
Figure 70 shows the relation between the domain “rule” and Berliner process. All Berliner
processes were observed in this case.
RULE X BERLINER PROCESS
60,00
50,00
40,00
30,00
20,00
10,00
0,00
cognitive
comunication
motor
perceptive
Figure 70 – Rule x Berliner process
Figure 71 shows the relation between the domain “skill” and Berliner process. Only
“communication” was not observed in this case.
90
Chapter 5
Descriptive Statistics using the New Taxonomy
SKILL X BERLINER PROCESS
50,00
45,00
40,00
35,00
30,00
25,00
20,00
15,00
10,00
5,00
0,00
cognitive
comunication
motor
perceptive
Figure 71 – Skill x Berliner process
The figures presented in this chapter contain important information about the nature of human
errors in the Brazilian hydroelectrical sector. These data, shown in graphical form, when
studied as a whole can provide subsidies for construction programs for reduction of human
errors. Descriptive statistics despite to analyze only facts that already occurred, indicates
probable trends in various processes that are ongoing. Some of these trends can be reversed if
they are pointed out and prove harmful.
In the next chapter will be used tools that can quantify the probability of occurrence of human
error and so along with the descriptive statistics to create a more robust programs for
reduction of human errors in hydroelectric power companies.
91
Chapter 6
Assessment of Human Error using the New Taxonomy and Model
6. ASSESSEMENT OF HUMAN ERROR USING THE NEW
TAXONOMY AND MODEL OF ERROR SEQUENCE PROCESS
This chapter presents a methodology to apply the taxonomy and model proposed in Chapter 4
and presents examples using data collected from a Brazilian hydroelectric power company.
Firstly, qualitative applications will be presented and next a quantitative application using
Bayesian Networks will be presented.
6.1 Qualitative Applications
Having a robust taxonomy to classify human error is important, because through the data
collected using this taxonomy it is possible to build a database to help the decisor makers to
formulate policies of reduction of human error during operating and maintenance of electric
power systems. A robust taxonomy helps to understand where the problems are, and through
a quantitative model (for example, based on Bayesian Networks) to find what is more likeld
to happen.
To create a database with robust and reliable information takes time, persistence and a good
methodology. It is necessary to collect data in an easy and quick manner and without errors.
The proposed taxonomy in this work and the new cognitive models are adequate to create a
robust database to store human error information from hydroelectric power companies.
Two types of performances are the main responsible for human error on power electric
Companies: the operation and the maintenance program of the electric system.
Maintenance programs consist of preventive and predictive maintenance of transmission lines,
substations and generator parks. The human error caused by the maintenance worker leads to
outages of equipments and, as a consequence, in many times to load interruption.
Operation of hydroelectric power systems is an activity performed by operators in control
rooms in substations and generating plants. The human error caused by the operator, usually
leads to load interruption.
In the sequence, it will be presented a methodology to investigate human errors and how to
store information using the proposed taxonomy and models developed in Chapter 4.
The models of human error report collected from a Brazilian hydroelectric power company,
named RDFH (Report Shutdown by Human Error), (see Annex 2), is conveniently formatted
so that it is possible to get all necessary and sufficient information for the construction of the
table that supports the database development. For that it is necessary to perform a deep
analysis of the human error report (RDFH) to get the necessary information to complete the
table shown in Figure 72.
92
Chapter 6
RDFH n°
Assessment of Human Error using the New Taxonomy and Model
Date
Interrupted
Berliner process
Domain
load (MW)
Elementary
behavior
Failure mode
Error
type
Figure 72: Register Database
The RDFH n° is necessary to connect the human error with the task. The nature of the task is
important to understand whether a specific set of tasks is causing more human error than
others or which set of tasks produces a failure mode or elementary behavior. It is important
also to infer the probability of failure with a specific set of tasks. In this work this will be
achieved by means of BBN. During the analysis of the report (RDFH) it is necessary to
identify which task step has immediately led to the human error, because this step is the most
important to understand the nature of the error, and through this step it is possible to identify
all other necessary registers to fill the database table. There is no simple recipe to identify the
root step that caused the human error, it is necessary to be an expert on hydroelectric power
systems and human reliability.
According to Figure 72, date is necessary to frame the period of time in which the human
error occurred. The interrupted load is necessary to fix the importance of this occurrence. The
higher interrupted load, the higher the fees.
The next five registers are the most important to assess the human error because they are the
core of the model.
It is convenient to start with Domain. Choosing the correct domain is relatively easy, as it is
necessary only to follow the diagram shown in Figure 14. In general, on routine works the
domain is Skill-based because the worker does not choose the rule to perform a task. If the
worker chooses the rule, the domain can be Rule-based. When the worker creates a new rule,
the domain can be Knowledge-based. However, it is necessary to follow the diagram to
correctly choose the domain. Once chosen the domain, the error type comes automatically.
In sequence, a pair Berliner process and elementary behavior can be chosen. Now it is very
important to try to imagine what the worker was thinking when he faced the task. Berliner
process is directly linked to elementary behavior. Berliner processes are four: cognitive,
perceptive, motor and communication. A human error linked with communication process is
when the elementary behavior is linked to exchange and/or recording information. Motor
process is linked to the physical nature of the task, action that the worker needs physically to
performe the task, like move or position an object. Perceptive process is linked with action
like looking for and to receive information or to identify objects, events and actions.
Cognitive process is when the worker needs to solve problems and makes a decision or to
93
Chapter 6
Assessment of Human Error using the New Taxonomy and Model
process information. Inside each Berliner process there are the respective elementary
behaviors, but it is not very easy to choose the correct one because sometimes there are
similarities between them. Practice and knowledge are essential to have success.
Finally, the most difficult and more important choice: failure mode. To choose the correct
failure mode it is necessary firstly to know deeply each one of its definitions (see Table 3).
Failure mode is linked with domain. Each domain has its own set of failures modes. Again
practice and knowledge are essential to be successful.
After carefully analyzing the human error report and identified all registers, the database has
to be filled. Now, some examples collected from Annex 1 will be presented.
Report error n. 083 September, 16 2004, load interrupted 70,00MW.
Summarized description: The accidental shutdown of circuit breakers 14G2 and 13T2 has
as the root cause the failure to identify the sources of which one was defective and unduly
control pushbutton reset from another source that presented itself to normal operation. (See
RDFH in Annex 8)
The detailed analysis of this event reveals that:
1. The maintenance team was called because a circuit breaker was not working;
2. There is a written rule to identify faulty breaker;
3. The worker chose the correct rule;
4. The worker failed to choose the faulty breaker;
5. The worker shutdown the wrong breaker.
Comments:
The worker was an expert and had several times correctly performed this kind
of task;
The worker chose a written rule;
The worker chose the correct rule but wrongly performed a correct rule;
The worker was on domain of Skill-based and committed a slip, according to
Figure 14; (start task; There is a rule known to perform the task? Yes; Worker
chooses the rule? Yes; Worker chooses the right rule? Yes; Worker performed
the rule correctly? No; Skill-based Failure mode).
In order to solve a problem and to make a decision, the worker wrongly
chooses after considering many options. This is a pair of Berliner process:
cognitive process and the elementary behavior: choose;
The worker performed the task without paying due attention to what he was
doing. This failure mode is: perceptual confusions.
94
Chapter 6
Assessment of Human Error using the New Taxonomy and Model
Figure 73 shows sequence of error process for RDFH GRP-04/04.
Berliner Process
Domain
Cognitive
Elementary Behavior
Skill
Failure Mode
Error type
Perceptual confusions
Choose
Slip
Figure 73: Sequence of error process RDFH GRP-04/04
The operator used the Cognitive process that is: to solve problems and to make a decision, to
choose the faulty breaker, he perceived that there was a written rule and he chose the correct
rule but he wrongly performed the correct rule, soon he was under the domain of Skill-based
to perform the task. When the worker cognitively decided to perform the task, he committed a
failure mode named perceptual confusions that is: operators perform tasks without paying due
attention to what they are doing and committed a slip and the task was performed without
success. Figure 73 shows the taxonomy and model to RDFH GRP-04/04.
Table 7 shows data filled in to Register Database after the analysis of the RDFH GRP-04/04.
Table 7: Register Database 1
RDFH n°
Date
GRP-04/04
Sep
Interrupted
Berliner process
Domain
Cognitive
Skill
load (MW)
16
70,00
Elementary
Failure mode
behavior
Choose
2004
Error
type
Perceptual
Slip
confusions
Report error n. GRP 04/2006 March, 22 2006, load interrupted 20,00MW.
Summarized description: When the worker was removing a cap of a cable on panel PCC13,
he committed an unintentional touch. This touch caused the shutdown of breaker 52-1. (See
RDFH in Annex 4)
The detailed analysis of this event reveals that:
1. The worker was removing a cap to performe a maintenance;
2. The worker had a rule to perform the job;
3. The job required to remove a cap to reach features inside the panel;
4. The worker unintentionally shutdown the 52-1 breaker.
Comments;
The worker was an expert and had several times correctly performed this kind
of task;
The worker did not chose a rule;
95
Chapter 6
Assessment of Human Error using the New Taxonomy and Model
The worker was on domain of skill-based and committed a slip, according
Figure 14; (start task; There is a rule known to perform the task? Yes; Worker
chooses the rule? No; Rule was correctly written? Yes; Worker performed the
rule correctly? No; skill-based Failure mode);
In order to remove a cap to perform maintenance, the worker used Berliner
process: motor and the elementary behavior: remove;
The worker performed the task without paying due attention to what he was
doing. This failure mode is: perceptual confusions;
The worker committed a slip.
Figure 74 shows sequence of error process for RDFH GRP – 04/06.
Berliner Process
Domain
Motor
Elementary Behavior
Skill
Remove
Failure Mode
Error type
Perceptual confusions
Slip
Figure 74: Sequence of error process RDFH GRP-04/06
The operator used the Motor process to remove a cap. He perceived that there was a written
rule but he did not chose the rule. Thus he was under the domain of skill-based to perform the
task. When the worker cognitively decided to perform the task, he committed a failure mode
named perceptual confusions that is: operators perform tasks without paying due attention to
what they are doing and committed a slip and the task was performed without success. Figure
74 shows the taxonomy and model to RDFH GRP-04/06.
Table 8 shows data filled in the Register Database after the analysis of the RDFH GRP-04/04
and RDFH GRP-04/06.
Table 8: Register Database 2
RDFH n°
Date
GRP-04/04
Sep
Interrupted
Berliner process
Domain
load (MW)
Elementary
behavior
16
70,00
Cognitive
Skill
Choose
22
20,00
Motor
Skill
Remove
2004
GRP-04/06
Marc
Failure mode
Error
type
Perceptual
Slip
confusions
2006
Perceptual
confusions
96
Slip
Chapter 6
Assessment of Human Error using the New Taxonomy and Model
Report error n. GRL 06/1999 November 25 1999, load interrupted 4,00MW.
Summarized description: The worker involved in the occurrence did not use the existing
internal installation instruction to discriminate all the steps to be followed in the process of
setting change relay. (See RDFH in Annex 5)
The detailed analysis of this event reveals that:
1. The worker had to adjust a specific relay;
2. The was written rule to perform this task;
3. The worker chose a wrong rule;
4. The worker incorrectly adjusted the relay (wrong values to pick up
the relay).
Comments;
The worker was an expert and had correctly performed this kind of task several
times;
The worker chose an incorrect rule, he trusted as in his memory to perform the
task;
The worker was on the domain of rule-based and committed a mistake,
according to Figure 14; (start task; There is a rule known to perform the task?
Yes; Worker chooses the rule? Yes; Worker chooses the right rule? No rulebased Failure mode).
In order to adjust a relay, the worker used Berliner process: motor and the
elementary behavior: adjust;
The worker tried to apply, over and over, a rule that achieved successful
outcome in the past, he chose a wrong rule to adjust the relay. This failure
mode is: rigidity;
The worker committed a mistake.
Figure 75 shows sequence of error process for RDFH GRL – 06/99.
Berliner Process
Motor
Domain
Rule
Elementary Behavior
Failure Mode
Adjust
Rigidity
Error type
Mistake
Figure 75: Sequence of error process RDFH GRL-06/99
The worker used the Motor process to adjust a relay, he perceived that there was a written rule
but he did not choose the correct rule, soon he was under the domain of rule-based to perform
97
Chapter 6
Assessment of Human Error using the New Taxonomy and Model
the task. When the worker cognitively decided to perform the task, he committed a failure
mode named rigidity that is: the operator tends to reapply, over and over, a rule that achieved
successful outcomes it the past and committed a mistake and the task was performed without
success. Figure 75 shows the taxonomy and model to RDFH GRL-06/99.
The Table 9 shows data filled in Register Database after the analysis of the RDFH GRP04/04, RDFH GRP-04/06 and RDFH GRL-06/99.
Table 9: Register Database 3
RDFH n°
Date
Interrupted
Berliner process
Domain
load (MW)
GRP-04/04
Sep
16
70,00
Elementary
Cognitive
Skill
Choose
2004
GRP-04/06
Marc
Nov
Error
type
Perceptual
Slip
confusions
22
20,00
Motor
Skill
Remove
2006
GRL-06/99
Failure mode
behavior
Perceptual
Slip
confusions
25
4,00
Motor
Rule
Adjust
Rigidity
Mistake
1999
Report error n. GRS 04/2007 July 5 2007, load interrupted 99,76MW.
Summarized description: Intervention to research: DC leakage to earth. The root cause was
execution of high-risk task, without proper planning (See RDFH in Annex 6).
The detailed analysis of this event reveals that:
1. The worker had to find DC leakage to earth;
2. There was no written rule to perform this task;
3. The worker created a wrong rule;
Comments:
The worker was an expert and had correctly performed this kind of task several
times;
This kind of task is difficult and has high risk of leading to a shutdown;
The worker created a new rule to performe this task; He did not pay due time
to carefully plan this high-risk rule;
The worker was on domain of knowledge-based and committed a mistake,
according to Figure 14; (Start task; There is a rule known to perform the task?
No; Worker created a right new rule? No knowledge-based failure mode).
In order to find DC leakage to earth, the worker used Berliner process:
cognitive that is: to solve problems and to make a decision and the elementary
behavior: decide that is: to get a conclusion based on a disposal information ;
98
Chapter 6
Assessment of Human Error using the New Taxonomy and Model
The worker tends to justify his chosen course of action by focusing on
evidence that favors it and by disregarding contradictory signs, thus creating a
wrong rule. This failure mode is: overconfidence;
The worker committed a mistake.
Figure 75 shows sequence of error process for RDFH GRS – 04/07.
Berliner Process
Cognitive
Domain
Elementary Behavior
Knowledge
Failure Mode
Overconfidence
Decide
Error type
Mistake
Figure 76: Sequence of error process RDFH GRS-04/07
The worker used the cognitive process to decide how to find a DC leakage to earth. He
perceived that there was no written rule, thus he was under the domain of knowledge-based to
perform the task. When the worker cognitively decided to perform the task, he committed a
failure mode named overconfidence and committed a mistake and the task was performed
without success. Figure 76 shows the taxonomy and model to RDFH GRS-04/07.
Table 10 shows data filled in Register Database after the analysis of the RDFH GRP-04/04,
RDFH GRP-04/06, RDFH GRL-06/99 and RDFH GRS-04/07.
Table 10: Register Database 4
RDFH n°
Date
GRP-04/04
Sep
Interrupted
Berliner process
Domain
load (MW)
Elementary
behavior
Marc
Nov
type
70,00
Cognitive
Skill
Choose
22
20,00
Motor
Skill
Remove
Perceptual
Slip
25
4,00
Motor
Rule
Adjust
Rigidity
Mistake
5
99,76
Cognitive
Knowledge
Decide
Overconfidence
Mistake
confusions
2006
GRL-06/99
Error
16
2004
GRP-04/06
Failure mode
Perceptual
Slip
confusions
1999
GRS-
July
04/2007
2007
Report error n. GRO 02/2009 August 25 2009, load interrupted 15,10MW.
Summarized description: The team involved in the intervention carried out an analysis of
performed tests. However, the risk of action of the breaker failure scheme 12T5 was not
viewed, due to the fact that the one normally open contact switch 86-T5, used in project
protection and control, has no direct function of the circuit breaker off 12T5. (See RDFH in
Annex 6).
99
Chapter 6
Assessment of Human Error using the New Taxonomy and Model
The detailed analysis of this event reveals that:
1. The worker was performing tests on a protection circuit;
2. There was no written rule to perform this task;
3. The worker created a wrong rule;
Comments:
The team worker was an expert;
This kind of task is difficult and has high risk of committing a shutdown;
The worker created a new rule to perform this task; he did not check all
possible possibilities;
The worker was on domain of knowledge-based and committed a mistake,
according to Figure 14; (Start task; There is a rule known to perform the task?
No; Worker created a right new rule? No knowledge-based failure mode).
In order to perform the tests, the worker used Berliner process: cognitive that
is: to solve problems and to make a decision and the elementary behavior:
compare, that is: to examine the characteristics or qualities of two or more
objects or concepts, with proposal to identify similarities or differences;
The worker thought that he checked all different factors, but he did not. Then
he created a wrong rule. This failure mode is: biased reviewing;
The worker committed a mistake.
Figure 77 shows sequence of error process for RDFH GRO – 02/09.
Berliner Process
Cognitive
Domain
Knowledge
Elementary Behavior
Compare
Failure Mode
Biased reviewing
Error type
Mistake
Figure 77: Sequence of error process RDFH GRO-02/09
The worker used the cognitive process to compare how to perform tests on a database
protection circuit. He perceived that there was not written rule, thus he was under the domain
of knowledge-based to perform the task. When the worker cognitively decided to perform the
task, he committed a failure mode named biased reviewing and committed a mistake and the
task was performed without success. Figure 77 shows the taxonomy and model to RDFH
GRO-02/09.
100
Chapter 6
Assessment of Human Error using the New Taxonomy and Model
Table 11 shows data filled in Register Database after the analysis of the RDFH GRP-04/04,
RDFH GRP-04/06, RDFH GRL-06/99, RDFH GRS-04/07 and RDFH GRO-02/09.
Table 11: Register Database 5
RDFH n°
Date
Interrupted
Berliner process
Domain
load (MW)
GRP-04/04
Sep
16
70,00
Elementary
Cognitive
Skill
Choose
2004
GRP-04/06
Marc
Nov
Error
type
Perceptual
Slip
confusions
22
20,00
Motor
Skill
Remove
2006
GRL-06/99
Failure mode
behavior
Perceptual
Slip
confusions
25
4,00
Motor
Rule
Adjust
Rigidity
Mistake
5
99,76
Cognitive
Knowledge
Decide
Overconfidence
Mistake
25
15,10
Cognitive
Knowledge
Compare
Biased reviewing
Mistake
1999
GRS-
July
04/2007
2007
GRO-
Aug
02/2009
2009
Report error n. STC 01/2005 January 10 2005, load interrupted 66,13MW.
Summarized description: The shutdown was the result of tests to verify the protections of
the transmission line LT 02J4, and the transformer 04T1 of SE Santo Antonio de Jesus. (See
RDFH in Annex 7).
The detailed analysis of this event reveals that:
1. The shutdown was automatic;
2. This is a latent failure; The protection team made a failure some time
ago when performing an adjustment of the timing of this relay;
3. There was a correct written rule;
4. The worker chose a wrong rule;
Comments;
The team worker were experts;
This kind of task is a common one and the risk to committ a shutdown is low;
The worker choose a wrong rule to perform this task;
The worker was on domain of rule-based and committed a mistake, according
to Figure 14; (Start task; There is a rule known to perform the task? Yes;
Worker chooses the rule? Yes, Worker chooses the right rule? No, rule-based
failure mode).
In order to set up the timing of relay, the worker used Berliner process:
cognitive, that is: to solve problems and to make a decision and the elementary
101
Chapter 6
Assessment of Human Error using the New Taxonomy and Model
behavior: compare, that is: to examine the characteristics or qualities of two or
more objects or concepts, with proposal to identify similarities or differences;
The worker imagined that he encoded all different properties of the problem
space, but he did not, choosing a wrong rule. This failure mode is: encoding
deficiencies;
The worker committed a mistake.
Figure 78 shows sequence of error process for RDFH STC – 01/05.
Berliner Process
Domain
Cognitive
Elementary Behavior
Rule
Failure Mode
Encoding deficiencies
Compare
Error type
Mistake
Figure 78: Sequence of error process RDFH STC-01/05
The worker used the cognitive process to compare how to set up the timing the relay. He
perceived that there was a written rule, thus he was under the domain of rule-based to perform
the task. When the worker cognitively decided to perform the task, he committed a failure
mode named encoding deficiencies and committed a mistake and the task was performed
without success. Figure 78 shows the taxonomy and model to RDFH STC-01/05.
Table 12 shows data filled in Register Database after the analysis of the RDFH GRP-04/04,
RDFH GRP-04/06, RDFH GRL-06/99, RDFH GRS-04/07, RDFH GRO-02/09 and RDFH
STC-01/05.
Table 12: Register Database 6
RDFH n°
Date
GRP-04/04
Sep
Interrupted
Berliner process
Domain
load (MW)
Elementary
behavior
Marc
Nov
type
70,00
Cognitive
Skill
Choose
22
20,00
Motor
Skill
Remove
Perceptual
Slip
25
4,00
Motor
Rule
Adjust
Rigidity
Mistake
5
99,76
Cognitive
Knowledge
Decide
Overconfidence
Mistake
25
15,10
Cognitive
Knowledge
Compare
Biased reviewing
Mistake
19
66,13
Cognitive
Rule
Compare
Encoding
Mistake
confusions
2006
GRL-06/99
Error
16
2004
GRP-04/06
Failure mode
Perceptual
Slip
confusions
1999
GRS-
July
04/2007
2007
GRO-
Aug
02/2009
2009
STC-01/2005
Jan
2005
deficiencies
102
Chapter 6
Assessment of Human Error using the New Taxonomy and Model
Report error n. GRL 05/2003 Mai 08 2003, load interrupted 5,00MW.
Summarized description: In making the selection key 31C1-5, the operator was confused
and selected the key 41C1-6. Both sides are set in the same chassis and have a common point
although both keys were properly coded and clearly visible. (See RDFH in Annex 8).
A The detailed analysis of this event reveals that:
1. The operator was performing a general maneuver program;
2. There was a written rule to perform the task;
3. The operator did not choose the rule;
Comments;
The operator was experienced;
This kind of task is a common one and the risk to committ a shutdown is low;
The worker did not choose a rule to performed this task;
The worker was on domain of skill-based and committed a slip, according to
Figure 14; (Start task; There is a rule known to perform the task? Yes; Worker
chooses the rule? No; Rule was correctly written? Yes; Worker performed rule
correctly? No; Skill-based Failure mode).
In order to selected a key, the worker used Berliner process: perceptive that is:
to identify objects, events and actions; and the elementary behavior: identify,
that is: to acknowledge the nature or indication of an object, according to its
implicit or predetermined characteristics;
The worker performed the task without paying due attention to what he was
doing. This failure mode is: perceptual confusions;
The worker committed a slip.
Figure 79 shows sequence of error process for RDFH GRL – 05/03.
Berliner Process
Perceptive
Domain
Skill
Elementary Behavior
Identify
Failure Mode
Perceptual confusions
Error type
Slip
Figure 79: Sequence of error process RDFH GRL-05/03
The worker used the perspective process to identify a key to shutdown. He perceived that
there was a written rule, but he did not choose this rule. Thus he was under the domain of
103
Chapter 6
Assessment of Human Error using the New Taxonomy and Model
skill-based to perform the task. When the worker cognitively decided to perform the task, he
committed a failure mode named perceptual confusions and committed a slip and the task was
performed without success. Figure 79 shows the taxonomy and model to RDFH GRL-05/03.
Table 13 shows data filled in Register Database after the analysis of the RDFH GRP-04/04,
RDFH GRP-04/06, RDFH GRL-06/99, RDFH GRS-04/07, RDFH GRO-02/09, RDFH STC01/05 and RDFH GRL-05/03.
Table 13: Register Database 7
RDFH n°
Date
Interrupted
Berliner process
Domain
load (MW)
GRP-04/04
Sep
16
70,00
Elementary
Cognitive
Skill
Choose
2004
GRP-04/06
Marc
Nov
Error
type
Perceptual
Slip
confusions
22
20,00
Motor
Skill
Remove
2006
GRL-06/99
Failure mode
behavior
Perceptual
Slip
confusions
25
4,00
Motor
Rule
Adjust
Rigidity
Mistake
5
99,76
Cognitive
Knowledge
Decide
Overconfidence
Mistake
25
15,10
Cognitive
Knowledge
Compare
Biased reviewing
Mistake
19
66,13
Cognitive
Rule
Compare
Encoding
Mistake
1999
GRS-
July
04/2007
2007
GRO-
Aug
02/2009
2009
STC-01/2005
Jan
2005
GRL-
Mai
05/2003
2003
deficiencies
08
5,00
Perspective
Skill
Identify
Perceptual
Slip
confusions
6.2 Bayesian Networks
The Bayesian philosophy or subjective philosophy, assigns the value of a probability, the
degree of belief of an individual. The degree of belief is a measure of a person's knowledge
about a certain proposition or event according to Martz & Waller (1982).
For HRA, Bayesian inference seems more functional than empirical, due to which to infer
about the true value of the probability of human error empirically, ie, frequentist, one must
find the "number of opportunities for error."
However, this identification process is difficult for individuals since events do not occur
under the same conditions. Unlike equipment, people can learn from their mistakes.
Therefore, even though the external environment can be maintained constant, it is impossible
for a person to encounter with the same position twice with the same degree of experience.
In general, inferring the "true value" of probability of the events, subjectively, has advantage
over frequentist way because, besides using information from experiments can also quantify
the experience of individuals
104
Chapter 6
Assessment of Human Error using the New Taxonomy and Model
The subjective probability is called Bayesian by making use of Bayes' theorem.
Let two events A e E, such that P(A) > 0 and P(E) > 0 :
(5.1)
where:
P(A) is the a priori probability of event A;
P (E|A)/P(E) is the relative likelihood of the evidence and, assuming the occurrence of the
event A;
P(A| E) is the posteriori probability of event A given the evidence E.
The Bayesian inference is relatively simple when it involves only two variables.
However, when the number of variables increases, such inference becomes complex and
without practical value according to Neapolitan (2004). Faced with this difficulty, Bayesian
networks are recommended to treat complex systems.
Bayesian networks are graphical structures that allow us to represent reasons or arguments in
the field of uncertainty according to Korb & Nicholson (2003).
The nodes in Bayesian networks represent the random variables (discrete or continuous).
The arcs represent the connections or direct dependencies between variables. Directed
connections are always causal, ie the direction of the arcs represents the cause and effect
relationships between variables. For example, if there is an arc going from node A to node B,
it is assumed that node A is a probable cause of B and the nomenclature adopted as A is a
parent B. More generally, A is the ancestor of B and B is a descendant of A if there is a path
from A to B. If the node has no parents, it is called the root node.
The random variables are quantified by a distribution of conditional probabilities associating
each node to its probable direct cause. A Bayesian network has a structure of a Directed
Acyclic Graph (DAG), which means that the arcs can not form cycles. They are
unidirectional, so that, starting from any of the network nodes, it is impossible to return to the
same node.
The first step in building a Bayesian network is related to identification variables of interest
and then to represent them through the network nodes. Korb & Nicholson (2003) comment
that this step is necessary to answer the questions: What nodes represent? And what values
they can take? For discrete variables, the values of the variables must be mutually exclusive.
Some types of discrete nodes are:
- Boolean Nodes: These are propositions that assume binary values, ie true and
false;
105
Chapter 6
Assessment of Human Error using the New Taxonomy and Model
- Ordered Values: An example of this type of node is the variable consequence, because it can
take values such as: low, medium and high.
The structure and topology of the Bayesian network should capture the qualitative
relationship between variables. In particular, two node must be connected (if it is one purpose
or the other causes) with an arc indicating the direction of effect. The only restriction on the
existing Bayesian framework, as it was previously mentioned, is that it can not be cyclic.
Mathematically, the Bayesian network is a pair n = {(V, E),P} where (V, E) is a directed
graph representing nodes (or vertices) and edges (or arcs) respectively, and P is the
distribution probabilities about V. Generally random variables V = {X1, X2, ....., Xn} are
distributed to the nodes, while the arcs (E) represent the probabilistic causal relationship
between nodes.
Once the network topology has been specified, the next step is to quantify the relationship
between the connected nodes. This is done by assigning the probability distribution for
each node, thus building a Conditional Probabilities Table (CPT). When it comes to discrete
variables, each node is required to identify all possible combinations of their parent nodes.
One must also identify the possible values which the variables can assume. Figure 80 shows a
Bayesian network and CPTs of each variable. This network shows that the variable X
(excessive workload) presents as consequences: the variables Y (Debit sleep) and Z (Fatigue),
ie, a workload might have resulted in an insufficient sleep and fatigue. Each variable in the
network takes on two possible values: T (True) and F (False). Therefore, the value 0.25,
exposed in the 2nd row of the variable CPT associated Y represents the likelihood of a
particular person to be sleep debt (Y) since it will not be under excessive workload (X).
The size of CPTs depends on the amount of parents who have each variable and the number
of values it can take. Therefore, in the case of dichotomous variables, each node a network
(Xi) has:
Number of elements of a CPT = 2n, where n is the number of parents that have variable
Figure 80 shows that Y and Z have X as a parent. They are variables that take two values, T
and F. Therefore Y and Z have 2 conditional probabilities and X has 1 conditional probability.
However, considering the complement of each conditional probability, Y and Z have 4
conditional probabilities and X 2 conditional probabilities as show their CPTs
106
Chapter 6
Assessment of Human Error using the New Taxonomy and Model
Figure 80: Bayesian network for the problem of excessive workload. Source:Menezes Droguett (2005)
The degree of belief about the variables Y and Z is calculated by Bayes rule directly
Then, P(Z=F)=(0,4) (0,2)+(0,6) (0,7)=0,50;
(5.2)
and, P(Y=F)=(0,4) (0,2)+(0,6) (0,75)=0,53
(5.3)
One of the great features of Markov processes is the assumption of lack of memory. This
means that if the current state of the process is known, are irrelevant information passed on
inferences about their future states. This is the concept of Markov condition.
Recall that a directed graph is a pair (V, E), where V is a finite, nonempty set whose elements
are called nodes (or vertices), and E is a set of ordered pairs of distinct elements of V.
Elements of E are called edges (or arcs), and if (X,Y ) ε E, we say that there is an edge from X
to Y and that X and Y are each incident to the edge. If there is an edge from X to Y or from Y
to X, we say X and Y are adjacent. Suppose we have a set of nodes [X1,X2, . ..Xk], where k ≥
2, such (Xi-1,Xi) ε E for 2 ≤ i ≤ k. We call the set of edges connecting the k nodes a path from
X1 to Xk. The nodes X2, . . .Xk-1 are called interior nodes on path [X1,X2, . . .Xk]. The subpath
of path [X1,X2, . . .Xk] from Xi to Xj is the path [Xi,Xi+1, . . .Xj ] where 1 ≤ i < j ≤ k. A directed
cycle is a path from a node to itself. A simple path is a path containing no subpaths which are
directed cycles. A directed graph G is called a directed acyclic graph (DAG) if it contains no
directed cycles. Given a DAG G = (V, E) and nodes X and Y in V, Y is called a parent of X if
there is an edge from Y to X, Y is called a descendent of X and X is called an ancestor of Y if
there is a path from X to Y , and Y is called a nondescendent of X if Y is not a descendent of
X. Note that in this text X is not considered a descendent of X because we require k ≥ 2 in the
definition of a path. Some texts say there is an empty path from X to X.
107
Chapter 6
Assessment of Human Error using the New Taxonomy and Model
Assuming a network with three nodes as in Figure 81, where A probably cause B, B probably
cause C, it can be said based on Markov condition, the probability of C | B is exactly the same
probability of C | (B ∩ A), ie, knowing the fact that: A occurred, makes no difference in belief
about C if we know that B has occurred. Then C is conditionally independent of A, since B
occurred. Or, in probabilistic notation: {C} ind {A} | {B}.
Figure 81:Serial conection. Source: Menezes & Droguett (2005)
Figure 82 shows that when two variables A and C have a common cause B, and there is no
evidence of B, then the fact that one of the effects A is present, C for example, changes the
probability of B occurs, which consequently also changes the the probability of the effect
being present. However, if you already know about B, so the fact the effect is present C says
nothing about the likelihood of also having the effect A. Then C is conditionally independent
of A, since B occurred. Or, in probabilistic notation, {C} ind {A} | {B
Figure 82: Conection type common cause. Source: Menezes, R. C. & Droguett, E. L. (2005)
Easily, one realizes that the pair N = {(V, E), P} satisfies the Markov condition according
Arrifano & Oliveira (2004), then two variables are conditionally independent, given what is
known about another variable that lies between the two variables in flow dependencies.
Figure 83 shows that A and C have a common effect B, i.e. A and C will probably cause B. In
this case, parents are marginally independent, but the result of the common effect B, depends
on both information. Once one knows the occurrence of B and that C is not explains the
probable cause of B, the probability of C given B is conditionally dependent on A.
Figura 83: Conection type common effect. Source: Menezes & Droguett (2005)
108
Chapter 6
Assessment of Human Error using the New Taxonomy and Model
In connection type common effect, the Markovian condition, is violated because the
conditional independence shown in Figures 81 and 82 ceases to exist if it is known the value
of a variable that is common effect of at least two variables not descended together. This
phenomenon is well known as explaining away. A descended variable is a common effect of a
set of variables not descended together when there exist paths between the variables in this
set, and this variable.
The conditional independence in {C} ind {A} | {B} means that knowledge of B blocks, the
relevance of A to C, or in the case of Figure 83, the lack of information about B blocks
relevance of C to A . However, knowledge of B activates the relation between C and A. The
term block means interrupting the flow of dependencies. These conditional independence, are
properties of DAGs known as d-separation, where d refers to direction-dependent. The
presence of d-separation is here denoted by ds. In the DAG of Figure 83, {C} ds {A} | {B}.
The probability distribution corresponding to the network, is calculated from the conditional
probabilities, as shown in the equation below:
(5.4)
Where:
P(U) : joint probability for the network;
P(Xi \ pa(Xi)): conditional probabilities of X in relation to their parents.
Using the joint probability, we can get the posterior probabilities summing up for each
outcome, the odds that a variable can take a network. Subsequently, normalize the
probabilities obtained, thereby obtaining the posterior probabilities for each node or variable.
It follows as an example, a process of inference network related shown in Figure 80. From
CTPs X, Y and Z, one obtains the probabilities P (X, Y, Z) for each result.
Therefore, according to the equation presented above, we have:
P(X ,Y , Z ) = P(X ) × P(Y | X ) × P(Z | X )
(5.5)
Table 14 shows the calculation of joint probabilities. In these calculations, it is considered that
the result T (True) is represented by number 0 and the result F (False) is
represented by number 1.
109
Chapter 6
Assessment of Human Error using the New Taxonomy and Model
Table 14: Joint probabilities related to the problem of excessive workload.
Assume now that node Y is observed as True (Y = Y0), which is an evidence, meaning it has
been found that a person experiences sleep debt. Then an inference process is performed to
the nodes X and Z for calculating posterior probabilities of each outcome of these variables.
From the joint probabilities of Table 14 and using the above equation, one obtains the
posterior probabilities:
{P(x0 | y0 ), P(x1 | y0 ),P(z0 | y0 ),P(z1 | y0 )} for P(x0 | y0 ),
(5.6)
for example, carried out the following calculation:
(5.7)
It is observed that in the above equation the result y1 for obvious reasons not appear in the
calculations,
since
it
is
known
that
the
result
is
y0
of
the
variable.
Table 15 shows the posterior probabilities pertaining to observation of the result y0.
Table 15: Posterior probabilities for the problem of excessive workload.
Because the evidence on Y, the degrees of belief of the other variables were updated and one
can conclude that once the sleep debt is present, the chances of having an excessive workload
and fatigue are high.
The evidence previously mentioned, this is an empirical evidence or specific, as indeed was
observed that (Y = y0). However, other types of evidence can be used. This is called
subjective because it reflects the uncertainty of an individual on the occurrence of a certain
event. This uncertainty is evidenced by a tax. In the network shown in Figure 80, a subjective
evidence could be, for example, a belief that a person has a ratio of two to one in favor of
110
Chapter 6
Assessment of Human Error using the New Taxonomy and Model
having sleep debt before further analysis, A = 0. Given this evidence, it can be said that P (A
= 0 | Y) = β (2, 1) where β is a normalization factor. This implies that P (A = 0 | Y = 0) =
0.667 and P (A = 0 | Y = 1) = 0.333. Figure 84 shows the inclusion of A on this problem.
Figura 84: Inclusion of a subjective evidence in the Bayesian network of figure 15. Source: Menezes &
Droguett (2005)
Since the evaluation result was favorable to sleep debt (A = 0), updating the conditional
probabilities of the network is carried out as follows:
P(A=0) = P(A=0|Y=0)P(Y=0)+P(A=0|Y=1)P(Y=1) = (0,667)(0,53) +
(0,333)(0,47) = 0,49
P(Y=0|A=0) = [(0,667)(0,47)]/0,49 = 0,64
P(Y=1|A=0) = [(0,333)(0,53)]/0,49 = 0,36
111
Chapter 6
Assessment of Human Error using the New Taxonomy and Model
6.3 Quantitative Applications using Bayesian Networks
There is great practical need to understand how human error manifests, how can it be
explained, and how it can be predicted. However, to meet these questions, it is necessary to
understand the relationship between its causes and effects. The effects are observed from the
consequences of human error. The causes are explanations that have been found to what was
observed. A retrospective analysis begins with the evaluation of effects and then seeks to
identify the causes, i.e., the causes are described after the fact. In a prediction analysis, the
causes are initiating events and the effects are possible results. Making a prediction means
combining the causes and effects to anticipate probable errors. Manifestations (or effects) can
be observed, while the causes can only be deduced after an introspection, i.e., by identifying
characteristics of functional activity of cognitive and performance factors related to human
contributing to the errors according to Hollnagel (1998).
The first and second generation of human reliability analysis is based on tools like fault trees.
As a result, they can not satisfactorily model the existing causality in human action. These
techniques of HRA for 1st and 2nd generation present disabilities making them not sufficiently
effective and in need of an evolution to bring significant improvements in relation to humansystem interface. Therefore, it is clear that to model the existing causality in human action has
112
Chapter 6
Assessment of Human Error using the New Taxonomy and Model
become a major challenge for HRA over the years and, consequently, it becomes necessary to
develop a methodology for assessing human reliability. Given this context, modeling human
actions by Bayesian Networks becomes an option to overcome the major shortcomings of
traditional methods, providing greater flexibility to the variable components of a give system
The following comments can be found in Chang & Mosleh (1999). The following are some of
the expectations of these authors and how the use of Bayesian Networks can provide each of
them:
1. Identification of errors in a contextual form and estimation of probabilities: Bayesian
networks contextualize the error, qualitatively through graphical structure and
quantitatively by calculating the conditional probabilities of the network;
2. Best causal models: Bayesian Networks are, by definition, graphical structures that
represent the cause and effect relationships between variables;
3. More formal use of accumulated knowledge in the behavioral sciences: the conditional
probability distributions can represent and quantify any knowledge;
4. More realistic representation of the dynamic nature of human-system interactions:
since all the relations of cause and effect are relevant in the network and Bayesian
expressed by conditional probabilities for each response of the system there is a
corresponding set of conditional probabilities that express the behavior of worker.
Likewise updates to the system’s behavior under the action of the worker;
5. Able to be applied in different contexts: Bayesian networks are a great tool for
analyzing different contexts. For example, monitoring operational problems through
diagnostic and prognostic carried out effectively and efficiently and solve
management problems through knowledge about factors relevant to the system;
6.
Best calibration with current operational events: Bayesian networks can update the
system by subjective inferences and empirical;
7. Consistency: the consistency of a Bayesian network represents any knowledge about a
given system. Therefore, consistency for a particular process will be at least as
satisfying as any other method;
8. Flexibility to represent new knowledge: the inclusion of a new issue on a given effect,
for example, only changes the distribution of conditional probabilities of such an
effect. On the other hand, changing a set of effects does not lead to any changes in its
set of causes. This is also the case of exclusions;
9. Sensitivity to the variability of human behavior: using Bayesian networks it is possible
to treat small deviations in the behavior of the worker, provided that they are
represented in the network. In this case, it is important that the supervisor or person
113
Chapter 6
Assessment of Human Error using the New Taxonomy and Model
who will monitor the system using Bayesian Networks is properly qualified and
trained to capture the deviations from them and make updates to the system. It can be
seen that the characteristics of Bayesian Networks seem to meet many of the
expectations for future HRA methods, thereby demonstrating to be a good approach in
modeling human errors.
In Menezes & Droguett (2005), the Bayesian inference seems more functional than empirical,
because to infer about the “true value” of probability of human error empirically (frequentist
statistic), it is necessary to find the “number of opportunities for error”. In general, making
inferences about the “true value” of the probability of events in a subjective way presents
advantages compared to the frequentist way, and if it is possible to use both is even better.
Next, a Bayesian application using the proposed taxonomy and model presented in Chapter 4
will be presented.
As in section 5.1, the building of a database using the proposed taxonomy makes it possible to
use classical statistics to find the more frequent human error failure mode. However, the
building of this database is not easy and slow, so it is necessary to extract from expert opinion
this knowledge and combine it with Bayesian statistics to make predictions. Many authors
have proposed forms of eliciting the degree of believe from experts, but the method employed
here was proposed by Nadler & Campello (2001) and applied to a power hydroelectrical
process by Menezes & Droguetti (2005).
Observing the diagram in Figure 85 representing the model of error sequence process, one has
the following variables: Berliner Process (X1); Domain (X2); Elementary Behavior (X3);
Failure Mode (X4) and Error Type (X5) to build the Bayesian network. The variable Y will
be used to represent the type of task selected.
114
Chapter 6
Assessment of Human Error using the New Taxonomy and Model
According to the relationship of cause and effect, the follow Bayesian Network can be
constructed (Figure 85):
Y
X1
X2
X5
X3
X4
Figure 85: Bayesian network of a generic task
Analyzing this network:
The task selected Y is the cause of virtually all others variables. Depending on the
selected task all others variables can change their status;
The Berliner process X1 is the cause of the elementary behavior X3;
The domain X2 is the cause of the elementary behavior, the failure mode and the error
type X5;
The elementary behavior X3 is the cause of the failure mode X4;
The failure mode X4 is the cause of the error type X5.
The categorization of Y depends on real cases considered by the analyst. Thus in this case, Y
will be considered as a scenario. So, for a task Y, each variable X1 to X5 can assume the
following values according to tables 16, 17, 18, 19, 20, 21 and 22 and Figure 86.
115
Chapter 6
Assessment of Human Error using the New Taxonomy and Model
Table 16: Values assumed by variables
Node
X1=Berliner Process
X2=Domain
X3=Elementary
behavior
X4=failure mode
X5=error type
Values
{cognitive; perceptive; motor; communication}
{skill; rule; knowledge}
{calculate choose; decide; compare; interpolate; verify; remember;
inspect; observe; read; monitored; explorer; detected; identify;
located; move; hold; push/pull; give; remove; discard; give back;
position; adjust; typing; install; answer; inform; request; register;
order; receive}
{ double capture slip; omission follow interruptions; reduced of
intentionality; perceptual confusions; interference errors; omissions;
repetitions; inversions; first exceptions; signs, countersigns, non
signs; informational overload; rule strength; general rules;
redundancy; rigidity; encoding deficiencies; action deficiencies;
selectivity; workspace limitations; out of sight out of mind;
confirmation bias; overconfidence; biased reviewing; illusory
correlation; halo effect; problems of causality; problems with
complexity; problems of diagnosis}
{slip; mistake}
Considering Y as a scenario and X5 as only a name of the human error it is possible simplify
the Bayesian network as shown in Figure 86.
X1
X2
2
X3
X4
Figure 86: Bayesian network of the error
Analyzing this network:
The elementary behavior X3 depends on the Berliner process X1;
116
Chapter 6
Assessment of Human Error using the New Taxonomy and Model
The domain X2 is the cause of elementary behavior X3 and failure mode X4;
The elementary behavior X3 is the cause of failure mode X4.
Once the network topology is specified, the next step is to quantify the relationship between
the connected nodes. This is done by assigning the probability distribution for each node, thus
building a Conditional Probability Table (CTP). When it comes to discrete variables for each
node, it is required to identify all possible combination of their parent nodes. It is also
necessary to identify the possible values that the variables can take.
Considering the relationship of cause and effects shown in the network in Figure 86, and the
values assumed by variables shown in Table 18, one can built the Conditional Probability
Tables for each variable:
Let’s assume that:
X1=Berliner process
Cognitive=1
Perceptive=2
Motor=3
Communication=4
X2=Domain
Skill=1
Rule=2
Knowledge=3
X3=Elementary Behavior
Calculate=1
Choose=2
Decide=3
Compare=4
Interpolate=5
Verify=6
Remember=7
Inspect=8
Observe=9
Read=10
Monitored=11
Explorer=12
Detected=13
Identify=14
Located=15
Move=16
Hold=17
Push/pull=18
Give=19
Remove=20
Discard=21
117
Chapter 6
Assessment of Human Error using the New Taxonomy and Model
Give back=22
Position=23
Adjust=24
Typing=25
Install=26
Answer=27
Inform=28
Request=29
Register=30
Order=31
Receive=32
X4=Failure Mode
Double capture slip=1
Omission follow interruptions=2
Reduced of intentionality=3
Perceptual confusions=4
Interference errors=5
Omissions=6
Repetitions=7
Inversions=8
First exceptions=9
Sings, countersigns, non sings=10
Informational overload=11
Rule strength=12
General rules=13
Redundancy=14
Rigidity=15
Encoding deficiencies=16
Action deficiencies=17
Selectivity=18
Workspace limitations=19
Out of sight out of mind=20
Confirmation bias=21
Overconfidence=22
Biased reviewing=23
Illusory correlation=23
Halo effect=24
Problems of causality=25
Problems with complexity=26
Problems of diagnosis=27
Table 17: CTP X1
P(X1=1), P(X1=2), P(X1=3), P(X1=4)
X1
1
2
3
4
P(X1=x1) p1 p2
p3 p4
Table 18: CTP X2
P(X2=1), P(X2=2), P(X2=3)
X2
1
2
3
P(X1=x1) p1 p2
p3
118
Chapter 6
Assessment of Human Error using the New Taxonomy and Model
Table 19: CTP X3
X1
X2
X3 1
2
3
4
5
6
7
8
9
10
11
12
13
14
15
16
17
18
19
20
21
22
23
24
25
26
27
28
29
30
31
32
P(X3=X3 | X2, X1)
1
1
1
2
1
2
3
1
p1
p2
p3
0
p4
p5
p6
0
p7
p8
p9
0
p10 p11 p12
0
p13 p14 p15
0
p16 p17 p18
0
p19 p20 p21
0
0
0
0
p22
0
0
0
p25
0
0
0
p28
0
0
0
p31
0
0
0
p34
0
0
0
p37
0
0
0
p40
0
0
0
p43
0
0
0
0
0
0
0
0
0
0
0
0
0
0
0
0
0
0
0
0
0
0
0
0
0
0
0
0
0
0
0
0
0
0
0
0
0
0
0
0
0
0
0
0
0
0
0
0
0
0
0
0
0
0
0
0
0
0
0
0
0
0
0
0
0
0
0
0
2
2
0
0
0
0
0
0
0
p23
p26
p29
p32
p35
p38
p41
p44
0
0
0
0
0
0
0
0
0
0
0
0
0
0
0
0
0
119
2
3
0
0
0
0
0
0
0
p24
p27
p30
p33
p36
p39
p42
p45
0
0
0
0
0
0
0
0
0
0
0
0
0
0
0
0
0
3
1
0
0
0
0
0
0
0
0
0
0
0
0
0
0
0
p46
p49
p52
p55
p58
p61
p64
p67
p70
p73
p76
0
0
0
0
0
0
3
2
0
0
0
0
0
0
0
0
0
0
0
0
0
0
0
p47
p50
p53
p56
p59
p62
p65
p68
p71
p74
p77
0
0
0
0
0
0
3
3
0
0
0
0
0
0
0
0
0
0
0
0
0
0
0
p48
p51
p54
p57
p60
p63
p66
p69
p72
p75
p78
0
0
0
0
0
0
4
1
0
0
0
0
0
0
0
0
0
0
0
0
0
0
0
0
0
0
0
0
0
0
0
0
0
0
p79
p82
p85
p88
p91
p94
4
2
0
0
0
0
0
0
0
0
0
0
0
0
0
0
0
0
0
0
0
0
0
0
0
0
0
0
p80
p83
p86
p89
p92
p95
4
3
0
0
0
0
0
0
0
0
0
0
0
0
0
0
0
0
0
0
0
0
0
0
0
0
0
0
p81
p84
p87
p90
p93
p96
Chapter 6
Assessment of Human Error using the New Taxonomy and Model
For better visualization the table the CTP of X4 will be divided into tree parts:
1. X2=1; X3; X4 <9 Considering that P(X4=X4>8 |X2=2, X3)=0; P(X4=X4>8 | X2=3,
X3)=0
Table 20: CTP X4<9
P(X4=X4<9 | X2=1, X3)
X2
1
1
1
1
1
1
1
1
1
1
1
1
1
1
1
1
1
1
1
1
1
1
1
1
1
1
1
1
1
1
1
1
X3
1
2
3
4
5
6
7
8
9
10
11
12
13
14
15
16
17
18
19
20
21
22
23
24
25
26
27
28
29
30
31
32
1
p1
p9
p17
p25
p33
p41
p49
p57
p65
p73
p81
p89
p97
p105
p113
p121
p129
p137
p145
p153
p161
p169
p177
p185
p193
p201
p209
p217
p225
p233
p241
p249
2
p2
p10
p18
p26
p34
p42
p50
p58
p66
p74
p82
p90
p98
p106
p114
p122
p130
p138
p146
p154
p162
p170
p178
p186
p194
p202
p210
p218
p226
p234
p242
p250
3
p3
p11
p19
p27
p35
p43
p51
p59
p67
p75
p83
p91
p99
p107
p115
p123
p131
p139
p147
p155
p163
p171
p179
p187
p195
p203
p211
p219
p227
p235
p243
p251
120
X4
4
5
p4
p5
p12 p13
p20 p21
p28 p29
p36 p37
p44 p45
p52 p53
p60 p61
p68 p69
p76 p77
p84 p85
p92 p93
p100 p101
p108 p109
p116 p117
p124 p125
p132 p133
p140 p141
p148 p149
p156 p157
p164 p165
p172 p173
p180 p181
p188 p189
p196 p197
p204 p205
p212 p213
p220 p221
p228 p229
p236 p237
p244 p245
p252 p253
6
p6
p14
p22
p30
p38
p46
p54
p62
p70
p78
p86
p94
p102
p110
p118
p126
p134
p142
p150
p158
p166
p174
p182
p190
p198
p206
p214
p222
p230
p238
p246
p254
7
p7
p15
p23
p31
p39
p47
p55
p63
p71
p79
p87
p95
p103
p111
p119
p127
p135
p143
p151
p159
p167
p175
p183
p191
p199
p207
p215
p223
p231
p239
p247
p255
8
p8
p16
p24
p32
p40
p48
p56
p64
p72
p80
p88
p96
p104
p112
p120
p128
p136
p144
p152
p160
p168
p176
p184
p192
p200
p208
p216
p224
p232
p240
p248
p256
Chapter 6
Assessment of Human Error using the New Taxonomy and Model
2. X2=2;X3; 8<X4<18
Considering
P(X4=8<X4>18 | X2=3, X3)=0
that
P(X4=8<X4>18
|X2=1,
X3)=0;
Table 21: CTP 8<X4<18
P(X4=8<X4<18 | X2=2, X3)
X2
2
2
2
2
2
2
2
2
2
2
2
2
2
2
2
2
2
2
2
2
2
2
2
2
2
2
2
2
2
2
2
2
X3
1
2
3
4
5
6
7
8
9
10
11
12
13
14
15
16
17
18
19
20
21
22
23
24
25
26
27
28
29
30
31
32
9
p1
p10
p19
p28
p38
p47
p56
p65
p74
p83
p92
p101
p110
p119
p128
p137
p146
p155
p164
p173
p182
p191
p200
p209
p218
p227
p236
p245
p254
p263
p272
p281
10
p2
p11
p20
p29
p39
p48
p57
p66
p75
p84
p93
p102
p111
p120
p129
p138
p147
p156
p165
p174
p183
p192
p201
p210
p219
p228
p237
p246
p255
p264
p273
p282
11
p3
p12
p21
p30
p40
p49
p58
p67
p76
p85
p94
p103
p112
p121
p130
p139
p148
p157
p166
p175
p184
p193
p202
p211
p220
p229
p238
p247
p256
p265
p274
p283
121
12
p4
p13
p22
p31
p41
p50
p59
p68
p77
p86
p95
p104
p113
p122
p131
p140
p149
p158
p167
p176
p185
p194
p203
p212
p221
p230
p239
p248
p257
p266
p275
p284
X4
13
p5
p14
p23
p33
p42
p51
p60
p69
p78
p87
p96
p105
p114
p123
p132
p141
p150
p159
p168
p177
p186
p195
p204
p213
p222
p231
p240
p249
p258
p267
p276
p285
14
p6
p15
p24
p34
p43
p52
p61
p70
p79
p88
p97
p106
p115
p124
p133
p142
p151
p160
p169
p178
p187
p196
p205
p214
p223
p232
p241
p250
p259
p268
p277
p286
15
p7
p16
p25
p35
p44
p53
p62
p71
p80
p89
p98
p107
p116
p125
p134
p143
p152
p161
p170
p179
p188
p197
p206
p215
p224
p233
p242
p251
p260
p269
p278
p287
16
p8
p17
p26
p36
p45
p54
p63
p72
p81
p90
p99
p108
p117
p126
p135
p144
p153
p162
p171
p180
p189
p198
p207
p216
p225
p234
p243
p252
p261
p270
p279
p288
17
p9
p18
p27
p37
p46
p55
p64
p73
p82
p91
p100
p109
p118
p127
p136
p145
p154
p163
p172
p181
p190
p199
p208
p217
p226
p235
p244
p253
p262
p271
p280
p289
Chapter 6
Assessment of Human Error using the New Taxonomy and Model
3. X2=3;X3; X4>17 Considering that P(X4=X4>17 |X2=1, X3)=0; P(X4=X4>17 | X2=2,
X3)=0
Table 22: CTP X4>17
X2
3
3
3
3
3
3
3
3
3
3
3
3
3
3
3
3
3
3
3
3
3
3
3
3
3
3
3
3
3
3
3
3
X3
1
2
3
4
5
6
7
8
9
10
11
12
13
14
15
16
17
18
19
20
21
22
23
24
25
26
27
28
29
30
31
32
18
p1
p12
p23
p34
p45
p56
p68
p79
p90
p101
p112
p123
p134
p145
p156
p167
p178
p189
p200
p211
p222
p233
p244
p255
p267
p278
p289
p300
p311
p322
p333
p344
19
p2
p13
p24
p35
p46
p57
p69
p80
p91
p102
p113
p124
p135
p146
p157
p168
p179
p190
p201
p212
p223
p234
p245
p256
p268
p279
p290
p301
p312
p323
p334
p345
P(X4=X4>17 | X2=3, X3)
X4
20
21
22
23
p3
p4
p5
p6
p14 p15 p16 p17
p25 p26 p27 p28
p36 p37 p38 p39
p47 p48 p49 p50
p58 p59 p60 p61
p70 p71 p72 p73
p81 p82 p83 p84
p92 p93 p94 p95
p103 p104 p105 p106
p114 p115 p116 p117
p125 p126 p127 p128
p136 p137 p138 p139
p147 p148 p149 p150
p158 p159 p160 p161
p169 p170 p171 p172
p180 p181 p182 p183
p191 p192 p193 p194
p202 p203 p204 p205
p213 p214 p215 p216
p224 p225 p226 p227
p235 p236 p237 p238
p246 p247 p248 p249
p257 p258 p259 p260
p269 p270 p271 p272
p280 p281 p282 p283
p291 p292 p293 p294
p302 p303 p304 p305
p313 p314 p315 p316
p324 p325 p326 p327
p335 p336 p337 p338
p346 p347 p348 p349
24
p7
p18
p29
p40
p51
p62
p74
p85
p96
p107
p118
p129
p140
p151
p162
p173
p184
p195
p206
p217
p228
p239
p250
p261
p273
p284
p295
p306
p317
p328
p339
p350
25
p8
p19
p30
p41
p52
p63
p75
p86
p97
p108
p119
p130
p141
p152
p163
p174
p185
p196
p207
p218
p229
p240
p251
p262
p274
p285
p296
p307
p318
p329
p340
p351
26
p9
p20
p31
p42
p53
p65
p76
p87
p98
p109
p120
p131
p142
p153
p164
p175
p186
p197
p208
p219
p230
p241
p252
p263
p275
p286
p297
p308
p319
p330
p341
p352
27
p10
p21
p32
p43
p54
p66
p77
p88
p99
p110
p121
p132
p143
p154
p165
p176
p187
p198
p209
p220
p231
p242
p253
p264
p276
p287
p298
p309
p320
p331
p342
p353
28
p11
p22
p33
p44
p55
p67
p78
p89
p100
p111
p122
p133
p144
p155
p166
p177
p188
p199
p210
p221
p232
p243
p254
p265
p277
p288
p299
p310
p321
p332
p343
p354
All probabilities here described need to be estimated. A database with these frequencies could
be the best form to get this information. But the lack of a database with this information turns
it almost impossible to get these frequencies. A study as the done in Section 5.1 is an
adequate starting point to obtain this information. Note however, that a long time will be
necessary to build this database. Therefore, opinion expert elicitation is another form to get
this information. As was previously mentioned, there are many difficulties to perform an
122
Chapter 6
Assessment of Human Error using the New Taxonomy and Model
elicitation, but this approach could be an adequate solution while the database is in the
implementation process. At the end of this process, the Bayesian network is ready to generate
a posterior distribution in the presence of empirical evidence, subjective or both. This
provides great flexibility to the analyst because it is possible to verify the likelihood of human
error during the execution of a task through the observation made on the state of the worker.
6.4 Example of Application
As it can be seen, in tables 17,18,19,20,21 and 22, there is a lot of condicional probabilities
that have to be found. As it does not exist a data bank with enough data to be processed, the
elicitation of the opinion of experts is one way to get this data. However, it is a complex task.
First, the amount of estimation is very difficult to get and, to find experts in the process under
investigation with availability within companies to be elicitated, turns the task so really to be
realized. In order to be able to contemplate this proposed taxonomy and model, a toy model,
simplifies the developed one. This toy model was based on a real case colected from a
Brazilian hydroelectric power company presented in Annex 4, and the expert used to perform
the elicitation was the author of this thesis, expert with more than 30 years working for this
company and the area of interest.
For this toy model, the Report error n.083 (see Annex 8) was chosen.
Report error n. 083 September, 16 2004, load interrupted 70,00MW.
Summarized description: The accidental shutdown of circuit breakers 14G2 and 13T2 has
as root cause the failure to identify the sources of which one was defective and unduly control
pushbutton reset from another source that presented itself to normal operation.
The detailed analysis of this event revealed that:
1. The maintenance team was called because a circuit breaker was not working;
2. There is a written rule to identify a faulty breaker;
3. The worker chose the correct rule;
4. The worker failured to choose the faulty breaker;
5. The worker shutdown the wrong breaker.
Comments:
The worker was an expert and had correctly performed this kind of task several
times;
The worker chose a written rule;
123
Chapter 6
Assessment of Human Error using the New Taxonomy and Model
The worker chose the correct rule but performed it wrongly;
The worker was on domain of skill-based and committed a slip, according to
Figure 14; (start task; There is a rule known to perform the task? Yes; Worker
chooses the rule? Yes; Worker chooses the right rule? Yes; Worker performed
the rule correctly? No; Skill-based Failure mode).
In order to solve a problem and to make a decision, the worker wrongly
chooses after considering many options. This is a pair of Berliner process:
cognitive process and the elementary behavior: choose;
The worker performed the task without paying due attention to what he was
doing. This failure mode is: perceptual confusions.
Figure 87 shows the taxonomy and model to RDFH n.083.
Berliner Process
Domain
Cognitive
Skill
Elementary Behavior
Choose
Failure Mode
Perceptual confusions
Error type
Slip
Figure 87: Sequence of error process RDFH n.083
The operator used the Cognitive process that is: to solve problems and to make a decision, to
choose the faulty breaker, he perceived that there was written rule and he chose the correct
rule but he performed the correct rule wrongly soon he was under the domain of skill-based to
perform the task. When the worker cognitively decided to perform the task, he committed a
failure mode named perceptual confusions that is: operators perform tasks without paying due
attention to what they are doing and committed a slip and the task was performed without
success.
For this toy model, the relationship of cause and effects shown in Bayesian network in Figure
88 will be considered. To build the corresponding CTPs, some assumptions in order to
simplify the elicitation process will be assumed. Let’s assume that:
The Berliner Process was not elicitated, frequency data from descritive statistic colected
in Chapter 4 was used;
The Domain was not elicitated, frequency data from descritive statistic colected in
Chapter 4 was used;
124
Chapter 6
Assessment of Human Error using the New Taxonomy and Model
The Elementary Behavior was elicitated, but as shown in Figure 28 , the frequency of
more than 75% of elementary behavior were: Identify, Compare, Move, Remember,
Decide, Remove, and the others elementary behavior named: Others.
The Failure Mode was elicited, but as shown in Figure 29 , the frequency of more than
74% of failure mode were: Perceptual Confusions, Biased Reviewing, Encoding
Deficiencies, Omission, and the others failure mode named: Others.
Berliner Process
Domain
Failure
Mode
Elementary
Behavior
Figure 88- Bayesian network for toy model
Assuming that:
Berliner Process (X1): Cognitive=1; Perceptive=2; Motor=3; and Communication=4
Domain (X2): Skill=1; Rule=2; Knowledge=3
Elementary Behavior (X3): Identify=1; Compare=2; Move=3; Remember=4; Decide=5;
Remove=6; Others=7
Failure
Mode
(X4):
Perceptual
Confusions=1;
Biased
Reviewing=2;
Deficiencies=3; Omission=4; Others=5
The following tables are built
Table 23- Berliner Process
X1
Cognitive Perceptive Motor Communication
Frequency X1
0,33
0,33
0,33
125
0,01
Encoding
Chapter 6
Assessment of Human Error using the New Taxonomy and Model
Table 24 – Domain
X2
Skill
Rule
Knowledge
Frequency X2
0,52
0,24
0,24
Table 25 – CTP Elementary Behavior
P(X3=X3 X2,X1)
X3 – Elementary Behavior
X1 X2
1
2
3
4
5
6
7
1
1
0
0,6
0
0,2
0,1
0
0,1
1
2
0
0,3
0
0,3
0,3
0
0,1
1
3
0
0,35
0
0,3
0,3
0
0,05
2
1
1
0
0
0
0
0
0
2
2
1
0
0
0
0
0
0
2
3
1
0
0
0
0
0
0
3
1
0
0
0,8
0
0
0,1
0,1
3
2
0
0
0,7
0
0
0,2
0,1
3
3
0
0
0,8
0
0
0,1
0,1
4
1
0
0
0
0
0
0
1
4
2
0
0
0
0
0
0
1
4
3
0
0
0
0
0
0
1
126
Chapter 6
Assessment of Human Error using the New Taxonomy and Model
Table 26 – CTP X4 – Failure Mode
P(X4=X4 X2, X3)
X2
X3
X4 – Failure Mode
1
2
3
4
5
1
1
0,4
0
0
0,4
0,2
1
2
0,5
0
0
0,45
0,05
1
3
0,4
0
0
0,5
0,1
1
4
0,8
0
0
0,1
0,1
1
5
0,7
0
0
0,2
0,1
1
6
0,5
0
0
0,5
0
1
7
0,3
0
0
0,3
0,4
2
1
0
0
0,9
0
0,1
2
2
0
0
0,9
0
0,1
2
3
0
0
0,9
0
0,1
2
4
0
0
0,9
0
0,1
2
5
0
0
0,9
0
0,1
2
6
0
0
0,9
0
0,1
2
7
0
0
0,5
0
0,5
3
1
0
0,9
0
0
0,1
3
2
0
0,9
0
0
0,1
3
3
0
0,9
0
0
0,1
3
4
0
0,9
0
0
0,1
3
5
0
0,9
0
0
0,1
3
6
0
0,9
0
0
0,1
3
7
0
0,5
0
0
0,5
In Tables 25 and 26, the condicional probabilities were estimated by Eng Gilberto Duarte,
considering the case shown in Report error n.083.
127
Chapter 6
Assessment of Human Error using the New Taxonomy and Model
Using E&P Office 3 shown in Figure 89, tables data 23,24,25,and 26 were processed.
Figure 89 – E&P Office 3
128
Chapter 6
Assessment of Human Error using the New Taxonomy and Model
As a result of the simulation, the following analysis can be done:
The Failure Mode is the most difficult form to characterize the error and the most
difficult form to analyze the worker behavior when he/she is erring. Knowing the
probability distributions of the failure modes, actions can be taken to minimize the
error or maybe the undesirable outcome. Considering the example of the toy model,
the worker commited an accidental shutdown of circuit breakers.
Figure 90 – Simulation – Failure Mode.
Considering the performed conditions and the expert opinion, the result shown in
Figure 90 describes a probability distribution for the failure modes: Perceptual
Confusions (23,5%); Omission (21%) and Biased Reviewing (21%).
Perceptual Confusion (Operator perform tasks without paying due attention to what
they are doing) , represents a clear attention deficit. From this distribution one can take
preventive actions in similar activities in the future, thus creating a scenario for
reduction of human errors.
129
Chapter 6
Assessment of Human Error using the New Taxonomy and Model
Considering the performed conditions and the opinion of the expert, the result shown
in Figure 91 describe a probability distribution for the the Elementary Behavior:
Identify (33%) and Move (25,6%).
Identify (to acknowledge the nature or indication of an object, according its implicit or
predetermined characteristics).
A training program that helps workers to better
identify the most important objects in a substation can reduce human errors. A review
of the identification codes and signaling could also help operators.
Figure 91 – Simulation – Elementary Behavior
130
Chapter 6
Assessment of Human Error using the New Taxonomy and Model
If the Elementary Behavior identify is taken as evidence, and Berliner process
cognitive is taken as evidence, the result shown in Figure 91 presents failure mode:
encoding deficiences with 90%.
Figure 91 – Simulation with Evidence
From this model, and using a Bayesian network, it is possible to perform various analysis and
to build a program for prevention of human errors in hydroelectric power companies.
131
Chapter 7
Conclusions
7. CONCLUSIONS
This chapter presents a final discussion about the importance of taxonomy, model and
application using BBN-Based methodology to analyze the human error in power
hydroelectric systems. It also presents some difficulties on building a significant and robust
database in order to help the development of policies for reducing the impact of human error
on power hydroelectric companies. It finally presents some suggestions for future research.
This thesis presented a new taxonomy to classify human errors using the concepts proposed
by Rasmussen and Reason and the classification to elementary behavior proposed by
Berlinner. The combination of these concepts lead to a new taxonomy that classifies the
human error of the worker when he/she is performing intervention (operator/maintenance) in
the context of hydroelectric power systems. (See Figure 10). This more comprehensive
classification allows the analyst to build a table with the human error description and
classification of a set of occurrences collected in the field about interventions
(operaton/maintenance) on hydroelectric power system that resulted in shutdown (blackout)
caused by human error. This new taxonomy does not use Performance Shaping Factors
(PSFs) because in hydroelectric power companies, data about the influence of PSFs on human
error generally are scarce and mostly non-existent.
The analysis of 605 reported cases of human error over a period of ten years, indicated that
the proposed taxonomy successfully translates the information in a standardized way of
human error in the context of the Brazilian hydroelectric power industry. All these analyzes,
the data collected and the database, are presented in Annex 8 and Annex 9. From the database
built based on the proposed taxonomy (Annex 8), it was possible to present descriptive
statistics in Chapter 5 where it was presented through tables and graphs with comments and
examples, trends, frequency, seasonality and contingencies.
However, only the proposed taxonomy was not sufficient to show the sequence of mental
events and relations of cause and effect that can lead a worker to commit human error.
Therefore, it was presented a model based on the proposed taxonomy that shows the sequence
of mental choice and the relations of cause and effect. (See Figure 13 and 14).
In Chapter 6, it was developed a BBN-based methodology with the goal of applying the
proposed taxonomy and model to quantify the human error in the context of the hydroelectric
power industry. A Bayesian network with relations of cause and effect using the variables
porposed in taxonomy and model (See Figure 74) was developed. Conditional Probability
Tables CTP (See Tables 10, 11, 12, 13, 14,15), were constructed for the Bayesian Network.
132
Chapter 7
Conclusions
Through some simplifications, data using descriptive statistics presented in Chapter 5 and an
expert elicitation for construction of CTPs, it was designed an example of application using
the proposed Bayesian Network model. Through the E & P software Office 3, some analyzes
were performed with quantification of human error in the context of the Brazilian company
under consideration.
The work proposed in this thesis presents limitations so that further research is needed. The
taxonomy needs simplification to be adapted and be feasible to applications by persons with
expertise in electrical systems and in the same time expert in human reliability. Much training
is required to prepare an analyst with conditions to apply this taxonomy. The taxonomy is
somewhat complex to be applied. The elementary behavior has many options with
overlapping boundaries, the failure mode is complex to choose from and also with
overlapping boundaries. The analysis of RDFH is difficult to perform because of its overly
technical language and with many subjective questions. It is so difficult to extract the root
cause of human error from RDFH. It is difficult to decide in what step the error really
occurred, because it’s necessary to realize what the worker was thinking in the exact moment
when his action was deviated and the action was performed without success.
The models have an unclear union between the Berliner process and the failure mode. It is
necessary to spend more time to fit this question. This union it is essential to understand the
behavior of the worker in hydroelectric power system. The cognitive union of this variable
must be better defined in the model.
It is mandatory to start the building of the database proposed in this thesis. From this
database, many questions that were posted in this work could be answered. Through data
analysis, it will be possible to reduce the overlay of boundaries between variables and reduce
the number of different types of failure mode for a specific company.
133
Chapter 9
Annex
8. REFERENCES
Arrifano, N. S. D., Oliveira, V. A. (2004) Projeto de Controladores Fuzzy para Sistemas nãoLineares com Saltos Markovianos usando Matlab. Departamento de Engenharia Elétrica da
Universidade de São Paulo, São Carlos, SP.
Bedford, T.J. and Bayley, Clare (2008) Sensitivity analysis of the CREAM method for
Human Reliability. Working Paper. University of Strathclyde. (Unpublished Sensitivity
analysis of the CREAM method for Human Reliability)
Begosso, L. C. (2005). S. PERERE - Uma Ferramenta Apoiada por Arquiteturas Cognitivas
para o Estudo da Confiabilidade Humana. Engenharia Elétrica. São Paulo, Escola Politécnica
da Universidade de São Paulo. Thesis for degree of Doutor.
Berliner, D. C., D. Angell, et al. (1964). Behaviors, measures and instruments for
performance evaluation in simulated environments. Symposium and Workshop on the
Quantification of Human Performance. Albuquerque - New Mexico: 277-296.
Chang, Y. H. & Mosleh, A. (1999) - Cognitive modeling and dynamic probabilistic
simulation of operating crew response to complex system accidents (ADS-IDACrew) Center
for Technology Risk Studies University of Maryland
Duarte, D. (2003) A performance overview about fire risk management in the Brazilian
hydroelectric generating plants and transmission network – Journal of Loss Prevention in the
Process Industries – Elsevier
Hollnagel, E. (1998). Cognitive Reliability and Error Analysis Method, Elsevier. Halden,
Norway.
Ishikawa, K. (1993) - Controle de qualidade total à maneira japonesa/ Total quality control in
japanese manner - Rio de Janeiro Campus
Korb, K. B. & Nicholson, A. E. (2003) – Bayesian artificial intelligence. Chapman &
Hall/CRC. Florida
Martz, H. F. & Waller, R. A. (1982) – Bayesian Reliability Analysis 2nd ed. Krieger
Publishing Company. Florida
Menezês, R. C. & E. L. Droguett (2005). Uma metodologia para a avaliação da confiabilidade
humana em atividades de substituição de cadeias de isoladores em linhas de transmissão.
Recife, Universidade Federal de Pernambuco. Dissertacão de Mestrado.
NADLER, G. C. & CAMPELLO, F. M. (2001) - In: 2o International Symposium on Imprecise
Probabilities and Their Applications. New York. A protocol for the elicitation of prior
distributions.
Neapolitan, R. E. (2004) – Learning Bayesian Networks. Pearson Prentice Hall. New Jersey.
Rasmussen, Jens. (1982). "Human Error: A Taxonomy for Describing Human Malfunction in
Industrial Installation." Journal of Occupational Accidents 4: 311-333.
134
Chapter 9
Annex
Rasmussen, Jens. (1983) - Skill, Rules, Knowledge: signals, signs and symbols and other
distinction in human performance models. IEEE transactions: Systems, Man & Cybernetic
Rasmussen, Jens. (1999). "The concept of human error: is it useful for the design of safe
systems?" Safety Science Monitor 3.
Rasmussen, Jens. (2003). "The role of error in organizing behavior." Quality Safety Health
Care - QSHC 12: 377-383.
Reason, J. (1990). Human Error. Cambridge, Cambridge University Press.
Reason, J. and M. Maddox (2005). Human Error, Next Page Live Publish.
Swain, A. D. (1989). Comparative evaluation of method for human reliability analysis (GRS71). Garching, FRG: Gesellshaft für Reaktorsicherheit.
Swain, A. D. and H. E. Guttmann (1983). Handbook of Human Reliability Analysis with
Emphasis on Nuclear Power Plant Application. Washington, US Nuclear Regulatory
Commission. NUREG.
Souza, F. P. S.; Firmino, P. R. A.; Droguett, E. A. L (2010). – A Análise Confiabilidade
Humana: uma revisão comentada da literatura – XLII SBPO Rio Grande do Sul - Brasil
Scherer, D.; Vieira, M.F.Q. et al (2010)- Taxonomy Proposal for the Description of Accidents
and Incidents in Electrical System Operation. EICS`10 Berlin, Germany.
Wreathall, J. (1982). Operator action trees. An approach to quantifying operator error
probability during accident sequences, NUS-4159. San Diego, CA: NUS Corporation.
www.eletrobras.com
www.gnu.org
135
Chapter 9
Annex
9. ANNEX
ANNEX 1 – Human Error Report – RDFH/DMS 01/09
1- SUMÁRIO DA OCORRÊNCIA:
1.1 – Local: SE CCD
1.2 – Data / Hora: 02/08/2009 às 12h 07 min
1.3 – DESCRIÇÃO SUCINTA DA OCORRÊNCIA:
Após conclusão das atividades de substituição da bucha do transformador 04T1 da SE CCD,
ocorrida em 02.08.2009, no período das 09 às 12:00, foi devolvido o equipamento à
Operação, conforme previsto, sendo energizado às 12h 04 min.
Às 12 h 07 min, ocorreram os desarmes dos disjuntores 14W1 e 12M1, através da chave 86 T,
motivado devoido a válvula de segurança do transformador 04T1 encontar-se atuada.
Às 12 h 12 min, após inspeção no equipamento, foi constatado a válvula que a segurança
estava atuada.
Às 12 h 13 min foi normalizado a atuação da válvula, pela equipe do CORE/SPMS e
informado à Operação para energização do transformador.
Às 12 h 15 min foram fechados os disjuntores 14W1 e 12M1, normalizando o suprimento da
carga.
2 - FATOS E DADOS RELEVANTES
A substituição da bucha do transformador 04T1 estava prevista no PT 2009, sendo
programada e cancelada por duas vezes, anteriormente, devido às condições climáticas
desfavoráveis.
A programação para o mês de agosto de 2009 foi motivada pela previsão de aumento
de carga a partir do mês de setembro de 2009, na barra de 69 kV, e conseqüente
aumento de carga para o transformador 04T2, na ocasião do desligamento do
transformador 04T1 para substituição da bucha.
Havia vazamento de óleo pela referida bucha, acarretando a possibilidade de falha no
equipamento.
3 - CARGAS INTERROMPIDAS
Cargas da barra de 69 kV: 9,96 MW, durante 8 minutos.
136
Chapter 9
Annex
4 - ANÁLISES DE DESEMPENHO DAS EQUIPES
4.1 - Equipe de operação
As atividades de liberação do equipamento (04T1) ocorreram dentro do previsto, ou seja:
aberto o disjuntor 12M1, aberto o disjuntor 14W1 e em seguida as chaves 34T1-8 e 32T1-8 e
em seguida fechado o disjuntor 14W1, fecha o 12M1 e passa a chave CHT de proteção do
04T1 da posição operação para a posição manutenção. No retorno do equipamento foram
realizadas as seguintes manobras: Aberto os disjuntores 14W1 e 12M1, fechadas as chaves
34T1-8 e 32T1-8, fecha os disjuntores 12M1 e 14W1 e em seguida operando a chave de
proteção “ CHT” do trafo 04T1(item 5.16 – 12:07hs) contrariando o programa de manobras
(PGM) do CROP, que previa o fechamento da referida chave de proteção do trafo 04T1 antes
do fechamento do disjuntos 14W1/12M1 o que resultou abertura do disjuntor(item 5.16 –
12:07). A inversão da operação do item 5.17 (fechar disjuntor) antes do item 5.16( passar a
chave CHT do 04T1 da posição “O” EM MANUTENÇÃO para a posição “1” EM
OPERAÇÃO ), poderia ter evitado a saída do trafo pois seria identificado a atuação da
proteção, antes do retorno do equipamento pela sinalização na Sala de Comando.
4.2 - Equipes de Manutenção – CORE / SPMS
Para a troca e adequação de uma bucha de 230KV o CORE normalmente realiza em 6 horas
com uma equipe de 5 pessoas. Em face de restrições operacionais da SE devido a sobrecarga
no trafo 04T2 a atividade de troca/adequação da bucha foi programada para um tempo de 3
horas, reduzindo pela metade o tempo normalmente estabelecido pelo CORE. Como o tempo
foi reduzido a metade do período previsto foi necessário incluir na atividade uma equipe
dobrada, ou seja, em vez de 5, 10 pessoas. Considerando que foi dobrada quantidade de
pessoas foi necessário subir na tampa superior do transformador, onde ficava a válvula de
segurança. A quantidade demasiada de pessoas sobre o trafo pode ter contribuído para a
atuação do micro-swicth da válvula de segurança. A condução do planejamento e a
disponibilização de infra-estrutura de material e pessoal para atender os prazos previstos no
cronograma teve desempenho satisfatório, tendo disponibilizado o equipamento dentro do
prazo previsto para energização. Apesar do bom planejamento executivo ( PEX), a supervisão
poderia ter realizado um controle mais eficaz das pessoas que ficaram trabalhando na tampa
do trafo e no final da montagem da bucha ter realizado uma avaliação mais detalhada das
possíveis falhas/danos em componentes na parte superior do trafo. Se tal procedimento fosse
realizado poderia ter evitado a ocorrência.
4.3 – Equipe de Proteção – SPCP
Não participou das atividades
137
Chapter 9
Annex
5 – RECOMENDAÇÕES
Manutenção
DMS/DOMA
Divulgar com todo sistema organizacional a ocorrência, para que fatos desta natureza
não ocorram mais em nosso sistema organizacional – Seminário de falha e vidio
conferencia ( até 30/03/2010)
SPMS
Instalar uma proteção mecânica na parte superior do compartimento que aloja microswicth da válvula de segurança, visando impedir a sua atuação através de pequenos
choques mecânicos ( até 30/10/2009).
Incluir o PMP – Procedimento de Manutenção Padrão em Transformadores /Reatores
e Reguladores para atividades desta natureza que ora só é utilizado em montagens e
reparo de equipamento que envolve movimentação de óleo (item teste da proteção
própria antes da devolução) – até (03/11/2009)
CORE
Incluir o PMP – Procedimento de Manutenção Padrão em Transformadores /Reatores
e Reguladores para atividades desta natureza que ora só é utilizado em montagens e
reparo de equipamento que envolve movimentação de óleo (item teste da proteção
própria antes da devolução) – Já atendido
CROP
Modificar os RTMs dos trafos de CCD, bem como em outras instalações que existam
esquemas de proteção similares, a necessidade do operador de sistema receber a
confirmação do operador de instalação da manobra da chave CHT que ativação a
proteção, antes que se autorize a energização do equipamento ( até 30/10/2009 );
SPOI
Disseminar com a equipe de operadores de CCD a análise da ocorrência destacando os
aspectos de urgência de manobras decorrentes de parcela variável versus riscos de erro
humano ( até 30/10/2009 ).
Realizar treinamento de reciclagem do normativo de comunicação verbal com os
Operadores de CCD (até 30/10/2009).
SPCP
Modificar, tanto para o 04T1 quanto para o 04T2, a supervisão do quadro sinóptico
para que sinalize as proteções atuadas de forma independente da posição da chave
CHT (até 31/10/2009).
138
Chapter 9
Annex
6 – CONCLUSÃO
A saída das cargas foram motivada pela atuação, da válvula de segurança que foi operada
durante a realização das atividades da substituição da bucha, motivado pela grande presença
de pessoas na tampa superior do transformador. Apesar da atuação do micro-swicth da
válvula de segurança, caso não tivesse havido a inversão dos itens 5.17/5.18 pelo item 5.16 do
programa de manobras(PGM), a Operação, poderia ter identificado a atuação da válvula e
solicitado a correção das anomalias.
ELABORADO POR
Eng. XXXXXXXXXXXX
Eng. XXXXXXXX / CORE
Assist. Tec. XXXXXXXX / CORE.
139
Chapter 9
Annex
ANNEX 2 – Human Error Report - RDFH –GRP 04/04
1. - SUMÁRIO DA OCORRÊNCIA:
1.1 – Local: SALA DE COMANDO DA USD.
1.2 – Data: 16/09/2004.
1.3 – Horário: 14:53h.
1.4 – DESCRIÇÃO SUCINTA DA OCORRÊNCIA:
Desligamento automático dos disjuntores 14G2 da unidade geradora 01G2 USD, e 13T2 da
LT 03C1 por Falha Humana, devido comando manual de “rearme” na fonte CC do Regulador
de Tensão, quando equipe do SPEU realizava manutenção corretiva no referido circuito. O
rearme foi comandado na tela frontal do conversor CC/CC de 250 V / 15 V, de fabricação
Guardian, durante intervenção para normalizar sinalização “Falha Regulador de Tensão Alarme Agrupado” no 01G2 USD. No momento do desligamento a unidade se encontrava
com 70 MW.
2. – HISTÓRICO DETALHADO:
2.1 – CONFIGURAÇÃO DO SISTEMA ANTES DA OCORRÊNCIA:
Unidade Geradora 01G2 USD, no sistema com 70 MW, alimentando os Serviços Auxiliares
da USD e a SE - Zebu através da Linha 03C1.
2.2 - SEQÜÊNCIA DOS DESLIGAMENTOS E DA RECOMPOSIÇÃO:
Dia 16/09/2004 - às 14:53h, houve abertura dos disjuntores 14G2 e 13T2, operando a chave
de bloqueio 86 WL, sinalizando “Falha Regulador de Tensão”, pela desatuação do relé
auxiliar d3 de supervisão de falha nas fontes CA e CC (fls. 18 do desenho do Regulador de
Tensão), devido ao zeramento da saída do conversor de corrente contínua de 250V / 15V – a
fonte AC/DC estava inoperante, e era a causa fundamental da anomalia.
Dia 16/09/2004 às 15:02h, foi paralelado o gerador através do 14G2, e às 15:03h foi
fechado o 13T2, colocando a LT 03C1, que alimenta a SE-Zebu, em carga.
2.3 – CARGAS INTERROMPIDAS:
Houve interrupção do fornecimento de 70 MW, que era o carregamento da unidade geradora
no instante do desligamento. Este fornecimento foi suprido por outros geradores XXXX, não
trazendo perturbações para o sistema.
3. - FATOS E DADOS RELEVANTES
3.1 – CRONOLOGIA DAS AÇÕES:
Dia 13/09/2004 – O trafo da unidade geradora 01G2 USD estava alimentado de retorno,
para suprir os Serviços Auxiliares de 13,8 kV, quando o SPEU foi solicitado para desadequar
a proteção de “3V0”, uma vez que aquela unidade deveria retornar ao sistema devido à
140
Chapter 9
Annex
indisponibilidade naquela data de unidades geradoras da UST e ULG. Quando do comando de
fechamento do disjuntor de campo do 01G2 USD, pelo Operador, o mesmo não foi aceito. Foi
verificado ainda pela operação, que o Regulador de Tensão estava sinalizando “Falha
Regulador de Tensão – Alarme Agrupado”. O SPEU voltou a ser acionado, e interviu a partir
das 18:10h, utilizando como Planejamento Executivo, o PEX – 0194/04 e APP anexos,
quando verificou que a fonte de 250 Vcc / + 15 Vcc estava com o led de cor verde apagado,
indicando alguma anormalidade, e sua saída zerada. (Estes Reguladores possuem três fontes
em paralelo, isoladas através de diodos separadores - uma delas a partir do 127 Vac com duas
saídas, uma de + 15 e outra de – 15 Vcc, e outras duas fontes a partir de 250 Vcc com saídas
de +15 e - 15Vcc. A fonte ac tem dois leds: um vermelho na saída positiva e outro verde na
saída negativa, que permanecem acesos enquanto suas saídas estiverem normais. As fontes cc
têm por sua vez, quatro leds: três vermelhos, que permanecem apagados em condições
normais, e acendem quando ocorrer Subtensão na Entrada, Sobre-tensão na Saída, e o último,
quando a fonte estiver em Sobrecarga, enquanto que o quarto led é de cor verde e permanece
aceso enquanto o suprimento interno da fonte estiver Normal). Esta fonte defeituosa de 250
Vcc / + 15Vcc, foi substituída, sendo outra vez acionado o comando de fechamento do
disjuntor de campo, mais uma vez sem sucesso. O disjuntor de campo foi então retirado do
seu painel, recebeu manutenção interna, e quando comandado mais uma vez, aceitou
fechamento sendo a unidade geradora excitada e retornando ao sistema às 23:10h.
Dia 14/09/2004 – A unidade voltou a sinalizar “Falha Regulador de Tensão – Alarme
Agrupado”
Dia 16/09/2004 – Às 14:25h, o SPEU interviu na 01G2 USD para normalizar a sinalização
do Regulador de Tensão, através da SI SPEU-0328/04 e Planejamento Executivo / PEX –
0197/04 e APP, anexos. Todos os leds das três fontes estavam em sua configuração normal. O
responsável pela intervenção em lugar de medir a tensão logo nas saídas das fontes, efetuou a
medição após os diodos separadores, não identificando, portanto qualquer anormalidade, uma
vez que neste ponto a tensão medida será sempre a maior tensão entre as duas fontes em
paralelo. Levado pela intervenção anterior, foi induzido a acreditar que a fonte substituída três
dias antes tinha voltado a
falhar, comandando erroneamente uma botoeira de “rearme” existente na parte frontal do
conversor. Ocorreu nesta oportunidade que a falha era na fonte ac – que provoca o mesmo
tipo de sinalização no Regulador. Este comando de “rearme” provoca um “reset” na saída da
fonte, com isto, o Regulador de Tensão ficou temporariamente sem o + 15 Vcc, provocando o
desligamento da unidade gerador às 14:53h.
Dia 16/09/2004 às 15:02h, foi paralelado o gerador através do 14G2, e às 15:03h foi
141
Chapter 9
Annex
fechado o 13T2, colocando a LT 03C1, que alimenta a SE-Zebu, em carga.
3.2 – OPERAÇÃO:
Nada a registrar.
3.3 – MANUTENÇÃO:
Foi elaborado o Planejamento Executivo, através da elaboração do PEX No. 0197/04, anexo,
contemplando a identificação da intervenção, recursos humanos, análise e condições para a
intervenção, infra-estrutura necessária e detalhamento da intervenção, bem como a Análise
Preliminar de Perigo – APP, também anexa.
3.4 – CAPACITAÇÃO TÉCNICA:
Capacitação técnica da equipe envolvida não se apresentou satisfatória, uma vez que a mesma
não identificou que a fonte que apresentava defeito era a AC e não a CC, bem como,
desconhecia o fato que o comando de “rearme” zera temporariamente a saída da fonte.
3.5 – NORMATIVO:
Normas do órgão normativo atendidas.
Não existência de Instrução de Manutenção dos Reguladores de Tensão recém instalados.
3.6 – EQUIPAMENTOS:
Instrumentos de medição adequados à atividade.
3.7 – PROTEÇÃO:
O esquema funcional de trip comportou-se com eficiência no comando de trip, uma vez que o
Regulador de Tensão, ficou temporariamente sem fonte de corrente contínua para seu controle
interno, após o comando de “rearme” da fonte.
3.8 – SISTEMA DE SUPERVISÃO:
Tanto a supervisão do Regulador de Tensão quanto da unidade geradora sinalizaram de forma
correta.
3.9 – PROJETO ELÉTRICO:
A fonte CC/CC deveria apresentar a identificação que o comando de “rearme” zeraria a saída
da fonte.
3.10 – LOGÍSTICA DE APOIO:
Adequada.
3.11 – OUTROS APOIOS:
Adequados.
4. – ANÁLISE:
4.1 – DESEMPENHO DA EQUIPE ENVOLVIDA:
4.1.1 – OPERAÇÃO:
Nada a registrar.
142
Chapter 9
Annex
4.1.2 – MANUTENÇÃO:
O Desempenho da equipe de Manutenção de Proteção envolvida não foi satisfatório,
considerando que a mesma não identificou corretamente a fonte que apresentava o problema,
bem como, desconhecia o fato que a saída da fonte zeraria ao receber tal comando.
4.2 – CAPACITAÇÃO TÉCNICA:
A equipe executante, composta por um Assistente Técnico D e um Assistente Técnico
A, tem capacitação adequada para realização deste tipo de trabalho.
4.3 – PROTEÇÃO:
Os esquemas de proteção e controle solicitados na ocorrência tiveram um desempenho
satisfatório.
4.4 – SISTEMA DE SUPERVISÃO:
Satisfatório, com exceção da falta de sinalização que o comando de rearme zeraria a
saída da fonte.
4.5 – Logística DE APOIO:
A logística estava adequada.
4.6 – OUTROS APOIOS:
Os apoios necessários estavam adequados.
5. - DIAGRAMA DE CAUSA E EFEITO
6. – CLASSIFICAÇÃO DA FALHA HUMANA (Conforme NM-TC-PA-GE-005)
O desligamento foi considerado de natureza falha humana, com erro por engano, sem
corte de carga, não associado a danos materiais nem a danos pessoais.
MEIO AMBIENTE
MÃO-DE-OBRA
Não identificação de qual das fontes era a defeituosa
MÉTODO
Inexistência de Instrução de Manutenção do Regulador de Tensão Falta de conhecimento que
o comando
de “rearme” zerava a saída da fonte
EQUIPAMENTO
DESLIGAMENTO 01G2 USD E 13T2
Falta de identificação que o comando de “rearme” zerava a saída da fonte Falta de
padronização de sinalização nas fontes
7. – PLANO DE AÇÃO PLANO DE AÇÃO: O QUE QUEM QUANDO COMO ONDE
8. – CONCLUSÃO:
143
Chapter 9
Annex
O desligamento acidental dos disjuntores 14G2 e 13T2 teve como causa fundamental a não
identificação de qual das fontes era a defeituosa, e comandar indevidamente a botoeira de
rearme de uma outra fonte que se apresentava com seu funcionamento normal.
Embora a causa principal do desligamento esteja bem caracterizada como uma falha humana,
faz-se necessário destacar que, precisamos sempre estar atualizando as Instrução de
Manutenção, e os debates sobre as melhorias nos processos de manutenção, conforme
colocado no plano de ação, constante neste relatório.
8.1 – RECOMENDAÇÕES PRINCIPAIS
Elaborar instrução de manutenção para os Reguladores de Tensão recém instalados nas
USU/D/T e UAS.
Fixar identificação nestas fontes que o comando de “rearme” provoca o zeramento temporário
da mesma.
Divulgar esta informação com as equipes envolvidas na manutenção dos reguladores que
possuem esta fonte.
9. – ELABORAÇÃO
Engº xxxxxxx e Tec° xxxxxxxx.
10. – APROVAÇÃO
Engº xxxxxxxxxxxxxxx
144
Chapter 9
Annex
ANNEX 3 – Human Error Report - RDFH –GRP 04/06
145
Chapter 9
Annex
146
Chapter 9
Annex
147
Chapter 9
Annex
148
Chapter 9
Annex
149
Chapter 9
Annex
ANNEX 4 – Human Error Report - RDFH –GRL 06/99
1 – SUMÁRIO
1.1 - Local – SE STD
1.2 - Data e Hora – 25 / 11 / 99 - 11:32hs
1.3 - Descrições Sucintas da Ocorrência
Durante o processo de normalização do Disjuntor 12J2 da S/E STD, após manutenção
preventiva, no dia 25/11/99 às 11h32minhs, por ocasião do retorno dos ajustes dos relés de
sobre corrente, ocorreu o desarme do Disjuntor 12J2, atuando relé 51N, face abertura do
circuito de corrente quando da mudança do tap do relé 51C, ocasionando a interrupção das
cargas da Linha 02J2 - 4 MVA (STD/CUITÉ - SAELPA).
2 – HISTÓRICO DETALHADO
2.1 – CONFIGURAÇÃO DO SISTEMA ANTES DA PERTURBAÇÃO
A Subestação estava na sua configuração normal, com todos os Disjuntores de 138, 69 e 13.8
kV , fechados, exceto 13E1(Reator 03E1 desenergizado) e 12J2 substituído pelo 12D1.
2.2 – SEQUENCIA DOS DESLIGAMENTOS E DA RECOMPOSIÇÃO
11:00hs - SLMG devolveu o disjuntor 12J2
11:00/11:10hs - S/E STD efetuou inspeções, verificações, ativação alimentação VDC 12J2 e
efetuou testes fechamento/abertura disjuntor 12J2
11:12hs - STD recebeu 12J2 livre para operação
11:15hs - CROL autorizou STD normalizar 12J2
11:22hs - STD fechou 32J2-4 e 32J2-5
11:23hs - STD fechou 12J2
11:24hs - STD abriu 12D1
11:25hs - STD colocou chave 43-12J2 na posição 12J2
11:28hs - STD abriu 32J2-6
11:28hs - STD fechou 32M1-8
11:32hs - STD retornou tap relés de sobre corrente de fase do 12J2 para o tap 4,0A abertura
12j2 com atuação relé 51n (acidental)
11:33hs - STD informou ocorrência ao CROL e recebeu autorização para normalizar 12J2
11:34hs - STD fechou 12J2 e informou ao CROL
2.3 – CARGAS INTERROMPIDAS
Houve interrupção de 4 MW durante 2 minutos.
3 - FATOS E DADOS RELEVANTES
3.1 – OPERAÇÃO
150
Chapter 9
Annex
- O Operador envolvido na ocorrência, não utilizou a Instrução Interna existente na Instalação
que discrimina todos os passos a serem seguidos no processo de mudança de ajuste de relés.
- O Operador não retirou o pente do relé nem tampouco sacou o relé da caixa.
- Imediatamente após o diagnóstico da ocorrência, o Operador interagiu com o CROL e
procedeu a normalização do alimentador.
3.2 – CAPACITAÇÃO TÉCNICA
O operador envolvido na ocorrência tem 20 anos na função operador, dos quais 18 foram em
Usina. Trata-se de um funcionário exemplar, de muita experiência, responsabilidade,
compromisso e de um perfil técnico muito bom.
3.3 – NORMATIVO
A Instrução Interna existente na Instalação está devidamente atualizada e internalizada na
equipe de Operadores.
4 – ANÁLISE
4.1 – OPERAÇÃO
A tarefa de mudança de ajuste de relé é de alto risco, embora seja um procedimento já
normatizado e de domínio dos operadores da S/E STD. Porém, por não ser realizada com
freqüência, requer uma atenção especial por ocasião da necessidade de realizá-la. O fato
ocorreu por ocasião da mudança de ajuste do último relé de fase (C), quando o operador
esqueceu de retirar o pente do relé e face a abertura do circuito de corrente para mudança do
tap, houve um desequilíbrio de corrente suficiente para operação do relé de neutro - 51N. De
imediato, o operador constatou o erro e procedeu a informação ao CROL e a normalização da
LT 02J2.
O operador mesmo conhecedor da Instrução de mudança de ajuste de relé existente na S/E
STD, que enfatiza a necessidade da desativação do pente do relé e respectiva retirada do relé
da caixa para executar a mudança do tap, não assim procedeu, e face a repetitividade das
ações (relé 51A, depois 51B e por último 51C) culminou com o esquecimento da retirada do
pente do relé e a conseqüente falha operacional. Após o diagnóstico da ocorrência, o
procedimento do operador foi correto.
5- ARVORE DE CAUSA
6 – CLASSIFICAÇÃO DA FALHA
151
Chapter 9
Annex
6.1 – TAREFA
6.1.1 – TIPO: Programado
6.1.2
–
CLASSIFICAÇÃO:
Simples,
Rara,
Programado,
Normalização
de
equipamento/sistema
6.2 – AGRAVANTES DO RISCO
6.2.1 – AGRAVANTES DO RISCO: A tarefa é repetitiva e requer longos períodos inativos
6.2.2 – PESO: 1
6.2.3 – AGRAVAMENTO : 1,2
6.3 – FATORES DETERMINANTES DO DESEMPENHO HUMANO
6.3.1 – SITUACIONAIS : Ambiente: 1) – Localização; 2) – Ajuste de proteção; 3) – Acesso
6.3.2 – INDIVIDUAIS :
3.3.2.1 – HOMEM : 1) – Auto-confiança
3.3.2.2 – STRESSORES: 1) – Risco elevado
6.4 – DADOS COMPLEMENTARES:
6.4.1 – INTERVALO DE DESCANSO ANTES DO TURNO: 153.354 (12:00)
6.5 – QUANTIFICAÇÃO DO RISCO
3.5.1 – RISCO NOMINAL DE FALHA OPERACIONAL (RN): 0,018
3.5.2 – RISCO ESTIMADO: 30,0000%
6.6 – FALHA OPERACIONAL
6.6.1 – GRAU DE SEVERIDADE: Falha afetando o consumidor
6.6.2 – ERRO ESTIMADO: Erro Sequêncial
7 – PLANO DE AÇÃO
152
Chapter 9
Annex
153
Chapter 9
Annex
ANNEX 5 – Human Error Report - RDFH –GRO 02/09
154
Chapter 9
Annex
155
Chapter 9
Annex
156
Chapter 9
Annex
ANNEX 6 – Human Error Report - RDFH –STC 01/05
157
Chapter 9
Annex
158
Chapter 9
Annex
159
Chapter 9
Annex
ANNEX 7 – Human Error Report - RDFH –GRL 05/03
160
Chapter 9
Annex
161
Chapter 9
Annex
162
Chapter 9
Annex
163
Chapter 9
Annex
164
Chapter 8
Annex
ANNEX 8 – HUMAN ERROR DATABASE: ERROR TABLE
ERRO
1
2
3
4
5
6
7
8
9
10
11
12
13
14
15
16
17
18
19
20
21
22
23
24
25
26
27
28
DATA
26/10/98
18/10/98
18/03/98
08/09/98
02/10/98
23/08/99
26/05/99
29/09/99
01/09/99
08/04/99
30/03/99
06/03/99
03/02/99
25/11/99
05/12/99
10/01/99
11/07/99
20/09/99
16/08/99
21/09/00
17/09/00
26/06/00
30/04/00
15/03/00
11/11/00
11/10/00
04/09/00
23/03/00
29
30
31
32
10/08/00
07/08/00
09/06/00
07/02/00
CARGA
DURACAO
INTERROMPIDA INTERRUPCAO NIVEL ERRO
(MW)
(MIN)
RASMUSEN
82,47
14,00 RULE
66,23
3,00 RULE
171,00
9,00 SKILL
70,00
56,00 SKILL
126,20
15,00 SKILL
1,32
8,00 RULE
9,54
13,00 RULE
40,00
18,00 SKILL
107,00
50,00 RULE
9,00
52,00 KNOWLEDGE
36,00
19,00 SKILL
11,00
8,00 RULE
26,00
31,00 SKILL
4,00
2,00 RULE
12,00
6,00 RULE
45,00
23,00 SKILL
400,00
1,00 KNOWLEDGE
38,80
5,00 SKILL
0,60
73,00 SKILL
12,00
36,00 KNOWLEDGE
75,00
12,00 RULE
1,50
41,00 KNOWLEDGE
221,00
27,00 RULE
16,00
3,00 KNOWLEDGE
10,00
2,00 RULE
60,00
11,00 SKILL
28,00
10,00 RULE
99,40
150,00 RULE
110,00
41,00
20,00
20,40
TIPO
ERRO
REASON
MISTAKE
MISTAKE
SLIP
SLIP
LAPSE
MISTAKE
MISTAKE
SLIP
MISTAKE
MISTAKE
SLIP
MISTAKE
SLIP
MISTAKE
MISTAKE
LAPSE
MISTAKE
SLIP
SLIP
MISTAKE
MISTAKE
MISTAKE
MISTAKE
MISTAKE
MISTAKE
SLIP
MISTAKE
MISTAKE
MODO DE FALHA REASON
ENCODING DEFICIENCES
ENCODING DEFICIENCES
PERCEPTUAL CONFUSIONS
OMISSIONS
OMISSIONS
COUNTERSIGNS AND NONSIGNS
RULE STRENGHT
PERCEPTUAL CONFUSIONS
COUNTERSIGNS AND NONSIGNS
BIASED REVIEWING
PERCEPTUAL CONFUSIONS
ENCODING DEFICIENCES
PERCEPTUAL CONFUSIONS
RIGIDITY
COUNTERSIGNS AND NONSIGNS
PERCEPTUAL CONFUSIONS
OVERCONFIDENCE
PERCEPTUAL CONFUSIONS
PERCEPTUAL CONFUSIONS
OVERCONFIDENCE
FIRST EXCEPTIONS
BIASED REVIEWING
ENCODING DEFICIENCES
BIASED REVIEWING
GENERAL RULE
PERCEPTUAL CONFUSIONS
INFORMATION OVERLOAD
ACTION DEFICIENCES
OMISSION FOLLOWING
11,00 SKILL
SLIP
INTERRUPTIONS
2,00 KNOWLEDGE MISTAKE BIASED REVIEWING
8,00 KNOWLEDGE MISTAKE BIASED REVIEWING
4,00 RULE
MISTAKE INFORMATION OVERLOAD
165
COMPORTAME
NTO
PROCESSO
ELEMENTAR
BERLINNER
BERLINNER
COGNITIVE
COMPARE
COGNITIVE
COMPARE
MOTOR
POSITION
PERCEPTIVE
MONITORED
PERCEPTIVE
MONITORED
PERCEPTIVE
LOCATED
MOTOR
PUSH/PULL
MOTOR
PUSH/PULL
MOTOR
MOVE
MOTOR
MOVE
MOTOR
REMOVE
PERCEPTIVE
INSPECT
MOTOR
PUSH/PULL
MOTOR
ADJUST
COMMUNICATION REGISTER
MOTOR
ADJUST
MOTOR
TYPING
MOTOR
REMOVE
MOTOR
DISCARD
MOTOR
POSITION
MOTOR
POSITION
COGNITIVE
DECIDE
COGNITIVE
CHOOSE
COGNITIVE
DECIDE
COGNITIVE
COMPARE
MOTOR
REMOVE
MOTOR
POSITION
PERCEPTIVE
INSPECT
PERCEPTIVE
COGNITIVE
MOTOR
COGNITIVE
MONITORED
DECIDE
REMOVE
DECIDE
Chapter 8
ERRO
33
34
35
36
37
38
39
40
41
42
43
44
45
46
47
48
49
50
51
52
53
54
55
56
57
58
59
60
61
62
63
64
DATA
19/04/00
25/05/00
28/07/00
22/01/00
17/12/00
17/12/00
18/12/01
07/06/01
03/04/01
07/09/01
09/10/01
28/09/01
22/09/01
20/04/01
01/05/01
08/04/01
30/11/01
18/12/02
23/11/02
10/10/02
09/08/02
05/06/02
27/03/02
01/10/02
19/03/02
22/10/02
12/04/02
17/08/03
26/05/03
17/10/03
08/05/03
06/05/03
Annex
CARGA
DURACAO
INTERROMPIDA INTERRUPCAO NIVEL ERRO
(MW)
(MIN) RASMUSEN
13,00
5,00 RULE
6,60
1,00 SKILL
52,00
511,00 KNOWLEDGE
15,00
16,00 SKILL
18,00
1,00 SKILL
18,00
3,00 SKILL
60,52
130,00 SKILL
90,30
9,00 SKILL
64,40
23,00 SKILL
34,00
14,00 KNOWLEDGE
13,20
13,00 RULE
42,00
7,00 KNOWLEDGE
144,00
13,00 SKILL
8,00
6,00 SKILL
4,80
6,00 KNOWLEDGE
9,20
3,00 SKILL
114,50
20,00 RULE
1,00
10,00 SKILL
6,00
5,00 RULE
1314,60
64,00 SKILL
1,70
2,00 SKILL
44,00
18,00 SKILL
7,00
49,00 KNOWLEDGE
33,50
162,00 RULE
84,00
2,00 SKILL
55,50
211,00 SKILL
24,90
4,00 RULE
337,30
81,00 SKILL
5,00
23,00 KNOWLEDGE
3,10
3,00 SKILL
5,00
28,00 SKILL
1,00
1,00 SKILL
TIPO
ERRO
REASON
MISTAKE
SLIP
MISTAKE
LAPSE
SLIP
SLIP
SLIP
SLIP
LAPSE
MISTAKE
MISTAKE
MISTAKE
SLIP
SLIP
MISTAKE
SLIP
MISTAKE
SLIP
MISTAKE
SLIP
SLIP
SLIP
MISTAKE
MISTAKE
LAPSE
LAPSE
MISTAKE
SLIP
MISTAKE
SLIP
SLIP
SLIP
MODO DE FALHA REASON
INFORMATION OVERLOAD
PERCEPTUAL CONFUSIONS
CONFIRMATION BIAS
OMISSION
PERCEPTUAL CONFUSIONS
PERCEPTUAL CONFUSIONS
PERCEPTUAL CONFUSIONS
PERCEPTUAL CONFUSIONS
OMISSION
BIASED REVIEWING
ENCODING DEFICIENCES
OVERCONFIDENCE
PERCEPTUAL CONFUSIONS
PERCEPTUAL CONFUSIONS
BIASED REVIEWING
PERCEPTUAL CONFUSIONS
RIGIDITY
PERCEPTUAL CONFUSIONS
COUNTERSIGNS AND NONSIGNS
PERCEPTUAL CONFUSIONS
PERCEPTUAL CONFUSIONS
PERCEPTUAL CONFUSIONS
CONFIRMATION BIAS
ENCODING DEFICIENCES
INVERSIONS
OMISSIONS
COUNTERSIGNS AND NONSIGNS
PERCEPTUAL CONFUSIONS
BIASED REVIEWING
PERCEPTUAL CONFUSIONS
PERCEPTUAL CONFUSIONS
PERCEPTUAL CONFUSIONS
166
PROCESSO
BERLINNER
COGNITIVE
MOTOR
COGNITIVE
COGNITIVE
COGNITIVE
MOTOR
MOTOR
MOTOR
COGNITIVE
COGNITIVE
MOTOR
PERCEPTIVE
PERCEPTIVE
PERCEPTIVE
COGNITIVE
PERCEPTIVE
COGNITIVE
PERCEPTIVE
COGNITIVE
MOTOR
PERCEPTIVE
PERCEPTIVE
COGNITIVE
COGNITIVE
COGNITIVE
COGNITIVE
MOTOR
MOTOR
COGNITIVE
PERCEPTIVE
PERCEPTIVE
PERCEPTIVE
COMPORTAMENTO
ELEMENTAR
BERLINNER
DECIDE
PUSH/PULL
CHOOSE
REMEMBER
HOLD
MOVE
REMOVE
REMOVE
REMEMBER
COMPARE
REMOVE
IDENTIFY
IDENTIFY
IDENTIFY
REMEMBER
IDENTIFY
DECIDE
IDENTIFY
COMPARE
MOVE
IDENTIFY
IDENTIFY
COMPARE
COMPARE
REMEMBER
REMEMBER
REMOVE
MOVE
COMPARE
IDENTIFY
IDENTIFY
IDENTIFY
Chapter 8
ERRO
65
66
67
68
69
70
71
72
73
74
75
76
77
78
79
80
81
82
83
84
85
86
87
88
89
90
91
92
93
94
95
96
Annex
DATA
08/08/03
05/09/03
29/04/03
12/04/03
27/08/03
25/05/03
29/03/03
13/11/04
29/11/04
12/12/04
23/08/04
29/07/04
27/07/04
15/12/04
21/09/04
17/05/04
23/03/04
29/11/04
16/09/04
04/03/04
21/03/04
19/02/05
10/06/05
15/07/05
22/05/05
16/10/05
13/11/05
30/07/05
04/10/05
03/05/05
09/12/05
07/12/05
CARGA
DURACAO
INTERROMPIDA INTERRUPCAO NIVEL ERRO
(MW)
(MIN) RASMUSEN
8,30
5,00 SKILL
14,00
3,00 RULE
14,62
19,00 SKILL
22,28
1,00 SKILL
2,94
5,00 RULE
31,00
6,00 KNOWLEDGE
152,00
21,00 KNOWLEDGE
241,50
30,00 SKILL
16,80
1,00 SKILL
10,00
5,00 SKILL
100,00
8,00 SKILL
10,00
72,00 KNOWLEDGE
10,00
9,00 SKILL
108,00
29,00 KNOWLEDGE
58,00
23,00 SKILL
3,50
6,00 SKILL
11,70
3,00 SKILL
55,78
9,00 SKILL
70,00
10,00 SKILL
220,00
74,00 SKILL
31,80
46,00 SKILL
87,00
85,00 SKILL
15,00
81,00 RULE
151,00
19,00 SKILL
1,90
142,00 KNOWLEDGE
15,00
5,00 SKILL
8,60
1,00 SKILL
58,00
32,00 SKILL
32,00
7,00 SKILL
66,00
8,00 SKILL
85,00
205,00 KNOWLEDGE
85,00
205,00 RULE
TIPO ERRO
REASON
SLIP
MISTAKE
LAPSE
LAPSE
MISTAKE
MISTAKE
MISTAKE
SLIP
SLIP
SLIP
SLIP
MISTAKE
SLIP
MISTAKE
LAPSE
SLIP
SLIP
SLIP
SLIP
SLIP
SLIP
SLIP
MISTAKE
SLIP
MISTAKE
SLIP
SLIP
SLIP
LAPSE
SLIP
MISTAKE
MISTAKE
MODO DE FALHA REASON
PERCEPTUAL CONFUSIONS
RULE STRENGHT
OMISSIONS
OMISSIONS
ACTION DEFICIENCES
BIASED REVIEWING
BIASED REVIEWING
PERCEPTUAL CONFUSIONS
PERCEPTUAL CONFUSIONS
PERCEPTUAL CONFUSIONS
PERCEPTUAL CONFUSIONS
BIASED REVIEWING
PERCEPTUAL CONFUSIONS
BIASED REVIEWING
INVERSIONS
PERCEPTUAL CONFUSIONS
PERCEPTUAL CONFUSIONS
PERCEPTUAL CONFUSIONS
PERCEPTUAL CONFUSIONS
PERCEPTUAL CONFUSIONS
PERCEPTUAL CONFUSIONS
ENCODING DEFICIENCES
COUNTERSIGNS AND NONSIGNS
PERCEPTUAL CONFUSIONS
COMFIRMATION BIAS
PERCEPTUAL CONFUSIONS
PERCEPTUAL CONFUSIONS
PERCEPTUAL CONFUSIONS
INVERSIONS
PERCEPTUAL CONFUSIONS
BIASED REVIEWING
ENCODING DEFICIENCES
167
PROCESSO
BERLINNER
MOTOR
PERCEPTIVE
COGNITIVE
COGNITIVE
MOTOR
COGNITIVE
COGNITIVE
MOTOR
MOTOR
PERCEPTIVE
MOTOR
COGNITIVE
PERCEPTIVE
COGNITIVE
COGNITIVE
PERCEPTIVE
PERCEPTIVE
MOTOR
COGNITIVE
MOTOR
PERCEPTIVE
COGNITIVE
PERCEPTIVE
PERCEPTIVE
COGNITIVE
MOTOR
PERCEPTIVE
PERCEPTIVE
COGNITIVE
PERCEPTIVE
COGNITIVE
COGNITIVE
COMPORTAMENTO
ELEMENTAR
BERLINNER
MOVE
IDENTIFY
DECIDE
REMEMBER
MOVE
COMPARE
COMPARE
PUSH/PULL
REMOVE
IDENTIFY
MOVE
REMEMBER
IDENTIFY
REMEMBER
REMEMBER
IDENTIFY
IDENTIFY
MOVE
REMEMBER
REMOVE
IDENTIFY
DECIDE
IDENTIFY
IDENTIFY
REMEMBER
MOVE
IDENTIFY
IDENTIFY
REMEMBER
IDENTIFY
COMPARE
DECIDE
Chapter 8
ERRO
97
98
99
100
101
102
103
104
105
106
107
108
109
110
111
112
113
114
115
116
117
118
119
120
121
122
123
124
125
126
127
128
129
130
131
Annex
DATA
30/06/05
10/01/05
19/01/06
06/11/06
08/06/06
08/08/06
18/12/06
04/06/06
22/03/06
05/02/06
16/09/06
26/07/06
23/03/06
05/07/07
23/03/07
13/07/07
29/04/07
09/04/07
27/03/07
27/11/07
10/01/07
19/04/07
22/02/07
27/02/08
11/11/08
18/08/08
28/05/08
14/08/08
25/01/08
06/11/09
16/12/09
08/10/09
01/03/09
25/08/09
02/08/09
CARGA
DURACAO
INTERROMPIDA INTERRUPCAO NIVEL ERRO
(MW)
(MIN) RASMUSEN
129,00
58,00 RULE
66,13
21,00 RULE
102,00
19,00 RULE
269,90
21,00 SKILL
1,40
1,00 SKILL
6,00
2,00 KNOWLEDGE
1,00
14,00 SKILL
24,60
491,00 SKILL
20,00
13,00 SKILL
5,00
45,00 RULE
126,57
36,00 KNOWLEDGE
68,00
363,00 KNOWLEDGE
32,00
13,00 SKILL
99,76
66,00 KNOWLEDGE
98,41
29,00 RULE
3,20
7,00 SKILL
45,91
76,00 RULE
4,00
49,00 SKILL
53,00
25,00 SKILL
10,00
4,00 SKILL
26,00
16,00 KNOWLEDGE
23,53
17,00 KNOWLEDGE
23,10
27,00 KNOWLEDGE
4,80
7,00 RULE
14,00
6,00 SKILL
1,16
1,00 SKILL
37,63
7,00 SKILL
38,00
62,00 KNOWLEDGE
3,67
18,00 RULE
9,64
4,00 SKILL
24,92
28,00 SKILL
750,50
26,00 SKILL
199,00
17,00 KNOWLEDGE
15,10
16,00 KNOWLEDGE
9,96
8,00 SKILL
TIPO ERRO
REASON
MISTAKE
MISTAKE
MISTAKE
SLIP
SLIP
MISTAKE
SLIP
SLIP
SLIP
MISTAKE
MISTAKE
MISTAKE
SLIP
MISTAKE
MISTAKE
SLIP
MISTAKE
SLIP
SLIP
LAPSE
MISTAKE
MISTAKE
MISTAKE
MISTAKE
SLIP
SLIP
SLIP
MISTAKE
MISTAKE
SLIP
SLIP
SLIP
MISTAKE
MISTAKE
LAPSE
MODO DE FALHA REASON
ENCODING DEFICIENCES
ENCODING DEFICIENCES
RULE STRENGHT
PERCEPTUAL CONFUSIONS
PERCEPTUAL CONFUSIONS
BIASED REVIEWING
PERCEPTUAL CONFUSIONS
PERCEPTUAL CONFUSIONS
PERCEPTUAL CONFUSIONS
ACTION DEFICIENCES
BIASED REVIEWING
BIASED REVIEWING
PERCEPTUAL CONFUSIONS
OVERCONFIDENCE
ENCODING DEFICIENCES
PERCEPTUAL CONFUSIONS
ENCODING DEFICIENCES
PERCEPTUAL CONFUSIONS
PERCEPTUAL CONFUSIONS
INVERSIONS
BIASED REVIEWING
BIASED REVIEWING
BIASED REVIEWING
ACTION DEFICIENCES
PERCEPTUAL CONFUSIONS
PERCEPTUAL CONFUSIONS
PERCEPTUAL CONFUSIONS
CONFIRMATION BIAS
ENCODING DEFICIENCES
PERCEPTUAL CONFUSIONS
PERCEPTUAL CONFUSIONS
PERCEPTUAL CONFUSIONS
BIASED REVIEWING
BIASED REVIEWING
INVERSIONS
168
PROCESSO
BERLINNER
COGNITIVE
COGNITIVE
COGNITIVE
PERCEPTIVE
PERCEPTIVE
COGNITIVE
PERCEPTIVE
PERCEPTIVE
MOTOR
COGNITIVE
COGNITIVE
COGNITIVE
MOTOR
COGNITIVE
COMMUNICATION
PERCEPTIVE
COGNITIVE
MOTOR
MOTOR
MOTOR
COGNITIVE
COGNITIVE
COGNITIVE
PERCEPTIVE
PERCEPTIVE
PERCEPTIVE
PERCEPTIVE
COGNITIVE
COGNITIVE
PERCEPTIVE
MOTOR
MOTOR
COGNITIVE
COGNITIVE
COGNITIVE
COMPORTAMENTO
ELEMENTAR
BERLINNER
COMPARE
COMPARE
DECIDE
IDENTIFY
IDENTIFY
REMEMBER
IDENTIFY
OBSERVE
REMOVE
DECIDE
COMPARE
COMPARE
MOVE
DECIDE
REQUEST
IDENTIFY
COMPARE
MOVE
MOVE
MOVE
COMPARE
COMPARE
COMPARE
OBSERVE
IDENTIFY
IDENTIFY
IDENTIFY
COMPARE
COMPARE
IDENTIFY
REMOVE
MOVE
COMPARE
COMPARE
REMEMBER
Chapter 8
Annex
ANNEX 9 – SUMMARY OF OCCORENCE
ER Y Load
Summary of the concurrency
RO E Interru
R A pted
R
001
002
003
004
1
9
8
8
82,47MW
66,23MW
171,00MW
70,00MW
- Para atender a uma solicitação de programação da GRO, no 500KV, o CROO elaborou / enviou o roteiro de
manobras para o CRON, o qual constava da abertura do 14L1/SE SBD e em seguida a abertura do disjuntor
14L1/SE PRI.
- Quando da execução da manobra de abertura do 14L1 em PRI, e estando as chaves 85CO na posição “ON”
e a 43PPS na posição L1, ocorreu o desligamento automático da LT04S1 SBD/FTZ, ficando a barra de 69KV
da SE/SBD desenergizada.
- A equipe do SNCP foi deslocada para SE/SBD, em função da ocorrência do dia 18/10/98, e após
intervenção foi detectado o problema, ou seja, a programação dos contatos da chave 43PPS instalada,
divergindo do projeto.
- Após a ocorrência (desligamento) do dia 26/10/98, que será explanado em um relatório específico, é que foi
verificado ser a programação inadequada da chave, a causa do desligamento, pois isto levou o potencial de
trip que surgiu em função da abertura do 14L1 em PRI, lógica de subtensão, associado ao fato de que a chave
85CO estava na posição “ON”, a desligar também a LT04S1.
Por ocasião da realização das manobras de liberação do 12J2 para o SLMG efetuar a instalação da chave
seletora de comando ( L R M ), conforme programado, houve a abertura indevida da chave 32J1-4 ao invés
da 32J2-4, ocasionando o desligamento de todas as cargas da S/E NTD, a partir dos disjuntores 14V1 da S/E
NTD e 14V2 da S/E CGD, com perda de 171 MW a exceção das cargas de MCB ( 4,0 MW ) que
permaneceram supridas através da LT 02M1( SE STD ). O retorno das cargas iniciaram a partir das 08:02
horas.
Ocorreu desarme geral da SE devido a explosão do disjuntor 11E2. Na re-energização o operador errou a
seqüência de manobras.
Classification
RASMUSSEN Rule; mistake;
Encoding
deficiencies
REASON
BERLINNER Cognitive - Compare
One wrong rule was applied correctly
plan; plan incorrect
Rule; mistake;
Encoding deficiencies
Cognitive - Compare
One wrong rule was applied correctly
plan; plan incorrect
Skill; slip;
Perceptual confusions
Motor - Position
Wrong object selected due similarity with
desirable object.
action; plan correct, action incorrect; wrong
selection
Skill; slip;
Omissions
Perceptive - Monitored
169
Chapter 8
005
006
007
008
009
010
Annex
126.20MW
1
9
9
9
1,32MW
9,54MW
40,00MW
107,00MW
9,00MW
O gerador 01G5 foi desenergizado parado e liberado para que a DRUB instalasse um sistema de
monitorização no mesmo. Aproveitando a parada da máquina, foram solicitadas outras intervenções, entre as
quais a substituição do casco do trocador de calor do sistema de refrigeração dos tiristores. Quando do
retorno da unidade geradora, não foi energizada a moto bomba do referido sistema de refrigeração, o que
provocou o desligamento da máquina.
Após os trabalhos de aferição/calibração, concluído às 15h30min, o técnico responsável pela intervenção
entra em contato com o eng. º do SNCP informando do problema verificado e o mesmo avisou ao operador
encarregado do turno, do atraso na reposição do referido relé, visto os danos observados, mas que entraria no
horário de ponta com a cadeia de proteção recomposta. Quando da colocação do relé, às 17h29min, houve o
desarme do disjuntor 11W1. Após uma tentativa de fechamento do disjuntor 11W1, houve novamente
o desarme, onde detectou-se que a fiação da bobina de selo do relé estava partida e encostando no contato de
saída do trip.
Durante a execução das atividades, o responsável da intervenção detectou falha no circuito de supervisão de
“anormalidade de disjuntor e seccionadora”, e, no intuito de corrigir o problema, pressionou o relé 62X da
cadeia de proteção da LT 04L1, causando toda a ocorrência em pauta ao sistema.
Desligamento acidental da unidade 01G2 com perda de 40 MW durante 18 minutos, provocado pelo
acionamento indevido de desligamento do quick-lag 19 que alimenta o conversor do seqüenciador e
instrumentação da máquina, acarretando trip e bloqueio da mesma.
Às 11h54min do dia 01/09/1999, houve o desligamento automático da barra de 230kV/04B1 da Subestação
do FUNIL (SE FNL), provocado por curto-circuito decorrente de manobra em carga da chave de by pass
34E2-6.
Desligamento automático do disjuntor 12C1 por atuação da proteção de sobre corrente de fase em decorrência
da abertura da chave 31C1-6 em carga durante processo de manutenção.
Step execution is out of order planned
inversion sequence
Skill; lapse;
Omissions
Perceptive - Monitored
Failure to memorize the actions and/or
objects. memory; plan correct, action
incorrect
Rule; mistake;
Countersigns and nonsigns
Perceptive - Located
One correct rule was applied incorrectly.
plan; plan incorrect
Rule; mistake;
Rule strength
Motor – Push/Pull
One correct rule was applied incorrectly.
plan; plan incorrect
Skill; slip;
Perceptual confusions
Motor – Push/Pull
Wrong object selected due similarity with
desirable object. action; plan correct, action
incorrect; wrong selection
Rule; mistake;
Countersigns and nonsigns
Motor - Move
One correct rule was applied incorrectly.
plan; plan incorrect
Knowledge; Mistake;
Biased reviewing
Motor - Move
170
Chapter 8
011
012
013
014
Annex
36,00MW
11,00MW
26,00MW
4,00MW
Ao ser retirada a fiação do ponto 1 (desenergizado) da chave de tensão PKB, a fiação do ponto 2 (energizado)
soltou-se também do terminal, provocando curto-circuito para a terra e conseqüente queima do fusível de
proteção do circuito localizado na caixa de ligação dos TP´s da barra de 69 kV, no pátio. Os dois fios faziam
parte de um mesmo “chicote”, com amarração comum.
o SSCP programou inspeção/ensaios no esquema, constatando que a temporização (62-1) do relé 81 estava
incorreta, sendo encontrado um valor ajustado de 5,0s, quando o valor definido pela Ordem de Ajuste é de
11,0s.
Colocada a chave 43T5 na posição “ET”, confirmada “CLT” na posição local e fechado o disjuntor 14T5 ,
neste mesmo instante o operador ao se deslocar para efetuar abertura do 14D1, posicionou-se defronte ao
14T4 (que fica localizado ao lado do 14D1), abrindo-o indevidamente, com perda de 26MW,
O Operador envolvido na ocorrência, não utilizou a Instrução Interna existente na Instalação que discrimina
todos os passos a serem seguidos no processo de mudança de ajuste de relés.
One correct rule was applied incorrectly.
plan; plan incorrect
Skill; slip;
Perceptual confusions
Motor - Remove
One correct rule was applied incorrectly.
plan; plan incorrect
Rule; mistake;
Encoding deficiencies
Perceptive - Inspect
One wrong rule was applied correctly plan;
plan incorrect
Skill; slip
Perceptual confusions
Motor – Push/Pull
Wrong object selected due similarity with
desirable object. ; action; plan correct, action
incorrect; wrong selection
Rule; mistake;
Rigidity
Motor - Adjust
015
016
12,00MW
45,00MW
não foi observado pela equipe de proteção, apesar de ser questionada quanto a existência de relés de distância,
que essa LT possuía proteção de sobre corrente com restrição de tensão, de forma que, quando da
desenergização do 02BP, tivemos a atuação da proteção 51VA/B/C, provocando por conseguinte a abertura
do 14M1, com perda de 12MW, associada às cargas da LT 02L4.
O motivo identificado como causador da ocorrência, foi a colocação do TAP de seleção de freqüência em
50Hz, quando da aferição do relé 67N de fabricação SIEMENS tipo 7SK88 no comissionamento.
The operator doesn’t have ready rules, than
He improvises new rules. plan; plan
incorrect.
Rule; mistake;
Countersigns and nonsigns
Communication - Register
Failure to memorize the actions and/or
objects. Memory; plan correct action
incorrect.
Skill; lapse;
Perceptual confusions
Motor - Adjust
171
Chapter 8
017
400,00MW
018
38,80MW
019
020
021
022
Annex
0,60MW
2
0
0
0
12,00MW
O Operador envolvido apresenta um ótimo nível de capacitação, tendo inclusive exercido a função de
Encarregado da Instalação, porém, mesmo considerando que houve uma grave falha do equipamento durante
a manobra, admite-se que o excesso de autoconfiança levou a tomar uma atitude precipitada.
Quando da sua desconexão na régua C13-9, o terminal C13-9-1 tocou na parte metálica do painel (terra)
provocando trip direto no disjuntor 14L1 através do primeiro circuito de abertura. Em conseqüência disso, o
relé 94L foi energizado enviando transfer-trip para o terminal remoto (SE BRA). Esta desconexão de ponto
energizado não estava prevista no programa executivo da intervenção.
No dia 16.08.99, as 13:47 h, uma equipe terceirizada, contratada pela SPMA, executava roço na faixa de
alimentador 01C4 ZBU/ BARRAGEM MÓVEL quando um galho de árvore foi jogado pelo vento sobre os
seus condutores no instante que ele foi cortado, provocando um curto-circuito que ocasionou a abertura
automática do religador 21C4 e dos disjuntores 12T2 e 12T3, o desligamento da barra 01B1 ZBU alem do
alimentador 01C4, a avaria de dois isoladores da chave 31C4-4, o rompimento de três pulos ( fases a, b, c )
dessa chave e dois outros pulos na primeira estrutura do alimentador 01C4.
A equipe de roço subestimou o risco de acidente e infringiu uma recomendação básica de segurança, a saber,
prender os galhos com corda antes de cortá-lo.
Excesso de confiança do operador supervisor de turno da SE MLG e descumprimento do normativo pelo
mesmo, pelo encarregado da SE MLG e pelo operador de sistema auxiliar.
One correct rule was applied incorrectly.
plan; plan incorrect
Knowledge; mistake;
Overconfidence
Motor - Typing
The operator doesn’t have ready rules, than
He improvises new rules. plan; plan
incorrect.
Skill; Slip;
Perceptual confusions
Motor - Remove
One correct rule was applied incorrectly.
plan; plan incorrect
Skill; Slip;
Perceptual confusions
Motor - Discard
One correct rule was applied incorrectly.
plan; plan incorrect
Knowledge; mistake;
Overconfidence
Motor - Position
75,00MW
1,50MW
Como causa fundamental conclui-se que o circuito de controle do trafo de terra que corta o Trip das proteções
intrínsecas, ao se abrir a chave 32ª1-8 é inadequado por manter o selo do rele 94TT sobre a chave 86TT, bem
como a não existência de supervisão de atuação da bobina do rele 94TT, constituindo assim, uma armadilha
para a operação e manutenção.
O desempenho da operação não foi satisfatório, tendo em vista, o não cumprimento do novo procedimento
pelo operador executante das manobras (informando desconhecer)
The operator don’t have ready rules, than He
improvises new rules. Plan; plan incorrect.
Rule; mistake;
First exceptions
Motor - Position
One wrong rule was applied correctly plan;
plan incorrect
Knowledge; mistake;
Biased reviewing
Cognitive - Decide
The operator doesn’t have ready rules, than
172
Chapter 8
023
Annex
221,00MW
A causa da atuação das chaves de bloqueio foi a troca de programação do contato 9/10 do relé 94TT, que
deveria ser um contato normal aberto, sendo colocado um contato normal fechado.
He improvises new rules. Plan; plan
incorrect.
Rule; mistake;
Encoding deficiencies
Cognitive - Choose
024
025
026
027
028
16,00MW
10,00MW
60,00MW
28,00MW
99,40MW
Faltou à equipe de manutenção do SNMM, responsável pela execução das tarefas, uma melhor análise
(programação executiva das atividades a serem desenvolvidas), portanto o seu desempenho não foi
satisfatório nessa intervenção.
No entendimento do OPS, a manobra de normalização da SE ITH deveria ser idêntica à manobra realizada
para transferência da carga para a SE Estância, no início da ocorrência. Não observou, contudo que a situação
do restabelecimento era diferente da inicial, quando a SE ITH foi desligada intempestivamente devido ao
defeito na LT 04L1.
Ás 11h: 32min do dia 11/10/2000, ocorreu o desligamento da LT 04L2 CTG/SIBRA causado pelo contato
acidental da mão do mantenedor nas navalhas associadas ao contato 12/13 do relé auxiliar de trip ZNA, tipo
AR-8, da cadeia de proteção de distância WENCO da referida LT. Esta condição ocorre quando o relé de
religamento encontra-se desativado. O SSCP executava os procedimentos de limpeza (MP Programada) dos
relés extraíveis.
No dia 04/09/2000 às 22h43min h, houve o desarme da barra de 69KV da SE GVM, após tentativa sem
sucesso de energização da LT 02V2 que estava entregue à concessionária. A tentativa foi feita pelo disjuntor
de transferência 12D1 sem que a proteção do terminal 02V2 houvesse sido transferida, fazendo com que a
proteção de retaguarda 51N-T do transformador de aterramento 02ª1 atuasse, abrindo automaticamente os
disjuntores associados à barra 02BP.
A empresa contratada falhou na execução dos serviços, uma vez que não estava realizando a verificação do
“munhão” utilizando o parafuso gabarito, antes de cada intervenção. Também estava erradamente posicionada
a porca de segurança (porca de espera), afastada ± 20 cm do “munhão” principal, em vez de justaposta.
173
One wrong rule was applied correctly plan;
plan incorrect
Knowledge; mistake;
Biased reviewing
Cognitive - Decide
The operator doesn’t have ready rules, than
He improvises new rules. Plan; plan
incorrect.
Rule; mistake;
General Rule
Cognitive - Compare
Wrong object selected due similarity with
desirable object. action; plan correct, action
incorrect; wrong selection
Skill; Slip;
Perceptual confusions
Motor - Remove
One correct rule was applied incorrectly.
plan; plan incorrect
Skill; slip;
Informational overload
Motor - Position
Step execution is out of order planned.
inversion sequence
Rule; mistake;
Action deficiencies
Perceptive - inspect
Chapter 8
029
030
Annex
110,00MW
41,00MW
Efetuou os testes de atuação do esquema de falha, quando houve o desligamento dos disjuntores 14T3 e 14T4
pela operação do relé KK. Tal relé é auxiliar do esquema de falha 3 (62BF), provocando a perda da barra de
69 e 13.8 kV da SE CGD com as respectivas cargas derivadas;
Durante processo de liberação do disjuntor 12J8 da SE MRD, para SLMG efetuar Manutenção Preventiva
Programada, foi executada a abertura do disjuntor 12J8, sem o devido fechamento da chave 32J8-6.
One step is not realized. action; plan correct
action incorrect; omission
Rule; mistake;
Omission following
interruption
Perceptive - Monitored
One step is not realized. action; plan correct
action incorrect; omission
Knowledge; mistake;
Biased reviewing
Cognitive - decide
031
032
033
034
20,00MW
20,40MW
13,00MW
6,60MW
Quando terminou de tirar o pino da haste, o eletricista do pólo 1 deu um leve torque na coluna giratória da
chave afim de soltar por completo o seu lado da haste, pensando que o outro eletricista ainda não tinha
retirado o pino do outro lado. Porém nesse momento o eletricista do pólo 2 já havia retirado o pino e
aguardava a corda para amarrar a haste. Foi quando ficando livre a haste caiu em direção ao solo colidindo
com os cabos condutores.
Abertura automática dos disjuntores 12T1, 12F1 e 12F2, da S/E CRD no dia 07 de fevereiro de 2000, às
12h20min, por atuação do relé 27 do esquema de alívio de carga provocando corte de 20,4 MW da COSERN
durante 4 minutos, face não desativação do relé 27 durante manobras de abertura do Anel Norte/Leste.
Durante os trabalhos de isolamento do 12T1/PIC para manutenção preventiva, o operador de instalação após
abrir através do comando manual a chave 32T1-5, fechou mesmo não constando no programa de manobras a
chave 32T1-7, aterrando o trecho energizado entre a chave 32T1-6 e o trafo 04T1.
Durante os trabalhos de manutenção preventiva nível “0” no religador 01Y6/TSA, o mantenedor abriu e
fechou indevidamente o religador 01Y3/TSA.
One step is not realized. action; plan correct
action incorrect; omission
Knowledge; mistake
Biased reviewing
Motor - Remove
Step execution is out of order planned.
inversion sequence
Rule; mistake;
Informational overloaded
Cognitive - Decide
One step is not realized. action; plan correct
action incorrect; omission
Rule; mistake;
Informational overloaded
Cognitive - Decide
Failure to memorize the actions and/or
objects. memory; plan correct action
incorrect
Skill; slip;.
Perceptual confusions
Motor – Push/Pull
174
Chapter 8
035
52,00MW
036
15,00MW
037
18,00MW
038
039
040
Annex
18,00MW
2
0
0
1
60,52MW
90,30MW
A inexistência de procedimento da manutenção mecânica e a identificação deficiente nos terminais, levaram o
mecânico de manutenção a conectar erradamente as mangueiras de interligação entre a unidade de
bombeamento e as tubulações fixas, gerando uma não-conformidade que não foi detectada pela inspeção
posterior da Operação, permanecendo a anormalidade que gerou o desligamento da unidade geradora.
A desativação do relé 94L do disjuntor 14L1 da SE BJS, responsável pelo envio de transfer-trip ao disjuntor
14T1 da SE BRA, estava prevista no Programa executivo da equipe de Proteção. Este passo não foi cumprido,
tendo sido a causa fundamental do desligamento do trafo 04T1 da SE BRA.
Na descida do segundo ormezo o montador acidentalmente soltou o “came along” da alça do cabo sem alertar
adequadamente o auxiliar da linha de mão, resultando que o cabo de aço de meia polegada, com o peso
equivalente aos cinqüenta metros de extensão, imediatamente desceu com velocidade excessiva. Ato
contínuo, assustado com os gritos de alerta da supervisão, o auxiliar, em vez de reter soltou de vez a linha de
mão e o cabo precipitou-se por inteiro sobre o cavalete, tendo sua extremidade livre, a ré, penetrado por entre
o X de cordas da proteção lateral e tocado simultaneamente nas fases B e C causando um curto circuito
bifásico que provocou o desligamento da LT.
Saída permanente da LT 02J2 devido a curto circuito, ocasionado por contato acidental com corda-linha de
mão umedecida, devido ao contato com terreno molhado, durante trabalhos de encabeçamento de cadeias de
amarração na estrutura 29/4 da LT CMD-PTU-U2-230kV em construção,
A causa principal dessa ocorrência deveu-se à desatenção do eletricista quando da retirada do cabo de
alimentação auxiliar da furadeira que fora utilizada para execução do reforço estrutural da chave
seccionadora 34T1-2.
Durante a retirada do jumper do relé 68X-2 com o 68X-4, localizado na parte superior direita da tampa do
painel 5R (painel tipo Westinghouse), o mesmo tocou na ferragem do painel, ocasionando saída trip através
do
Relé 21.1 instantâneo. Após a saída da LT 04C1 BNB/RSD, a equipe analisou a ocorrência,
175
The operator doesn’t have ready rules, than
He improvises new rules. plan; plan
incorrect
Knowledge; mistake;
Confirmation bias
Cognitive - Choose
The operator doesn’t have ready rules, than
He improvises new rules. plan; plan
incorrect.
Skill; lapse;
Omissions
Cognitve - Remember
One step is not realized. action; plan correct
action incorrect; omission
Skill; slip;
Perceptual confusions
Motor - Hold
One correct rule was applied incorrectly.
plan; plan incorrect
Skill; slip;
Perceptual confusions
Motor - Move
One correct rule was applied incorrectly.
plan; plan incorrect
Skill; slip;
Perceptual confusions
Motor - Remove
Failure to memorize the actions and/or
objects. memory; plan correct action
incorrect
Skill; slip;
Perceptual confusions
Motor - Remove
Chapter 8
041
042
043
044
045
046
047
Annex
64,40MW
34,00MW
13,20MW
42,00MW
144,00MW
8,00MW
4,80MW
Conclui-se que a causa da ocorrência foi a não colocação da chave 43-14L1 na posição “T”, após o
fechamento da 34L1-6, durante a liberação do 14L1, o que causou a atuação da proteção falha do disjuntor,
com conseqüente envio de transfer-trip para a S/E-BNB, e desarme da LT 04C1 Banabuiu / Russas.
O desligamento tratado neste relatório foi provocado por erro de execução introduzido durante o
comissionamento do equipamento, em 1990. Apesar de várias MP terem sido realizadas desde então, os
procedimentos de medição de grandezas adotados durante os ensaios não foram suficientes para identificar a
anormalidade na RTC do circuito de corrente de neutro.
Para esta falha, a causa fundamental foi a desconexão incorreta dos pontos de trip do relé de gás, agravada
pela costura da proteção existente na parte interna da fiação da régua X1, confundindo-se com a fiação
original do equipamento.
O operador não confirmou a posição da chave 32T1-5 após a ordem de comando de fechamento.
Houve excesso de confiança do operador nos mecanismos de comando remoto da chave, tanto que passou
para o item seguinte do RTM sem a confirmação visual , através da lâmpada de supervisão, do fechamento
da 32T1-5;
Na volta ao painel CP6 para tentativa de novo reset, houve acionamento indevido do rele auxiliar que
proporciona a transferência das proteções do 14T1 para o 14D1, que é similar a chave 86-04T1 e fica
próxima a esta. Com isso, o trip do relé 87 foi transferido para o disjuntor 14D1 (que por sua vez encontravase transferindo o 14T3) desligando o transformador 04T3. Em seguida o trafo 04T2 saiu por sobrecarga, com
atuação das proteções 50/51A e 86-04T2, desligando a barra de 69 KV da SE RLD.
Em seguida o operador dirigiu-se ao painel do 12J1, ( vizinho e idêntico ao do 12J2), efetuou a abertura do
12J1 (pensando estar procedendo a abertura do 12J2),
o Operador manobrou indevidamente para fechamento a chave 32J2-6 com a chave terra 32J2-7 fechada,
atuando o relé 51-N (I), desarmando o disjuntor 12D1, desenergizando o trafo 02T3 e a barra 01B2.
176
action; plan correct action incorrect
Skill; slip;
Omissions
Cognitive - Remember
One step is not realized. action; plan correct
action incorrect; omission
Knowledge; mistake;
Biased reviewing
Cognitive - Compare
One wrong rule was applied correctly plan;
plan incorrect
Rule; mistake;
Encoding deficiencies
Motor - Remove
Wrong object selected due similarity with
desirable object. action; plan correct, action
incorrect; wrong selection
Knowledge; mistake
Overconfidence
Perceptive - Identify
One step is not realized. action; plan correct
action incorrect; omission
Skill; slip;
Perceptual confusions
Perceptive - Identify
Wrong object selected due similarity with
desirable object. action; plan correct, action
incorrect; wrong selection
Skill; slip;
Perceptual confusions
Perceptive - Identify
Wrong object selected due similarity with
desirable object. action; plan correct, action
incorrect; wrong selection
Knowledge; mistake;
Biased reviewing
Cognitive - Remember
Chapter 8
048
9,20MW
049
050
051
052
053
Annex
114,50MW
2
0
0
2
1,00MW
6,00MW
1.314,60MW
1,70MW
o Operador de Instalação ao realizar o item 2.5 do Programa de Manobras, em vez de dar o comando de
abertura para o disjuntor 12T3/SJI, inadvertidamente deu o comando de abertura para o disjuntor 12J2/SJI,
desenergizando a LT 02J2/SJI/EMT.
Provocado por um aterramento temporário indevido e não autorizado durante as manobras de liberação do
disjuntor,
Failure to memorize the actions and/or
objects. memory; plan correct action
incorrect
Skill; slip;
Perceptual confusions
Perceptive - Identify
Wrong object selected due similarity with
desirable object. action; plan correct, action
incorrect; wrong selection
Rule; mistake;
Rigidity
Cognitive - Decide
Step execution is out of order planned.
inversion sequence
Na execução da manobra de normalização do disjuntor 21Y5, que se encontrava transferido pelo
Skill; slip;
11D1, após fechamento das chaves seccionadoras 31Y5-4 e 31Y5-5, com vara de manobra, o Operador da Perceptual confusions
Instalação (OPI) verificou que a fase A da chave 31Y5-5 não havia fechado corretamente. Na tentativa de Perceptive - Identify
refazer esta manobra, o OPI manobrou, por engano, a chave vizinha 31Y5-6 fase A, em carga, causando o
desligamento automático do disjuntor 21D1 e a conseqüente desenergização do alimentador 01Y5.
Wrong object selected due similarity with
desirable object. action; plan correct, action
incorrect; wrong selection
o operador de Instalação da SE SMD, interpretou como falta de tensão geral da SE SMD e comandou a Rule; mistake;
abertura dos disjuntores 13T1, 12M1 e 51H2, interrompendo o suprimento às cargas de 69 e 13.8 kV Countersigns and nonsigns
derivadas da SE SMD
Cognitive - Compare
A equipe de TLE do START encontrava-se executando manutenção preventiva de substituição de isoladores
e ferragens oxidadas na LT, conforme SI SLML 670/2002,quando ao substituir um dos cordões de isoladores
da cadeia “V”,na estrutura 77/1, seus eletricistas não atrelaram adequadamente um dos isoladores na ferragem
de sustentação, vindo este cordão formado pelos isoladores a se desconectar quando do tensionamento da
cadeia, o que, num movimento pendular após o desprendimento, aproximou os condutores desta fase à
estrutura metálica, provocando o curto-circuito fase terra com o Conseqüente desligamento da LT.
O operador (do pátio) recém chegado a sala de comando dirigiu-se para o painel de comando dos religadores
e indevidamente acionou o punho da chave 101 do 21Y4 abrindo-o, notando a falha fechou-o em seguida.
Logo depois acionou a chave 101 do 21Y3 abrindo-o, interrompendo a carga de 1,7 MW, observando a
segunda falha solicitou ao colega (operador da sala de comando) para informar o CROL e solicitar
autorização para normalizá-lo.
177
Wrong object selected due similarity with
desirable object. action; plan correct, action
incorrect; wrong selection
Skill; slip;
Perceptual confusions
Motor - Move
action; plan correct action incorrect
Skill; slip;
Perceptual confusions
Perceptive - Identify
Wrong object selected due similarity with
desirable object. action; plan correct, action
Chapter 8
054
055
056
057
058
059
Annex
44,00MW
7,00MW
33,50MW
84,00MW
55,50MW
24,90MW
Os pontos de alarme (C6-2-3) e trip (C6-2-2) do esquema de falha, localizados no chassi CP6, estão dispostos
em pontos adjacentes na mesma régua. Na tentativa de acionar o circuito de alarme de falha do disjuntor
14T1, concluiu-se, após análise, que tenha havido acionamento indevido no ponto de trip.
O desligamento do disjuntor 12J1 durante as manobras de normalização previstas no PGM-CROL-377/02,
elaborado de acordo com o conteúdo do RTM-STD-P-2004 teve como causa primária erro na análise préoperacional e na seqüência de manobras do RTM que não considerou a transição de alimentação da cadeia de
proteção do 12J1 entre os TC’s do 12J1 (RTC 150/5 A) e os TC’s do 12D1 (400/5 A),
O desligamento acidental das barras de 13.8 kV da subestação de Teresina ocorreu por falta de implantação
de ajustes nos transformadores de corrente-TC’s que alimentam as proteções de sobrecorrentes lado 230 kV
associadas aos trafos 04T1 e 04T2/TSA, quando da entrada em operação das linhas de transmissão-LTs 04L3
e 04L4 Teresina II/Teresina e do segundo trafo de aterramento 02ª2/TSA, o que provocou um considerável
aumento do nível de curto-circuito nessa subestação.
Durante a execução das manobras de transferência para liberação do disjuntor 14L3, visando intervenção de
urgência para substituir o conector trincado da chave 34L3-5, fase C, o operador executou o item 1.7 (Abrir o
disjuntor 14L3) da Ordem de Manobras ao invés do item 1.4 (Fechar o disjuntor 14D1).
Na execução da intervenção para incorporação do disjuntor 12T1 na SE BRA, o passo a passo do
planejamento executivo foi descumprido no item que seria passar a chave 43T para a posição T antes de
manobrar o disjuntor, sendo manobrado na posição N, causando o desarme das LT’s 02V3, 02V4, 02V5 e
02V6 e, estando o disjuntor 14T1 by-passado para manutenção, enviando Transfer Trip para a SE BJS, com
conseqüente desarme da LT 04L1-BJS-BRA.
No momento da desconexão da fonte OS-10 do relé THR, ponto OS-10-83, localizado nos bornes de régua
79-50 do religador da cadeia, percebeu-se um pequeno centelhamento e tornou-se a conectá-lo novamente,
gerando um surto através da fonte do relé THR, liberando um TRIP pelo cabo acima citado, através do 2º
circuito do disjuntor 14L1, provocando o desarme da LT 04L1.
incorrect; wrong selection
Skill; slip;
Perceptual confusions
Perceptive - Identify
One wrong rule was applied correctly plan;
plan incorrect
Knowledge; mistake;
Confirmation Bias
Cognitive - Compare
One wrong rule was applied correctly plan;
plan incorrect
Rule; mistake;
Encoding deficiencies
Cognitive - Compare
One wrong rule was applied correctly plan;
plan incorrect
Skill; slip;
Reversals
Cognitive - Remember
Step execution is out of order planned.
inversion sequence
Skill; slip;
Omissions
Cognitive - Remember
Step execution is out of order planned.
inversion sequence
Rule; mistake;
Countersigns and nonsigns
Motor - Remove
Repetition of one step already done action;
plan correct action incorrect; repetition
178
Chapter 8
060
061
062
063
064
Annex
2
0
0
3
337,30MW
Às 09h03minh, quando um eletricista já na posição de trabalho seguro por cinto de segurança abaixou-se, a
sacola apoiou-se em seu joelho provocando a queda de uma ferramenta exatamente em cima do isolador
(isolador de vidro) da chave 32L4-4 partindo-o e rompendo o isolamento da chave, provocando um curtocircuito neste polo.
5,00MW
Desligamento automático do trafo 03T9, 138/13,8kV, por atuação da proteção diferencial (87) durante curtocircuito externo, provocado por erro de implantação de ajuste, ocasionando a desenergização das barras
01B4/01BP de 13,8kV.
3,10MW
5,00MW
1,00MW
A equipe do SLCP solicitou então que a operação acompanhasse os novos ensaios, e deslocou-se para o
painel de proteção da LT 02J2 onde atuou o relé 51_ A . Após ouvir o alarme do anunciador, a equipe dirigiu
se para verificar e resetar o alarme, notando então que o 12J2 ainda estava fechado e 12D1 era que havia
aberto, percebendo aí que tratava se de um desligamento acidental,
Ao fazer a seleção da chave 31C1-5, o operador se confundiu e selecionou a chave 41C1-6, faces ambas
serem fixadas no mesmo chassi e terem um ponto comum (bloco do contato fixo da 31C1-5 e contato móvel
da 41C1-6), embora ambas as chaves estivessem devidamente codificadas de forma clara e visível, além das
canelas dos elos-fusíveis estivessem pintadas de amarelo.
Logo após a ocorrência da abertura indevida do 11L1 o operador de sistema envolvido percebeu a ação
equivocada, através do display do SAGE, e executou de imediato a sua recomposição, após 7(sete) segundos.
Skill; slip;
Perceptual confusions
Motor - Move
action; plan correct action incorrect
Knowledge; Mistake;
Biased reviewing
Cognitive - Compare
One correct rule was applied incorrectly.
plan; plan incorrect
Skill; slip;
Perceptual confusions
Perceptive - Identify
Wrong object selected due similarity with
desirable object. action; plan correct, action
incorrect; wrong selection
Skill; slip;
Perceptual confusions
Perceptive - Identify
Wrong object selected due similarity with
desirable object. action; plan correct, action
incorrect; wrong selection
Skill; slip;
Perceptual confusions
Perceptive - Identify
065
8,30MW
Após haver conectado os pulos nas fases “A” e “B” durante a execução da etapa para conexão do
pulo na fase “C”, o eletricista de TLE trabalhando ao potencial aproximou o pulo da fase “B” rompendo a
distância de isolamento elétrico.
Wrong object selected due similarity with
desirable object. action; plan correct, action
incorrect; wrong selection
Skill; slip;
Perceptual confusions
Motor - Move
066
14,00MW
O desligamento indevido do religador se deu em virtude da desatenção do operador provocado pelo
estresse e cansaço, à falta de sinalização na chave de comando no painel do religador que estava sendo
liberado, e pela falta de planejamento para execução da manobra não programada.
action; plan correct action incorrect
Rule; mistake;.
Rule Strength
Perceptive - Identify
179
Chapter 8
Annex
067
14,62MW
068
22,28MW
Por uma decisão precipitada da coordenação das equipes de manutenção em avançar uma etapa do
PGM(anexo I), referente a conexão dos pulos energizados da primeira estrutura da LT 04F1-TSA/PR ao
terminal sob intervenção, sem o conhecimento da equipe de operação de instalação/sistema: os trabalhos não
foram devolvidos a operação;
Às 12:24h do dia 12/04/2003 houve abertura acidental do disjuntor 12W1 da SE Picos sem sinalização de
proteção, quando da simulação de abertura/fechamento do referido disjuntor para manutenção corretiva,
devido o operador de instalação não ter colocado todas as chaves CLTs na posição local, conforme a
solicitação de intervenção.
069
2,94MW
A causa do desarme foi curto-circuito fase-terra, fase “A”, através do centelhador, durante montagem do
andaime isolante, por diminuição do dielétrico. A peça metálica do andaime se aproximou das duas partes do
centelhador diminuindo assim este isolamento.
070
31,00MW
O desligamento foi resultado de uma falha na definição dos ajustes do sensor de direcionalidade da proteção
de sobre corrente direcional de neutro dos terminais de Sapeaçu e Funil da LT 04F3 SPU/FNL durante os
estudos realizados pela FLUXO para adequação da graduação para a entrada em operação do sistema da TSN,
não detectado na fase de homologação dos mesmos pela DOPR.
071
152,00MW
O relé 67 operou indevidamente com a corrente de carga no sentido inverso da direcionalidade devido a falha
na graduação do relé.
The operator doesn’t have ready rules, than
He improvises new rules. plan; plan
incorrect
Skill; slip;
Omissions
Cognitive - Decide
Step execution is out of order planned.
inversion sequence
Skill; slip;
Omissions
Cognitive - Remember
One step is not realized. action; plan correct
action incorrect; omission
Rule; mistake;
Action deficiencies
Motor - Move
action; plan correct action incorrect
Knowledge; mistake;
Biased reviewing
Cognitive - Compare
The operator doesn’t have ready rules, than
He improvises new rules. Plan; plan
incorrect.
Knowledge; mistake;
Biased reviewing
Cognitive - Compare
One wrong rule was applied correctly plan;
plan incorrect
072
073
200
4
241,50MW
16,80MW
Deficiência no processo de execução da lavagem de isoladores, pelo operador da pistola.
Reiniciado o processo de implantação do relé curinga, e no momento de retirada de operação do relé titular, foi
aberta a chave de teste de tensão, ao invés da chave de teste de corrente, ocasionado, desta forma, a operação
da cadeia de proteção e conseqüente desarme do disjuntor 12J1.
180
Skill; slip;
Perceptual confusions
Motor – Push/Pull
action; plan correct action incorrect
Skill; slip;
Perceptual confusions
Motor - Remove
Chapter 8
074
075
076
077
078
079
080
Annex
10,00MW
100,00MW
10,00MW
10,00MW
108,00MW
58,00MW
3,50MW
No dia 13/12 / 2004, às 19:55h, horário operacional, foi dado comando de parada indevida do 06G2, na UFL.
No momento da ocorrência, o operador tentava dar um comando de parada em vazio no 06G3 para atender um
teste de partida e parada em vazio solicitado pela manutenção. Indevidamente, comandou a parada do 06G2
ocasionando o desligamento da máquina com perda de geração de 10 MW durante 05 minutos.
O mantenedor encontrava-se sentado no interior do painel duplex 1R da LT 04L2 fazendo
adequações/conexões de pontos do SOE. Após uns quinze minutos nessa posição, levantou se para retirar a
cadeira a fim de acessar a parte inferior do painel, tocando nesse instante com a cabeça no conjunto de relés
auxiliares (AR-1, LPX, ZX3B, ZX3A e 67NX) instalados na parte inferior da portinhola interna alta existente
no painel, provocando a atuação do relé auxiliar instantâneo de trip ZX3-B, tipo AR-4 da Wenco, que
ocasionou a abertura automática do disjuntor 14L2.
Diante da configuração encontrada pelo SSMF após a ocorrência e consulta ao executante da intervenção de
limpeza, pôde-se concluir que houve um descuido do mantenedor que, na intenção de liberar a passagem de
água pelo “by-pass”, ao invés de abrir as duas válvulas (anterior e posterior ao filtro) abriu apenas uma delas, o
que impediu a passagem da água necessária à troca térmica na cuba do mancal combinado.
No dia 27/07/2004, às 16h16minh, horário operacional, foi dado comando de parada indevido do 06G2 na
UFL. No momento da ocorrência, o operador tentava dar um comando de parada total no 06G1 para
possibilitar a parada das bombas de óleo do regulador de velocidade e, indevidamente, comandou a parada do
06G2 ocasionando o desligamento da máquina
Logo em segunda foi retirado a excitação sem transferir as cargas de o serviço auxiliar da usina.
Durante a realização da manobra de transferência do serviço auxiliar 01G3 da barra NORMAL para barra de
EMERGENCIA, foi aberto o disjuntor de alimentação da barra normal antes de transferir as cargas auxiliares
do 01G3 para barra de emergência. Como conseqüência, houve a atuação da supervisão de mínima tensão
provocando parada parcial da unidade.
Abertura acidental do disjuntor 12D1 da SE-PIC, logo após manobra para liberação do disjuntor 12L1
181
Wrong object selected due similarity with
desirable object. action; plan correct,
action incorrect; wrong selection
Skill; slip;
Perceptual confusions
Perceptive - Identify
Wrong object selected due similarity with
desirable object. action; plan correct,
action incorrect; wrong selection
Skill; slip;
Perceptual confusions
Motor - Move
action; plan correct action incorrect
Knowledge; mistake;
Biased reviewing
Cognitive - Remember
One step is not realized. action; plan
correct action incorrect; omission
Skill; slip;
Perceptual confusions
Perceptive - Identify
Wrong object selected due similarity with
desirable object. action; plan correct,
action incorrect; wrong selection
Knowledge; mistake;
Biased reviewing
Cognitive - Remember
One step is not realized. action; plan
correct action incorrect; omission
Skill; slip;
Reversals
Cognitive - Remember
Step execution is out of order planned.
inversion sequence
Skill; slip;
Chapter 8
081
11,70MW
Annex
realizada por telecomando, quando da ação do operador em colocar a chave de comando (giro-pressão-giro) do
primeiro, em concordância com a posição fechado.
Perceptual confusion
Perceptive - Identify
o operador auxiliar pegou o cartão de sinalização para trabalhos em linha energizada da mão do supervisor do
turno e deslocou-se para o painel do referido disjuntor, fim realizar manobra. Contudo, ele acionou a chave
52CS, abrindo indevidamente o disjuntor 12J2, em vez de desativar a 79CS, conforme solicitado.
action; plan correct action incorrect
Skill; slip;
Perceptual confusion
Perceptive - Identify
Wrong object selected due similarity with
desirable object. action; plan correct,
action incorrect; wrong selection
Skill; slip;
Perceptual confusions
Motor - Move
082
55,78MW
Desligamento automático do Disjuntor 14T4 desenergizando o trafo 04T4 da SE BNO, por jumper acidental,
quando o SPCP em conjunto com a DECS, conectava fiação em pontos energizados de o relé auxiliar 893DX
em 250 Vcc pertencente ao circuito da chave seccionadora de 230 kV, 34T4 -6 da SE Bom Nome, em função
da obra de energização do Trafo 04T5 em paralelo ao Trafo 04T4 na referida SE.
083
70,00MW
O desligamento acidental dos disjuntores 14G2 e 13T2 teve como causa fundamental a não identificação de
qual das fontes era a defeituosa, e comandar indevidamente a botoeira de rearme de outra fonte que se
apresentava com seu funcionamento normal.
action; plan correct action incorrect
Skill; lapse;
Perceptual confusion
Cognitive - Remember
Desligamento automático do gerador 01G1, devido atuação do sistema anti-incêndio do gerador por quebra
involuntária do vidro de acionamento de emergência do CO2 quando a equipe de manutenção elétrica realizava
atividade de troca de lâmpadas fluorescentes próximo ao air-housing do gerador.
Failure to memorize the actions and/or
objects. memory; plan correct action
incorrect
Skill; slip;
Perceptual confusions
Motor - Remove
084
220,00MW
085
31,80MW
Operação indevida da chave 34N2-2, ao ser fechada. A manobra correta seria abrir a chave 34N1-2
action; plan correct action incorrect
Skill; slip;
Perceptual confusion
Perceptive - Identify
Wrong object selected due similarity with
desirable object. action; plan correct,
action incorrect; wrong selection
182
Chapter 8
086
087
088
089
2005
Annex
87,00MW
15,00MW
151,00MW
1,90MW
090
15,00MW
091
8,60MW
092
58,00MW
Um dos funcionários que se encontrava junto a chave 32T1-4 limpando os pincéis utilizados na pintura,
vendo que a parte superior desta chave não havia sido pintada conforme a 32t1 -5 e 32T1-6 pois não estava
na programação e com um lado energizado, decidiu por iniciativa própria subir na chave para pintá-la,
A falha humana foi cometida pela não confirmação no pátio da chave 32T1-5, tendo a mesma ficado mal
fechada, devido quebra da haste de acionamento
Durante a realização da manobra de liberação da chave 35L4-8 da SE CMD, a operação da subestação
realizou o fechamento manual indevido de um pólo da chave 35T1-7ª, provocando curto-circuito monofásico
à terra, que acarretou a atuação das proteções do transformador 05T1 e seu isolamento pela abertura dos
disjuntores 15T1, 14T1-A e 14T1-B.
No dia 22.02.2005, às 12:58h, horário operacional, ocorreu o desarme automático do gerador 06G1da UFL
por atuação da proteção de Baixa Pressão 2º Grau do Balão Ar + Óleo do Sistema de Regulação de
Velocidade. A perda de pressão foi motivada pelo desligamento manual da bomba No 1 do Sistema de
Regulação de Velocidade, quando a bomba No 2 desse mesmo sistema não conseguiu manter a pressão do
Balão Ar + Óleo, devido à existência de inversão remota da seqüência de fases da alimentação do seu motor.
No dia da intervenção (16/10/2005), foram realizadas todas as adequações necessárias conforme
planejamento, porém durante a colocação dos relés de TRIP para normalização dos circuitos de MPCC e
entrega dos trabalhos a operação, no momento da colocação do último relé (50/51 – X4) em sua base, houve
a atuação de alguns contatos, normalmente abertos, nesta ação, ocasionando a aberturas automática dos
disjuntores 12C1/12C3/12C4/12C5.
O CROO solicitou a abertura do disjuntor 12J1 na SE-SJI visando desenergizar a LT-02J1(SJI/ SJP) a pedido
da CEPISA. O OPE da SE-SJI procedeu a abertura indevida do disjuntor 12J2(SJI/ ELM). Logo que
percebeu o erro, efetuou o fechamento do disjuntor 12J2 e em seguida a abertura do disjuntor 12J1.
Durante a realização da manobra de transferência de alimentação da barra de EMERGENCIA, foi aberto o
disjuntor CG1-4 ao invés de fechar o CG1-5, para o CG1-4 abrir automático, desenergizando a barra de
183
Rule; mistake;
Encoding deficiencies
Cognitive - Decide
Failure to memorize the actions and/or
objects. memory; plan correct action
incorrect
Rule; mistake;
Countersigns and nonsigns
Perceptive - Identify
One step is not realized. action; plan correct
action incorrect; omission
Skill; lapse;
Perceptual confusions
Perceptive - Identify
Failure to memorize the actions and/or
objects. memory; plan correct action
incorrect
Knowledge; mistake;
Confirmation bias
Cognitive - Remember
The operator doesn’t have ready rules, than
He improvises new rules. Plan; plan
incorrect.
Skill; slip;
Perceptual confusions
Motor - Move
action; plan correct action incorrect
Skill; slip;
Perceptual confusions
Perceptive - Identify
Wrong object selected due similarity with
desirable object. action; plan correct, action
incorrect; wrong selection
Skill; slip;
Perceptual confusions
Chapter 8
093
094
095
096
097
098
Annex
emergência provocando o desligamento automático da unidade 01G4 devido atuação da supervisão de
mínima tensão provocando parada total da unidade.
32,00MW
66,00MW
85,00MW
85,00MW
129,00MW
66,13MW
Descumprimento da seqüência de manobras, por parte do OPI, constante da IO-BJS.01
Às 10h50 , iniciou-se os testes no chassi de proteção CH5, quando deveria ser no QRAs,
Esta atuação incorreta das proteções diferenciais dos transformadores 04T1 e 04T2 da SE PCD, foi uma
repetição das atuações incorretas destas mesmas proteções, para o mesmo defeito externo ocorrido no dia
07/11/2005. Após da ocorrência do dia 07/12 e a conseqüente detecção do problema, a DOPR recomendou
em caráter de urgência ao SNCP, a implantação de novos ajustes nos relés 7UT51 dos transformadores 04T1
e 04T2 da SE PCD.
Para evitar atuações das proteções diferenciais utilizadas nos transformadores 230/69 kV da SE PCD, para
faltas monofásicas externas à zona diferencial, deve-se eliminar da medição do relé, a contribuição de
seqüência zero (3I0) dos neutros dos transformadores. Como proteção dos transformadores 230/69 kV da SE
PCD, são utilizados relés 7UT51, da Siemens, onde a eliminação da corrente 3I0 é realizada através de
ajuste, pela ativação da função “I0 elimination”. Este ajuste foi considerado de forma correta no estudo de
graduação, no entanto, a Ordem de Ajuste (AO) foi emitida de maneira incorreta, por engano, deixando a
função desativada.
O desligamento foi resultado de uma falha no projeto e parametrização do relé 7SJ531 do lado de 230kV do
ATR 05T1 da SE MLG, na época da obra, e que não foi percebida pela DOPR quando definiu com urgência
as providências a serem tomadas para re-energização do ATR sem o TPC da fase C do lado de 230kV.
O desligamento foi resultado de uma falha na verificação da seletividade entre as proteções da LT 02J4,
Santo Antônio de Jesus/Nazaré-02J4 e do trafo 04T1 da SE Santo Antônio de Jesus, devido a utilização de
diagrama de tempos de operação de proteções referentes ao ajustes anteriores da proteção do transformador,
levando à conclusão errônea de existência de seletividade.
Perceptive - Identify
Wrong object selected due similarity with
desirable object. action; plan correct, action
incorrect; wrong selection
Skill; slip;
Reversals
Cognitive - Remember
Step execution is out of order planned.
inversion sequence
Skill; slip;
Perceptual confusions
Perceptive - Identify
Wrong object selected due similarity with
desirable object. action; plan correct, action
incorrect; wrong selection
Knowledge; mistake;
Biased reviewing
Cognitive - Compare
One wrong rule was applied correctly plan;
plan incorrect
Rule; mistake;
Encoding deficiencies
Cognitive - Decide
One wrong rule was applied correctly plan;
plan incorrect
Rule; mistake;
Encoding deficiencies
Cognitive - Compare
One wrong rule was applied correctly plan;
plan incorrect
Rule; mistake;
Encoding deficiencies
Cognitive - Compare
One wrong rule was applied correctly plan;
plan incorrect
184
Chapter 8
099
100
101
102
103
104
2006
Annex
102,00MW
269,90MW
1,40MW
6,00MW
1,00MW
24,6MW
Inexistência de procedimento adequado e normatizado de inspeção, controle da poluição e de lavagem do
isolador tipo multicorpo em função de suas características de isolamento (alto valor da distância de
escoamento).
Durante as manobras de liberação do disjuntor 14M4 para manutenção, a operação da subestação abriu
indevidamente o disjuntor 14D1, ao invés do 14M4, com a posterior abertura da chave 34M4-1 em carga,
provocando curto-circuito monofásico à terra no barramento 04BP-1 e o conseqüente desligamento
automático da SE CTU, com interrupção de carga da ordem de 269,6MW.
No dia 08 / 06 / 2006, às 14h56minh, horário operacional, durante manobra de normalização do religador
21Y4 que estava liberado para manutenção preventiva, o operador da UFL comandou a abertura do 21Y5 em
vez do 21D1, ocasionando a interrupção de 1,4MW durante 1 minuto e 9 segundos do alimentador 01Y5 que
supre as cargas da cidade de Ubatã-BA.
A equipe verificou nos desenhos operacionais, que uma das condições de se ter um trip direto para o
disjuntor seria através do relé 62X, que faz parte do esquema de alívio de carga que se encontra fora de
operação. Logo foi realizado um jumper nos contatos 1 e 2 do referido relé 62X, conforme desenhos da SE,
para verificar a identificação de alguma falha no circuito de trip do 12J1, porém a equipe não atentou para o
detalhe que, a chave na posição 43T transfere os trip dos esquemas especiais para o disjuntor 12D1, onde
ocorreu a abertura do 12D1 que substituía o 12J1.
Quando chegou o momento do OPI Auxiliar abrir a Chave de Interligação 31B2-1 (Conforme RTM, Item
2.6), o mesmo abriu indevidamente a Chave de Entrada 31T7-9, desenergizando a LT 01Y1.
Em torno das 18h00min h, foi observado pelo OPI do turno seguinte ao da ocorrência, que a chave 43V3 de
transferência de proteção do 12V3 encontrava-se indevidamente na posição ‘T’ Transferido, quando deveria
está na posição ‘N’ Normal, causa provável, por analogia, da ocorrência.
Rule; mistake;
Rule strenght
Cognitive - Decide
The operator doesn’t have ready rules, than
He improvises new rules. Plan; plan
incorrect.
Skill; slip;
Perceptual confusions
Perceptive - Identify
Wrong object selected due similarity with
desirable object. action; plan correct, action
incorrect; wrong selection
Skill; slip;
Perceptual confusions
Perceptive - Identify
Wrong object selected due similarity with
desirable object. action; plan correct, action
incorrect; wrong selection
Knowledge; mistake;
Biased reviewing
Cognitive - Remember
Failure to memorize the actions and/or
objects. memory; plan correct action
incorrect
Skill; slip;
Perceptual confusions
Perceptive - Identify
Wrong object selected due similarity with
desirable object. action; plan correct, action
incorrect; wrong selection
Skill; slip;
Perceptual confusions
Perceptive - Observe
Wrong object selected due similarity with
185
Chapter 8
Annex
105
20,00MW
Durante a retirada de uma tampa de canaleta neste painel PCC13 ocorreu toque não intencional com
conseqüente abertura do disjuntor 52-1
106
5,00MW
Desligamento automático da LT 03C1-Barreiras/Rio Branco quando da tentativa de religamento manual por
solicitação do Operador do CROP. O OPS comandou o religamento manual da referida LT sem a autorização
do Operador do COS da COELBA, estando a mesma aterrada sem conhecimento do CROP.
107
126,57MW
108
68,00MW
109
110
111
32,00MW
2007
99,76MW
98,41MW
A atuação acidental da proteção 51V do lado de 138kV do trafo 04T1 deveu-se a falha na elaboração da nova
OA corrigindo a versão do relé URP 2402 para 1.00, o qual não possui bloqueio para tensões acima do valor
de restrição, mantendo o mesmo valor de pick-up da OA anterior que considerava a versão 2.02, um pouco
abaixo da carga máxima.
A atuação da proteção de sobre corrente de neutro do transformador de aterramento 02A1, da barra de 69kV
da SE Pau Ferro, para defeito monofásico, fase C/T, localizado no TP do barramento de 69kV da SE Sec. Pau
Ferro, da CELPE, externo à sua zona de proteção primária, deveu-se a falha na elaboração das Ordens de
Ajustes dos relés de sobre corrente de neutro temporizados, 7SJ6225, da Siemens, das LT 02N5/02N6, Pau
Ferro/Sec. Pau Ferro, na SE Pau Ferro.
No decorrer da execução das atividades de comissionamento da Unidade de Terminal Remota, UTR, a ser
instalada nesta Subestação, como parte integrante do projeto SINOCON, a equipe técnica terceirizada da
Empresa CEMONTEX, tocou acidentalmente em dois condutores do esquema de falha do disjuntor de
transferência da barra de 69 KV, que se encontravam soltos, isolados por fita crepe, resultando no
desligamento da barra da SE IRE e de todas as linhas de transmissão e 69 KV .
Causa fundamental – descumprimento de procedimentos normatizados pela NM-TCPA-EM-012 –
Intervenção para pesquisa de fuga dc à terra, na execução de atividade de alto risco, sem o planejamento
adequado.
Causa Fundamental: desconhecimento por parte da equipe de manutenção da existência de relés
eletromecânicos internos aos relés eletrônicos, capazes de atuar na presença de vibração intensa, como
ocorreu durante o corte do chassi de proteção do trafo de terra.
desirable object. action; plan correct, action
incorrect; wrong selection
Skill; slip;
Perceptual confusions
Motor - Remove
action; plan correct action incorrect
Rule; mistake;
Action deficiencies
Cognitive - Decide
Step execution is out of order planned.
inversion sequence
Knowledge; mistake;
Biased reviewing
Cognitive - Compare
One wrong rule was applied correctly plan;
plan incorrect
Knowledge; mistake;
Biased reviewing
Cognitive - Compare
One wrong rule was applied correctly plan;
plan incorrect
Skill; slip;
Perceptual confusions
Motor - Move
action; plan correct action incorrect
Knowledge; mistake;
Overconfidence
Cognitive - Decide
The operator doesn’t have ready rules, than
He improvises new rules. plan; plan
incorrect.
Rule; mistake;
Encoding deficiencies
Information - Request
The operator don’t have ready rules, than
He improvises new rules. plan; plan
186
Chapter 8
112
113
Annex
3,20MW
45,91MW
Abertura do 12L4, face acionamento inadequado da chave 101-12L4, quando da tentativa de concordar a
posição da referida chave, no painel, com o estado do disjuntor.
incorrect.
Skill; slip;
Perceptual confusions
Perceptive - Identify
Os desligamentos ocorridos na SE Santa Cruz II, no dia 29/04/07, foram causados por uma seqüência de
erros não detectados nos processos de pré-operação, programação de manobras e execução em tempo real,
impactando em todo o processo de gerenciamento de intervenções do CROL.
Wrong object selected due similarity with
desirable object. action; plan correct, action
incorrect; wrong selection
Rule; mistake;
Encoding deficiencies
Cognitive - Compare
114
4,00MW
Desligamento acidental do disjuntor 12M1 SE MDR quando a equipe SPCP efetuava colocação da tampa da
proteção de sobre corrente IACE-11B2 fase C, em virtude do contato acidental da tampa com o borne B da
bobina ISC provocado por falha humana.
One wrong rule was applied correctly plan;
plan incorrect
Skill; slip;
Perceptual confusions
Motor - Move
115
53,00MW
Desligamento acidental da LT 03C2 BNO/CBB durante as atividades de implantação dos novos painéis de
controle de paralelismo (PCPs) dos trafos 04T4/04T5, provocado por aterramento acidental e conseqüente
queima do fusível da fase B do TP 83C
action; plan correct action incorrect
Skill; slip;
Perceptual confusions
Motor - Move
116
10,00MW
Desarme do disjuntor 13T3, desenergizando LT 03C1, quando o técnico da equipe de manutenção do SBMS
inseriu o relé k2, do circuito de abertura do referido disjuntor que se encontrava fechado (configuração
normal). Este fato ocorreu, após a devolução da intervenção pelo responsável, do SBCP, que, na ocasião, não
havia percebido a ausência do relé K2, retirado durante os trabalhos para investigação de defeito fuga à terra,
que vinha provocando a saída intempestiva da LT 03C1, registrada por 03 (três) vezes, entre os dias 22/11 e
26/11.
A atuação da proteção de sobre corrente das fases A/B do disjuntor 12T3 da SE Bom Nome, para defeito
bifásico, externo à sua zona de proteção primária, deveu-se a falha durante a fase de elaboração dos Estudos
Elétricos.
117
118
119
26,00MW
23,53MW
23,10MW
Desligamento automático da LT 03M2 CRD/STD e abertura automática da LT de 138kV 03C1 SMD/CRD
na SE SMD, coincidente com um curto trifásico na LT 03M2 CRD/STD, próximo da SE STD, provocado
por descarga atmosférica, desenergizando as SE’s SMD e CRD. A LT 03M2 CRD/STD desligou pela
atuação da proteção 21 em ambos os terminais, sendo em 1ª zona no terminal de STD e em 2ª zona no
terminal de CRD. Na SE SMD, o terminal da 03C1 abriu pela atuação da proteção 67 A/C.
A atuação da proteção de sobre corrente de neutro do disjuntor 12T3, da SE Bom Nome, para defeito externo
187
action; plan correct action incorrect
Skill; slip;
Reversals
Motor - Move
Step execution is out of order planned.
inversion sequence
Knowledge; mistake;
Biased reviewing
Cognitive - Compare
One wrong rule was applied correctly plan;
plan incorrect
Knowledge; mistake;
Biased reviewing
Cognitive - Compare
One wrong rule was applied correctly plan;
plan incorrect
Knowledge; mistake;
Chapter 8
120
121
122
123
124
2008
Annex
à sua zona de proteção primária, deveu-se a falha durante os Estudos Elétricos dos relés de sobre corrente de
neutro temporizado, 12IAC-53B da General Eletric, da LT 02V2 Bom Nome / Flores, quando da elevação do
limite base de proteção desta linha de transmissão. É imprescindível uma análise minuciosa da configuração
da instalação através do diagrama operacional durante os Estudos Elétricos, a fim de evitar erros que
provoquem desligamentos.
4,80MW
14,00MW
1,16MW
37,63MW
38,00MVar
Biased reviewing
Cognitive - Compare
One wrong rule was applied correctly plan;
plan incorrect
A causa principal dessa ocorrência deveu-se a “falha de atenção” no processo de montagem,
comissionamento e integração da referida LT.
No dia 11/11/2008 às 10h48min, durante manobras de transferência do disjuntor 12J7 executados pela
Operação, com os disjuntores 12J7 e 12D1 fechados, e com a chave 43T (seletora de transferência) na
posição ET (em transferência), ocorreu abertura indevida do 12D1, sem sinalização de proteção, quando foi
realizado comando de abertura do disjuntor 12J7, para a complementação da configuração de transferência.
Durante solicitação da concessionária COSERN para desativar o religamento automático do 21C2 da SE
CRD, o CROL efetuou o telecomando de abertura do 21C2 quando deveria ter telecomandado a desativação
do religamento automático do mesmo, acarretando interrupção nas cargas do alimentador 01C2, 1,16MW,
por um período de 8 segundos.
O operador deu o comando de abertura na chave 34M1-1 pensando ter dado o comando de abertura na chave
34M1-2
A Equipe de Manutenção deixou de rever o Planejamento da Intervenção diante de um novo cenário surgido
face à identificação da origem do vazamento de óleo isolante no Reator 01E9.
Rule; mistake;
Action deficiencies
Perceptive - Observe
Failure to memorize the actions and/or
objects. memory; plan correct action
incorrect
Skill; slip;
Perceptual confusions
Perceptive - Identify
Wrong object selected due similarity with
desirable object. action; plan correct, action
incorrect; wrong selection
Skill; slip;
Perceptual confusions
Perceptive - Identify
Wrong object selected due similarity with
desirable object. action; plan correct, action
incorrect; wrong selection
Skill; slip;
Perceptual confusions
Perceptive - Identify
Wrong object selected due similarity with
desirable object. action; plan correct, action
incorrect; wrong selection
Knowledge; mistake;
Confirmation bias
Cognitive - Compare
The operator don’t have ready rules, than
188
Chapter 8
125
126
Annex
3,67MW
2009
9,64MW
No dia 21/05/08, às 10h08min, a equipe técnica de operação realizava manobras para liberação do disjuntor
01Y1. Houve perda da barra 01BP e 01B4 decorrente atuação indevida do esquema de falha do disjuntor
associado ao disjuntor 11Y1 com a abertura do disjuntor 11BP, decorrente inversão de circuito de fiação
associado ao 11Y1 atuado o esquema de falha de disjuntor. A referida inversão foi decorrente a uma
implantação antiga que não foi detectada pela DOMC durante o comissionamento do projeto SINOCON.
He improvises new rules. plan; plan
incorrect.
Rule; mistake;
Encoding deficiences
Cognitive - Compare
One wrong rule was applied correctly plan;
plan incorrect
durante a realização de manobras para normalização do religador 21Y5, que estava transferido e entregue à
manutenção, foi aberto indevidamente o disjuntor geral 11W1 em vez do 11D1, desenergizando o
barramento 01B2.
Skill; slip;
Perceptual confusions
Perceptive - Identify
127
24,92MW
A causa da operação do relé de bloqueio foi o contato acidental de potencial positivo com o seu borne de
atuação, provocado quando a equipe de manutenção realizava a retirada da fiação desativada do chassi de
proteção, isolada com fita crepe.
Wrong object selected due similarity with
desirable object. action; plan correct, action
incorrect; wrong selection
Skill; slip;
Perceptual confusions
Motor - Remove
128
750,50MW
Às 10h29min dia 08/10/2009, ocorreu o desligamento da BARRA PRINCIPAL 69KV (02BP) da SE MRR,
provocada pela abertura em carga da chave 32J4-5, devido a acidente durante deslocamento do equipamento
"SKYLADER", para posicioná-lo em situação de realização de trabalho.
action; plan correct action incorrect
Skill; slip;
Perceptual confusions
Motor - Move
129
199,00MW
A causa principal do desligamento foi a falha no planejamento, quando não houve a percepção de que
haveria atuação do circuito de trip do 02A2, quando da realização do comando de abertura do 12D1 com a
manutenção da adequação provisória e a ativação do circuito de trip do 02A2. Por se tratar de uma atividade
de urgência, o planejamento e a análise das atividades f oram feitos simultaneamente à execução. Mesmo não
sendo esse o fator fundamental para a causa do desligamento, é possível que, com mais tempo para análise e
maturação da configuração provisória, poderiam ter sido evitadas as falhas do planejamento e,
conseqüentemente, o desligamento.
As equipes envolvidas na intervenção realizaram análise dos testes a serem realizados, no entanto, não foi
visualizado o risco de atuação do esquema de falha do disjuntor 12T5, pelo fato de que o único contato
normalmente aberto da chave 86-T5, utilizado no projeto de proteção e controle, não tem a função direta de
desligamento do disjuntor 12T5.
130
131
15,10MW
9,96MW
Após conclusão das atividades de substituição da bucha do transformador 04T1 da SE CCD, ocorrida em
189
action; plan correct action incorrect
Knowledge; mistake;
Biased reviewing
Cognitive - Compare
One wrong rule was applied correctly plan;
plan incorrect
Knowledge; mistake;
Biased reviewing
Cognitive - Compare
Failure to memorize the actions and/or
objects. memory; plan correct action
incorrect
Skill; slip;
Chapter 8
Annex
02.08.2009, no período das 09 às 12h00min, foi devolvido o equipamento à Operação, conforme previsto,
sendo energizado às 12h 04 min. Às 12h07min, ocorreram os desarmes dos disjuntores 14W1 e 12M1,
através da chave 86 T, motivado devido à válvula de segurança do transformador 04T1 encontrar-se atuada.
Às 12h12min, após inspeção no equipamento, foi constatado a válvula que a segurança estava atuada.
190
Reversals
Cognitive - Remember
One step is not realized. action; plan correct
action incorrect; omission
Download