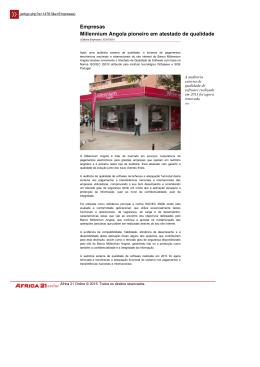
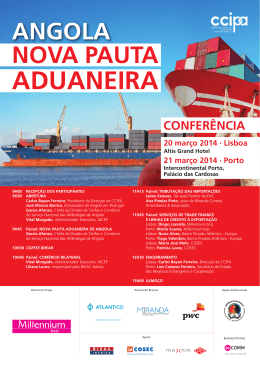
2010
Relatório e Contas
Annual Report
2010
Relatório e Contas
Annual Report
Millennium Angola
ÍNDICE
4
7
8
8
9
10
14
22
28
52
53
55
Mensagem do Presidente da Comissão Executiva
Síntese de Indicadores
Comissão Executiva
Órgãos Sociais
Estrutura Accionista
Enquadramento Macroeconómico
Síntese de Actividade
Demonstrações Financeiras
Notas às Demonstrações Financeiras
Proposta de Aplicação de Resultados
Relatório dos Auditores Externos
Parecer do Conselho Fiscal
INDEX
62
65
66
66
67
68
72
80
86
110
111
113
Message from the Chairman of the Executive Committee
Financial Summary
Executive Committee
Corporate Boards
Shareholder Structure
Macroeconomic Framework
Business Review
Financial Statements
Notes to the Financial Statements
Proposal for the Appropriation of Profits
External Auditors’ Report
Opinion of the Supervisory Board
2010
Relatório e Contas
Millennium Angola
3
Os Colaboradores que emprestam a sua imagem à ilustração deste documento são os Prémios de Excelência 2010.
ÍNDICE
4
7
8
8
9
10
14
22
28
52
53
55
Mensagem do Presidente da Comissão Executiva
Síntese de Indicadores
Comissão Executiva
Órgãos Sociais
Estrutura Accionista
Enquadramento Macroeconómico
Síntese de Actividade
Demonstrações Financeiras
Notas às Demonstrações Financeiras
Proposta de Aplicação de Resultados
Relatório dos Auditores Externos
Parecer do Conselho Fiscal
Banco Millennium Angola, S.A.
2010
RELATÓRIO E CONTAS MILLENNIUM ANGOLA
MENSAGEM DO PRESIDENTE DA COMISSÃO EXECUTIVA
MENSAGEM DO PRESIDENTE
DA COMISSÃO EXECUTIVA
A actividade económica em Angola revelou-se mais dinâmica em 2010
do que no ano anterior, sob o impulso da reanimação do mercado
petrolífero mundial. As receitas das exportações de petróleo
melhoraram e contribuíram para uma gestão mais confortável das
reservas internacionais líquidas e das finanças públicas.A recomposição
das reservas do país e medidas administrativas mais rigorosas sobre
detenção de posições em moeda estrangeira proporcionaram uma
maior estabilidade ao valor da moeda angolana face ao dólar. O valor
médio do kwanza pouco se alterou ao longo de 2010, estabilizando em
valores entre os 90 e os 95 kwanza por dólar.
O crescimento estimado do Produto Interno Bruto (PIB) em 2010 foi de 4,5%,
com contributos positivos do sector petrolífero e não petrolífero, de 2,7% e 5,7%,
tendo, consequentemente, a importância do sector não petrolífero voltado a ganhar
peso na economia angolana.
No âmbito de reformas financeiras, de destacar a nova lei orgânica do Banco Nacional de Angola, que
estabelece critérios do financiamento do Estado, a obtenção de uma classificação de rating de risco soberano
e o estreitamento das relações com o FMI, consubstanciadas no desembolso cumulativo de cerca de mil
milhões de dólares em ajuda financeira.
Não obstante o Banco Millennium Angola se encontrar em fase de investimento na expansão da sua rede
comercial, registou 32,8 milhões de USD de resultado líquido, um acréscimo de 63% face a 2009. Este
desempenho resulta da evolução positiva do produto bancário, que cresceu 51%, para 124,6 milhões de USD,
com destaque para o aumento de 82% da margem financeira. No cômputo geral, a posição de mercado do
Banco saiu reforçada em 2010, com especial destaque para o número de Clientes activos, que subiu 142% face
ao ano anterior, e os recursos totais de clientes e o crédito, quando expressos em USD, cresceram,
respectivamente, 26% e 34%. A rentabilidade dos capitais próprios (Return on Equity) foi de 19,5% e o rácio
de eficiência (cost to income – custos de estrutura em percentagem do produto bancário) teve uma evolução
muito positiva, tendo passado de 62,2% para 53,2%.
Relativamente aos acontecimentos mais relevantes do ano de 2010, é de destacar a abertura de 16 novos
balcões, o que permitiu encerrar o ano com um total de 39 balcões, em 12 das 18 províncias de Angola e 714
Colaboradores, mais 43% do que em 2009.
6
2010
RELATÓRIO E CONTAS MILLENNIUM ANGOLA
MENSAGEM DO PRESIDENTE DA COMISSÃO EXECUTIVA
A partir de Agosto, o Banco teve a iniciativa de abrir aos sábados de manhã, terminado o ano com 21 dos seus
39 balcões a prestar este conveniente serviço, tão apreciado pelos Clientes e que diferencia o Banco face aos
seus concorrentes.
A inauguração do novo Centro de Processamento de Dados, que dá suporte a todas as operações, vem
responder com maior eficácia às necessidades do Banco, com impactos positivos nos procedimentos internos
e na oferta de produtos e serviços, dando-se um passo decisivo na consolidação do serviço prestado ao
Cliente.
Na área de comunicação, o Banco reforçou o valor da Marca Millennium com a contratação da cantora Yola
Semedo, aumentando a sua visibilidade junto da população angolana. Já a realização dos “Almoços Millennium”,
iniciativas regulares do Banco com o objectivo de reunir agentes da economia nacional e abordar assuntos
relevantes para o País, reforçaram a aproximação à comunidade empresarial angolana.
Na recta final do ano, o Banco lançou uma Conta exclusiva para Funcionários Públicos, uma vez que estes
passaram a ser livres na escolha do banco comercial onde poderão ter as suas contas bancárias domiciliadas.
O trabalho e esforço empreendidos pelas equipas do Banco foi reconhecido, tendo o Banco Millennium Angola
sido considerado em 2010 “Marca de Excelência” pela Superbrands,“Melhor Banco Estrangeiro em Angola”
pela revista Emeafinance e “Bank of the Year – Angola” pela revista The Banker, uma publicação do Grupo
Financial Times.
Para o próximo ano, as prioridades estratégicas do Millennium Angola passam essencialmente pelo
desenvolvimento do negócio, pela contenção de custos e pelo maior controlo da qualidade da carteira de
crédito, continuando o nosso compromisso com o desenvolvimento da economia angolana, reforçando a
solidez dos nossos valores e experiência, através da contínua valorização dos nossos profissionais, da
honestidade e ética com que nos relacionamos dentro e fora do Banco, do reforço da relação de confiança
com os Clientes e do nosso contributo para a sociedade angolana.
José Reino da Costa
Presidente da Comissão Executiva
7
2010
RELATÓRIO E CONTAS MILLENNIUM ANGOLA
SÍNTESE DE INDICADORES
SÍNTESE DE INDICADORES
Principais indicadores de gestão
‘10
(Milhares AOA)
‘09
(Milhares AOA)
Var. %
‘10
(Milhares USD) (*)
‘09
(Milhares USD) (*)
Var.%
3.018.457
11.453.207
6.093.654
54%
17%
29%
2,8%
19%
1.589.825
6.532.475
4.055.516
45%
20%
35%
2,3%
13%
90%
75%
50%
32.845
124.628
66.308
20.129
82.710
51.348
63%
51%
29%
122.975.063
56.191.221
95.724.804
40.564.643
28%
39%
1.327.408
606.535
1.070.771
453.753
24%
34%
53.411.143
71.685.117
29.415.835
17.102.287
17,5%
39.310.726
54.717.760
23.794.598
14.083.830
17,2%
36%
31%
24%
21%
576.526
773.778
317.518
184.604
439.727
612.069
266.165
157.541
31%
26%
19%
17%
39
24
15
51
394
74.861
714
80.625
23
16
7
29
237
36.997
499
33.275
70%
50%
114%
76%
66%
102%
43%
142%
53,2%
62,2%
18
20
-8%
4.876
4.177
17%
18.503
16.130
15%
9.844
2.067
10.014
1.447
-2%
43%
2,0%
0,9%
1,9%
2,9%
0,7%
1,5%
1. RENTABILIDADE
Resultado líquido do exercício
Produto bancário
Custos de estrutura
Margem financeira/Produto bancário
Comissões líquidas/Produto bancário
Resultados financeiros/Produto bancário
Rentabilidade dos Activos Médios (ROAA)
Rentabilidade dos Capitais Próprios (ROE)
2. BALANÇO
Activo total líquido
Crédito sobre clientes (valores brutos) (**)
Crédito sobre clientes, líquido de provisões (**)
Recursos totais de clientes (**)
Recursos totais de OIC (**)
Situação líquida
Rácio de solvabilidade
3. ESTRUTURA
Número de balcões
Luanda
Outras províncias
Número de ATM activos
Número de TPA activos
Número de cartões activos
Número de Colaboradores
Número de Clientes activos
4. EFICIÊNCIA E PRODUTIVIDADE
Cost-to-income (***)
Número de Colaboradores/Número
de balcões
Resultado líquido/Número médio
de Colaboradores
Produto bancário/Número
médio de Colaboradores
Custos de estrutura/Número médio
de Colaboradores
Número de Clientes/Número de balcões
5. QUALIDADE DO CRÉDITO
Crédito vencido + 15 dias em % do crédito
a clientes
Crédito vencido + 30 dias em % do crédito
a clientes
Custo do risco
(*)Valores em USD meramente indicativos (conversão dos valores em moeda nacional à taxa de câmbio média de AOA/USD para os valores da Demonstração de Resultados: 2009 de 78,98
e em 2010 de 91,90 e à taxa de câmbio de AOA/USD de final do ano para as rubricas de Balanço: em 2009 de 89,40 e em 2010 de 92,64.
(**) Não inclui juros corridos.
(***) Rácio custos de estrutura sobre o produto bancário.
9
2010
RELATÓRIO E CONTAS MILLENNIUM ANGOLA
COMISSÃO EXECUTIVA
COMISSÃO EXECUTIVA
PAULO MOITA
PAULO MOITA
JOSÉ REINO DA COSTA
HERMENEGILDA BENGE
Presidente
Vice-Presidente
ÓRGÃOS SOCIAIS
CONSELHO DE ADMINISTRAÇÃO
MESA DA ASSEMBLEIA GERAL
PRESIDENTE:
VOGAIS:
Carlos Jorge Ramalho
dos Santos Ferreira
José Laurindo Reino da Costa
Hermenegilda de Fátima
Agostinho Lopes Benge
António Maria Abreu Raposo
de Magalhães
Pedro Rui Fontela Coimbra
Miguel Maya Dias Pinheiro
Fernando Gomes dos Santos
Augusto Ramiro Baptista
João Matias
COMISSÃO EXECUTIVA
PRESIDENTE:
José Laurindo Reino da Costa
VICE-PRESIDENTE: Hermenegilda de Fátima
Agostinho Lopes Benge
VOGAIS:
António Maria Abreu Raposo
de Magalhães
João Matias
Pedro Rui Fontela Coimbra
10
PRESIDENTE:
Mateus Neto
VICE-PRESIDENTE: Ana Isabel dos Santos
de Pina Cabral
SECRETÁRIO:
Graça Maria de Jesus Vieira
Lopes Pitra Costa
CONSELHO FISCAL
PRESIDENTE:
António de Almeida
VOGAL EFECTIVO: Luzia Rosária Fátima Oliveira
VOGAL EFECTIVO: Madalena Adriano Domingos
de Lemos Neto
VOGAL SUPLENTE: João Manuel Francisco
2010
RELATÓRIO E CONTAS
PAULO MOITA
PAULO
P
AULO MOITA
MOITA
MO
MILLENNIUM ANGOLA
PRINCIPAIS DESTAQUES
PAULO MOITA
ANTÓNIO RAPOSO
DE MAGALHÃES
JOÃO MATIAS
PEDRO COIMBRA
Vogal
Vogal
Vogal
ESTRUTURA ACCIONISTA
31,5%
SONANGOL –
SOC. NACIONAL
DE COMBUSTÍVEIS
DE ANGOLA, E.P.
15,8%
BANCO PRIVADO
ATLÂNTICO, S.A.
52,7%
BANCO COMERCIAL
PORTUGUÊS, S.A.
11
2010
RELATÓRIO E CONTAS MILLENNIUM ANGOLA
ENQUADRAMENTO MACROECONÓMICO
ENQUADRAMENTO
MACROECONÓMICO
ECONOMIA MUNDIAL
A economia mundial registou um desempenho mais favorável em 2010 e perspectiva-se que o processo de
recuperação económica possa prosseguir, mais moderadamente, ao longo de 2011. Destaca-se o vigor das
economias em desenvolvimento, cujo ritmo de crescimento do PIB correspondeu quase ao triplo do valor médio
verificado nos países avançados.
MERCADOS FINANCEIROS
Os mercados financeiros apresentaram comportamentos menos voláteis, mas acentuou-se a diferenciação por
emitente em função do respectivo risco de crédito, designadamente no plano do risco soberano. No mercado
cambial verificou-se muita volatilidade.A apreciação do dólar, característica da primeira metade do ano em função
da instabilidade que se abateu sobre a área do euro, tendeu a inverter ao longo do segundo semestre.
As autoridades chinesas mantiveram uma política de gradual fortalecimento do yuan face ao dólar.
O aumento significativo do preço das matérias-primas exerceu uma pressão ascendente em termos globais sobre
as taxas de inflação. Em alguns casos, retomaram-se níveis de preços das matérias-primas superiores aos que se
verificavam antes da crise, nomeadamente em bens alimentares, com proporções dramáticas nos países e nas
populações de menor rendimento. A investigação e a adopção de soluções mais eficientes na produção e na
utilização de recursos escassos, melhoria na coordenação e consistência das políticas globais prefiguram-se como
acções determinantes para o equilíbrio geo-estratégico mundial.
CRESCIMENTO ECONÓMICO MUNDIAL
O crescimento económico mundial estimado para 2010 é de cerca de 4,5%. A fase inicial e a incerteza com a
sustentabilidade e vigor da recuperação económica têm condicionado a evolução do mercado de trabalho.
Efectivamente, não se regista ainda uma redução consistente do desemprego, que se mantém em valores
historicamente muito elevados. Na identificação dos riscos para 2011, sobressaem, de molde consensual, os
desenvolvimentos da crise soberana dos estados membros da Área do Euro e as suas repercussões institucionais.
Efectivamente, neste enquadramento, contrasta a intensidade da crise que continua a afectar vários estados
soberanos da periferia europeia, incluindo Portugal, e que motivou acções de assistência externa para estabilização
das economias e suporte aos sistemas financeiros, primeiro na Grécia e mais recentemente na Irlanda.
DESEMPENHO ECONÓMICO DOS PAÍSES DA ÁFRICA SUBSARIANA
Pelo contrário, as economias africanas, nomeadamente da região subsariana, têm evidenciado um grau de
resistência notável às ondas de choque sucessivas da crise financeira e económica mundial.A região retomou um
ritmo de crescimento robusto, com perspectivas favoráveis para os próximos anos. A instabilidade política tem
diminuído, permitindo a consolidação de estratégias de desenvolvimento económico baseadas na revitalização
de infra-estruturas básicas e incentivo à iniciativa privada. Os fluxos de comércio têm-se intensificado, quer com
importantes economias mundiais fortemente importadoras de matérias-primas, quer entre os países da
comunidade sul-africana. Os ciclos económicos instáveis estão a transformar-se em ciclos com maior
previsibilidade, assentes numa política económica mais coerente, fundamental para fortalecer o clima de confiança
e captar investimento directo externo.
Apesar de ainda prevalecer uma elevada dependência do ciclo das matérias-primas, relevam-se os progressos na
diversificação gradual da capacidade produtiva de outros sectores, na agricultura e na indústria, com efeitos
multiplicadores em actividades associadas, na construção e nos serviços. Desta forma, poder-se-ão criar condições
para um ciclo de crescimento virtuoso e melhoria das condições de vida associadas a um contexto demográfico
vantajoso para as próximas décadas, por oposição aos desafios colocados pelo envelhecimento das populações
nos países desenvolvidos.
12
2010
RELATÓRIO E CONTAS MILLENNIUM ANGOLA
ENQUADRAMENTO MACROECONÓMICO
RISCOS RELEVANTES PARA A GESTÃO DA POLÍTICA ECONÓMICA
Não obstante as perspectivas mais propícias, persistem alguns riscos a curto prazo, relevantes para a gestão da
política económica, designadamente: o impacto do aumento do preço de combustíveis e de bens alimentares nas
finanças da população urbana; o equilíbrio entre as necessidades de apoio social, esforço de investimento e
sustentabilidade das finanças públicas e das reservas oficiais do país; o controlo de pressões inflacionistas; e o ciclo
político, tendo em conta a ocorrência de eleições em vários países ao longo de 2011.
ECONOMIA ANGOLANA
A actividade económica em Angola revelou-se mais dinâmica em 2010 sob o impulso da reanimação do mercado
petrolífero mundial.As receitas das exportações de petróleo revelaram-se mais robustas. Contribuíram para uma
situação mais equilibrada das reservas externas e das finanças públicas, cuja fragilidade em 2009 obrigou a uma
travagem brusca nas políticas públicas de promoção do crescimento. A estimativa oficial para o crescimento real
do PIB em 2010 é de 4,5%, com contributos positivos do sector petrolífero e não petrolífero, para os quais se
estimam taxas de crescimento real de 2,7% e 5,7%, respectivamente.
EVOLUÇÃO DO PREÇO DO BRENT 2008-2010
150
140
130
120
110
100
90
80
70
60
50
40
30
20
10
13
Nov. 10
Dez. 10
Set. 10
Out. 10
Jul. 10
Ago. 10
Jun. 10
Mai. 10
Abr. 10
Fev. 10
Mar. 10
Jan. 10
Dez. 09
Nov. 09
Set. 09
Out. 09
Jul. 09
Ago. 09
Jun. 09
Mai. 09
Abr. 09
Fev. 09
Mar. 09
Jan. 09
Dez. 08
Nov. 08
Out. 08
Set. 08
Ago. 08
Jul. 08
Jun. 08
Mai. 08
Abr. 08
Mar. 08
Jan. 08
Fev. 08
0
2010
RELATÓRIO E CONTAS MILLENNIUM ANGOLA
ENQUADRAMENTO MACROECONÓMICO
ESTRUTURA DA ECONOMIA ANGOLANA E PERFORMANCE
SECTORIAL
Não obstante a sensibilidade elevada ao ciclo do petróleo, a importância do sector petrolífero na economia
angolana tem vindo a diminuir (de 58% em 2008 para 46% em 2009) devendo aproximar-se rapidamente dos
40%. De acordo com os planos de desenvolvimento do Executivo, o sector agrícola e a indústria transformadora
poderão ver o seu peso económico quase duplicar no período 2009-2011.
EVOLUÇÃO DA ESTRUTURA DA ECONOMIA ANGOLANA – 2001/2009
11,5%
12,3%
17,3%
12,2%
6,5%
12,4%
15,4%
14,1%
13,8%
14,2%
3,6%
3,9%
8,2%
6,2%
51,2%
2001
3,4%
3,7%
8,0%
4,7%
53,8%
3,6%
3,8%
8,2%
4,5%
48,3%
2002
2003
4,7%
4,8%
9,7%
2,8%
3,1%
3,6%
7,2%
4,3%
62,9%
7,6%
6,0%
7,8%
16,8%
16,9%
15,3%
21,2%
4,3%
4,8%
7,3%
2,3%
55,7%
4,9%
5,3%
7,7%
1,8%
4,4%
6,6%
8,2%
1,2%
7,7%
8,8%
52,0%
55,8%
58,3%
6,2%
10,4%
1,1%
45,6%
2004
2005
Petróleo e gás
Ind. diamantífera e outros
Agricultura, silvicultura, pescas
2006
2008
2007
2009
Indústria transformadora
Construção
Comércio
Outros
Fonte: MINPLAN, OGE, BNA.
Neste processo de reabilitação e de desenvolvimento,Angola tem a oportunidade de beneficiar com a adopção
de tecnologias produtivas inovadoras, reconfigurando o seu tecido industrial e a arquitectura urbanística em
função de modelos que maximizem a utilização de recursos, minimizem o transtorno das populações e sejam
economicamente e ambientalmente sustentáveis. O programa de acção do Governo para 2011 enquadra-se
nesse objectivo. Conjuga medidas de cariz social (educação, saúde e protecção social) com políticas de melhoria
de contexto, na habitação, serviços comunitários e no clima de negócios.
14
2010
RELATÓRIO E CONTAS MILLENNIUM ANGOLA
ENQUADRAMENTO MACROECONÓMICO
POLÍTICA MONETÁRIA E CAMBIAL
A recomposição das reservas do país e medidas administrativas mais rigorosas sobre detenção de posições em
moeda estrangeira proporcionaram uma maior estabilidade ao valor da moeda angolana face ao dólar. O valor
médio do kwanza pouco se alterou ao longo de 2010, estabilizando em valores entre os 90 e os 95 kwanza por
dólar. Em termos médios anuais, significou uma desvalorização de cerca de 16% face ao dólar, mas que quase na
totalidade se concretizou na segunda metade de 2009 e próxima do andamento médio da inflação.
Um factor potenciador dos efeitos das medidas de política monetária e indicativo da confiança dos agentes
económicos é a redução da importância do dólar como moeda de troca e de reserva de valor nas transacções
domésticas. A estabilidade do crescimento e a redução das pressões inflacionistas deverão concorrer nesse
sentido, mas o Banco Central tem também adoptado medidas de restrição à utilização de moeda estrangeira que
poderão acelerar o processo de redução do grau de dolarização da economia (regras mais restritivas nas posições
em moeda estrangeira permitida aos Bancos, regulação específica para casas de câmbio, regulação do microcrédito,
entre outras).
O aumento da eficácia da política monetária será importante no combate às pressões inflacionistas, que
sistematicamente têm resultados superiores ao objectivo das autoridades. Em 2010, a inflação ter-se-á situado em
valores superiores a 12%, em termos médios anuais. O objectivo para 2011 é de uma taxa média de inflação de
12%. No âmbito de reformas destaque-se, no plano financeiro, a nova lei orgânica do Banco Nacional de
Angola, que estabelece critérios do financiamento do Estado; a obtenção de uma classificação de
rating de risco soberano e o estreitamento das relações com o FMI, consubstanciadas no
desembolso cumulativo de cerca de mil milhões de dólares em ajuda financeira; e no
âmbito orçamental, a adopção de um programa de investimentos mais selectivo,
coerente com o objectivo de estabilização da inflação e suavização do ciclo do
petróleo.
SECTOR BANCÁRIO
Os efeitos desfasados de um contexto externo mais exigente
reflectiram-se numa ligeira degradação na qualidade do crédito
em carteira dos Bancos. A progressão no crédito à economia
foi substancialmente superior à verificada na captação de
recursos e o grau de cobertura de serviços bancários
continua a evoluir favoravelmente, aproximando-se de cerca
de um milhar de balcões. A oferta de serviços bancários
constitui, em simultâneo, um factor de incentivo e uma
consequência do grau de desenvolvimento da economia
angolana. Nesse âmbito, o Programa de Consolidação
da Banca Angolana representa uma iniciativa de
reforço da confiança no sistema bancário, através da
reformulação dos requisitos regulamentares e dos
parâmetros de acção da supervisão comportamental.
15
2010
RELATÓRIO E CONTAS MILLENNIUM ANGOLA
SÍNTESE DE ACTIVIDADE
SÍNTESE DE ACTIVIDADE
O Banco Millennium Angola (BMA) tem a aspiração de se tornar num dos Bancos de referência do Sistema
Financeiro Angolano. Para esse fim, o Banco continua a expandir a sua rede de distribuição, procurando cobrir o
território nacional com forte capilaridade e garantir um serviço de excelência a todos os segmentos do mercado.
As prioridades de gestão definidas para 2010 assentam em cinco pilares: Desenvolvimento do Negócio; Expansão
da Rede de Retalho; Recrutamento e Formação; Gestão do Risco e Performance.
O ano de 2010 foi um ano positivo a todos os níveis. A actividade cresceu de forma rentável, tendo sido
canalizados todos os esforços no sentido de garantir uma cultura de rigor e uma orientação permanente para
os resultados, assentes essencialmente em planos de acção sustentados numa gestão adequada do risco, custos
e investimentos e na melhoria da eficiência operacional.
RESULTADOS, RENTABILIDADE E SOLIDEZ
O Banco alcançou um resultado líquido de 32.845 milhares de USD, o que representa um crescimento de 63%
face ao período homólogo do ano anterior.
RESULTADO LÍQUIDO
Milhões de USD
32,8
+76%
7,1
20,1
De destacar o forte contributo da margem financeira para o crescimento
do produto bancário, a qual cresceu 82%, atingindo um valor de 67.791
milhares de USD. De salientar ainda o facto do Banco ter terminado o ano
na terceira posição em termos de ranking de compra de dólares em leilão
junto do Banco Nacional de Angola, com uma quota de 10%, com reflexo
positivo nos resultados provenientes de operações financeiras.
5,8
3,4
2006
2007
2008
2009
Não obstante o Banco se encontrar em fase de expansão da sua rede
comercial, verificou-se uma melhoria do rácio de eficiência que passou
de 62,2% em 2009 para 53,2% em 2010. Este crescimento resultou
essencialmente da evolução positiva do produto bancário, que cresceu 51%
para um valor de 124.628 milhares de USD, mais forte que a evolução dos
custos de estrutura que apresentaram um crescimento de 29%.
2010
PRODUTO BANCÁRIO
Milhões de USD
Registou-se uma forte melhoria da rentabilidade dos capitais próprios (ROE)
que se situou em 19% (quando em 2009 correspondia a 13%) e a rentabilidade
dos activos médios (ROAA) passou de 2,3% em 2009, para 2,8% em 2010.
O rácio de solvabilidade fixou-se nos 17,5%, continuando bastante acima do
limite mínimo regulamentar.
124,6
ESTRUTURA E REDE
O crescimento do negócio, assente na execução do plano de expansão, é
assumido como uma prioridade fundamental do Banco em 2010. O Banco
detinha em 2010 um total de 80.625 Clientes activos, representando um
crescimento de 142% face ao período homólogo do ano anterior, tendo sido
captados em 2010 cerca de 51.150 novos Clientes, que comparam com os
18.700 novos Clientes captados em 2009.
82,7
+87%
36,2
25,3
10,3
2006
2007
2008
2009
Nota: Taxa Anual de Crescimento Composta
– Compound Annual Growth Rate (CAGR).
2010
A execução do plano de expansão da rede comercial pautou-se pela abertura
de 16 novos balcões, permitindo encerrar o ano com um total de 39 balcões,
em 12 das 18 províncias de Angola, e 714 Colaboradores (+43% face a 2009).
O reforço dos programas de recrutamento e formação (inicial e continuada)
de quadros angolanos continua a ser um factor crítico para o desenvolvimento
sustentável e eficiente do Banco, tendo sido promovidas mais de 100 acções
de formação, correspondendo a um total de 2.350 horas de formação.
16
2010
RELATÓRIO E CONTAS
O activo total do Banco atingiu o montante de 1.327.408 milhares de USD,
que representa um crescimento de 24% face a 2009.
MILLENNIUM ANGOLA
SÍNTESE DE ACTIVIDADE
NÚMERO DE CLIENTES ACTIVOS
80.625
No final do ano, o Banco dispunha de um parque de terminais activos que
compreendia 51 caixas automáticas – ATM (+76% face a 2009) e 394
terminais de pagamento automático – TPA (+66% face a 2009), mantendo
a sétima e quinta posição em termos de ranking, respectivamente.
+86%
O número de cartões activos registou um aumento de 102%, para um total
de 74.861 cartões.
33.275
13.703
RECURSOS E CRÉDITO
16.566
6.685
Em 2010 verificou-se uma evolução positiva dos volumes de crédito e de recursos
de clientes, cujo incremento correspondeu a 34% e 26%, respectivamente.
O rácio de transformação de recursos em crédito situou-se nos 78,6%.
A carteira de títulos ascendeu a 315.904 milhares de USD, representando
aproximadamente 24% do activo.
2006
2007
2008
2009
2010
RECURSO DE CLIENTES
Milhões de USD
773,8
QUALIDADE DO CRÉDITO
612,1
No final de 2010, o rácio do crédito vencido (+ 15 dias) correspondia a 2%
da carteira de crédito, sendo de salientar o grau de cobertura do crédito
vencido por provisões que correspondia a 252%, o que reflecte prudência
na atribuição de graus de risco a Clientes/Operações.
O custo do risco da car teira de crédito passou de 1,5% para 2,9%,
fundamentalmente motivado pelo crescimento do negócio e reforço dos
níveis prudenciais.
MARKETING E COMUNICAÇÃO
+60%
384,5
220,2
117,9
2006
Em 2010, o Banco teve a iniciativa de abrir 21 dos seus 39 balcões aos sábados,
adicionando assim um dia útil à semana de prestação de serviço bancário.
2007
2008
2009
2010
CRÉDITO BRUTO
Milhões de USD
Ao longo do ano foram lançadas novas aplicações financeiras, tanto em
moeda nacional como em moeda estrangeira, com taxas muito atractivas. Na
captação de depósitos, destaca-se o Plano Poupança Família, um produto
de incentivo à poupança das famílias. No crédito foram lançadas aVantagem
Salário e a Vantagem PME, respectivamente para particulares e empresas,
permitindo a antecipação de rendimentos mensais.
606,5
453,8
+70%
302,9
Ainda na vertente de crédito às empresas e apoio ao investimento, foi assinado
um protocolo com o Fundo do Projecto Coca-Cola com o objectivo de abrir
uma linha de crédito “Bengo Investe I”, no valor global de vinte milhões de
dólares americanos, para financiar projectos de investimento para a província
do Bengo, nas áreas industriais, agrícolas, comerciais e de serviços.
No que respeita aos meios de pagamento, foram introduzidos o cartão de débito
não personalizado, de entrega imediata ao Cliente, e novos livros de cheques.
173,6
72,9
2006
2007
2008
Nota: Taxa Anual de Crescimento Composta
– Compound Annual Growth Rate (CAGR).
O serviço de transferências rápidasWestern Union, do qual o Banco é agente desde 2004, passou a estar disponível em
todos os balcões para os Clientes do Banco.Também para oferecer mais benefícios aos Clientes,foi lançado um programa
de descontos associado à utilização e dinamização dos cartões de créditoVisa Classic e Prestige, pioneiro em Angola.
Nos serviços, foi disponibilizado um novo site Internet para Particulares e Empresas e inaugurado o novo Centro
de Processamento de Dados, que dá suporte a todas as operações do Banco. Esta nova infra-estrutura informática
veio responder com maior eficácia às necessidades do Banco, com impactos positivos nos procedimentos internos
e na oferta de produtos e serviços, dando-se um passo decisivo na consolidação do serviço prestado ao Cliente.
17
2009
2010
2010
RELATÓRIO E CONTAS MILLENNIUM ANGOLA
SÍNTESE DE ACTIVIDADE
Na área de comunicação, iniciou-se a associação da Marca com a conceituada
cantora Yola Semedo, o que permitiu aumentar a visibilidade da Marca
Millennium Angola junto da população angolana e contribuir para a
captação de novos Clientes, nomeadamente através da oferta de um
CD promocional com 8 das 14 músicas do álbum “Minha Alma”,
lançado em simultâneo com a campanha de publicidade.
Os “Almoços Millennium”, iniciativas regulares do Banco com o
objectivo de reunir agentes da economia nacional e abordar assuntos
relevantes para o país, realizadas em Luanda e na província de Benguela,
reforçaram a aproximação à comunidade empresarial angolana.
O Banco participou também em feiras destinadas a empresas, como
a FILDA, bem como em eventos de recrutamento, no sentido de captar
Clientes e negócio e reforçar as equipas do Banco.
O Banco Millennium Angola apoiou ainda missões empresariais organizadas pela
Associação Empresarial da Região de Lisboa (AERLIS),Agência para o Investimento
e Comércio Externo de Portugal (AICEP) e Associação Comercial de Lisboa (ACL),
actuando como um agente facilitador de contactos entre as empresas oriundas de Portugal que
integravam a missão e as empresas sediadas em Angola.Ao patrocinar estes eventos, o Millennium Angola procurou
fomentar oportunidades de negócio, investimento e parcerias com impacto positivo para o desenvolvimento local.
Em 2010, o Banco recebeu e respondeu a 55 pedidos de informação de órgãos de comunicação social.
Na recta final do ano, o Banco lançou uma conta exclusiva para funcionários públicos, uma vez que estes passaram
a ser livres na escolha do Banco Comercial onde poderão ter as suas contas bancárias domiciliadas.
Em 2010, o Banco Millennium Angola foi considerado “Marca de Excelência 2009/10” pela Superbrands,“Melhor
Banco Estrangeiro em Angola 2010” pela revista emeafinance e “Bank of theYear – Angola 2010” pela revistaThe
Banker, uma publicação do Grupo Financial Times.
RESPONSABILIDADE SOCIAL
Em 2010, o Banco manteve a sua acção de apoio à comunidade por ocasião do Dia da Criança Africana (16 de Junho)
e, à semelhança do ano anterior, entregou um donativo em numerário, bens alimentares, material escolar, vestuário e
brinquedos ao Programa Criança Feliz, localizado no Golfe, Centro Médico das Madres, município do Kilamba Kiaxi.
O Programa Criança Feliz tem como objectivos reduzir a pobreza, promover a educação das crianças da
comunidade e oferecer cuidados de saúde. Os beneficiários são crianças com idades até aos 14 anos.
Esta acção, realizada em parceria com o Grupo da Amizade, uma Organização Não Governamental (ONG),
envolveu todos os Colaboradores que, de forma directa ou indirecta, contribuíram com a entrega de bens
alimentares, material escolar, vestuário e brinquedos.
O Millennium Angola apoiou também o Grupo da Amizade através da participação no Jantar de Gala com a aquisição
de uma mesa de dez lugares.Adicionalmente, no Natal, o Banco apoiou a divulgação do Bazar de Natal, organizado pelo
mesmo grupo, mencionando a data e local da sua realização no postal de Natal do Banco e comprando 400 ingressos
que ofereceu a individualidades. O objectivo do Bazar de Natal é, também, angariar fundos para projectos sociais.
Os fundos recolhidos pelo Grupo da Amizade servem para apoiar grupos mais desfavorecidos, contribuindo
com financiamento a projectos como a Farmácia do Grupo da Amizade, o Centro de Nutrição, a Escola das
Irmãs Teresianas, a Mamã Muxima, a Escola Dom Bosco, o Programa Criança Feliz, o Orfanato do Kikolo, a Escola
Missionária de Camanongue, a Obra de Caridade de Santa Isabel ou a Missão Católica da Camunda.
RECURSOS HUMANOS
RECRUTAMENTO
Responder às diferentes necessidades de recursos humanos é um dos principais desafios da área de recrutamento
no mercado angolano, o qual o BMA superou mais uma vez com elevado sucesso ao recrutar 299 novos
Colaboradores em 2010, perfazendo o total de 714 Colaboradores.
18
2010
RELATÓRIO E CONTAS
MILLENNIUM ANGOLA
SÍNTESE DE ACTIVIDADE
Nas diferentes acções de recrutamento efectuadas, realçamos a atracção de talentos a dois
níveis:
Protocolo de Cooperação estabelecido com a Universidade Agostinho Neto
referente à atribuição de bolsas de estudo.
Neste âmbito foram feitas apresentações do Banco em diversas universidades
com o objectivo de recolher candidaturas não só de futuros bolseiros
como de potenciais candidatos a recrutamento.
Atribuímos um total de oito bolsas externas (alunos UAN) e seis
bolsas internas (a Colaboradores do Banco):
Participação em Feiras de Emprego através da Elite Angolan
Careers, com lugar em Luanda e Lisboa. O BMA recrutou
através desta fonte um total de 17 novos Colaboradores.
FORMAÇÃO
A formação dos Colaboradores é fulcral no projecto de
desenvolvimento e crescimento do Banco, pelo que no ano passado
foram promovidas 110 acções de formação, de diferente natureza técnica e
comportamental e de carácter inicial, contínuo ou de longa duração, que se reflectiu nas 2.357 horas de formação
envolvendo os Colaboradores a todos os níveis.
Um dos nossos parceiros, a Academia Millennium Atlântico (AMA), é uma alavanca para o crescimento e fortalecimento
das competências dos nossos Colaboradores.A AMA é um projecto pioneiro em Angola que visa ministrar formação
de elevada qualidade para responder às necessidades do mercado empresarial angolano, nomeadamente na área
financeira, banca e seguros e que foi apresentada publicamente em Julho. O projecto pretende formar cerca de dez
mil angolanos até 2015, tendo como promotores a Sonangol, o Banco Privado Atlântico e o Banco Millennium Angola.
GESTÃO DE CARREIRAS
A Avaliação Individual de Desempenho continua a ser a ferramenta que permite cotar e consolidar opiniões sobre
o desempenho de um Colaborador, quer seja de elevado desempenho ou baixo desempenho e aplicar medidas
de retenção e correctivas.
Exemplo, é a atribuição do Prémio de Excelência a Colaboradores que demonstraram estar acima dos padrões
de Excelência.
GESTÃO DE PESSOAL
O que de mais relevante ocorreu na Gestão de Pessoal em 2010 foi a adequação e melhor aproveitamento do
aplicativo HRMS (Sistema de Gestão de Recursos Humanos) às necessidades de funcionamento da área com a
criação de várias tabelas e novas funcionalidades dos Self Services Colaborador e Chefia.Tais melhorias permitiram
facilitar a comunicação entre os Colaboradores e hierarquias com a DRH – Gestão de Pessoal, reduzir custos e
diminuir a pegada ecológica do Banco.
A entrada em vigor do Seguro de Saúde em Agosto de 2010, direccionado a todos os Colaboradores, foi sem
dúvida um salto qualitativo no que concerne às regalias atribuídas aos nossos Colaboradores.
BALCÃO DE COLABORADORES
A orientação para o Cliente interno é a principal missão do balcão de Colaboradores, que no ano de 2010
concluiu com sucesso a atribuição de 29 créditos à habitação e 130 créditos para fins sociais.
PRIORIDADES ESTRATÉGICAS
As iniciativas estratégicas para os próximos anos passam pelo crescimento do negócio, assente na execução do
plano de expansão com a abertura de balcões, alargamento da base de Clientes e aumento da captação de
recursos de balanço em cada um dos segmentos de negócio, pelo reforço dos programas de recrutamento e
formação de quadros angolanos, pela contínua aposta na implementação de processos adequados de gestão e
monitorização do risco, bem como no contínuo investimento em tecnologias e sistemas de informação.
19
2010
RELATÓRIO E CONTAS MILLENNIUM ANGOLA
SÍNTESE DE ACTIVIDADE
CAPTAÇÃO DE NOVOS CLIENTES
PLANO POUPANÇA FAMÍLIA
DEPÓSITO KANDANDO
VANTAGEM SALÁRIO
20
2010
RELATÓRIO E CONTAS
MILLENNIUM ANGOLA
SÍNTESE DE ACTIVIDADE
CARTÕES DE CRÉDITO
BALCÃO DE CATETE
BALCÃO DE MALANGE
BALCÃO DE TALATONA IMBONDEIRO
21
2010
RELATÓRIO E CONTAS MILLENNIUM ANGOLA
SÍNTESE DE ACTIVIDADE
Hermenegilda Lopes Benge,Vice-Presidente da Comissão Executiva, recebe o prémio
“Melhor Banco Estrangeiro em Angola 2010” atribuído pela revista emeafinance.
José Reino da Costa recebe o Prémio “Bank of the Year – Angola 2010” atribuído pela
revista The Banker, uma publicação do Grupo Financial Times.
“Foto de família” dos Prémios Excelência pelo desempenho em 2009, entregues
na Reunião de Objectivos realizada em 2010.
Chegada dos Colaboradores à Reunião de Objectivos realizada no Centro
de Convenções de Talatona, em Luanda Sul.
22
2010
RELATÓRIO E CONTAS
MILLENNIUM ANGOLA
SÍNTESE DE ACTIVIDADE
Carlos Santos Ferreira, Presidente do Millenium bcp, discursa nos “Almoços Millennium”,
iniciativa regular do Banco que reúne empresários e agentes económicos.
Pavilhão principal do Banco Millennium Angola na Feira Internacional de Luanda – FILDA.
No Dia da Criança Africana, em parceria com a ONG “Grupo da Amizade”, o Banco
entregou um donativo em numerário, bens alimentares, material escolar, vestuário e
brinquedos ao Programa Criança Feliz.
Academia Millennium Atlântico, projecto de formação pioneiro em Angola para
responder às necessidades do mercado empresarial angolano, nomeadamente na área
financeira, banca e seguros.
23
2010
RELATÓRIO E CONTAS MILLENNIUM ANGOLA
DEMONSTRAÇÕES FINANCEIRAS
DEMONSTRAÇÕES FINANCEIRAS
BALANÇO A 31 DE DEZEMBRO DE 2010 E 2009
Milhares de AOA
ACTIVO
DISPONIBILIDADES
APLICAÇÕES DE LIQUIDEZ
Operações no Mercado Monetário Interfinanceiro
Operações de Compra de Títulos de Terceiros com Acordo de Revenda
Operações de Venda de Títulos de Terceiros com Acordo de Revenda
Aplicações em Ouro e Outros Metais Preciosos
TÍTULOS E VALORES MOBILIÁRIOS
Mantidos para Negociação
Disponíveis para Venda
Mantidos até ao Vencimento
INSTRUMENTOS FINANCEIROS DERIVADOS
CRÉDITOS NO SISTEMA DE PAGAMENTOS
OPERAÇÕES CAMBIAIS
CRÉDITOS
Créditos
(-) Provisão para Créditos de Liquidação Duvidosa
CLIENTES COMERCIAIS E INDUSTRIAIS
OUTROS VALORES
IMOBILIZAÇÕES
Imobilizações Financeiras
Imobilizações Corpóreas
Imobilizações Incorpóreas
TOTAL ACTIVO
NOTA
‘10
‘09
4
5
22.467.141
4.218.480
4.216.237
0
0
2.243
29.266.269
0
29.266.269
0
0
11.849
1.457.091
53.790.892
56.570.970
-2.780.078
0
1.148.268
11.209.598
2.078.828
5.500.049
3.630.721
123.569.588
16.275.302
4.168.817
4.166.594
0
0
2.223
26.847.042
0
26.847.042
0
0
277.679
389.414
39.477.533
40.731.450
-1.253.917
0
1.028.440
7.704.240
1.982.375
3.547.637
2.174.228
96.168.467
6
10
10
7
10
8
9
9
continua
24
2010
RELATÓRIO E CONTAS MILLENNIUM ANGOLA
DEMONSTRAÇÕES FINANCEIRAS
Milhares de AOA
continuação
PASSIVO
DEPÓSITOS
Depósitos à Ordem
Depósitos a Prazo
Outros Depósitos
CAPTAÇÕES PARA LIQUIDEZ
Operações no Mercado Monetário Interfinanceiro
Operações de Venda de Títulos Próprios com Acordo de Recompra
Operações de Venda de Títulos de Terceiros com Acordo de Recompra
CAPTAÇÕES COM TÍTULOS E VALORES MOBILIÁRIOS
INSTRUMENTOS FINANCEIROS DERIVADOS
OBRIGAÇÕES NO SISTEMA DE PAGAMENTOS
OPERAÇÕES CAMBIAIS
OUTRAS CAPTAÇÕES
FORNEC. COMERCIAIS E INDUST. E ADIANT. DE CLIENTES
OUTRAS OBRIGAÇÕES
PROVISÕES PARA RESPONSABILIDADES PROVÁVEIS
PROVISÕES TÉCNICAS
TOTAL PASSIVO
INTERESSES MINORITÁRIOS
FUNDOS PRÓPRIOS
Capital Social
Reserva de Actualização Monetária do Capital
Reservas e Fundos
Resultados Potenciais
Resultados Transitados
(-) Dividendos Antecipados
Resultado da Alteração de Critérios Contabilísticos
(-) Acções ou Quotas Próprias em Tesouraria
TOTAL PASSIVO + FUNDOS PRÓPRIOS
LUCRO POR ACÇÃO
25
NOTA
‘10
‘09
11
72.004.195
38.643.630
33.360.565
0
29.470.873
29.470.873
0
0
0
0
1.418.009
500.377
0
0
2.566.105
507.742
0
106.467.301
0
17.102.287
3.809.399
0
10.274.431
3.018.457
0
0
0
0
123.569.588
54.836.372
28.592.484
26.243.888
0
23.852.195
23.795.270
56.925
0
0
0
1.277.771
374.562
0
0
1.418.019
325.718
0
82.084.637
0
14.083.830
3.809.399
0
8.684.606
1.589.825
0
0
0
0
96.168.467
0,318
0,168
12
13
13
13
14
15
2010
RELATÓRIO E CONTAS MILLENNIUM ANGOLA
DEMONSTRAÇÕES FINANCEIRAS
DEMONSTRAÇÃO DE RESULTADOS A 31 DE DEZEMBRO DE 2010 E 2009
Demonstração de Resultados
I.
II.
1.
2.
3.
4.
III.
5.
6.
7.
8.
9.
IV.
V.
VI.
VII.
VIII.
IX.
X.
XI.
10.
11.
12.
13.
14.
15.
16.
17.
18.
19.
XII.
XIII.
XIV.
XV.
XVI.
XVII.
XVIII.
XIX.
XX.
XXI .
XXII.
XIII.
MARGEM FINANCEIRA (II+III)
PROVEITOS DE INSTRUMENTOS FINANCEIROS
ACTIVOS (1+2+3+4)
Proveitos de Aplicações de Liquidez
Proveitos de Títulos e Valores Mobiliários
Proveitos de Instrumentos Financeiros Derivados
Proveitos de Créditos
(-) CUSTOS DE INSTRUMENTOS FINANCEIROS
PASSIVOS (5+6+7+8+9)
Custos de Depósitos
Custos de Captações para Liquidez
Custos de Captações com Títulos e Valores Mobiliários
Custos de Instrumentos Financeiros Derivados
Custos de Outras Captações
RESULTADOS DE NEGOCIAÇÕES E AJUSTES AO VALOR JUSTO
RESULTADOS DE OPERAÇÕES CAMBIAIS
RESULTADOS DE PRESTAÇÃO DE SERVIÇOS FINANCEIROS
(-) PROVISÕES PARA CRÉDITO DE LIQUIDAÇÃO
DUVIDOSA E PRESTAÇÃO DE GARANTIAS
RESULTADOS DE PLANOS DE SEGUROS,
CAPITALIZAÇÃO E SAÚDE COMPLEMENTAR
RESULTADO DE INTERMEDIAÇÃO
FINANCEIRA (I+IV+V+VI+VII+VIII)
RESULTADOS COM MERCADORIAS, PRODUTOS
E OUTROS SERVIÇOS
(-) CUSTOS ADMINISTRATIVOS E DE COMERCIALIZAÇÃO
(10+11+12+13+14+15+16+17+19)
Pessoal
Fornecimentos de Terceiros
Impostos e Taxas Não Incidentes sobre o Resultado
Penalidades Aplicadas por Autoridades Reguladoras
Custos com Pesquisa e Desenvolvimento
Provisões Específicas para Perdas com Clientes Comerciais
e Industriais
Outros Administrativos e de Comercialização
Provisões Específicas para Perdas com Inventários Comerciais
e Industriais
Depreciações e Amortizações
Recuperação de Custos
(-) PROVISÕES SOBRE OUTROS VALORES
E RESPONSABILIDADES PROVÁVEIS
RESULTADO DE IMOBILIZAÇÕES FINANCEIRAS
OUTROS PROVEITOS E CUSTOS OPERACIONAIS
OUTROS PROVEITOS E CUSTOS OPERACIONAIS
(XI+XII+XIII+XIV)
RESULTADO DA ACTUALIZAÇÃO MONETÁRIA PATRIMONIAL
RESULTADO OPERACIONAL (IX+X+XV+XVI)
RESULTADO NÃO OPERACIONAL
RESULTADO ANTES DOS IMPOSTOS E OUTROS
ENCARGOS (XVII+XVIII)
(-) ENCARGOS SOBRE O RESULTADO CORRENTE
RESULTADO CORRENTE LÍQUIDO (XIX+XX)
(-) PARTICIPAÇÕES MINORITÁRIAS
RESULTADO DO EXERCÍCIO (XXI+XXII)
26
Milhares de AOA
Nota
‘10
‘09
19
6.229.936
2.939.104
8.857.910
450.947
3.708.109
0
4.698.854
4.371.726
387.567
1.925.475
0
2.058.683
20
21
-2.627.974
-2.582.376
-45.598
0
0
0
0
3.283.249
1.944.474
-1.432.621
-956.149
-476.472
0
0
0
0
2.316.295
1.316.401
14
-1.868.085
-859.034
0
0
9.589.574
5.712.766
0
0
-6.133.680
-2.313.826
-3.046.747
-23.231
-1.732
0
-4.115.583
-1.432.916
-2.256.086
-44.780
-881
0
0
0
0
0
0
-748.144
0
0
-380.920
0
25
-4.085
0
33.842
-13.518
606
19.254
26
-6.103.923
0
3.485.651
10.216
-4.109.241
0
1.603.526
-13.702
3.495.868
-477.411
3.018.457
0
3.018.457
1.589.824
0
1.589.824
0
1.589.825
22
23
24
24
24
25
16
2010
RELATÓRIO E CONTAS MILLENNIUM ANGOLA
DEMONSTRAÇÕES FINANCEIRAS
DEMONSTRAÇÃO DAS MUTAÇÕES NOS FUNDOS PRÓPRIOS A 31 DE DEZEMBRO DE 2010
SALDOS INICIAIS
Recebimentos por
Aumentos de Capital
Pagamentos por Reduções de Capital
Incorporações de Reservas ao Capital
Incorporações de Resultados
Transitados ao Capital
Efeitos de Ajustes emTVM Disponíveis
para Venda
Efeitos da Variação Cambial em
Imobilizações Financeiras no Exterior
Efeitos de Perdas Líquidas em
Fundos de Pensão Patrocinados
Efeitos de Reservas de Reavaliação
Próprias
Efeitos de Reservas de Reavaliação
de Coligadas e Equiparadas
Efeitos de Encargos Fiscais Incidentes
sobre os Resultados Potenciais
Apropriação do Resultado Líquido
Constituições de Reservas
Anulações de Reservas
(-) Pagamentos de Dividendos
Antecipados
(-) Dividendos Propostos no Período
Compensações de Prejuízos
Resultado da Alteração de Critérios
Contabilísticos
Aquisição de Acções ou Quotas
em Tesouraria
Alienação de Acções ou Quotas
em Tesouraria
Extinção de Acções ou Quotas
em Tesouraria
SALDOS FINAIS
Milhares de AOA
Capital
social
Reservas
Resultados
potenciais
Resultados
transitados
(-)
Dividendos
antecipados
Resultado
da alteração
de critérios
contabilísticos
(-) Acções
ou quotas
em tesouraria
Totais
3.809.399
8.684.606
3.495.868
1.589.825
0
0
0
17.579.698
0
0
0
0
0
0
0
0
0
0
0
0
0
0
0
0
0
0
0
0
0
0
0
0
0
0
0
0
0
0
0
0
0
0
0
0
0
0
0
0
0
0
0
0
0
0
0
0
0
0
0
0
0
0
0
0
0
0
0
0
0
0
0
0
0
0
0
0
0
0
0
0
0
0
0
0
0
0
1.589.825
0
-477.411
0
0
0
0
0
-1.589.825
0
0
0
0
0
0
0
0
0
0
0
0
0
-477.411
0
0
0
0
0
0
0
0
0
0
0
0
0
0
0
0
0
0
0
0
0
0
0
0
0
0
0
0
0
0
0
0
0
0
0
0
0
0
0
0
0
0
0
0
0
0
0
0
0
0
0
0
0
0
0
0
0
0
0
3.809.399
10.274.431
3.018.457
0
0
0
0
17.102.287
27
2010
RELATÓRIO E CONTAS MILLENNIUM ANGOLA
DEMONSTRAÇÕES FINANCEIRAS
DEMONSTRAÇÃO DOS FLUXOS DE CAIXA PARA OS EXERCÍCIOS FINDOS
EM 31 DE DEZEMBRO DE 2010 E 2009
I.
1.
2.
3.
4.
II.
5.
6.
7.
8.
9.
IV.
V.
VI.
VII.
VIII.
IX.
10.
11.
12.
13.
14.
15.
X.
XI.
16.
17.
18.
19.
20.
FLUXO DE CAIXA DA MARGEM FINANCEIRA (I+II)
Recebimentos de Proveitos de Instrumentos Financeiros Activos (1+2+3+4)
Recebimentos de Proveitos de Aplicações de Liquidez
Recebimentos de Proveitos de Títulos e Valores Mobiliários
Recebimentos de Proveitos de Instrumentos Financeiros Derivados
Recebimentos de Proveitos de Créditos
(-) Pagamentos de Custos de Instrumentos Financeiros Passivos (5+6+7+8+9)
Pagamentos de Custos de Depósitos
Pagamentos de Custos de Captações para Liquidez
Pagamentos de Custos de Captações com Títulos e Valores Mobiliários
Pagamentos de Custos de Instrumentos Financeiros Derivados
Pagamentos de Custos de Outras Captações
FLUXO DE CAIXA DOS RESULTADOS DE NEGOCIAÇÕES
E AJUSTES AO VALOR JUSTO
FLUXO DE CAIXA DOS RESULTADOS DE OPERAÇÕES CAMBIAIS
FLUXO DE CAIXA DOS RESULTADOS DE PRESTAÇÃO
DE SERVIÇOS FINANCEIROS
FLUXO DE CAIXA DOS RESULTADOS DE PLANOS DE SEGUROS,
CAPITALIZAÇÃO E SAÚDE COMPLEMENTAR
FLUXO DE CAIXA OPERACIONAL DA INTERMEDIAÇÃO
FINANCEIRA (I+IV+V+VI+VII)
FLUXO DE CAIXA DOS RESULTADOS COM MERCADORIAS,
PRODUTOS E OUTROS SERVIÇOS
(-) Pagamentos de Custos Administrativos e de Comercialização
(-) Pagamentos de Outros Encargos sobre o Resultado
Fluxo de Caixa da Liquidação de Operações no Sistema de Pagamentos
Fluxo de Caixa dos Outros Valores e Outras Obrigações
Recebimentos de Proveitos de Imobilizações Financeiras
Fluxo de Caixa de Outros Custos e Proveitos Operacionais
RECEBIMENTOS E PAGAMENTOS DE OUTROS PROVEITOS
E CUSTOS OPERACIONAIS (10+11+12+13+14+15)
FLUXO DE CAIXA DAS OPERAÇÕES (VIII+IX+X)
Fluxo de Caixa dos Investimentos em Aplicações de Liquidez
Fluxo de Caixa dos Investimentos em Títulos e Valores Mobiliários Activos
Fluxo de Caixa dos Investimentos em Instrumentos Financeiros Derivados
Fluxo de Caixa dos Investimentos em Operações Cambiais
Fluxo de Caixa dos Investimentos em Créditos
Milhares de AOA
31 Dez. 10
31 Dez. 09
6.229.936
8.857.910
450.947
3.708.109
0
4.698.854
-2.627.974
-2.582.376
-45.598
0
0
0
2.939.104
4.371.725
387.567
1.925.475
0
2.058.683
-1.432.621
-956.149
-476.472
0
0
0
0
3.283.249
0
2.316.295
1.944.474
1.316.401
0
0
0
0
0
-4.733.394
0
-2.329.705
406.068
-119.828
32.045
-7.971.200
-793.058
606
18.074
-4.415.109
-4.415.109
-49.663
-2.419.227
-11.075.283
-11.075.283
-1.568.288
-14.395.346
-1.234.745
-15.839.520
282.711
-17.840.557
continua
28
2010
RELATÓRIO E CONTAS MILLENNIUM ANGOLA
DEMONSTRAÇÕES FINANCEIRAS
Milhares de AOA
continuação
31 Dez. 10
XII.
XIII.
21.
22.
23.
XIV.
XV.
24.
25.
26.
27.
28.
29.
XVI.
XVII.
30.
31.
32.
33.
34.
XVIII.
XIX .
XX.
FLUXO DE CAIXA DOS INVESTIMENTOS DE INTERMEDIAÇÃO
FINANCEIRA (16+17+18+19+20)
-23.958.264
FLUXO DE CAIXA DOS INVESTIMENTOS EM OUTROS VALORES
0
Fluxo de Caixa dos Investimentos em Imobilizações
-4.230.088
Fluxo de Caixa dos Resultados na Alienação de Imobilizações
0
Fluxo de Caixa dos Outros Ganhos e Perdas Não Operacionais
10.216
FLUXO DE CAIXA DAS IMOBILIZAÇÕES (21+22+23)
-4.219.872
FLUXO DE CAIXA DOS INVESTIMENTOS (XII+XIII+XIV)
-28.178.136
Fluxo de Caixa dos Financiamentos com Depósitos
17.167.823
Fluxo de Caixa dos Financiamentos com Captações para Liquidez
5.618.678
Fluxo de Caixa dos Financiamentos com Captações com Títulos e Valores Mobiliários
0
Fluxo de Caixa dos Financiamentos com Instrumentos Financeiros Derivados
0
Fluxo de Caixa dos Financiamentos com Operações Cambiais
125.815
Fluxo de Caixa dos Financiamentos com Outras Captações
0
FLUXO DE CAIXA DOS FINANCIAMENTOS DE INTERMEDIAÇÃO
FINANCEIRA (24+25+26+27+28+29)
22.912.316
FLUXO DE CAIXA DOS FINANCIAMENTOS COM MINORITÁRIOS
0
Recebimentos por Aumentos de Capital
0
(-) Pagamentos por Reduções de Capital
0
(-) Pagamentos de Dividendos
0
Recebimentos por Alienação de Acções ou Quotas Próprias em Tesouraria
0
(-) Pagamentos por Aquisição de Acções ou Quotas Próprias em Tesouraria
0
FLUXO DE CAIXA DOS FINANCIAMENTOS COM
FUNDOS PRÓPRIOS (30+31+32+33+34)
0
FLUXO DE CAIXA DOS FINANCIAMENTOS COM OUTRAS OBRIGAÇÕES
0
FLUXO DE CAIXA DOS FINANCIAMENTOS (XVI+XVII+XVIII+XIX)
22.912.316
SALDO EM DISPONIBILIDADES NO INÍCIO DO PERÍODO
16.275.302
SALDO EM DISPONIBILIDADES AO FINAL DO PERÍODO
22.467.141
VARIAÇÕES EM DISPONIBILIDADES (XI+XV+XX)
29
6.191.839
31 Dez. 09
-44.596.763
0
-3.518.303
0
-13.702
-3.532.005
-48.128.768
35.127.386
6.977.131
0
0
-305.193
0
41.799.323
0
8.009.264
0
0
0
0
8.009.264
0
49.808.587
8.023.683
16.275.302
8.251.619
2010
RELATÓRIO E CONTAS MILLENNIUM ANGOLA
NOTAS ÀS DEMONSTRAÇÕES FINANCEIRAS
NOTAS ÀS DEMONSTRAÇÕES
FINANCEIRAS
EM 31 DE DEZEMBRO DE 2010 E 2009
(Montantes em milhares de kwanzas angolanos – mAOA, excepto quando expressamente indicado, conforme
disposto no Aviso n.º15/2007, de 12 de Setembro).
1. NOTA INTRODUTÓRIA
O Banco Millennium Angola, S.A. (adiante igualmente designado por “Banco” ou “BMA”), desenvolve a sua
actividade na área da banca de retalho. A actividade do BMA assenta na realização de operações financeiras e na
prestação de serviços permitidos aos bancos comerciais de acordo com a legislação em vigor, nomeadamente,
transacções em moeda estrangeira, concessão de crédito e captação de depósitos.
No cumprimento dos seus objectivos, o Banco dispõe de uma rede comercial nacional que, em 31 de Dezembro
de 2010, ascende a 39 balcões, sendo de referir que 16 destes foram abertos no último exercício.
O BMA resulta da transformação do Banco Comercial Português Sucursal em Angola em Banco de direito local,
com a consequente integração de todos os seus Activos e Passivos, e no âmbito da autorização de Conselho de
Ministros de 22 de Fevereiro de 2006. A escritura pública foi celebrada em 3 de Abril de 2006.
No que se refere à estrutura accionista e conforme detalhado na Nota 15, o Banco é detido maioritariamente
pelo Banco Millennium bcp (Grupo Millennium), encontrando-se detalhados na Nota 17 os principais saldos e
transacções com empresas do Grupo Millennium.
2. COMPARABILIDADE DA INFORMAÇÃO
As demonstrações financeiras anuais aqui apresentadas foram publicadas de forma a poderem ser comparadas
com as do período anterior. As Demonstrações Financeiras do Banco agora apresentadas foram preparadas de
acordo com o Plano Contabilístico das Instituições Financeiras (CONTIF). Os valores comparativos apresentados
para o exercício de 2009 foram reescritos de acordo com o CONTIF, face àqueles anteriormente apresentados
de acordo com o anterior Plano de Contas das Instituições Financeiras (PCIF).
O Banco adoptou retrospectivamente o CONTIF. O impacto da adopção do CONTIF nas demosntrações
financeiras do Banco resume-se às reclassificações para o cumprimento do novo plano contabilístico.
3. BASES DE APRESENTAÇÃO E RESUMO DAS PRINCIPAIS POLÍTICAS
CONTABILÍSTICAS
3.1. BASES DE APRESENTAÇÃO
As demonstrações financeiras apresentadas neste relatório foram preparadas no pressuposto da continuidade
das operações, com base nos livros e registos mantidos pelo Banco, e de acordo com os princípios contabilísticos
estabelecidos no CONTIF, conforme definido no Instrutivo n.º 09/07 de 19 de Setembro, do Banco Nacional de
Angola (adiante igualmente designado por “BNA”), o qual entrou em vigor em 1 de Janeiro de 2010.
As demonstrações financeiras do BMA relativas ao exercício findo em 31 de Dezembro de 2010 não foram
ainda objecto de aprovação pela Assembleia Geral. No entanto, o Conselho de Administração do Banco admite
que venham a ser aprovadas sem alterações significativas.
30
2010
RELATÓRIO E CONTAS MILLENNIUM ANGOLA
NOTAS ÀS DEMONSTRAÇÕES FINANCEIRAS
As demonstrações financeiras do Banco em 31 de Dezembro de 2010 e 2009 encontram-se expressas em
milhares de kwanzas angolanos (AOA), conforme Aviso n.º 15/2007, art. 5.º do BNA, encontrando-se todos os
activos e passivos denominados em moeda estrangeira convertidos ao câmbio médio indicativo publicado pelo
BNA na data do balanço.
Em 31 de Dezembro de 2010 e 2009, os câmbios face ao AOA das divisas a que o Banco se encontra mais
exposto são os seguintes:
‘10
‘09
USD
92,64
89,398
EUR
122,7
128,202
De seguida são apresentadas as principais políticas contabilísticas que serviram de base à preparação das
demonstrações financeiras:
3.2. PRINCIPAIS POLÍTICAS CONTABILÍSTICAS
3.2.1. Especialização dos exercícios
O Banco reconhece os proveitos e os custos quando obtidos ou incorridos, independentemente do seu
recebimento ou pagamento, sendo incluídos nas demonstrações financeiras dos períodos a que se referirem.
Os proveitos são considerados realizados quando: a) nas transacções com terceiros, o pagamento for efectuado
ou assumido firme compromisso de efectivá-lo; b) na extinção, parcial ou total, de um passivo, qualquer que seja
o motivo, sem o desaparecimento simultâneo de um activo de valor igual ou maior; c) na geração natural de novos
activos, independentemente da intervenção de terceiros; ou d) no recebimento efectivo de doações e subvenções.
Os custos, por sua vez, são considerados incorridos quando: a) deixar de existir o correspondente valor activo,
por transferência da sua propriedade para um terceiro; b) pela diminuição ou extinção do valor económico de
um activo; ou c) pelo surgimento de um passivo, sem o correspondente activo.
3.2.2. Operações cambiais
As operações de compra e venda de moeda estrangeira, quando liquidadas na data da sua contratação, são
registadas nas contas patrimoniais do Banco. Caso a liquidação seja posterior à data de contratação, as mesmas
são adicionalmente registadas em contas extrapatrimoniais.
As operações em moeda estrangeira são registadas nas respectivas moedas, de acordo com os princípios do
sistema multicurrency. As operações em moeda estrangeira são registadas com base na taxa de câmbio de
referência do dia da operação, divulgada pelo BNA. Os proveitos e os custos decorrentes de operações activas
e passivas indexadas à variação cambial, não realizados, são registados nas contas representativas do proveito ou
custo da aplicação ou captação efectuada.
As variações e diferenças de taxas sobre os valores relativos à compra e venda de moedas estrangeiras a liquidar,
ocorridas entre a data de contratação e de liquidação do contrato de câmbio, são contabilizadas na conta Resultados
de Operações Cambiais, em contrapartida da conta patrimonial de Proveitos por Compra e venda de moedas
estrangeiras a receber ou custos por compra e venda de moedas estrangeiras a pagar, conforme seja aplicável.
3.2.3.Títulos e valores mobiliários
Os títulos e valores mobiliários adquiridos pelo Banco são registados pelo valor efectivamente pago e atendendo
às suas características e intenção aquando da aquisição, classificados nas seguintes categorias:
a) Títulos para negociação;
b) Títulos disponíveis para venda;
c) Títulos mantidos até ao vencimento.
Na categoria “títulos para negociação” são registados aqueles adquiridos com o propósito de serem activa e
frequentemente negociados.
31
2010
RELATÓRIO E CONTAS MILLENNIUM ANGOLA
NOTAS ÀS DEMONSTRAÇÕES FINANCEIRAS
Na categoria “títulos disponíveis para venda” são registados aqueles com o propósito de serem eventualmente
negociados e, por consequência, não se enquadram nas demais categorias.
Na categoria “títulos mantidos até ao vencimento” são registados os títulos e valores mobiliários para os quais
haja intenção e capacidade financeira do Banco mantê-los em carteira até ao vencimento. Essa capacidade
financeira é comprovada com base em projecção de fluxo de caixa, não considerando a possibilidade de venda
dos títulos antes do vencimento.
Os rendimentos produzidos pelos títulos e valores mobiliários, relativos a juros auferidos pela fluência do
prazo até ao vencimento ou dividendos declarados, são considerados directamente no resultado do período,
independentemente da categoria em que tenham sido classificados, observado que os relativos às acções
adquiridas há menos de seis meses são reconhecidos em contrapartida da conta que regista o correspondente
custo de aquisição.
Os títulos e valores mobiliários classificados nas categorias de “títulos para negociação” e “disponíveis para venda”
são ajustados pelo valor de mercado, considerando-se a valorização ou a desvalorização em contrapartida:
a) Da conta de proveitos ou custos, no resultado do período, quando referente aos títulos classificados na
categoria “títulos para negociação”;
b) Da conta de fundos próprios, quando referente aos títulos classificados na categoria “títulos disponíveis para
venda”, pelo valor líquido dos efeitos tributários, devendo ser transferidos para o resultado do período somente
aquando da venda definitiva.
Para fins do ajuste do valor de mercado dos títulos, a metodologia do seu apuramento segue o critério do preço
definido pelo Banco Nacional de Angola.
As perdas de carácter permanente em títulos e valores mobiliários são reconhecidas imediatamente no resultado
do período, observado que o valor ajustado decorrente do reconhecimento
das referidas perdas passa a constituir a nova base de valor para efeito
de apropriação de rendimentos. Essas perdas não são revertidas em
exercícios posteriores.
Os Títulos do Banco Central e os Bilhetes do Tesouro são
emitidos a desconto e registados pelo seu valor de reembolso
(valor nominal). A diferença entre este e o custo de aquisição é
reflectida na rubrica de passivo “Receitas com proveito diferido”,
ao longo do período compreendido entre a data de compra e
a data de vencimento dos títulos.
As Obrigações doTesouro adquiridas a desconto são registadas
pelo valor de reembolso (valor nominal), sendo a diferença para
o custo de aquisição reconhecida contabilisticamente como
proveito a diferir entre a data de aquisição e a data de vencimento
dos títulos.
Os juros decorridos relativos a estes títulos são contabilizados como
proveitos a receber.
As Obrigações do Tesouro emitidas em moeda nacional encontram-se indexadas à
taxa de câmbio do dólar dos Estados Unidos e, consequentemente, estão sujeitas a
actualização cambial. Deste modo, o resultado da actualização cambial do valor nominal do título, do desconto
e do juro corrido é reflectido na demonstração dos resultados do exercício em que ocorre.
32
2010
RELATÓRIO E CONTAS MILLENNIUM ANGOLA
NOTAS ÀS DEMONSTRAÇÕES FINANCEIRAS
3.2.4. Provisões para risco de crédito
O regime descrito encontra-se em vigor desde Março de 2008, em consequência do Aviso
n.º 9/2007 de 12 de Setembro. Com o Aviso n.º 4/2009 de 18 de Junho, o BNA
introduz uma alteração ao nível da classificação por arrastamento (art. 3),
restringindo o seu âmbito a critérios objectivos.
Deste modo, a metodologia de apuramento das provisões para crédito
concedido a clientes, genericamente, mantém-se face ao exercício
anterior e encontra-se descrita abaixo.
Provisões para crédito e juros
Nos termos do Aviso n.º 4/2009, o Banco classifica as operações
de crédito por ordem crescente de risco, de acordo com as
seguintes classes:
Nível A: Risco nulo
Nível B: Risco muito reduzido
Nível C: Risco reduzido
Nível D: Risco moderado
Nível E: Risco elevado
Nível F: Risco muito elevado
Nível G: Risco de perda
A classificação de cada operação de crédito é revista, no mínimo, anualmente, através de uma reaferição/avaliação
dos critérios que determinaram a sua classificação inicial: perfil económico e padrão comportamental do
proponente/Cliente, e eventuais garantias associadas, bem como o seu tipo, qualidade e montante de cobertura.
A classificação de todos os créditos da carteira, ou daqueles cujos devedores actuem em determinado sector da
actividade económica ou área geográfica, é revista sempre que a Comissão Executiva entende que existe risco
de alterações significativas na conjuntura económica afectarem o risco das suas operações.
Sem prejuízo da revisão descrita no artigo 4.° do referido Aviso, a instituição financeira deve rever mensalmente
a classificação de cada crédito em função do atraso verificado no pagamento de parcela do principal ou dos
encargos, observando-se que a classificação das operações de crédito a um mesmo Cliente, para efeitos de
constituição de provisões, é efectuada na classe que apresentar maior risco.
O crédito é classificado nos níveis de risco em função do tempo decorrido desde a data de entrada das operações
em incumprimento, de acordo com o Aviso n.º 4/2009, que prevê como níveis mínimos os seguintes:
Níveis de risco
% de provisão
Tempo decorrido desde a entrada
em incumprimento
A
B
C
D
E
0%
até 15 dias
1%
de 15
a 30 dias
3%
de 1
a 2 meses
10%
de 2
a 3 meses
20%
de 3
a 5 meses
F
50%
100%
de 5
mais
a 6 meses de 6 meses
3.2.5. Imobilizações financeiras
As participações são mantidas ao custo de aquisição objecto de reavaliação cambial, quando denominadas em
moeda estrangeira.
3.2.6. Imobilizações corpóreas
As imobilizações corpóreas são registadas ao custo de aquisição. Neste estão incluídos os custos acessórios
indispensáveis, ainda que anteriores à escritura, tais como emolumentos notariais, corretagens, impostos pagos
na aquisição e outros.
33
G
2010
RELATÓRIO E CONTAS MILLENNIUM ANGOLA
NOTAS ÀS DEMONSTRAÇÕES FINANCEIRAS
A depreciação do imobilizado é calculada pelo método das quotas constantes às taxas máximas fiscalmente
aceites como custo, de acordo com o Código do Imposto Industrial, que correspondem aos seguintes anos de
vida útil estimada:
Descrição
Anos de vida útil
Imóveis de serviço próprio (Edifícios)
Obras em edifícios arrendados
Equipamento:
Mobiliário e material
Equipamento informático
Instalações interiores
Material de transporte
Máquinas e ferramentas
50
(*)
10
3
10
3
6e7
(*) O Banco amortiza as despesas com obras em edifícios arrendados em função dos respectivos contratos de arrendamento.
3.2.7. Imobilizações incorpóreas
São registados como imobilizações incorpóreas os custos de aquisição e desenvolvimento de software, utilizados
em processamento de dados, os gastos inerentes à constituição, organização, reestruturação, expansão e/ou
modernização do Banco, o goodwill pago na aquisição, as benfeitorias em imóveis de terceiros e os produtos em
desenvolvimento classificáveis como activos. As imobilizações incorpóreas registam-se pelo custo de aquisição e
são amortizadas linearmente ao longo de um período de três anos.
Os gastos incorridos na fase da pesquisa para o desenvolvimento de novos produtos não são reconhecidos
como activos intangíveis, mas directamente como custos em resultados.
3.2.8. Impostos sobre lucros
O BMA encontra-se sujeito a tributação em sede de Imposto Industrial, sendo considerado fiscalmente um
contribuinte do Grupo A. A tributação dos seus rendimentos é efectuada nos termos dos números 1 e 2 do
Artigo 72.º, da Lei n.º 18/92, de 3 de Julho, sendo a taxa de imposto aplicável de 35%, na sequência da Lei n.º 5/99,
de 6 de Agosto.
Os impostos sobre lucros compreendem os impostos correntes e os impostos diferidos. Os impostos sobre
lucros são reconhecidos em resultados, excepto quando estão relacionados com itens que são reconhecidos
directamente nos capitais próprios, caso em que são também registados por contrapartida dos capitais próprios.
Os impostos correntes são os que se esperam que sejam pagos com base na matéria colectável apurada de
acordo com as regras fiscais em vigor e utilizando a taxa de imposto acima referida.
Os impostos diferidos activos e passivos são registados quando existe uma diferença temporária entre o valor
de um activo ou passivo e a sua base de tributação. O seu valor corresponde ao valor do imposto a recuperar
ou pagar em períodos futuros. Os impostos diferidos activos e passivos são calculados com base nas taxas fiscais
em vigor para o período em que se prevê que seja realizado o respectivo activo ou passivo.
3.2.9. Redução no valor recuperável de activos (Imparidade)
O Banco avalia os seus activos periodicamente, tendo em vista a identificação de activos que apresentem o valor
recuperável inferior ao valor contabilístico. O reconhecimento da redução no valor contabilístico (imparidade)
de um activo acontece sempre que o seu valor contabilístico exceder o valor recuperável.
Na avaliação do indício de imparidade, o Banco tem em conta os seguintes indicadores:
a) Declínio significativo no valor de um activo, maior do que o esperado no seu uso normal;
b) Mudanças significativas no ambiente tecnológico, económico ou legal, com efeitos adversos sobre o Banco;
c) Aumento nas taxas de juros ou outras taxas de mercado, com efeitos sobre as taxas de desconto e
consequente redução no valor presente ou no valor recuperável dos activos;
d) Valor contabilístico de activos líquidos maior do que o valor de mercado;
34
2010
RELATÓRIO E CONTAS MILLENNIUM ANGOLA
NOTAS ÀS DEMONSTRAÇÕES FINANCEIRAS
e) Evidência disponível de obsolescência ou perda de capacidade física de um activo;
f) Mudanças significativas na forma de utilização do activo, como descontinuidade ou reestruturação, com efeitos
adversos para o Banco; e
g) Indicação que o desempenho económico do activo será pior do que o esperado.
3.2.10. Provisões e contingências
São reconhecidas provisões quando i) o Banco tem uma obrigação presente, legal ou construtiva, ii) seja provável
que o seu pagamento venha a ser exigido e iii) quando possa ser feita uma estimativa fiável do valor dessa
obrigação.Ver Nota 14.
3.2.11.Actualização monetária
As demonstrações financeiras consideraram os efeitos da modificação no poder de compra da moeda nacional,
com base no Índice de Preços ao Consumidor (IPC), divulgado pelo Instituto Nacional de Estatística (INE), em
caso de variação superior (inflação) a 100% nos últimos 3 (três) anos, mediante a correcção do valor contabilístico
das contas de Imobilizações e dos Fundos Próprios.
3.2.12. Principais estimativas e incertezas associadas à aplicação das políticas contabilísticas
As contas do Banco integram estimativas realizadas em condições de incerteza, contudo, não foram criadas
reservas ocultas ou provisões excessivas ou, ainda, uma quantificação inadequada de activos e proveitos ou de
passivos e custos.
O princípio da prudência impõe a escolha da hipótese que resulte em menor património líquido, quando se
apresentarem opções igualmente válidas diante dos demais princípios contabilísticos. Determina a adopção do
menor valor para os componentes do activo e maior para os do passivo, sempre que se apresentarem alternativas
igualmente válidas para a quantificação das mutações patrimoniais que alterem o património líquido.
Na elaboração das demonstrações financeiras o Banco efectuou estimativas e utilizou pressupostos que afectam
as quantias relatadas dos activos e passivos. Estas estimativas e pressupostos são apreciados regularmente e
baseiam-se em diversos factores incluindo expectativas acerca de eventos futuros que se consideram razoáveis
nas circunstâncias.
Utilizaram-se estimativas e pressupostos, nomeadamente nas áreas significativas de Provisões para crédito
concedido e Outras provisões e Impostos correntes e diferidos.
4. DISPONIBILIDADES
Em 31 de Dezembro de 2010 e 2009, esta rubrica tem a seguinte composição:
Milhares de AOA
VALORES EM TESOURARIA
Valores em tesouraria em Moeda Nacional (MN)
Valores em tesouraria em Moeda Estrangeira (ME)
VALORES EM TRÂNSITO
Valores em trânsito em Moeda Nacional (MN)
Valores em trânsito em Moeda Estrangeira (ME)
DISPONIBILIDADES NO BANCO CENTRAL
Depósitos à ordem em Moeda Nacional (MN)
Depósitos à ordem em Moeda Estrangeira (ME)
DISPONIBILIDADES EM INSTITUIÇÕES FINANCEIRAS
DISPONIBILIDADES
35
‘10
‘09
5.547.492
1.883.125
3.664.367
140.029
121.500
18.529
16.245.211
10.367.013
5.878.198
534.410
22.467.141
3.821.013
926.656
2.894.357
274.447
167.549
106.898
12.036.228
12.036.228
143.614
16.275.302
2010
RELATÓRIO E CONTAS MILLENNIUM ANGOLA
NOTAS ÀS DEMONSTRAÇÕES FINANCEIRAS
Os depósitos à ordem no BNA visam cumprir as disposições em vigor de manutenção de reservas obrigatórias
e não são remunerados.
Desde 1 de Setembro de 2007, com a entrada em vigor do Instrutivo n.º 04/2007, de 30 de Agosto, do BNA, as
reservas obrigatórias deixaram de ser realizáveis através da detenção de Títulos do Banco Central ou de Títulos
de Dívida Pública (percentagem de 15% até 31 de Agosto de 2007).
Durante o ano de 2009 e de modo a fazer face aos desenvolvimentos da conjuntura macroeconómica e à
protecção dos interesses dos depositantes, o BNA revogou o referido Instrutivo, pelos seguintes:
Instrutivo n.º 1/2009 de 25 de Fevereiro (revoga Instrutivo n.º 04/2007);
Instrutivo n.º 3/2009 de 10 de Abril (revoga o Instrutivo n.º 1/2009);
Instrutivo n.º 8/2009 de 21 de Maio (revoga o Instrutivo n.º 3/2009).
Em 4 de Junho de 2010, entrou em vigor o instrutivo n.º 03/2010 do BNA, que veio estabelecer que as reservas
obrigatórias passam a ser constituídas em duas moedas – AOA para as contas em AOA que constituem a base
de incidência e USD para as contas em moeda estrangeira que constituem a base de incidência.
O instrutivo define ainda que as reservas a constituir em moeda nacional são de 25%, exceptuando os depósitos
do Governo local, em que se aplica uma taxa de 50%, e do Governo Central, em que se aplica uma taxa de 100%.
As reservas em moeda estrangeira são de 15%, exceptuando os depósitos do Governo Local, em que se aplica
uma taxa de 0%, e do Governo Central, em que se aplica uma taxa de 100%.
Podem ainda ser utilizados para o cumprimento das reservas obrigatórias os activos representativos do valor dos
desembolsos de créditos em moeda nacional e estrangeira que vierem a ser concedidos, no âmbito dos
programas específicos dos sectores da Agricultura, Indústria e Habitação, até ao limite de 5% da base de incidência.
5.APLICAÇÕES DE LIQUIDEZ
Em 31 de Dezembro de 2010 e 2009, esta rubrica corresponde a aplicações junto de instituições de crédito e
tem a seguinte composição:
Milhares de AOA
OPERAÇÕES NO MERCADO MONETÁRIO INTERFINANCEIRO
Aplicações em instituições de crédito nacionais
Aplicações em instituições de crédito no estrangeiro
OURO
APLICAÇÕES DE LIQUIDEZ
‘10
‘09
4.216.237
3.958.573
257.664
2.243
4.218.480
4.166.594
4.166.594
2.223
4.168.817
6.TÍTULOS E VALORES MOBILIÁRIOS
Em 31 de Dezembro de 2010 e 2009, esta rubrica apresenta a seguinte composição:
Milhares de AOA
‘10
Bilhetes do Tesouro
Títulos do Banco Central
Obrigações do Tesouro
TOTAL
TÍTULOS EVALORES MOBILIÁRIOS
‘09
MN
ME
MN
ME
7.252.196
8.562.526
7.939.733
23.754.455
5.511.814
5.511.814
29.266.269
4.713.812
4.273.405
7.272.601
16.259.818
10.587.224
10.587.224
26.847.042
No fim do exercício de 2010, os títulos na carteira disponíveis para venda foram emitidos na totalidade pelo BNA
ou peloTesouro angolano (tal como em 2009) e apresentavam a seguinte estrutura, de acordo com os respectivos
prazos de vencimento:
36
2010
RELATÓRIO E CONTAS MILLENNIUM ANGOLA
NOTAS ÀS DEMONSTRAÇÕES FINANCEIRAS
‘10
Até 3 meses
De 3 a 6 meses
De 6 meses a 1 ano
Mais de 1 ano
3.870.169
7.429.055
8.920.624
9.046.421
29.266.269
A carteira de títulos do BMA estava classificada a 31 de Dezembro de 2009 na categoria de títulos mantidos para
negociação, tendo em 2010 a carteira sido reclassificada para a categoria de títulos disponíveis para venda, não
resultando desta reclassificação qualquer impacto em termos de resultados.
A reclassificação resultou do facto de o BMA não negociar habitualmente com a sua carteira de títulos, e em
substância estes não serem efectivamente títulos de negociação.
Em 31 de Dezembro de 2010, a carteira de títulos em AOA apresenta a seguinte composição, por indexador e taxa:
Milhares de AOA
ISIN
Descrição
AOTNOC215U09
AOTNIC224U09
AOTNIC209LA9
AOTNIC222L09
OT ANGOLA 3 PCT
OT ANGOLA 3 PCT
OT ANGOLA 3 PCT
OT ANGOLA 3 PCT
AOTNOL048A09
AOTNTX417U09
AOTNTX324D10
AOTNTX424D10
AOTNTX524D10
AOTNOIC40210
AOTNON0302A8
AOTNON0303A8
AOTNON030408
AOTNON030508
AOTNOTN04NV5
AOTNOTN04NV7
AOTNON04AC08
AOTNOTN04NV9
AOTNON04AC10
AOTNON0402A8
AOTNON0403A8
AOTNON040408
AOTNON040508
AOTNOTN05NV5
AOTNOTN05NV7
AOTNON05AC08
AOTNOTN05NV9
AOTNON05AC10
AOTNON0502A8
AOTNON0503A8
AOTNON050408
AOTNON050508
AOTNOTN06NV5
AOTNOTN06NV7
AOTNON06AC08
AOTNOTN06NV9
AOTNON06AC10
AOTNON0602A8
OT ANGOLA 08/08.04.2013
OTMN ANGOLA 09/17.06.2013
OTMN ANGOLA 10/24.12.2013
OTMN ANGOLA 10/24.12.2014
OTMN ANGOLA 10/24.12.2015
OTMN ANGOLA 10/15.02.2014 A
OTNOVA VIDA ANGOLA 08/15.02.2011
OTNOVA VIDA ANGOLA 07/15.03.2011
OTNOVA VIDA ANGOLA 08/15.04.2011
OTNOVA VIDA ANGOLA 07/15.05.2011
OTNOVA VIDA ANGOLA 07/15.06.2011
OTNOVA VIDA ANGOLA 07/15.08.2011
OTNOVA VIDA ANGOLA 07/15.09.2011
OTNOVA VIDA ANGOLA 07/15.10.2011
OTNOVA VIDA ANGOLA 07/15.11.2011
OTNOVA VIDA ANGOLA 08/15.02.2012
OTNOVA VIDA ANGOLA 07/15.03.2012
OTNOVA VIDA ANGOLA 08/15.04.2012
OTNOVA VIDA ANGOLA 07/15.05.2012
OTNOVA VIDA ANGOLA 07/15.06.2012
OTNOVA VIDA ANGOLA 07/15.08.2012
OTNOVA VIDA ANGOLA 07/15.09.2012
OTNOVA VIDA ANGOLA 07/15.10.2012
OTNOVA VIDA ANGOLA 07/15.11.2012
OTNOVA VIDA ANGOLA 08/15.02.2013
OTNOVA VIDA ANGOLA 07/15.03.2013
OTNOVA VIDA ANGOLA 08/15.04.2013
OTNOVA VIDA ANGOLA 07/15.05.2013
OTNOVA VIDA ANGOLA 07/15.06.2013
OTNOVA VIDA ANGOLA 07/15.08.2013
OTNOVA VIDA ANGOLA 07/15.09.2013
OTNOVA VIDA ANGOLA 07/15.10.2013
OTNOVA VIDA ANGOLA 07/15.11.2013
OTNOVA VIDA ANGOLA 08/15.02.2014
09/15.06.2011
09/15.06.2011
09/15.06.2011
09/15.07.2011
Indexador
Montante nominal
Taxa
IPC
IPC
IPC
IPC
1.241.680,60
1.225.290,42
1.219.082,01
567.735,47
4.253.788,50
609.795,32
10.661,57
1.338.490,29
803.094,17
535.396,12
176.031,75
2.665,39
2.665,39
2.665,39
2.665,39
2.665,39
2.665,39
2.665,39
2.665,39
2.665,39
2.665,39
2.665,39
2.665,39
2.665,39
2.665,39
2.665,39
2.665,39
2.665,39
2.665,39
2.665,39
2.665,39
2.665,39
2.665,39
2.665,39
2.665,39
2.665,39
2.665,39
2.665,39
2.665,39
4,2819
4,2819
4,2819
18,4755
USD
USD
USD
USD
USD
USD
USD
USD
USD
USD
USD
USD
USD
USD
USD
USD
USD
USD
USD
USD
USD
USD
USD
USD
USD
USD
USD
USD
USD
USD
USD
USD
USD
USD
5,4631
6,4563
7,0000
7,0000
7,0000
4,0000
2,5941
2,4872
2,4550
2,4428
2,4563
2,5941
2,4872
2,4550
2,4428
2,5941
2,4872
2,4550
2,4428
2,4563
2,5941
2,4872
2,4550
2,4428
2,5941
2,4872
2,4550
2,4428
2,4563
2,5941
2,4872
2,4550
2,4428
2,5941
continua
37
2010
RELATÓRIO E CONTAS MILLENNIUM ANGOLA
NOTAS ÀS DEMONSTRAÇÕES FINANCEIRAS
Milhares de AOA
continuação
ISIN
Descrição
AOTNON0603A8
AOTNON060408
AOTNON060508
AOTNOTN07NV5
AOTNOTN07NV7
AOTNON07AC08
AOTNOTN07NV9
AOTNON07AC10
AOTNON0702A8
AOTNON0703A8
AOTNON070408
AOTNON070508
AOTNON04AC02
AOTNOTN04NV2
AOTNOTN04NV3
AOTNOTN04NV4
AOTNOTN04NV6
AOTNON05AC02
AOTNOTN05NV2
AOTNOTN05NV3
AOTNOTN05NV4
AOTNOTN05NV6
AOTNON06AC02
AOTNOTN06NV2
AOTNOTN06NV3
AOTNOTN06NV4
AOTNOTN06NV6
AOTNON07AC02
AOTNOTN07NV2
AOTNOTN07NV3
AOTNOTN07NV4
AOTNOTN07NV6
OTNOVA VIDA ANGOLA 07/15.03.2014
OTNOVA VIDA ANGOLA 08/15.04.2014
OTNOVA VIDA ANGOLA 07/15.05.2014
OTNOVA VIDA ANGOLA 07/15.06.2014
OTNOVA VIDA ANGOLA 07/15.08.2014
OTNOVA VIDA ANGOLA 07/15.09.2014
OTNOVA VIDA ANGOLA 07/15.10.2014
OTNOVA VIDA ANGOLA 07/15.11.2014
OTNOVA VIDA ANGOLA 08/15.02.2015
OTNOVA VIDA ANGOLA 07/15.03.2015
OTNOVA VIDA ANGOLA 08/15.04.2015
OTNOVA VIDA ANGOLA 07/15.05.2015
OTNOVA VIDA ANGOLA 07/15.02.2011
OTNOVA VIDA ANGOLA 08/15.03.2011
OTNOVA VIDA ANGOLA 07/15.04.2011
OTNOVA VIDA ANGOLA 08/15.05.2011
OTNV ANGOLA 07/15.07.2011
OTNOVA VIDA ANGOLA 07/15.02.2012
OTNOVA VIDA ANGOLA 08/15.03.2012
OTNOVA VIDA ANGOLA 07/15.04.2012
OTNOVA VIDA ANGOLA 08/15.05.2012
OTNV ANGOLA 07/15.07.2012
OTNOVA VIDA ANGOLA 07/15.02.2013
OTNOVA VIDA ANGOLA 08/15.03.2013
OTNOVA VIDA ANGOLA 07/15.04.2013
OTNOVA VIDA ANGOLA 08/15.05.2013
OTNV ANGOLA 07/15.07.2013
OTNOVA VIDA ANGOLA 07/15.02.2014
OTNOVA VIDA ANGOLA 08/15.03.2014
OTNOVA VIDA ANGOLA 07/15.04.2014
OTNOVA VIDA ANGOLA 08/15.05.2014
OTNV ANGOLA 07/15.07.2014
AOTNBT425N10
AOTNBT518N10
AOTNBT610N10
AOTNBT618N10
AOTNBT609D10
AOBCTB507L10
AOBCTB624F10
AOBCTB603M10
AOBCTB617M10
AOBCTB612I10
AOBCTB616U10
AOBCTB601S10
AOBCTB615S10
BT ANGOLA 10/24.02.2011
BT ANGOLA 10/19.05.2011
BT ANGOLA 10/09.11.2011
BT ANGOLA 10/17.11.2011
BT ANGOLA 10/08.12.2011
TBC ANGOLA 10/05.01.2011
TBC ANGOLA 10/23.02.2011
TBC ANGOLA 10/02.03.2011
TBC ANGOLA 10/16.03.2011
TBC ANGOLA 10/11.05.2011
TBC ANGOLA 10/15.06.2011
TBC ANGOLA 10/31.08.2011
TBC ANGOLA 10/14.09.2011
38
Indexador
Montante nominal
Taxa
USD
USD
USD
USD
USD
USD
USD
USD
USD
USD
USD
USD
USD
USD
USD
USD
USD
USD
USD
USD
USD
USD
USD
USD
USD
USD
USD
USD
USD
USD
USD
USD
2.665,39
2.665,39
2.665,39
2.665,39
2.665,39
2.665,39
2.665,39
2.665,39
2.665,39
2.665,39
2.665,39
2.665,39
5.214,90
2.665,39
2.665,39
2.665,39
2.665,39
5.214,90
2.665,39
2.665,39
2.665,39
2.665,39
5.214,90
2.665,39
2.665,39
2.665,39
2.665,39
5.214,90
2.665,39
2.665,39
2.665,39
2.665,39
3.643.590,76
162.448,00
2.119.600,00
569.800,00
2.849.000,00
2.276.000,00
250,00
1.091.000,00
546.000,00
2.181.216,00
1.240.000,00
605.000,00
1.210.000,00
2.418.731,00
17.269.045,00
25.166.424,26
2,4872
2,4550
2,4428
2,4563
2,5941
2,4872
2,4550
2,4428
2,5941
2,4872
2,4550
2,4428
2,5941
2,4872
2,4550
2,4428
2,7331
2,5941
2,4872
2,4550
2,4428
2,7331
2,5941
2,4872
2,4550
2,4428
2,7331
2,5941
2,4872
2,4550
2,4428
2,7331
11,2286
11,8818
13,7964
13,7428
13,5344
15,7936
17,9197
17,9224
17,9224
23,6207
20,7012
20,7065
20,7065
2010
RELATÓRIO E CONTAS MILLENNIUM ANGOLA
NOTAS ÀS DEMONSTRAÇÕES FINANCEIRAS
Em 31 de Dezembro de 2010, a carteira de títulos em USD apresenta a seguinte composição, sem indexador e
com a taxa seguinte:
Milhares de USD
ISIN
Descrição
Indexador
AOTNOTR05RN0
AOTNOTR05RN1
AOTNOTT06OT7
AOTNOTT06OT6
AOTNOTC08OC1
AOTNOTC09OC1
AOTNOTC10OC1
AOTNOC110408
AOTNOTP09OP1
AOTNOTP09OP2
AOTNOTP10OP1
AOTNOTP10OP2
AOTNOTP11OP1
AOTNOTP11OP2
AOTNOTP12OP1
AOTNOTP12OP2
AOTNOTP08OP1
ANGOLA GOVT 07/15.11.2012
ANGOLA GOVT 07/15.11.2012
OT ANGOLA 05/15.05.2012
OT ANGOLA 05/15.11.2011
OT ANGOLA 07/15.07.2015
OT ANGOLA 07/15.10.2015
OT ANGOLA 08/15.01.2018
OT ANGOLA 08/15.04.2019
OT ANGOLA 07/15.05.2016
OT ANGOLA 07/15.06.2016
OT ANGOLA 07/15.07.2017
OT ANGOLA 07/15.08.2017
OT ANGOLA 07/15.09.2018
OT ANGOLA 07/15.10.2018
OT ANGOLA 07/15.11.2019
OT ANGOLA 07/15.12.2019
OT ANGOLA 07/15.04.2015
Montante nominal
Taxa
40.000,00
10.000,00
400,00
600,00
1.320,00
1.320,00
1.310,00
1.310,00
300,00
300,00
300,00
300,00
300,00
300,00
300,00
300,00
600,00
3,6928
3,6928
4,9828
4,9428
3,4831
3,2050
3,4831
3,2050
3,6428
3,6563
3,9331
3,7941
3,6872
3,6550
3,6428
3,6563
3,6550
59.260,00
A política de investimento em títulos e valores mobiliários adoptada pelo BMA encontra-se adequada à realidade
do mercado angolano, com enfoque em títulos de dívida pública e do Banco Central, utilizando critérios centrados
na rentabilidade, mantendo um rigoroso controlo de riscos, nomeadamente os riscos de liquidez e de mercado.
7. CRÉDITOS
Em 31 de Dezembro de 2010 e 2009, esta rubrica tem a seguinte composição:
Milhares de AOA
‘10
DESCOBERTO
Empresas
Particulares
CRÉDITO
Empresas
Particulares
CARTÃO
Empresas
Particulares
TOTAL
CRÉDITO A CLIENTES BRUTO (MN+ME)
PROVISÃO PARA CRÉDITO
CRÉDITO A CLIENTES LÍQUIDO (MN+ME)
‘09
MN
ME
MN
ME
2.814.586
152.100
2.966.686
334.385
27.475
361.860
1.620.896
108.882
1.729.778
1.669.385
14.723
1.684.108
3.220.146
2.508.838
5.728.984
39.818.177
7.348.923
47.167.100
631.982
89.713
721.695
29.937.499
6.503.005
36.440.504
108.886
237.454
346.340
9.042.010
0
47.528.960
56.570.970
-2.780.078
53.790.892
32.512
122.853
155.365
2.606.838
0
38.124.612
40.731.450
-1.253.917
39.477.533
39
2010
RELATÓRIO E CONTAS MILLENNIUM ANGOLA
NOTAS ÀS DEMONSTRAÇÕES FINANCEIRAS
Em 31 de Dezembro de 2010, o capital vincendo em carteira apresentava a seguinte estrutura, de acordo com
os seus vencimentos e sector de actividade:
Milhares de AOA
Sector de actividade
Construção
Outras Actividades de Serviços Colectivos,
Sociais e Pessoais
Crédito ao Consumo
Comércio a Retalho
Indústrias Transformadoras
Comércio por Grosso
Outras
Até 6 meses
De 6 a 12 meses
De 1 a 5 anos
Mais de 5 anos
Total
6.307.401
1.344.979
4.815.448
459.470
12.927.298
5.967.857
911.808
3.698.333
1.383.946
2.635.789
2.890.046
23.795.180
2.093.028
1.724.488
291.496
52.702
116.405
453.424
6.076.521
2.717.578
4.913.233
1.231.477
3.143.139
1.213.668
2.913.931
20.948.474
177.566
1.140.667
1.086.425
0
45.547
1.358.202
4.267.877
10.956.029
8.690.196
6.307.731
4.579.787
4.011.409
7.615.603
55.088.052
Relativamente ao risco de crédito, em 31 de Dezembro de 2010, a carteira do Banco apresenta a seguinte
distribuição:
Milhares de AOA
Grau de risco
Crédito vivo
Crédito vencido
Juros
Total
% provisão
Provisões
A
180.454
0
107
180.561
0%
-
B
26.768.284
3.084
36.883
26.859.079
1%
262.591
C
25.462.163
136.122
75.537
25.718.822
3%
762.711
D
375.884
58.090
8.579
452.553
10%
43.255
E
1.140.035
397.552
42.179
1.579.766
20%
305.953
F
578.919
89.434
18.892
687.245
50%
337.622
G
582.314
418.887
75.745
1.092.945
100%
1.067.945
55.088.052
1.103.169
257.922
56.570.970
2.780.078
A 31 de Dezembro de 2010 a Carteira de Crédito apresentava as seguintes taxas médias ponderadas:
Taxas médias
‘10
Descoberto
23%
Crédito
11%
Cartão
35%
Ao longo do exercício de 2010 foram abatidos ao activo créditos no montante total de 86.367 milhares de
AOA, que se encontravam totalmente cobertos por provisões para crédito.
O valor da provisão para créditos de cobrança duvidosa constituída e utilizada durante o exercício encontram-se na Nota 14.
40
2010
RELATÓRIO E CONTAS MILLENNIUM ANGOLA
NOTAS ÀS DEMONSTRAÇÕES FINANCEIRAS
A 31 de Dezembro 2010, a carteira de crédito, apresentava a seguinte distribuição, por província:
GRELHA DE CRÉDITO POR MUNICÍPIO
Milhares de AOA
Código
Descrição
0500
1000
1500
2000
2525
3000
3500
4000
4500
5000
5500
6000
6500
7500
8000
8500
9000
Bengo
Benguela
Bié
Cabinda
Cuito
Cunene
Huambo
Huila
Kwanza Norte
Kwanza Sul
Luanda
Malanje
Namibe
Luanda Norte
Luanda Sul
Uíge
Zaire
Montante
379.382,47
4.960.068,29
497.927,80
237.859,46
1.386,65
9.366,43
748.157,72
192.037,03
2.339,33
65.359,92
49.256.388,83
5.578,88
29.631,85
1.354,19
6.645,76
4.783,91
172.701,96
56.570.970,47
8. IMOBILIZAÇÕES FINANCEIRAS
Em 31 de Dezembro de 2010 e 2009, esta rubrica pode ser detalhada como segue:
Milhares de AOA
Banco Privado do Atlântico (BPA)
Bolsa Valores e Derivados Angola
EMIS
Academia Millennium Atlântico
Outras Imobilizações Financeiras
‘10
‘09
1.977.206
27.793
50.070
13.695
10.064
2.078.828
1.907.950
26.820
38.662
0
8.943
1.982.375
A participação de 10% no BPA foi adquirida durante o exercício de 2009, pelo montante de 21.342 milhares de
dólares dos Estados Unidos.
Durante 2010, o BMA acompanhou o aumento de capital da EMIS, tendo subscrito 108 milhares de dólares dos
Estados Unidos no referido aumento de capital.
Ainda durante o ano de 2010, o BMA foi um dos sócios fundadores da Academia Millennium Atlântico, onde
detém uma participação de 33%, juntamente com a Sonangol, BPA e accionistas particulares. O objectivo da
Academia é dar formação de alta qualidade aos quadros das empresas accionistas, contribuindo assim para a
formação de quadros angolanos, altamente qualificados. Esta participação é mantida ao custo de aquisição, dada
a sua imaterialidade e pelo facto de ainda não dispor de contas encerradas relativas ao exercício de 2010.
41
2010
RELATÓRIO E CONTAS MILLENNIUM ANGOLA
NOTAS ÀS DEMONSTRAÇÕES FINANCEIRAS
9. IMOBILIZAÇÕES INCORPÓREAS, CORPÓREAS E EM CURSO
Derivado da entrada em vigor do novo Plano de Contas das Instituições Financeiras – CONTIF, verificaram-se
algumas alterações em termos de classificação do imobilizado.
As alterações mais relevantes prendem-se com a transferência de obras em imóveis arrendados, de imobilizado
corpóreo para imobilizado incorpóreo e com o facto de terem deixado de existir imobilizações em curso de
imobilizado incorpóreo.
Resultante das alterações introduzidas pelo CONTIF, houve necessidade de reclassificar os activos referentes a
obras em imóveis arrendados, no montante líquido de 1.816 milhares de kwanzas em 2010, de imobilizado
corpóreo para imobilizado incorpóreo e transferir o imobilizado incorpóreo em curso para imobilizado
incorpóreo firme, no montante de 377 milhões de kwanzas em 2010.
Durante o ano de 2010, o movimento do imobilizado corpóreo, incorpóreo e em curso foi o evidenciado no
seguinte quadro:
Milhares de AOA
‘09
Adições
Abates/
regulariz.
Transfer.
‘10
Amort.
acumuladas
Valor líq.
‘10
TOTAL IMOBILIZADO INCORPÓREO
Trespasses
Custos plurianuais
Sist. tratam. automático dados
Obras imov. arrend.
Adiant. p/ conta imob.
Outros
TOTAL IMOBILIZADO CORPÓREO
Imob. corp. edifícios e terrenos
Imóveis grandes rep. e ben.
Equip. mobiliário e material
Máquinas e ferramentas
Equip. informático
Material transporte
Outros
TOTAL IMOBILIZADO EM CURSO
Imob. curso – Imob. incorp.
Imob. curso – Imov. serv. próp.
Outros
2.568.646
93.372
118.212
326.779
1.566.453
393.082
70.748
2.615.433
317.278
1.029.022
176.768
335.796
204.126
240.004
312.439
1.299.474
0
1.108.101
191.373
1.723.461
332.796
162.889
115.327
522.681
589.768
0
1.826.856
491.754
519.951
103.265
79.411
194.125
168.319
270.031
1.077.173
16.253
533.396
527.524
-366.612
0
0
0
-39.930
-326.682
0
-122.160
0
0
0
-98.536
0
-23.392
-232
-5.083
0
-5.083
0
-1.994
0
0
13.813
263.382
-281.629
2.440
743.791
96.300
615.032
-4.277
0
28.699
0
8.037
-741.797
-16.253
-344.432
-381.112
3.923.501
426.168
281.101
455.919
2.312.586
374.539
70.748
5.063.920
905.332
2.164.005
275.756
316.671
426.950
384.931
590.275
1.629.767
0
1.291.982
337.785
789.458
0
89.428
145.767
496.677
0
57.586
696.961
22.909
67.714
44.311
135.908
176.654
181.397
68.068
0
0
0
0
3.134.043
426.168
191.673
310.152
1.815.909
374.539
15.602
4.366.959
882.423
2.096.291
231.445
180.763
250.296
203.534
522.207
1.629.767
0
1.291.982
337.785
TOTAL IMOB. CORP. + INCORP.
6.483.553
4.627.490
-493.855
0
10.617.188
1.486.419
9.130.769
42
2010
RELATÓRIO E CONTAS MILLENNIUM ANGOLA
NOTAS ÀS DEMONSTRAÇÕES FINANCEIRAS
Milhares de AOA
TOTAL IMOBILIZADO INCORPÓREO
Trespasses
Custos plurianuais
Sist. tratam. autom. dados
Outros
Obras imov. arrend.
Adiant. p/ conta imobilizações
TOTAL IMOBILIZADO CORPÓREO
Imob. corp. edifícios
Imóveis grandes rep. e ben.
Máquinas e ferramentas
Material transporte
Outros
TOTAL IMOBILIZADO EM CURSO
Imob. curso – imov. serv. próp.
Outros
TOTAL IMOBILIZADO
‘08
Adições
Abates/
regulariz.
Transfer.
‘09
Amort.
acumuladas
Valor líq.
‘09
1.263.143
0
0
13.951
60.838
1.188.354
0
1.385.934
130.748
606.762
83.023
159.477
405.924
414,914
142.583
272.331
3.063.991
1.000.894
93.372
118.212
237.508
0
280.163
271.639
852.158
148.345
123.470
252.773
39.431
288.139
1,567,655
1.295.938
271.717
3.420.706
-1.144
0
0
-1.144
0
0
0
0
0
0
0
0
0
0
0
0
-1.144
305.754
0
0
76.463
9.911
97.937
121.443
377.341
0
298.790
0
41.096
37.455
-683.095
-330.420
-352.675
0
2.568.646
93.372
118.212
326.779
70.748
1.566.453
393.082
2.615.433
279.093
1.029.022
335.796
240.004
731.518
1.299.474
1.108.101
191.373
6.483.554
394.418
0
21.058
16.937
51.473
304.950
0
367.271
12.249
27.556
62.680
128.141
136.645
0
0
0
761.689
2.174.228
93.372
97.154
309.842
19.276
1.261.503
393.082
2.248.163
266.844
1.001.467
273.115
111.863
594.874
1.299.474
1.108.101
191.373
5.721.865
10. OUTRAS RUBRICAS DO ACTIVO
Em 31 de Dezembro de 2010 e 2009, esta rubrica tem a seguinte composição:
Milhares de AOA
CRÉDITOS NO SISTEMA DE PAGAMENTOS
OPERAÇÕES CAMBIAIS
Compra de moeda
Moeda nacional
Moeda estrangeira
Outros
OUTROS VALORES
Despesas com custo diferido
Licenças e manutenções de software
Seguros
Rendas e alugueres
Diversos
Diferenças de caixa
Outros
Outros devedores
OUTRAS RUBRICAS DO ACTIVO
‘10
‘09
11.849
1.457.091
277.679
389.414
504.518
938.252
14.321
383.444
5.970
0
10.555
58.224
238.820
11.529
319.128
59.696
86.252
683.192
1.148.268
2.617.208
5.385
18.917
179.500
8.130
211.932
76.690
59.021
680.798
1.028.440
1.695.533
De referir que o montante referente a Diferenças de caixa encontra-se aprovisionado em mAOA 8.327 e a
rubrica de Outros devedores se encontram aprovisionadas em mAOA 289.266.
43
2010
RELATÓRIO E CONTAS MILLENNIUM ANGOLA
NOTAS ÀS DEMONSTRAÇÕES FINANCEIRAS
11. DEPÓSITOS
Em 31 de Dezembro de 2010 e 2009, a rubrica de depósitos à ordem de clientes tem a seguinte composição:
Milhares de AOA
‘09
‘10
DEPÓSITOS À ORDEM – RESIDENTES
Sector público
Sector privado
DEPÓSITOS À ORDEM – NÃO RESIDENTES
DEPÓSITOS À ORDEM
MN
ME
MN
ME
59.529
18.596.681
18.656.210
54.728
18.710.938
38.643.630
92.714
19.681.398
19.774.112
158.580
19.932.692
88.196
10.096.068
10.184.264
20.006
10.204.271
28.592.484
119.810
18.088.486
18.208.296
179.917
18.388.213
Em 31 de Dezembro de 2010 e 2009, os depósitos a prazo de clientes apresentam a seguinte estrutura, por
moeda e tipo:
Milhares de AOA
‘09
‘10
DEPÓSITOS A PRAZO – RESIDENTES
Sector público
Sector privado
DEPÓSITOS A PRAZO – NÃO RESIDENTES
DEPÓSITOS A PRAZO
MN
ME
13.437.724
13.437.724
229.227
13.666.951
33.360.565
19.316.478
19.316.478
377.135
19.693.613
MN
ME
285.732
15.554.422
15.840.154
252.085
16.092.240
10.130.358
10.130.358
21.290
10.151.648
26.243.888
Em 31 de Dezembro de 2010 e 2009, os depósitos a prazo de clientes em carteira apresentavam a seguinte
estrutura, de acordo com os seus vencimentos:
Milhares de AOA
Prazo de vencimento
Até 3 meses
De 3 a 6 meses
De 6 meses a 1 ano
Mais de 1 ano
44
‘10
‘09
21.531.674
8.146.438
3.682.453
0
33.360.565
21.645.632
3.206.789
1.390.820
646
26.243.888
2010
RELATÓRIO E CONTAS MILLENNIUM ANGOLA
NOTAS ÀS DEMONSTRAÇÕES FINANCEIRAS
12. CAPTAÇÕES PARA LIQUIDEZ
Em 31 de Dezembro de 2010 e 2009, estas rubricas têm a seguinte composição:
Milhares de AOA
‘09
‘10
A MUITO CURTO PRAZO
Captações em instituições de crédito nacionais
Captações em instituições de crédito no estrangeiro
Operações venda com acordo recompra
MN
ME
MN
ME
0
3.151.674
3.151.674
300.182
300.182
23.415
23.415
0
1.411.879
24.907.320
26.319.199
0
23.471.673
56.925
23.528.698
A PRAZO
Captações em instituições de crédito nacionais
Captações em instituições de crédito no estrangeiro
Operações venda com acordo recompra
29.470.873
23.852.195
13. OUTRAS RUBRICAS DO PASSIVO
Em 31 de Dezembro de 2010 e 2009, estas rubricas têm a seguinte composição:
Milhares de AOA
‘10
MN
OBRIGAÇÕES NO SISTEMA DE PAGAMENTOS
Cheques bancários
Cheques visados
Ordens a pagar
OPERAÇÕES CAMBIAIS
Venda de moeda
OUTRAS OBRIGAÇÕES
Impostos
Acréscimos de custos
Outros
54.341
71.242
524.518
650.101
1.418.009
‘09
ME
767.908
767.908
MN
43.562
122.100
437.389
603.051
1.277.771
ME
674.720
674.720
0
500.377
500.377
500.377
743
743
374.562
373.819
373.819
524.978
1.268.839
416.739
2.210.556
2.566.105
5.465
210.058
140.026
355.549
31.987
648.797
393.608
1.074.392
1.418.019
2.512
191.329
149.786
343.627
OUTRAS OBRIGAÇÕES DO PASSIVO
4.484.491
45
3.070.352
2010
RELATÓRIO E CONTAS MILLENNIUM ANGOLA
NOTAS ÀS DEMONSTRAÇÕES FINANCEIRAS
O montante de “Acréscimos de custos” que no final de 2010 ascende a cerca de mAOA 1.478.897, diz
essencialmente respeito a:
Milhões de AOA
Rendas a pagar
542
Contratos de assistência
247
Custos a pagar ao pessoal
451
14. PROVISÕES
Milhares de AOA
Crédito – Níveis de risco (Nota 7)
Crédito por assinatura
Riscos diversos
Pensões de reforma/sobrevivência
Saldo em
31/12/2009
Reforço
‘10
Reposição/
Anulação
Utilizações
Saldo em
31/12/2010
1.253.917
93.718
169.824
62.177
1.579.636
1.612.529
91.685
229.793
8.174
1.942.182
-45.606
-20.316
-65.922
-86.368
-81.708
-168.076
2.780.078
139.798
297.593
70.351
3.287.820
Saldo em
31/12/2008
Reforço
‘09
Reposição/
anulação
Utilizações
Saldo em
31/12/2009
637.770
20.654
47.479
705.903
756.500
80.159
169.824
14.698
1.021.181
-140.353
-7.095
(147.448)
-
1.253.917
93.718
169.824
62.177
1.579.636
Milhares de AOA
Níveis de risco (Nota 8)
Crédito por assinatura
Riscos diversos
Pensões de reforma/sobrevivência
Em 31 de Dezembro de 2010 e 2009, o saldo da rubrica “Provisão para pensões de reforma/sobrevivência”
destina-se a cobrir as eventuais responsabilidades do Banco com a indemnização a pagar aos funcionários na data
de passagem à reforma.
O reforço registado no exercício de 2010 em “Pensões de reforma/sobrevivência” de mAOA 8.175 inclui um
montante de mAOA 2.293, cerca de 28%, resultante de reavaliação cambial.
As provisões por níveis de risco encontram-se efectuadas de acordo com os princípios contabilísticos descritos
na alínea c) da nota 3.
A provisão para riscos diversos destina-se a fazer face a encargos estimados e perdas potenciais decorrentes da
actividade do Banco.
46
2010
RELATÓRIO E CONTAS MILLENNIUM ANGOLA
NOTAS ÀS DEMONSTRAÇÕES FINANCEIRAS
15. CAPITAL E MOVIMENTO NOS FUNDOS PRÓPRIOS
O movimento nas rubricas de fundos próprios nos exercícios findos em 31 de Dezembro de 2010 e 2009 foi
o seguinte:
Milhares de AOA
SALDO EM 31/12/2009
Transferências do resultado de 2009
Aumentos de capital em 2010
Resultado líquido do exercício
SALDO EM 31/12/2010
SALDO EM 31/12/2008
Transferências do resultado de 2008
Aumentos de capital em 2009
Resultado líquido do exercício
SALDO EM 31/12/2009
Capital
Reservas
legais
Outras
reservas
Prémios
de emissão
Resultados
do exercício
Total da
situação líquida
3.809.399
247.990
317.965
2.227.787
1.271.860
6.208.829
1.589.825
(1.589.825)
14.083.830
3.018.457
17.102.287
4.484.734
8.009.271
1.589.825
14.083.830
3.809.399
2.008.957
1.800.442
3.809.399
565.955 3.499.647 6.208.829
161.386 1.881.377
86.604
346.410
6.208.829
247.990 2.227.787 6.208.829
3.018.457
3.018.457
433.014
-433.014
1.589.825
1.589.825
Por deliberação unânime da Assembleia Geral de 8 de Abril de 2010 foi decidida a seguinte aplicação de
resultados:
mAOA 317.965 para Reserva Legal;
mAOA 1.271.860 para Reservas Livres.
CAPITAL
O montante registado na rubrica de capital corresponde ao montante de investimento directo realizado pelos
accionistas. Em 15 de Maio de 2008, foi concluído o acordo de parceria entre o Grupo Millennium bcp, a
petrolífera estatal angolana Sonangol e o Banco Privado Atlântico, S.A. (BPA), que contemplou a entrada no
capital do Banco Millennium Angola (BMA) por parte destas entidades e a aquisição por parte do BMA de uma
participação de 10% no capital do BPA.
Em 31 de Dezembro de 2010, a estrutura accionista do Banco é a seguinte:
‘10
Millennium bcp
Sonangol
BPA
N.º de acções
%
5.000.000
2.984.032
1.497.006
9.481.038
52,70
31,50
15,80
100,00
RESERVA LEGAL
Nos termos da legislação vigente, o Banco deverá constituir um fundo de reserva legal até à concorrência do
seu capital.
Para tal, é anualmente transferido para esta reserva um mínimo de 20% do resultado líquido do exercício anterior.
Esta reserva só pode ser utilizada para a cobertura de prejuízos acumulados, quando esgotadas as demais reservas
constituídas.
47
2010
RELATÓRIO E CONTAS MILLENNIUM ANGOLA
NOTAS ÀS DEMONSTRAÇÕES FINANCEIRAS
16. IMPOSTOS
O Banco encontra-se sujeito a tributação em sede de Imposto Industrial, sendo considerado fiscalmente
contribuinte do Grupo A. A tributação dos seus rendimentos é efectuada nos termos dos números 1 e 2 do
Artigo 72.º, da Lei n.º 18/92, de 3 de Julho, sendo a taxa de imposto aplicável de 35%, na sequência da Lei
n.º 5/99, de 6 de Agosto (alínea h da Nota 3).
Em 31 de Dezembro de 2010 e 2009, o apuramento para efeitos de determinação da contribuição industrial
pode ser detalhada como segue:
Milhares deAOA
RESULTADOS ANTES DE IMPOSTOS
Beneficios fiscais
Valores a acrescer
LUCRO TRIBUTÁVEL
Taxa nominal de imposto
Reporte de prejuízo fiscal
IMPOSTO CORRENTE APURADO
RESULTADO LÍQUIDO DO EXERCÍCIO
‘10
‘09
3.495.868
-1.806.816
18.918
1.707.970
35,00%
597.789
-120.378
477.411
3.018.457
1.589.825
-1.814.633
24.779
-200.028
35,00%
1.589.825
Os benefícios fiscais identificados acima respeitam aos juros de títulos da dívida pública (OT e BT emitidos pelo
Estado) que por se enquadrarem nos Decretos Regulamentares números 51/03 e 52/03, de 8 de Julho, se
encontram isentos de Imposto Industrial.
Assim, na determinação do lucro tributável dos exercícios findos em 31 de Dezembro de 2010 e 2009 tais
proveitos encontram-se deduzidos ao resultado antes de imposto.
Em Janeiro de 2011, o Banco Millennium Angola requereu, ao abrigo do artigo 47.º do Código de Imposto
Industrial, que lhe fosse concedida a dedução dos lucros tributáveis levados a reservas e totalmente reinvestidos
nos termos e com os fundamentos previstos na legislação.
17. SALDOS E TRANSACÇÕES COM ENTIDADES RELACIONADAS
Em 31 de Dezembro de 2010 e 2009, os principais saldos e transacções mantidos com entidades relacionadas
são os seguintes:
Milhares deAOA
DISPONIBILIDADES (NOTA 4)
Millennium bcp
APLICAÇÕES DE LIQUIDEZ (NOTA 5)
Millennium bcp
BPA
CAPTAÇÕES PARA LIQUIDEZ (NOTA 12)
Millennium bcp
OUTRAS RUBRICAS DO PASSIVO (NOTA 13)
Custos com pessoal
Prestação de serviços
48
‘10
‘09
241.362
143.614
257.664
1.757.518
2.015.182
4.166.594
4.166.594
27.964.567
23.495.088
21.244
293.825
315.069
31.576
266.654
298.230
2010
RELATÓRIO E CONTAS MILLENNIUM ANGOLA
NOTAS ÀS DEMONSTRAÇÕES FINANCEIRAS
Os saldos apresentados na rubrica “Outras rubricas do passivo” dizem respeito a transacções com o Grupo
Millennium bcp.
18. BALANÇO POR MOEDA
Em 31 de Dezembro de 2010 e 2009, os balanços por moeda do Banco apresentam a composição que se segue:
110
12010
12040
13020
150
160
17010
17090
180
190
21010
21020
22010
250
260
280
290
410
430
440
Disponibilidades
Operações de Mercado
Monetário Interbancário (MMI)
Aplicações em Ouro
e outros Metais Preciosos
Disponíveis para venda
Créditos no sistema
de pagamentos
Operações cambiais
Créditos
(-) Provisão para créditos
de liquidação duvidosa
Outros valores
Imobilizações
TOTAL ACTIVO
Depósitos à ordem
Depósitos a prazo
Operações de Mercado
Monetário Interbancário (MMI)
Obrigações no sistema
pagamentos
Operações cambiais
Outras obrigações
Provisões para
responsabilidades prováveis
TOTAL PASSIVO
Capital social
Reservas e fundos
Resultados potenciais
TOTAL FUNDOS PRÓPRIOS
TOTAL PASSIVO +
FUNDOS PRÓPRIOS
AOA
USD
‘10
EUR
Outras
Total
12.664.686
9.159.603
578.873
63.980
22.467.141
2.201.055
1.757.518
257.664
0
4.216.237
2.243
20.124.337
0
9.141.932
0
0
0
0
2.243
29.266.269
6.134
504.518
9.042.010
4.133
938.252
47.465.231
1.582
14.320
63.729
0
0
0
11.849
1.457.091
56.570.970
-2.780.078
376.545
9.144.465
51.285.915
18.710.938
13.666.951
0
753.309
2.065.041
71.285.019
17.971.351
18.480.512
0
18.414
92
934.674
1.959.547
1.213.102
0
0
0
63.980
1.795
0
-2.780.078
1.148.268
11.209.598
123.569.588
38.643.630
33.360.565
0
29.465.963
0
4.910
29.470.873
650.101
0
2.210.556
480.044
481.293
355.527
287.864
15.323
22
0
3.761
0
1.418.009
500.377
2.566.105
437.391
35.675.937
3.809.399
10.274.431
3.018.457
17.102.287
70.352
67.305.042
0
0
0
0
0
3.475.858
0
0
0
0
0
10.466
0
0
0
0
507.742
106.467.301
3.809.399
10.274.431
3.018.457
17.102.287
52.778.224
69.560.597
3.475.858
10.466
123.569.588
49
2010
RELATÓRIO E CONTAS MILLENNIUM ANGOLA
NOTAS ÀS DEMONSTRAÇÕES FINANCEIRAS
110
12010
12040
13010
150
160
17010
17090
180
190
21010
21020
22010
250
260
27080
280
290
410
430
440
Disponibilidades
Operações de Mercado
Monetário Interbancário (MMI)
Aplicações em ouro e outros
metais preciosos
Carteira negociação
Créditos no sistema
de pagamentos
Operações cambiais
Créditos
(-) Provisão para créditos
de liquidação duvidosa
Outros valores
Imobilizações
TOTAL ACTIVO
Depósitos à ordem
Depósitos a prazo
Operações de Mercado
Monetário Interbancário (MMI)
Operações venda tit. c/ acordo recompra
Obrigações no sistema
pagamentos
Operações cambiais
Outras captações
Outras obrigações
Provisões para
responsabilidades prováveis
TOTAL PASSIVO
Capital social
Reservas e fundos
Resultados potenciais
TOTAL FUNDOS PRÓPRIOS
TOTAL PASSIVO +
FUNDOS PRÓPRIOS
AOA
USD
‘09
EUR
Outras
Total
13.130.433
2.643.779
353.659
147.431
16.275.302
0
0
4.166.594
0
4.166.594
2.223
16.259.818
0
10.587.224
0
0
0
0
2.223
26.847.042
201.949
383.444
2.606.840
58.037
4.528
38.105.265
17.693
128
19.345
0
1.314
0
277.679
389.414
40.731.450
-1.253.917
354.046
5.721.865
37.406.703
10.204.271
10.151.648
0
662.251
1.982.279
54.043.363
14.539.875
15.164.646
0
12.143
96
4.569.658
3.846.784
927.593
0
0
0
148.745
1.553
0
-1.253.917
1.028.440
7.704.240
96.168.467
28.592.484
26.243.888
300.183
0
23.484.855
56.925
6.023
0
4.209
0
23.795.270
56.925
603.051
743
0
1.074.392
543.854
2.606
0
331.706
130.510
371.213
0
11.921
356
0
0
0
1.277.771
374.562
0
1.418.019
263.541
22.597.829
3.809.399
8,684,606
1.589.825
14.083.809
62.177
54.186.644
0
0
0
0
0
5.294.044
0
0
0
0
0
6118
0
0
0
0
325.718
82084637
3.809.399
8.684.606
1.589.825
14.083.830
36.681.638
54.186.644
5.294.044
6.118
96.168.467
50
2010
RELATÓRIO E CONTAS MILLENNIUM ANGOLA
NOTAS ÀS DEMONSTRAÇÕES FINANCEIRAS
19. MARGEM FINANCEIRA
Milhares deAOA
PROVEITOS DE APLICAÇÕES DE LIQUIDEZ
De operações de Mercado Monetário Interbancário (MMI)
PROVEITOS DE TÍTULOS E VALORES MOBILIÁRIOS
De títulos e valores mobiliários disponíveis para venda
PROVEITOS DE CRÉDITO
PROVEITOS DE INSTRUMENTOS FINANCEIROS
CUSTOS DE DEPÓSITOS
Depósitos à ordem
Depósitos a prazo
CUSTOS DE CAPTAÇÃO P/ LIQUIDEZ
Operações de Mercado Monetário Interbancário (MMI)
Venda de títulos próprios com acordo de recompra
CUSTOS DE INSTRUMENTOS FINANCEIROS PASSIVOS
MARGEM FINANCEIRA
‘10
‘09
450.947
450.947
3.708.109
3.708.109
4.698.854
8.857.910
2.582.376
58.789
2.523.587
45.598
45.253
345
2.627.974
6.229.936
387.567
387.567
1.925.475
1.925.475
2.058.683
4.371.726
956.149
125.545
830.604
476.472
3.806
472.666
1.432.621
2.939.104
Nos exercícios findos em 31 de Dezembro de 2010 e 31 de Dezembro de 2009, a rubrica de “Proveitos de
instrumentos financeiros”, inclui mAOA 1.806.816 e mAOA 1.814.633, respectivamente, relativos a juros de OT
e BT emitidos pelo Estado angolano, estando estes isentos de contribuição industrial (Nota 16).
20. RESULTADOS DE OPERAÇÕES CAMBIAIS
Milhares de AOA
Lucros
‘10
Prejuízos
Líquido
Lucros
‘09
Prejuízos
Líquido
Resultado em:
Notas e moedas
Divisas
476.191
2.944.692
137.634
338.557
2.944.692
688.491
1.680.095
30.570
21.721
657.921
1.658.374
RESULTADOS DE OPERAÇÕES CAMBIAIS
3.420.883
137.634
3.283.249
2.368.586
52.291
2.316.295
21. RESULTADOS DE PRESTAÇÃO DE SERVIÇOS FINANCEIROS
Milhares deAOA
‘10
PROVEITOS DE PRESTAÇÃO DE SERVIÇOS
Comissões de transferências
Comissão de levantamento numerário
Outros proveitos de prestação de serviços
CUSTOS DE COMISSÕES E CUSTÓDIAS
Comissões – VISA
Comissões compensação electrónica
Outros custos de comissões
2.028.471
748.850
188.967
1.090.654
83.997
43.584
13.383
27.030
RESULTADOS DE PRESTAÇÃO DE SERVIÇOS FINANCEIROS
51
1.944.474
‘09
1.340.943
583.156
17.228
740.559
24.541
11.572
4.203
8.767
1.316.402
2010
RELATÓRIO E CONTAS MILLENNIUM ANGOLA
NOTAS ÀS DEMONSTRAÇÕES FINANCEIRAS
22. PESSOAL
Milhares deAOA
MEMBROS DOS ORG. GESTÃO E FISCALIZAÇÃO
Retribuição base
Despesas de representação
Subsídios (Natal + Férias)
EMPREGADOS
Retribuição base
Subsídios (Natal + Férias)
Segurança Social
Outras despesas
PESSOAL
‘10
‘09
169.918
122.652
21.225
26.041
2.143.908
1.184.170
340.983
213.173
405.582
2.313.826
99.084
77.931
12.812
8.340
1.333.832
723.961
226.424
114.501
268.947
1.432.916
23. FORNECIMENTOS DE TERCEIROS
Milhares deAOA
Auditorias, consultorias e outros serviços
Alugueres
Transporte, deslocações e alojamentos
Segurança, conservação e reparação
Comunicações
Publicações, publicidade e propaganda
Água e energia
Outros
FORNECIMENTOS DE TERCEIROS
‘10
‘09
831.587
778.515
418.798
283.509
216.235
128.963
49.528
339.613
3.046.747
488.743
542.332
532.379
193.494
138.866
122.809
31.925
205.538
2.256.086
24. OUTROS CUSTOS ADMINISTRATIVOS E DE COMERCIALIZAÇÃO
Milhares deAOA
IMPOSTOS E TAXAS NÃO INCIDENTES SOBRE O RESULTADO
Impostos aduaneiros
Taxas
Outros impostos
PENALIDADES APLICADAS POR AUTORIDADES REGULADORAS
DEPRECIAÇÕES E AMORTIZAÇÕES
Imobilizado corpóreo
Imobilizado incorpóreo
OUTROS CUSTOS ADMINISTRATIVOS E DE COMERCIALIZAÇÃO
52
‘10
‘09
23.231
15.305
5.104
2.822
1.732
748.144
353.031
395.113
773.107
44.780
33.008
9.402
2.370
881
380.920
47.589
333.331
426.581
2010
RELATÓRIO E CONTAS MILLENNIUM ANGOLA
NOTAS ÀS DEMONSTRAÇÕES FINANCEIRAS
25. OUTROS PROVEITOS E CUSTOS OPERACIONAIS E PROVISÕES
PARA RESPONSABILIDADES PROVÁVEIS
Milhares deAOA
CUSTOS E PREJUÍZOS DIVERSOS
PROVEITOS DIVERSOS
Proveitos pela prestação de serviços diversos
Reembolso despesas de comunicação e expedição
Outros proveitos
PROVISÕES P/ RESPONSABILIDADES PROVÁVEIS
INDEMNIZAÇÕES P/ INCUMPRIMENTO DE CONTRATO
OUTROS CUSTOS E PROVEITOS OPERACIONAIS E PROVISÕES
PARA RESP. PROVÁVEIS
‘10
‘09
-23.525
57.367
19.461
14.522
23.384
33.842
-5.882
1.797
-4.085
-21.410
40.664
8.485
27.174
5.005
19.254
-14.698
1.180
-13.518
29.757
5.736
26. RESULTADO NÃO OPERACIONAL
Milhares deAOA
Perdas relativas a exercícios anteriores
Mais-valias de alienação de imb. corpóreo
Ganhos relativos a exercícios anteriores
RESULTADO NÃO OPERACIONAL
‘10
‘09
1.357
4.694
6.879
10.216
30.404
0
16.703
(13.702)
27. RUBRICAS EXTRAPATRIMONIAIS
Em 31 de Dezembro de 2010 e 2009, estas rubricas têm a seguinte composição:
Milhares deAOA
RESPONSABILIDADES DE TERCEIROS
Linhas de crédito irrevogáveis
Garantias recebidas
RESPONSABILIDADES PERANTE TERCEIROS
Garantias prestadas
Compromissos perante terceiros revogáveis
SERVIÇOS PRESTADOS
Depósito e guarda de valores
Cobrança
OPERAÇÕES CAMBIAIS
Compra de moedas estrangeiras a liquidar
Vendas de moedas estrangeiras a liquidar
‘10
‘09
11.772.335
9.035.920
2.736.415
7.857.644
7.292.984
564.660
36.337.210
35.695.887
641.323
6.468.229
3.712.646
2.755.583
7.932.451
5.287.892
2.644.559
16.896.439
12.817.332
4.079.107
32.115.571
31.171.093
944.478
762.382
389.414
372.968
28. EVENTOS SUBSEQUENTES
Não temos conhecimento de quaisquer factos ou acontecimentos posteriores a 31 de Dezembro de 2010 que
justifiquem ajustamentos ou divulgação nas Notas às Contas relativas ao exercício findo, que afectem as situações
e/ou informações nas mesmas reveladas de forma significativa, ou ainda que, embora não afectando as
demonstrações apresentadas, tenham alterado ou se espere que venham a alterar de forma significativa, favorável
ou desfavoravelmente a situação financeira do Banco, os seus resultados e/ou as suas actividades.
53
2010
RELATÓRIO E CONTAS MILLENNIUM ANGOLA
PROPOSTA DE APLICAÇÃO DE RESULTADOS
PROPOSTA DE APLICAÇÃO
DE RESULTADOS
Considerando as disposições legais e estatutárias relativas a reserva
legal e reservas especiais;
Nos termos da regulamentação especial do Banco Nacional de
Angola, nomeadamente do número 1 do Ar tigo 76.º da Lei
das Instituições Financeiras, do Instrutivo n.º 09/07, das Regras
prudenciais emanadas pelo Supervisor e do artigo 35.º dos
Estatutos do Banco Millennium Angola, propõe-se a seguinte
aplicação dos resultados do exercício de 2010 no montante de
3.018.456.971,82 AOA:
a) 603.691.394,36 AOA para Reserva Legal;
b) 2.414.765.577,46 AOA para reforço das Reservas Livres.
54
2010
RELATÓRIO E CONTAS MILLENNIUM ANGOLA
RELATÓRIO DOS AUDITORES EXTERNOS
RELATÓRIO DOS AUDITORES
EXTERNOS
55
2010
RELATÓRIO E CONTAS MILLENNIUM ANGOLA
RELATÓRIO DOS AUDITORES EXTERNOS
56
2010
RELATÓRIO E CONTAS MILLENNIUM ANGOLA
PARECER DO CONSELHO FISCAL
PARECER DO CONSELHO FISCAL
1. A acção fiscalizadora do Conselho Fiscal à actividade do Banco Millennium Angola, S.A. foi exercida de acordo
com as disposições legais e estatutárias. Nesse sentido, o Conselho Fiscal recebeu atempadamente as contas
trimestrais e respectiva informação de gestão e, sempre que julgou necessário para o desempenho das suas
funções, manteve contactos com membros da Comissão Executiva e elementos da Direcção do Banco e
reuniu com o Auditor Externo.
2. Para efeitos de elaboração do seu parecer relativo ao exercício de 2010 do Banco
Millennium Angola, foram apresentados ao Conselho Fiscal os seguintes documentos:
a) Pela Comissão Executiva: “Apresentação de Resultados Dezembro – 2010”,
que inclui o enquadramento macroeconómico, os resultados de Dezembro
2010 e anexos, “Síntese de Actividade”, “Relatório de Gestão” e “Notas
às Demonstrações Financeiras”.
b) Pelo Auditor Externo: “Clearance Meeting 2010 Auditoria – 31 de
Dezembro de 2010” e o “Parecer”, que conclui da seguinte forma:
“Em nossa opinião, as referidas demonstrações financeiras
apresentam de forma verdadeira e apropriada, em todos os
aspectos materialmente relevantes, a posição financeira do
Banco Millennium Angola em 31 de Dezembro de 2010, o
resultado das suas operações, os seus fluxos de caixa e as
alterações no seu capital próprio no exercício findo
naquela data, em conformidade com os princípios
contabilísticos geralmente aceites em Angola no sector
bancário.”.
3. O Conselho Fiscal apreciou cuidadosamente os referidos documentos
e dessa apreciação resultaram as seguintes conclusões:
a) Que o Balanço, à data de 31 de Dezembro de 2010, reflecte adequadamente a situação financeira do BMA
– Banco Millennium Angola, S.A.
b) Que a Demonstração de Resultados espelha correctamente um lucro de 3.018.456.971,82 kwanzas.
4. Como resultado das verificações e das análises efectuadas, e tendo em consideração a auditoria completa às
demonstrações financeiras anuais levada a cabo pelo Auditor Externo, as quais não revelaram nenhuma situação
merecedora de preocupação, bem com o seu parecer favorável, o Conselho Fiscal:
4.1. É de opinião que as Demonstrações Financeiras do Banco Millennium Angola, S.A.:
a) Estão em conformidade com a lei e satisfazem as disposições estatutárias, bem como as normas
emanadas do Banco Nacional de Angola;
b) Reflectem, de forma verdadeira, a situação financeira do Banco em 31 de Dezembro de 2010, bem
como o resultado das operações realizadas durante o exercício;
4.2. É de parecer que o Conselho de Administração:
a) Aprove as Demonstrações Financeiras BMA – Banco Millennium Angola, S.A. referentes ao exercício
findo em 31 de Dezembro de 2010.
b) Expresse um voto de louvor pelo desempenho da Comissão Executiva e de todos os Colaboradores
do BMA – Banco Millennium Angola, S.A. pela excelência dos resultados conseguidos no exercício de
2010.
Luanda, 2 de Março de 2011
António de Almeida – Presidente do Conselho Fiscal
Luzia Rosária de Fátima Oliveira – Vogal do Conselho Fiscal
Madalena Adriano Domingos de Lemos Neto – Vogal do Conselho Fiscal
57
2010
Annual Report
Millennium Angola
The Employees whose photographs illustrate this document are the winners of the Excellence Awards for 2010.
INDEX
62
65
66
66
67
68
72
80
86
110
111
113
Message from the Chairman of the Executive Committee
Financial Summary
Executive Committee
Corporate Boards
Shareholder Structure
Macroeconomic Framework
Business Review
Financial Statements
Notes to the Financial Statements
Proposal for the Appropriation of Profits
External Auditors’ Report
Opinion of the Supervisory Board
Banco Millennium Angola, S.A.
2010
ANNUAL REPORT MILLENNIUM ANGOLA
MESSAGE FROM THE CHAIRMAIN OF THE EXECUTIVE COMMITTEE
MESSAGE FROM THE CHAIRMAN
OF THE EXECUTIVE COMMITTEE
Economic activity in Angola proved to be more dynamic in 2010 than in
the previous year, driven by the recovery of the world oil market.
Receipts from oil exports improved and contributed to a more
comfortable management of the net international reserves and public
finances. Restoring the country’s reserves and stricter administrative
measures applied to holdings in foreign currency conferred greater
stability to the value of the Angolan currency against the US dollar.
The kwanza’s average value did not undergo any significant changes in the
course of 2010 and varied between 90 and 95 kwanzas to the US dollar.
The estimated growth of the GDP in 2010 was 4.5%,with positive contributions
from the oil and non-oil sectors, 2.7% and 5.7% respectively, which shows that
the non-oil sector again gained importance in the Angolan economy.
As for financial reforms, to be noted is the new organic law of the National Bank of Angola,
which lays down criteria for the financing of the State, obtaining a sovereign debt rating and developing closer
relations with the IMF, reflected in the cumulative disbursement of approximately one billion US dollars
in financial assistance.
Although Banco Millennium Angola is currently investing in the expansion of its retail network, it achieved a
net profit of 32.8 million USD, which represents a 63% growth when compared to the same period of the
previous year.This performance results from the progress made by the operating income, which increased by
51% to 124.6 million USD, with particular emphasis on the 82% increase in net interest income. Overall, the
Bank’s position in the market was reinforced in 2010, particularly in terms of active Customers, which
increased 142% from last year and total customer funds and loans which, when expressed in USD, grew 26%
and 34% respectively.The return on equity reached 19.5% and the efficiency ratio (cost-to-income – structure
costs expressed as a percentage of the operating income) went from 62.2% to 53.2%.
With regard to the most relevant events in 2010, to be noted is the opening of 16 new branches, which
enabled the Bank to close the year with a total of 39 branches in 12 of the 18 Angolan provinces and 714
Employees, 43% more than in 2009.
62
2010
ANNUAL REPORT MILLENNIUM ANGOLA
MESSAGE FROM THE CHAIRMAIN OF THE EXECUTIVE COMMITTEE
Starting in August, the Bank opened on Saturday morning and ended the year with 21 of its 39 branches
providing this convenient service, greatly appreciated by its Customers and that differentiates it from its
competitors.
The inauguration of the new Data Processing Centre, which provides support for all transactions, has proved
to meet the Bank’s needs more effectively, with positive impacts on internal procedures and the supply of
products and services.This step was decisive in the consolidation of the service provided to Customers.
In the area of communication, the Bank strengthened the value of the Millennium Brand by hiring the singer
Yola Semedo, in order to increase its visibility for the Angolan population. On the other hand, the regular
“Millennium Lunches” brought together agents of the national economy, addressed issues of relevance to the
Country and strengthened the Bank’s closeness to the Angolan entrepreneurial community.
Towards the end of the year, the Bank launched an exclusive Account for Public Employees, given that they
have now become free to choose a commercial bank to domicile their bank accounts.
The work and efforts of the Bank’s team were acknowledged, as Banco Millennium Angola was considered to
be the 2010 “Brand of Excellence” by Superbrands, “Best Foreign Bank in Angola 2010” by the magazine
emeafinance and “Bank of the Year – Angola 2010” by the magazine The Banker, a publication owned by the
Financial Times Group.
For 2011, the Bank’s strategic priorities initiatives are based essentially on developing the business, containing
costs and exercising greater control over the loan portfolio, continuing with its commitment to contribute
to the development of the Angolan economy and reinforcing the robustness of its values and experience.
The Bank will achieve these goals by continuously making more effective use of its personnel, of the honesty
and ethics it abides by both inside and outside its premises and by reinforcing the relations of trust with its
Customers and its contribution to Angolan Society.
José Reino da Costa
CEO of the Executive Committee
63
2010
ANNUAL REPORT MILLENNIUM ANGOLA
FINANCIAL SUMMARY
FINANCIAL SUMMARY
Main management indicators
‘10
(Thousands AOA)
‘09 Change %
(Thousands AOA)
‘10
‘09 Change %
(Thousands USD) (*) (Thousands USD) (*)
1. PROFITABILITY
Net income for the year
Operating income
Structural costs
Net interest income/Operating income
Net commissions/Operating income
Financial results/Operating income
Return on Average Assets (ROAA)
Return on Equity (ROE)
3,018,457
11,453,207
6,093,654
54%
17%
29%
2.8%
19%
1,589,825
6,532,475
4,055,516
45%
20%
35%
2.3%
13%
90%
75%
50%
32,845
124,628
66,308
20,129
82,710
51,348
63%
51%
29%
122,975,063
56,191,221
95,724,804
40,564,643
28%
39%
1,327,408
606,535
1,070,771
453,753
24%
34%
53,411,143
71,685,117
29,415,835
17,102,287
17.5%
39,310,726
54,717,760
23,794,598
14,083,830
17.2%
36%
31%
24%
21%
576,526
773,778
317,518
184,604
439,727
612,069
266,165
157,541
31%
26%
19%
17%
39
24
15
51
394
74,861
714
80,625
23
16
7
29
237
36,997
499
33,275
70%
50%
114%
76%
66%
102%
43%
142%
53.2%
62.2%
18
20
-8%
4,876
4,177
17%
18,503
16,130
15%
9,844
2,067
10,014
1,447
-2%
43%
2.0%
0.9%
1.9%
2.9%
0.7%
1.5%
2. BALANCE SHEET
Total net assets
Loans and advances to customers (gross) (**)
Loans and advances to customers,
net of provisions (**)
Total customer funds (**)
Amounts owed to other credit institutions (**)
Equity
Solvency ratio
3. STRUCTURE
Number of branches
Luanda
Other provinces
Number of ATM
Number of active POS
Number of active cards
Number of Employees
Number of active Customers
4. EFFICIENCY AND PRODUCTIVITY
Cost-to-income (***)
Number of Employees/
Number of branches
Net income/Average number
of Employees
Operating income/
Average number of Employees
Structural costs/Average number
of Employees
Number of Customers/Number of branches
5. CREDIT QUALITY
Past due loans + 15 days as a %
of loans and advances to customers
Past due loans + 30 days as a %
of loans and advances to customers
Cost of risk
(*) Amounts in USD are merely indicative (conversion of amounts in national currency at the average exchange rate of AOA/USD 2009: 78.98 and 2010: 91.90 for Income Statement amounts
and at the exchange rate of AOA/USD at the end of 2009: 89.40 and 2010: 92.64 for Balance Sheet.
(**) Not including earned interest.
(***) Ratio of structural costs to operating income.
65
2010
ANNUAL REPORT MILLENNIUM ANGOLA
EXECUTIVE COMMITTEE
EXECUTIVE COMMITTEE
PAULO MOITA
PAULO MOITA
JOSÉ REINO DA COSTA
HERMENEGILDA BENGE
CEO
Vice-President
CORPORATE BOARDS
BOARD OF DIRECTORS
CHAIRMAN:
MEMBERS:
BOARD OF THE GENERAL
MEETING OF SHAREHOLDERS
Carlos Jorge Ramalho
dos Santos Ferreira
José Laurindo Reino da Costa
Hermenegilda de Fátima
Agostinho Lopes Benge
António Maria Abreu Raposo
de Magalhães
Pedro Rui Fontela Coimbra
Miguel Maya Dias Pinheiro
Fernando Gomes dos Santos
Augusto Ramiro Baptista
João Matias
EXECUTIVE COMMITTEE
CEO:
VICE-PRESIDENT:
MEMBERS:
José Laurindo Reino da Costa
Hermenegilda de Fátima
Agostinho Lopes Benge
António Maria Abreu Raposo
de Magalhães
João Matias
Pedro Rui Fontela Coimbra
66
CHAIRMAN:
Mateus Neto
VICE-CHAIRMAN: Ana Isabel dos Santos
de Pina Cabral
SECRETARY:
Graça Maria de Jesus Vieira
Lopes Pitra Costa
SUPERVISORY BOARD
CHAIRMAN:
António de Almeida
VOTING MEMBER: Luzia Rosária Fátima Oliveira
VOTING MEMBER: Madalena Adriano Domingos
de Lemos Neto
ALTERNATE
VOTING MEMBER: João Manuel Francisco
2010
ANNUAL REPORT MILLENNIUM ANGOLA
EXECUTIVE COMMITTEE
PAULO MOITA
PAULO
P
AULO MOITA
MOITA
MO
PAULO MOITA
ANTÓNIO RAPOSO
DE MAGALHÃES
JOÃO MATIAS
PEDRO COIMBRA
Member
Member
Member
SHAREHOLDER STRUCTURE
31.5%
SONANGOL –
SOC. NACIONAL
DE COMBUSTÍVEIS
DE ANGOLA, E.P.
15.8%
BANCO PRIVADO
ATLÂNTICO, S.A.
52.7%
BANCO COMERCIAL
PORTUGUÊS, S.A.
67
2010
ANNUAL REPORT MILLENNIUM ANGOLA
MACROECONOMIC FRAMEWORK
MACROECONOMIC FRAMEWORK
WORLD ECONOMY
The performance of the world economy improved in 2010 and it is anticipated that during 2011 the economic
recovery process will continue to progress, albeit at a more moderate pace. Special reference should be made
to the vitality of the developing economies, given that the growth of their GDP attained almost three times the
average registered in the most advanced countries.
FINANCIAL MARKETS
Financial markets registered less volatility, but issuer differentiation based on the associated credit risk, namely the
sovereign risk, increased. The exchange market registered a strong volatility. The appreciation of the US dollar,
which marked the first half of the year as a result of the lack of stability in the Euro Area, registered a reverse
trend in the second semester.The Chinese authorities maintained the policy of gradually strengthening the yuan
against the US dollar.
The significant increase in raw material prices exerted rising pressure on inflation rates worldwide. In some cases,
raw material price levels higher than before the crisis were resumed, namely those of food, which reached
dramatic proportions in lower income countries and populations. Research and the adoption of more efficient
solutions in the production and use of scarce resources, in addition to better coordination and consistency of
global policies are all crucial to the world geo-strategic balance.
WORLD ECONOMIC GROWTH
The estimated world economic growth in 2010 is of approximately 4.5%.The initial stage and the uncertainty as
to the sustainability and drive of economic recovery have placed constraints on the progress of the labour market.
In fact, a consistent drop in unemployment has yet to be registered, given that it continues to show a historical
high. In the identification of risks for 2011, it is undisputed that the main concerns lie with the developments in
the sovereign crisis of the Euro Area member states and their institutional repercussions. Indeed, in this scenario,
there is a contrast between the intensity of the crisis that continues to affect a number of sovereign states within
the European periphery, including Portugal, which prompted external assistance to stabilize the economies and
the support for the financial systems, first in Greece and more recently in Ireland.
ECONOMIC PERFORMANCE OF SUB-SAHARAN AFRICAN COUNTRIES
On the contrary, the African economies, namely those of the Sub-Saharan region, have shown remarkable
resistance to the successive shockwaves of the worldwide financial and economic crisis.The region has resumed
a healthy growth rate, with favourable prospects for the coming years. Political instability has decreased, thus
allowing for the consolidation of economic development strategies based on revitalising basic infrastructures and
encouraging private initiative.Trade flows have intensified, with important world economies that are strong raw
material importers and with countries of the South African community. Unstable economic cycles are transforming
into more predictable cycles, based on a more coherent economic policy, which is essential to strengthen the
feeling of confidence and secure direct foreign investment.
Although the clear dependence on the raw material cycle continues to prevail, there has been progress in the
gradual diversification of the production capacity of other sectors, such as agriculture and industry, with multiplying
effects in associated activities, such as construction and services. It will thus be possible to create the conditions
for an effective growth cycle and improved living conditions associated to a beneficial demographic context for
the coming decades, contrasting with the challenges set by the ageing populations in developed countries.
68
2010
ANNUAL REPORT MILLENNIUM ANGOLA
MACROECONOMIC FRAMEWORK
RELEVANT RISKS TO ECONOMIC POLICY MANAGEMENT
Despite promising prospects, certain short-term risks relevant to economic policy management endure, such as:
the impact of the increased price of fuel and food on the urban population’s income; the balance between social
support requirements, investment effort and sustainability of the country’s public finances and official reserves; the
control of inflationary pressures; and the political cycle, taking into account that elections will be held in several
countries during 2011.
ANGOLAN ECONOMY
Economic activity in Angola proved to be more dynamic in 2010, spurred on by the stimulation of the world oil
market. Receipts from oil exports proved to be more robust. They contributed to more balanced external
reserves and public finances, the frailty of which called in 2009 for the abrupt slowdown of public policies to
promote growth.The official estimate of the real growth of the GDP in 2010 is 4.5%, with positive contributions
from the oil and non-oil sectors, for which real growth rates projections are 2.7% and 5.7%, respectively.
CHANGES IN THE PRICE OF BRENT 2008-2010
150
140
130
120
110
100
90
80
70
60
50
40
30
20
10
69
Nov. 10
Dec. 10
Sep. 10
Oct. 10
Jul. 10
Aug. 10
Jun. 10
May 10
Apr. 10
Feb. 10
Mar. 10
Jan. 10
Dec. 09
Nov. 09
Sep. 09
Oct. 09
Jul. 09
Aug. 09
Jun. 09
May 09
Apr. 09
Feb. 09
Mar. 09
Jan. 09
Dec. 08
Nov. 08
Oct. 08
Sep. 08
Aug. 08
Jul. 08
Jun. 08
May 08
Apr. 08
Mar. 08
Jan. 08
Feb. 08
0
2010
ANNUAL REPORT MILLENNIUM ANGOLA
MACROECONOMIC FRAMEWORK
STRUCTURE OF THE ANGOLAN ECONOMY AND SECTORAL
PERFORMANCE
Despite the high sensitivity to the oil cycle, the importance of the oil sector in the Angolan economy has been
decreasing (from 58% in 2008 to 46% in 2009) and is expected to go down to 40% in the very near future.
According to the Government’s development plans, the agricultural sector and the manufacturing industry may
see their economic weight practically double in the 2009-2011 period.
CHANGES IN THE STRUCTURE OF THE ANGOLAN ECONOMY – 2001/2009
11.5%
12.3%
17.3%
12.2%
6.5%
12.4%
15.4%
14.1%
13.8%
14.2%
3.6%
3.9%
8.2%
6.2%
51.2%
2001
3.4%
3.7%
8.0%
4.7%
53.8%
3.6%
3.8%
8.2%
4.5%
48.3%
2002
2003
4.7%
4.8%
9.7%
2.8%
3.1%
3.6%
7.2%
4.3%
62.9%
7.6%
6.0%
7.8%
16.8%
16.9%
15.3%
21.2%
4.3%
4.8%
7.3%
2.3%
55.7%
4.9%
5.3%
7.7%
1.8%
4.4%
6.6%
8.2%
1.2%
7.7%
8.8%
52.0%
58.3%
55.8%
6.2%
10.4%
1.1%
45.6%
2004
2005
Oil & gas
Diamond & other industries
Agriculture, forestry, fisheries
2006
2007
2008
2009
Manufacturing industry
Construction
Trade
Others
Source: MINPLAN, OGE, Bank of Angola.
With the scope of this rehabilitation and development process, Angola will have the opportunity to benefit from
adopting innovative manufacturing technologies, reconfiguring its industrial fabric and urban architecture based
on models that maximise the use of resources, minimise the inconveniences for the populations and that are
economically and environmentally sustainable.The Government’s action programme for 2011 is in line with this
goal. It combines social measures (education, health and social protection) with policies of context improvement
in housing, community services and in the business environment.
70
2010
ANNUAL REPORT MILLENNIUM ANGOLA
MACROECONOMIC FRAMEWORK
MONETARY AND EXCHANGE POLICY
Restoring the country’s reserves and stricter administrative measures applied to holdings in foreign currency
conferred greater stability to the value of the Angolan currency against the US dollar. The kwanza’s average
value did not undergo any significant changes in 2010 and varied between 90 and 95 kwanzas to the US dollar.
In average annual terms, this devaluation represents approximately 16% against the US dollar and it has occurred
almost exclusively during the second half of 2009, remaining close to the average inflation rate.
A factor enhancing the effects of the monetary policy measures and indicative of the confidence of economic
agents is the reduction of the importance of the US dollar as the exchange currency and the reserve value of
domestic transactions. Growth stability and inflationary pressure reduction must be contributors, but also the
Central Bank has been adopting measures to restrict the use of foreign currency susceptible of accelerating the
process to reduce the economy’s degree of dollarization (stricter rules applicable to the holdings in foreign
currency that Banks are permitted, specific regulations for bureaux de change, microcredit regulations, among
others).
Increased effectiveness of monetary policy will be important to combat the inflationary pressures, which have
systematically attained results exceeding the authorities’ objective. In 2010, inflation is believed to have exceeded
12%, in average annual terms.The goal for 2011 is an average inflation rate of 12%. As regards reforms and from
a financial standpoint, to be noted is the new organic law of the National Bank of Angola, which lays down
criteria governing the financing of the State; obtaining a sovereign debt rating and developing closer
relations with the IMF, under the form of the cumulative payment of approximately one billion
US dollars in financial assistance; and within the scope of the budget, the adoption of
a more selective and coherent investment programme aimed at stabilising inflation
and slowing down the oil cycle.
BANKING SECTOR
The lagged effects of a more demanding external context were reflected
by the minor degradation in the quality of Banks’ credit portfolio.The
progression of loans to the economy was substantially higher than
the gathering of resources and the degree of coverage of banking
services continued to progress favourably and is approaching
the one thousand branch mark.The supply of banking services
is, simultaneously, an incentive and a consequence of the
development of the Angolan economy. Thus being, the
Programme for the Consolidation of the Angolan Banking
Sector is an initiative to reinforce the confidence in
the banking system, by reformulating the regulatory
requirements and supervision of conduct parameters.
71
2010
ANNUAL REPORT MILLENNIUM ANGOLA
BUSINESS REVIEW
BUSINESS REVIEW
Banco Millennium Angola (BMA) aims to become one of the reference Banks of the Angolan Financial System.
To this end, the Bank continues to extend its distribution network, seeking to cover the national territory with a
strong capillarity and ensure excellence of service to all market segments.The BMA management priorities for
2010 are based on five pillars: Business Development; Expansion of the Retail Network; Recruitment andTraining;
Risk Management and Performance.
2010 proved to be a positive year at all levels. The business grew profitably, all efforts having been channelled
towards ensuring a culture of thoroughness, continually geared towards achieving results, based essentially on
action plans supported by the proper management of risk, costs and investments and improved operational
efficiency.
RESULTS, PROFITABILITY AND SOLIDNESS
The Bank achieved a net profit of 32,845 thousand USD, representing a 63% growth when compared to the same
period of the previous year.
NET PROFIT
Million USD
32.8
+76%
7.1
Although the Bank is currently expanding its retail network, an improvement
in the efficiency ratio was registered as it went from 62.2% in 2009 to 53.2%
in 2010.This growth resulted essentially from a 51% increase in the operating
income which proved to be 124,628 thousand USD, higher than the rise in
structural costs, which grew by 29%.
To be noted is the significant contribution of the net interest income to the
operating income growth, which increased 82% and reached 67,791 thousand
USD. Also to be noted is the fact that the Bank closed the year in third place
in terms of ranking for the purchase of US dollar auction held by the National
Bank of Angola, with a 10% share, producing a positive impact on the income
generated by financial transactions.
20.1
5.8
3.4
2006
2007
2008
2009
2010
The return on equity (ROE) improved significantly as it rose to 19% (whereas
in 2009 it only attained 13%) and return on average assets (ROAA) moved
from 2.3% in 2009 to 2.8% in 2010.
The solvency ratio reached up to 17.5%, still far above the regulatory
minimum threshold.
OPERATING INCOME
Million USD
124.6
STRUCTURE AND NETWORK
The growth of the business, based on the implementation of the expansion
plan, is considered to be the Bank’s main priority for 2010. In 2010, the Bank
had a total of 80,625 active Customers, this representing a 142% increase
when compared to the same period of the previous year, and approximately
51,150 new Customers, as opposed to the 18,700 new Customers acquired
in 2009.
82.7
+87%
36.2
25.3
10.3
2006
2007
2008
2009
Note: Compound Annual Growth Rate (CAGR).
2010
The implementation of the retail network expansion plan involved opening
16 new branches, thus closing the year with a total of 39 branches, in 12 of
the 18 provinces of Angola, and of 714 Employees (up 43% from 2009).
The reinforcement of the recruitment and training (initial and on-the-job)
programmes of Angolan executives continues to be a critical factor for the
sustainable and efficient development of the Bank. Over 100 training courses
were given, which represented a total of 2,350 hours of training.
The Bank’s total assets attained 1,327,408 thousand USD, a 24% growth
when compared to 2009.
72
2010
ANNUAL REPORT MILLENNIUM ANGOLA
BUSINESS REVIEW
At the end of the year, the Bank had an active terminal network which
included 51 automated teller machines – ATM (up 76% from 2009) and 394
automatic payment terminals – ATP (up 66% from 2009), thus continuing to
rank seventh and fifth respectively.
NUMBER OF ACTIVE CUSTOMERS
80,625
The number of active cards increased by 102% and attained a total of 74,861.
+86%
DEPOSITS AND LOANS
33,275
In 2010, customer funds and loans evolved positively, having increased by 34%
and 26%, respectively.The transformation of deposits into loans ratio attained
78.6%.
The security portfolio registered 315,904 thousand USD, representing
approximately 24% of the assets.
LOAN QUALITY
At the end of 2010, the past due loans (over 15 days) corresponded to 2%
of the loans portfolio.To be noted is that the past due loans were covered
by provisions, in 252%, reflecting the caution in attributing risk levels to
Customers/Transactions.
13,703
16,566
6,685
2006
2007
2008
2009
2010
CUSTOMERS FUNDS
Million USD
773.8
612.1
+60%
The cost of the loan portfolio risk increased from 1.5% to 2.9%, as a result
essentially of the growth in the business and reinforcement of prudence
levels.
384.5
220.2
MARKETING AND COMMUNICATION
117.9
In 2010, the Bank decided to open 21 of its 39 branches on Saturdays, thus
adding a business day to the banking services week.
Throughout the year new financial investments were launched, both in
national and foreign currency, with very attractive rates.To secure deposits,
reference is made to the Family Savings Plan, a product to encourage families
to save. In the area of loans, the Salary Advantage and SME Advantage were
launched, for individual Customers and companies respectively, which enabled
them to draw in advance on their monthly income.
2006
2007
2010
606.5
453.8
+70%
302.9
With regard to means of payment, non-personalised debit cards delivered
immediately to the Customer and new cheques books were introduced.
173.6
72.9
2006
2007
2008
2009
Note: Compound Annual Growth Rate (CAGR).
In the area of services, a new Internet site was made available for Private
Customers and Companies and a new Data Processing Centre, which provides
support for all the Bank’s transactions, was inaugurated.This new IT infrastructure
meets the Bank’s needs more effectively, thus producing a positive impact on internal procedure and the supply of
products and services, and is a decisive step towards consolidating the services provided to the Customer.
As for communication, the association of the Brand with the renowned singerYola Semedo began, which enabled
Millennium Angola Brand to increase its visibility for the Angolan population and contributed to the acquiring of
new Customers, namely by offering them a promotional CD containing 8 of the 14 tracks of the album “Minha
Alma” (“My Soul”), which was launched at the same time as the advertising campaign.
73
2009
GROSS LOANS
Million USD
Still on the subject of loans to companies and support to investment, a
protocol was signed with the Coca-Cola Project Fund, in order to open a
“Bengo Investe I” credit line, amounting to twenty million US dollars, to finance
investment projects for the Bengo province, in the areas of industry, agriculture,
trade and services.
The Western Union service for fast money transfers, of which the Bank has
been an agent since 2004, became available to the Bank’s Customers at all
its branches. Also with the goal of offering Customers more advantages, a
discount programme was launched associated to using and enlivening the
Visa Classic and Prestige credit cards, a pioneer programme in Angola.
2008
2010
2010
ANNUAL REPORT MILLENNIUM ANGOLA
BUSINESS REVIEW
The “Millennium Lunches”, regularly held by the Bank in Luanda and in the
province of Benguela, aimed at bringing together agents of the national
economy and addressing issues of relevance to the country, have
strengthened the closeness to the Angolan entrepreneurial community.
The Bank also participated in fairs for companies, such as FILDA, as well
as in recruitment events, in order to secure Customers and business
and to reinforce the Bank’s teams.
Banco Millennium Angola also supported entrepreneurial missions
organised by the AERLIS – Associação Empresarial da Região de
Lisboa (Entrepreneurial Association of the Lisbon Region), AICEP –
Agência para o Investimento e Comércio Externo de Portugal (Agency
for Investment and Portuguese Foreign Trade) and ACL – Associação
Comercial de Lisboa (LisbonTrade Association), in the capacity as an agent
facilitating contacts between companies from Portugal forming part of the
mission and companies domiciled in Angola. By sponsoring these events, BMA
was seeking to promote business opportunities, investment and partnerships
producing a positive impact on local development.
In 2010, the Bank received and replied to 55 requests for information from the media.
Towards the end of the year, the Bank launched an exclusive Account for Public Employees, given that they have now
become free to choose a commercial bank where they can domicile their bank accounts.
In 2010, BMA was considered the “2009/2010 Brand of Excellence” by Superbrands, “Best Foreign Bank in Angola
2010” by the magazine emeafinance and “Bank of theYear – Angola 2010” by the magazineThe Banker, a publication
owned by the Financial Times Group.
SOCIAL RESPONSIBILITY
In 2010, the Bank continued to support the community on the African Child Day (16 June) and, as in the previous
year, delivered a donation in cash, food, school supplies, clothing and toys to the Programa Criança Feliz (Happy Child
Programme), located in Golf, Madres Medical Centre, municipality of Kilamba Kiaxi.
The goal of Programa Criança Feliz is to reduce poverty, promote the education of the children of the community
and offer healthcare.The beneficiaries are children under 14.
This action, implemented together with Grupo da Amizade (Friendship Group), an NGO, involved all the Employees
who, directly or indirectly, contributed by handing out food, school supplies, clothing and toys.
BMA also supported Grupo da Amizade by participating in a Gala Dinner and purchasing a table for ten.The Bank
also promoted the Christmas Bazaar, organised by the same group, inscribing the date and place where it was to be
held on its Christmas card and buying 400 tickets to offer to personalities.The goal of the Christmas Bazaar is also to
collect funds for social projects.
The funds collected by Grupo da Amizade are used to provide support to disadvantaged groups, by contributing to
funding projects such as the Grupo da Amizade Pharmacy, the Nutrition Centre, the Escola das Irmãs Teresianas
(Teresian Sisters’ School), Mamã Muxima, Dom Bosco School, Happy Child Programme, Kikolo Orphanage,
Camanongue Missionary School, Santa Isabel Charity or the Camunda Catholic Mission.
HUMAN RESOURCES
RECRUITMENT
To meet the different needs of human resources is one of the main challenges in the recruitment area of the
Angolan market, which BMA has yet again overcome very successfully by recruiting 299 new Employees in 2010.
BMA currently employs a total of 714 people.
74
2010
ANNUAL REPORT MILLENNIUM ANGOLA
BUSINESS REVIEW
In the different recruitment actions that were undertaken, emphasis is placed on attracting talents
at two levels:
Cooperation Protocol with the Agostinho Neto University for the awarding of
scholarships.
Within this scope, the Bank was present at several universities in order to
gather applications not only from future scholarship holders but also from
possible recruitment candidates.
We awarded a total of eight external scholarships (Agostinho Neto
University students) and six internal scholarships (to the Bank’s
Employees):
Participation in Employment Fairs through Elite Angolan
Careers, which were held in Luanda and Lisbon. There, the
BMA recruited 17 new Employees.
TRAINING
The training of Employees is vital to the Bank’s development and
growth project. Accordingly, last year 110 different training courses were given
– technical and relating to conduct and initial, on-the-job or long-term.These provided 2,357 training hours and
involved Employees at all levels.
One of our partners, the Atlântico Millennium Academy (AMA), operates as the lever for our Employees to
increase and develop their skills. AMA is a pioneer project in Angola, which aims to provide top quality training
in order to meet the requirements of the Angolan business market, namely in the area of finance, banking and
insurance, which was publicly presented in July.The project aims to train approximately ten thousand Angolan by
2015, and is sponsored by Sonangol, Banco Privado Atlântico and Banco Millennium Angola.
CAREER MANAGEMENT
Individual Performance Assessment continues to be the tool that enables to establish and consolidate opinions
on an Employee’s performance, irrespective of the performance being high or low, and to apply retaining and
corrective measures.
An example is the award of the Excellence Prize to Employees having risen above the Excellence standards.
PERSONNEL MANAGEMENT
The most relevant event in Personnel Management in 2010 was the adjustment and better use of the HRMS
(Human Resources Management System) application, in order to meet operation requirements by creating a
number of tables and new functionalities for the Self Services Employees and Heads.These improvements allowed
for easier communication between the Employees and hierarchies and the HRD – Personnel Management, costs
reduction and reduction of the Bank’s ecologic footprint.
The coming into force of Health Insurance in August 2010 for all Employees was undoubtedly a qualitative leap
in terms of the benefits awarded to our Employees.
EMPLOYEE BRANCH
The Employee branch’s main mission is to focus on the internal Customer. In 2010 it successfully concluded
29 housing loans and 130 loans for social purposes.
STRATEGIC PRIORITIES
The strategic initiatives for the coming years are subject to the business’s growth, based on the implementation
of the expansion plan that calls for opening branches, increasing the number of Customers and balance sheet
resources in each segment of the business, reinforcing programmes to recruit and train Angolan executives,
continuously relying on appropriate management procedures and monitoring risk, in addition to continuously
investing in technology and information systems.
75
2010
ANNUAL REPORT MILLENNIUM ANGOLA
BUSINESS REVIEW
NEW CUSTOMERS
FAMILY SAVINGS PLAN
KANDANDO DEPOSIT
SALARY ADVANTAGE
76
2010
ANNUAL REPORT MILLENNIUM ANGOLA
BUSINESS REVIEW
CREDIT CARDS
CATETE BRANCH
MALANGE BRANCH
TALATONA IMBONDEIRO BRANCH
77
2010
ANNUAL REPORT MILLENNIUM ANGOLA
BUSINESS REVIEW
Hermenegilda Lopes Benge,Vice-President of the Executive Committee, receives the
prize “Best Foreign Bank in Angola 2010” awarded by the magazine emeafinance.
José Reino da Costa receives the Prize “Bank of the Year – Angola 2010” awarded by
the magazine The Banker, a publication of the Financial Times Group.
“Family photo” of the Excellence Awards for performance in 2009, awarded
in the Objectives Meeting held in 2010.
Arrival of Employees to the Objectives Meeting held in the Talatona Convention Centre,
in South Luanda.
78
2010
ANNUAL REPORT MILLENNIUM ANGOLA
BUSINESS REVIEW
Carlos Santos Ferriera, Chairman of the Millenium bcp, speaks at the “Millennium
Lunches”, a regular initiative of the Bank that brings the business community together.
Main pavillion of the Banco Millennium Angola in the Luanda Trade Fair – FILDA.
On African Children’s Day, in partnership with the NGO “Grupo da Amizade”
(“Friendship Group”), the Bank made a donation in cash, food, school materials,
clothing and toys to the Happy Child Programme.
The Millennium Atlântico Academy, a pioneer training project in Angola to address the
needs of the Angolan business market, namely in the financial area, banking and
insurance.
79
2010
ANNUAL REPORT MILLENNIUM ANGOLA
FINANCIAL STATEMENTS
FINANCIAL STATEMENTS
BALANCE SHEET AS AT 31 DECEMBER 2010 AND 2009
ASSETS
CASH AND DEPOSITS
CASH APPLICATIONS
Transactions on the Interfinancial Monetary Market
Purchase Transactions of Third Party Securities with Resale Agreement
Sale Transactions of Third Party Securities with Resale Agreement
Applications in Gold and Other Precious Metals
SECURITIES
Held for Trading
Available for Sale
Held to Maturity
DERIVATIVE FINANCIAL INSTRUMENTS
CREDITS IN THE PAYMENTS SYSTEM
EXCHANGE OPERATIONS
LOANS
Loans
(-) Bad Debts Provision
COMMERCIAL AND INDUSTRIAL CUSTOMERS
OTHER AMOUNTS
FIXED ASSETS
Financial Fixed Assets
Tangible Fixed Assets
Intangible Fixed Assets
TOTAL ASSETS
Thousands AOA
NOTE
‘10
‘09
4
5
22,467,141
4,218,480
4,216,237
0
0
2,243
29,266,269
0
29,266,269
0
0
11,849
1,457,091
53,790,892
56,570,970
-2,780,078
0
1,148,268
11,209,598
2,078,828
5,500,049
3,630,721
123,569,588
16,275,302
4,168,817
4,166,594
0
0
2,223
26,847,042
0
26,847,042
0
0
277,679
389,414
39,477,533
40,731,450
-1,253,917
0
1,028,440
7,704,240
1,982,375
3,547,637
2,174,228
96,168,467
6
10
10
7
10
8
9
9
continues
80
2010
ANNUAL REPORT MILLENNIUM ANGOLA
FINANCIAL STATEMENTS
Thousands AOA
continuation
LIABILITIES
DEPOSITS
Sight Deposits
Term Deposits
Other Deposits
FUNDING FOR LIQUIDITY
Transactions on the Interfinancial Monetary Market
Purchase Transactions of Third Party Securities with Resale Agreement
Sale Transactions of Third Party Securities with Resale Agreement
FUNDING WITH SECURITIES
DERIVATIVE FINANCIAL INSTRUMENTS
BONDS IN THE PAYMENTS SYSTEM
EXCHANGE OPERATIONS
OTHER FUNDING
COMMERCIAL AND INDUST. SUPPLIERS
AND ADVANCES FROM CUSTOMERS
OTHER BONDS
PROVISIONS FOR PROBABLE LIABILITIES
TECHNICAL PROVISIONS
TOTAL LIABILITIES
MINORITY INTERESTS
EQUITY
Share Capital
Share Capital Monetary Update Reserve
Reserves and Funds
Potential Results
Retained Earnings
(-) Interim Dividends
Result of Alteration to Accounting Criteria
(-) Own Shares in Treasury
TOTAL LIABILITIES + EQUITY FUNDS
PROFIT PER SHARE
81
NOTE
‘10
‘09
11
72,004,195
38,643,630
33,360,565
0
29,470,873
29,470,873
0
0
0
0
1,418,009
500,377
0
54,836,372
28,592,484
26,243,888
0
23,852,195
23,795,270
56,925
0
0
0
1,277,771
374,562
0
0
2,566,105
507,742
0
106,467,301
0
17,102,287
3,809,399
0
10,274,431
3,018,457
0
0
0
0
123,569,588
0
1,418,019
325,718
0
82,084,637
0
14,083,830
3,809,399
0
8,684,606
1,589,825
0
0
0
0
96,168,467
0,318
0,168
12
13
13
13
14
15
2010
ANNUAL REPORT MILLENNIUM ANGOLA
FINANCIAL STATEMENTS
INCOME STATEMENT AS AT 31 DECEMBER 2010 AND 2009
Income Statement
I.
II.
1.
2.
3.
4.
III.
5.
6.
7.
8.
9.
IV.
V.
VI.
VII.
VIII.
IX.
X.
XI.
10.
11.
12.
13.
14.
15.
16.
17.
18.
19.
XII.
XIII.
XIV.
XV.
XVI.
XVII.
XVIII.
XIX .
XX.
XXI.
XXII.
XXIII.
NET INTEREST INCOME (II+III)
INCOME FROM FINANCIAL ASSET INSTRUMENTS (1+2+3+4)
Income from Applications of Liquidity
Income from Securities
Income from Derivative Financial Instruments
Income from Loans
(-) COSTS OF FINANCIAL LIABILITY INSTRUMENTS (5+6+7+8+9)
Costs of Deposits
Costs of Funding for Liquidity
Costs of Funding with Securities
Costs of Derivative Financial Instruments
Costs of Other Funding
RESULTS OF TRADING AND ADJUSTMENTS TO FAIR VALUE
RESULTS OF EXCHANGE TRANSACTIONS
RESULTS OF PROVISION OF FINANCIAL SERVICES
(-) BAD DEBTS PROVISIONS AND GUARANTEES PROVISION
RESULTS OF INSURANCE, CAPITALIZATION
AND COMPLEMENTARY HEALTH PLANS
RESULT OF INTERMEDIATION FINANCIAL (I+IV+V+VI+VII+VIII)
RESULTS WITH GOODS, PRODUCTS AND OTHER SERVICES
(-) ADMINISTRATIVE AND SALES COSTS
(10+11+12+13+14+15+16+17+19)
Staff
Supplies from Third Parties
Tax and Rates Other than on Profits
Penalties Applied by Regulatory Authorities
Research and Development Costs
Specific Provisions for Losses with Commercial and Industrial Customers
Other Administrative and Sales
Specific Provisions for Losses with Commercial and Industrial Inventories
Depreciation and Amortizations
Recovery of Costs
(-) PROVISIONS ON OTHER AMOUNTS AND PROBABLE LIABILITIES
RESULT OF FINANCIAL FIXED ASSETS
OTHER OPERATING INCOME AND COSTS
OTHER OPERATING INCOME AND COSTS (XI+XII+XIII+XIV)
RESULT OF THE MONETARY UPDATE OF ASSETS
OPERATING PROFIT (IX+X+XV+XVI)
NON-OPERATING PROFIT
PRE-TAX PROFIT AND OTHER CHARGES (XVII+XVIII)
(-) CHARGES ON CURRENT RESULTS
CURRENT NET PROFIT (XIX+XX)
(-) MINORITY HOLDINGS
RESULT OF THE YEAR (XXI+XXII)
82
Thousands AOA
Note
‘10
‘09
19
6,229,936
8,857,910
450,947
3,708,109
0
4,698,854
-2,627,974
-2,582,376
-45,598
0
0
0
0
3,283,249
1,944,474
-1,868,085
2,939,104
4,371,726
387,567
1,925,475
0
2,058,683
-1,432,621
-956,149
-476,472
0
0
0
0
2,316,295
1,316,401
-859,034
0
9,589,574
0
0
5,712,766
0
-6,133,680
-2,313,826
-3,046,747
-23,231
-1,732
0
0
0
0
-748,144
0
-4,085
0
33,842
-6,103,923
0
3,485,651
10,216
3,495,868
-477,411
3,018,457
0
3,018,457
-4,115,583
-1,432,916
-2,256,086
-44,780
-881
0
0
0
0
-380,920
0
-13,518
606
19,254
-4,109,241
0
1,603,526
-13,702
1,589,824
0
1,589,824
0
1,589,825
20
21
14
22
23
24
24
24
25
25
26
16
2010
ANNUAL REPORT MILLENNIUM ANGOLA
FINANCIAL STATEMENTS
STATEMENT OF CHANGES IN EQUITY AS AT 31 DECEMBER 2010
OPENING BALANCES
Receipts due to Capital Increases
Payments on Capital Reductions
Incorporations of Reserves to Capital
Incorporations of Retained
Earnings to Capital
Effect of Adjustments in Securities
Available for Sale
Effect of Exchange Variation
on Financial Fixed Assets Abroad
Effect of Net Losses in Sponsored
Pension Funds
Effect of Own Revaluation Reserves
Effect of Revaluation Reserves
of Related and Equivalent Companies
Effect of Tax Charges
on Potential Results
Appropriation of Net Profit
Constitution of Reserves
Cancellation of Reserves
(-) Payment of Interim Dividends
(-) Dividends Proposed in the Period
Compensation of Losses
Result of Alterations
to Accounting Criteria
Acquisition of Shares
or Holdings in Treasury
Disposal of Shares
or Holdings in Treasury
Extinction of Shares
or Holdings in Treasury
CLOSING BALANCES
Thousands AOA
Share
capital
Reserves
Potential
results
Retained
earnings
(-) Interim
dividends
3,809,399
8,684,606
3,495,868
1,589,825
0
0
0
0
0
0
0
0
0
0
0
0
0
0
0
0
0
0
0
0
0
0
0
0
0
0
0
0
0
0
0
0
0
Result of
alterations to
accounting
criteria
(-) Shares
or holdings
in treasury
Totals
0
0
17,579,698
0
0
0
0
0
0
0
0
0
0
0
0
0
0
0
0
0
0
0
0
0
0
0
0
0
0
0
0
0
0
0
0
0
0
0
0
0
0
0
0
0
0
0
0
0
0
0
0
0
1,589,825
0
0
0
0
-477,411
0
0
0
0
0
0
0
0
-1,589,825
0
0
0
0
0
0
0
0
0
0
0
0
0
0
0
0
0
0
0
0
0
0
0
0
0
-477,411
0
0
0
0
0
0
0
0
0
0
0
0
0
0
0
0
0
0
0
0
0
0
0
0
0
0
0
0
0
0
0
0
0
0
0
0
0
0
3,809,399
10,274,431
3,018,457
0
0
0
0
17,102,287
83
2010
ANNUAL REPORT MILLENNIUM ANGOLA
FINANCIAL STATEMENTS
CASH FLOW STATEMENT FOR THE YEARS ENDED
31 DECEMBER 2010 AND 2009
I.
1.
2.
3.
4.
II.
5.
6.
7.
8.
9.
IV.
V.
VI.
VII.
VIII.
IX.
10.
11.
12.
13.
14.
15.
X.
XI.
16.
17.
18.
19.
20.
CASH FLOW FROM NET INTEREST INCOME (I+II)
Receipt of Income from Financial Asset Instruments (1+2+3+4)
Receipt of Income from Applications of Liquidity
Receipt of Income from Securities
Receipt of Income from Derivative Financial Instruments
Receipt of Income from Credits
(-) Payment of Costs of Financial Liability Instruments (5+6+7+8+9)
Payment of Costs of Deposits
Payment of Costs of Funding for Liquidity
Payment of Costs of Funding with Securities
Payment of Costs of Derivative Financial Instruments
Payment of Costs of Other Funding
CASH FLOW FROM TRADING RESULTS AND ADJUSTMENTS TO FAIRVALUE
CASH FLOW FROM THE RESULTS OF EXCHANGE TRANSACTIONS
CASH FLOW FROM THE RESULTS OF THE PROVISION
OF FINANCIAL SERVICES
CASH FLOW FROM THE RESULTS OF INSURANCE,
CAPITALIZATION AND COMPLEMENTARY HEALTH PLANS
OPERATIONAL CASH FLOW FROM FINANCIAL
INTERMEDIATION (I+IV+V+VI+VII)
CASH FLOW FROM THE RESULTS WITH GOODS,
PRODUCTS AND OTHER SERVICES
(-) Payment of Administrative and Sales Costs
(-) Payments of Other Charges on Profits
Cash Flow from the Payment of Transactions in the Payments System
Cash Flow from Other Amounts and Other Bonds
Receipt of Income from Financial Fixed Assets
Cash Flow from Other Operating Costs and Income
RECEIPTS AND PAYMENTS OF OTHER OPERATING
INCOME AND COSTS (10+11+12+13+14+15)
CASH FLOW FROM OPERATIONS (VIII+IX+X)
Cash Flow from Investments in Applications of Liquidity
Cash Flow from Investments in Securities
Cash Flow from Investments in Derivative Financial Instruments
Cash Flow from Investments in Exchange Transactions
Cash Flow from Investments in Loans
Thousands AOA
31 Dec. 10
31 Dec. 09
6,229,936
8,857,910
450,947
3,708,109
0
4,698,854
-2,627,974
-2,582,376
-45,598
0
0
0
0
3,283,249
2,939,104
4,371,725
387,567
1,925,475
0
2,058,683
-1,432,621
-956,149
-476,472
0
0
0
0
2,316,295
1,944,474
1,316,401
0
0
0
0
0
-4,733,394
0
-2,329,705
406,068
-119,828
32,045
-7,971,200
-793,058
606
18,074
-4,415,109
-4,415,109
-49,663
-2,419,227
-11,075,283
-11,075,283
-1,568,288
-14,395,346
-1,234,745
-15,839,520
282,711
-17,840,557
continues
84
2010
ANNUAL REPORT MILLENNIUM ANGOLA
FINANCIAL STATEMENTS
Thousands AOA
continuation
XII.
XIII.
21.
22.
23.
XIV.
XV.
24.
25.
26.
27.
28.
29.
XVI.
XVII.
30.
31.
32.
33.
34.
XVIII.
XIX .
XX.
CASH FLOW FROM INVESTMENTS OF FINANCIAL
INTERMEDIATION (16+17+18+19+20)
CASH FLOW FROM INVESTMENTS IN OTHER AMOUNTS
Cash Flow from Investments in Fixed Assets
Cash Flow from the Results from the Disposal of Fixed Assets
Cash Flow from Other Non-Operating Gains and Losses
CASH FLOW FROM FIXED ASSETS (21+22+23)
CASH FLOW FROM INVESTMENTS (XII+XIII+XIV)
Cash Flow from Financing with Deposits
Cash Flow from Financing with Funding for Liquidity
Cash Flow from Financing with Funding with Securities
Cash Flow from Financing with Derivative Financial Instruments
Cash Flow from Financing with Exchange Transactions
Cash Flow from Financing with Other Funding
CASH FLOW FROM THE FINANCING OF FINANCIAL
INTERMEDIATION (24+25+26+27+28+29)
CASH FLOW FROM THE FINANCING WITH MINORITIES
Receipts due to Capital Increases
(-) Payments on Capital Reductions
(-) Payments of Dividends
Receipts on the Disposal of Own Shares or Holdings in Treasury
(-) Payments on the Acquisition of Own Shares or Holdings in Treasury
CASH FLOW FROM FINANCING WITH EQUITY FUNDS (30+31+32+33+34)
CASH FLOW FROM FINANCING WITH OTHER BONDS
CASH FLOW FROM FINANCING (XVI+XVII+XVIII+XIX)
BALANCE IN CASH AND DEPOSITS AT THE START OF THE PERIOD
BALANCE IN CASH AND DEPOSITS AT THE END OF THE PERIOD
VARIATION IN CASH AND DEPOSITS (XI+XV+XX)
85
31 Dec. 10
31 Dec. 09
-23,958,264
0
-4,230,088
0
10,216
-4,219,872
-28,178,136
17,167,823
5,618,678
0
0
125,815
0
-44,596,763
0
-3,518,303
0
-13,702
-3,532,005
-48,128,768
35,127,386
6,977,131
0
0
-305,193
0
22,912,316
0
0
0
0
0
0
0
0
22,912,316
16,275,302
22,467,141
41,799,323
0
8,009,264
0
0
0
0
8,009,264
0
49,808,587
8,023,683
16,275,302
6,191,839
8,251,619
2010
ANNUAL REPORT MILLENNIUM ANGOLA
NOTES TO THE FINANCIAL STATEMENTS
NOTES TO THE FINANCIAL
STATEMENTS
ON 31 DECEMBER 2010 AND 2009
(Amounts in thousands of Angolan kwanzas – mAOA, except when expressly indicated, as stipulated in Notice
nr. 15/2007, of 12 September).
1. INTRODUCTION
Banco Millennium Angola, S.A. (hereinafter also called “Bank” or “BMA”) carries out its business in the area of retail
banking. BMA’s business is based on the realization of financial transactions and on the provision of services
permitted by commercial banks pursuant to legislation in force, namely, transactions in foreign currency, the
concession of credit and obtaining deposits.
To meet its objectives, the Bank has a national sales network which, on 31 December 2010, included 39 branches,
of which 16 were opened in the last year.
Banco Millennium Angola, S.A. is the result of the transformation of the Banco Comercial Português Angola
Branch Office into a legal local Bank, integrating all its Assets and Liabilities, and under the authorisation of the
Council of Ministers of 22 February 2006.The deed was signed on 3 April 2006.
With regard to the structure shareholder and as detailed in Note 15, the Bank is majority owned by Banco
Millennium bcp (Millennium Group) and Note 17 details the main balances and transactions with companies of
the Millennium Group.
2. COMPARABILITY OF INFORMATION
The annual Financial Statements presented here were published in such a way as to be able to be compared with
those of the previous period.The Financial Statements of the Bank presented here were prepared in accordance
with the Financial Institutions Accounting Plan (CONTIF).The comparative amounts presented for 2009 were reentered
following the CONTIF, based on those previously presented under the previous Financial Institutions Accounts
Plan (PCIF).
The Bank adopted the CONTIF retrospectively.The impact of the adoption of the CONTIF on the Bank’s Financial
Statements is restricted to reclassifications in order to comply with the new accounting plan.
3. BASES OF PRESENTATION AND SUMMARY OF THE MAIN
ACCOUNTING POLICIES
3.1. BASES OF PRESENTATION
The Financial Statements presented in this report were prepared on a going-concern basis, based on the books
and records kept by the Bank, and in accordance with the accounting principles established in the CONTIF, as
defined in Instruction nr. 09/07 of 19 September, by the National Bank of Angola (hereinafter also called “BNA”),
which came into force on the 1 January 2010.
The Financial Statements of BMA relating to the year ended on 31 December 2010 have still not been approved
by the General Meeting. Nevertheless, the Board of Directors of the Bank acknowledges that these will be
approved without significant alteration.
The Financial Statements of the Bank on 31 December 2010 and 2009 are stated in thousands of Angolan
kwanzas (AOA), as per article 5 of Notice nr. 15/2007, of the BNA, with all of the assets and liabilities
86
2010
ANNUAL REPORT MILLENNIUM ANGOLA
NOTES TO THE FINANCIAL STATEMENTS
denominated in foreign currency being converted at the average indicative rate published by the BNA on the
balance sheet date.
On 31 December 2010 and 2009, the exchange rates against the AOA of the currencies to which the Bank is
most exposed are the following:
‘10
‘09
USD
92.64
89.398
EUR
122.7
128.202
The Financial Statements presented below were based on the following main accounting policies:
3.2. MAIN ACCOUNTING POLICIES
3.2.1.Accrual accounting
The Bank recognises income and costs when obtained or incurred, irrespective of when they are received or paid,
and are included in the Financial Statements of the periods to which they relate.
Income is considered to be received when: a) in transactions with third parties, payment is made or a firm
commitment to do so is assumed; b) on the extinction, in part or in full, of a liability, for whatever reason, without
the simultaneous disappearance of an asset of equal or greater value; c) in the natural generation of new assets,
irrespective of the intervention of third parties; or d) on the effective receipt of donations and subsidies.
Costs, in turn, are considered to be incurred when: a) the corresponding asset value ceases to exist, by the
transfer of its ownership to a third party; b) by the reduction or extinction of the economic value of an asset; or
c) by the appearance of a liability, without the corresponding asset.
3.2.2. Exchange transactions
Purchase and sale transactions of foreign currency, when settled on the date they are contracted, are entered
in the Bank’s Balance Sheet accounts. If settlement is later than the contract date, these are also entered in the
Off Balance Sheet accounts.
Transactions in foreign currency are recorded in their respective currency, in accordance with the principles of
the multicurrency system.Transactions in foreign currency are entered based on the reference rate of exchange
of the day of the operation, published by the BNA. Income and costs arising from asset and liability transactions
indexed to the exchange variation, unrealised, are stated in the accounts representative of the income or cost of
the application or receipt.
Variations and differences in rates on amounts relating to the purchase and sale of foreign currencies payable that
occurred between the transaction date and the date of payment of the exchange contract, are entered in the
Results of Exchange Transactions account, as a counterentry to the Balance Sheet item of Income from the
Purchase and Sale of Foreign Currencies Receivable or Costs from the Purchase and Sale of Foreign Currencies
Payable, as applicable.
3.2.3. Securities
Securities acquired by the Bank are entered at the value effectively paid and, according to their characteristics and
the intention upon acquisition, are classified in the following categories:
a) Securities for trading;
b) Securities available for sale;
c) Securities held until maturity.
Securities acquired with the purpose of being active and frequently traded are stated in the “Securities for trading”
category.
Securities acquired with the purpose of possibly being traded and, as a result, do not fit into the other categories
are stated in the “Securities available for sale” category.
87
2010
ANNUAL REPORT MILLENNIUM ANGOLA
NOTES TO THE FINANCIAL STATEMENTS
Securities for which the Bank has the intention and financial capacity to keep in portfolio until maturity are stated
in the “Securities held until maturity” category. Proof of this financial capacity is based on cash flow projections,
without considering the possibility of selling the securities before maturity.
Income produced by securities from the interest applied during the period up until maturity or from declared
dividends is considered directly in the result of the same period, irrespective of the category in which the securities
may have been classified, while income relating to shares acquired less than six months before is recognised in a
counterentry in the account which records the corresponding acquisition cost.
Securities classified in the “Securities for trading” and “Available for sale” categories are adjusted by their market
value, with any increase or decrease in value being considered in a counterentry:
a) Of the income or costs account, in the result of the period, when it relates to securities classified in the
“Securities for trading” category;
b) Of the equity funds account, when relating to securities classified in the “Securities available for sale” category,
for the value net of tax, being transferred to the result of the period only upon the definitive sale.
For the purpose of the adjustment of the market value of the securities, the methodology of their calculation
follows the criterion of the price defined by the Bank National of Angola.
Losses of a permanent nature in securities are recognised immediately in the result of the period, with the
adjusted value that arises from the recognition of these losses forming the new value basis for the purpose of
the appropriation of revenue.These losses are not reverted in subsequent years.
Central Bank Securities and Treasury Bills are issued at discount and entered at
their redemption value (par value).The difference between this and the
acquisition cost is reflected under “Deferred Income”, over the period
between the purchase date and the maturity date of the securities.
Treasury Bonds acquired at discount are entered at their redemption
value (par value), with the difference with the acquisition cost being
recognised in the accounts as income deferred between the
acquisition date and the maturity date of the securities.
Interest accrued with these securities is entered as income
receivable.
Treasury Bonds issued in national currency are indexed to the
US dollar exchange rate and are consequently subject to currency
updating.The result of the currency updating of the par value of the
security, of the discount and of the accrued interest is therefore
reflected in the income statement of the year in which it occurs.
88
2010
ANNUAL REPORT MILLENNIUM ANGOLA
NOTES TO THE FINANCIAL STATEMENTS
3.2.4. Credit risk provisions
The system described has been in force since March 2008, following Notice nr. 9/2007 of
12 September.With Notice nr. 4/2009 of 18 June, the BNA introduced an alteration to
the classification level due to the follow-on effect (article 3), restricting its scope to
objective criteria.
Therefore, the method of determining provisions for credit extended to
customers is generally in line with the previous year and is described
below.
Provisions for loans and interest
Pursuant to Notice nr. 4/2009, the Bank classifies loan transactions
by increasing order of risk, as per the following classes:
Level A: Zero risk
Level B:Very low risk
Level C: Low risk
Level D: Moderate risk
Level E: High risk
Level F:Very high risk
Level G: Risk of loss
The classification of each loan transaction is reviewed, at least, once a year through a reassessment or reevaluation of
the criteria that determined its initial classification: economic profile and behavioural pattern of the applicant/Customer
and any associated guarantees, as well as their type, quality and amount covered.
The classification of all the credits in the portfolio, or of those whose debtors operate in a certain sector of
economic activity or geographic area, is reviewed whenever the Executive Committee believes there is a risk of
significant change in the economic environment that may affect the risk of the transactions involved.
Notwithstanding the review described in article 4 of the said Notice, the financial institution should review the
classification of each credit every month in the light of the delay in the payment of the instalment of the principal
or of the charges, while, for the purpose of setting up provisions, all loan transactions in respect of a given
Customer are classified under the class of loan with the higher risk.
The loan credit is classified into a level of risk according to the length of time elapsed since it become non-performing,
pursuant to Notice nr. 4/2009, which provides for the following minimum levels:
Risk levels
% of provision
Time since non-performance began
A
B
C
D
E
F
G
0%
up to15 days
1%
15 to
30 days
3%
1 to 2
months
10%
2 to 3
months
20%
3 to 5
months
50%
5 to 6
months
100%
over
6 months
3.2.5. Financial fixed assets
Holdings are carried at acquisition cost subject to exchange revaluation, when stated in foreign currency.
3.2.6.Tangible fixed assets
Tangible fixed assets are entered at the acquisition cost, which includes indispensable additional costs, even if
incurred prior to the deed of sale and purchase, such as notary’s fees, brokerage, tax paid upon acquisition, etc.
89
2010
ANNUAL REPORT MILLENNIUM ANGOLA
NOTES TO THE FINANCIAL STATEMENTS
Depreciation of fixed assets is calculated on a straight-line basis at the maximum allowable for tax purposes, in
keeping with the Industrial Tax Code, which correspond to the following estimated useful life periods:
Description
Years of useful life
Own premises (Buildings)
Leasehold improvements
Equipment:
Furniture and material
Information technology equipment
Fixtures and fittings
Transport material
Machines and tools
50
(*)
10
3
10
3
6 and 7
(*) The Bank depreciates expenditure on works on leased premises according to the respective lease contracts.
3.2.7. Intangible fixed assets
Intangible fixed assets include the cost of the acquisition and development of software, used in data processing,
costs inherent to the constitution, organization, restructuring, expansion and/or modernization of the Bank, the
goodwill paid upon acquisition, improvements made to third party premises and products under development
that can be classified as assets. Intangible fixed assets are entered at acquisition cost and are depreciated linearly
over a period of three years.
The costs incurred in the research stage for the development of new products are not recognised as intangible
assets, but directly as costs in results.
3.2.8.Tax on profits
BMA is subject to IndustrialTax and is considered to be a Group A taxpayer.Taxation of its income is determined
under the terms 1 & 2 from the article 72 of Law nr. 18/92, of 3 July, for which the tax rate applicable is 35%, as
stipulated by Law nr. 5/99, of 6 August.
Tax on profits comprises current tax and deferred tax.Tax on profits are recognised in results, except when it is
related with items that are recognised directly in equity, in which case there is also a counterentry in equity.
Current tax is that which is expected to be paid based on taxable earnings determined pursuant to the tax rules
in force and using the tax rate mentioned above.
Deferred tax assets and liabilities are stated when there is a temporary difference between the value of an asset
or liability and its tax basis. Its value corresponds to the value of the tax recoverable or payable in future periods.
Deferred tax assets and liabilities are calculated based on the tax rates in force for the period in which the
respective asset or liability is expected to be realised.
3.2.9. Reduction in the recoverable value of assets (Impairment)
The Bank periodically evaluates its assets in order to identify assets for which the recoverable value is lower than
their book value.The recognition of the reduction in the book value (impairment) of an asset occurs whenever
its book value is greater than its recoverable value.
In assessing impairment, the Bank takes the following indicators into account:
a) A significant decline in the value of an asset, greater than would be expected in its normal use;
b) Significant changes in the technological, economic or legal environment, which affect the Bank adversely;
c) Increases in interest rates or other market rates that affect discount rates and bring about a consequent
reduction in the present value or in the recoverable value of the assets;
d) The book value of net assets is higher than their market value;
e) There is evidence of obsolescence or loss of physical capacity of an asset;
f) Significant changes in the way an asset is used, such as discontinuity or restructuring, with an adverse effect for
the Bank; and
g) Indication that the economic performance of the asset will be worse than expected.
90
2010
ANNUAL REPORT MILLENNIUM ANGOLA
NOTES TO THE FINANCIAL STATEMENTS
3.2.10. Provisions and contingencies
Provisions are recognised when (i) the Bank has a present, legal or constructive obligation, (ii) it is probable that
its payment will be required and (iii) when a reliable estimate can be made of the value of this obligation.
See Note 14.
3.2.11. Monetary updating
The Financial Statements consider the effect of the modification in the purchasing power of national currency,
based on the Consumer Price Index (CPI), published by the National Statistics Institute (NSI), in the event of a
variation (inflation) of over 100% in the last 3 (three) years, with the correction of the book value of the Fixed
Assets and of the Equity Funds.
3.2.12. Main estimates and uncertainties associated to the application of the accounting policies
The Bank’s accounts include estimates made in uncertain conditions, although no hidden reserves or excessive
provisions have been created or even the inadequate quantification of assets and income or of liabilities and costs.
The principle of prudence imposes choosing the option that results in lower net assets, when other equally valid
options are presented from the use of other accounting principles. It determines the adoption of the lower value
for assets and higher value for liabilities, whenever there are equally valid alternatives for the quantification of
changes in financial position that alter the company’s equity.
In preparing the Financial Statements the Bank made estimates and used assumptions that affect the reported
amounts of the assets and liabilities.These estimates and assumptions are pondered regularly and are based on
diverse factors including expectations concerning future events that are considered reasonable in the circumstances.
Estimates and assumptions were used namely in the significant areas of Provisions for loans granted and Other
Provisions and Current and deferred tax.
4. CASH AND DEPOSITS
On 31 December 2010 and 2009, this heading was broken down as follows:
Thousands AOA
AMOUNTS IN TREASURY
Amounts in treasury – National Currency
Amounts in treasury – Foreign Currency
AMOUNTS IN TRANSIT
Amounts in transit – National Currency
Amounts in transit – Foreign Currency
CASH AND DEPOSITS IN THE CENTRAL BANK
Sight deposits in National Currency
Sight deposits in Foreign Currency
CASH AND DEPOSITS IN FINANCIAL INSTITUTIONS
CASH AND DEPOSITS
91
‘10
‘09
5,547,492
1,883,125
3,664,367
140,029
121,500
18,529
16,245,211
10,367,013
5,878,198
534,410
22,467,141
3,821,013
926,656
2,894,357
274,447
167,549
106,898
12,036,228
12,036,228
143,614
16,275,302
2010
ANNUAL REPORT MILLENNIUM ANGOLA
NOTES TO THE FINANCIAL STATEMENTS
The sight deposits are maintained in the BNA in order to comply with the legal provisions in force regarding the
maintaining of obligatory reserves and are not remunerated.
Since 1 September 2007, when BNA Instruction nr. 04/2007, of 30 August, came into force, mandatory can no
longer be realised through holding Central Bank Securities or Public Debt Securities (15% up to 31 August 2007).
During 2009, in order to address the developments in the macroeconomic environment and to protect the
interests of depositors, BNA revoked this Instruction and introduced the following:
Instruction nr. 1/2009 of 25 February (revoking Instruction nr. 04/2007);
Instruction nr. 3/2009 of 10 April (revoking Instruction nr. 1/2009);
Instruction nr. 8/2009 of 21 May (revoking Instruction nr. 3/2009).
On 4 June 2010, BNA Instruction nr. 03/2010 came into force, which established that mandatory reserves would
be set up in two currencies – AOA for accounts in AOA that make up the taxable basis and USD for accounts
in foreign currency that make up the taxable basis.
The instruction also states that reserves to be set up in national currency are 25%, except for Local Government
deposits, where a rate of 50% is applied, and Central Government deposits, where a rate of 100% is applied.
Reserves in foreign currency are 15%, except for Local Government deposits, where a rate of 0% is applied, and
Central Government deposits, where a rate of 100% is applied.
Assets representing the value of the outlay on loans in national and foreign currency that may be granted under
the specific programmes in the Agriculture, Industry and Housing sectors may also be used to meet the
requirements of mandatory reserves, up to a limit of 5% of the taxable basis.
5. CASH INVESTMENTS
On 31 December 2010 and 2009, this heading corresponded to applications in credit institutions and was broken
down as follows:
Thousands AOA
OPERATIONS ON THE INTERFINANCIAL MARKET MONETARY
Applications in national credit institutions
Applications in credit institutions abroad
GOLD
CASH INVESTMENTS
‘10
‘09
4,216,237
3,958,573
257,664
2,243
4,218,480
4,166,594
4,166,594
2,223
4,168,817
6. SECURITIES
On 31 December 2010 and 2009, this heading was broken down as follows:
Thousands AOA
‘10
National Currency Foreign Currency
Treasury Bills
Central Bank Securities
Treasury Bonds
TOTAL
SECURITIES
7,252,196
8,562,526
7,939,733
23,754,455
5,511,814
5,511,814
29,266,269
National Currency
4,713,812
4,273,405
7,272,601
16,259,818
‘09
Foreign Currency
10,587,224
10,587,224
26,847,042
At the end of 2010, the securities in the available for sale portfolio were all issued by the BNA or by the Angolan
Treasury (as in 2009) and were structured as follows, in accordance with the respective maturities:
92
2010
ANNUAL REPORT MILLENNIUM ANGOLA
NOTES TO THE FINANCIAL STATEMENTS
‘10
Up to 3 months
3 to 6 months
6 months to 1 year
Over 1 year
3,870,169
7,429,055
8,920,624
9,046,421
29,266,269
On 31 December 2009 BMA’s securities portfolio was classified in the category of securities held for trading, while
in 2010 the portfolio was reclassified to the category of securities available for sale.This reclassification had no
impact in terms of results.
The reclassification was due to the fact that BMA does not habitually trade with its portfolio of securities and, in
substance, these are not effectively trading securities.
On 31 December 2010, the portfolio of securities in AOA was detailed as follows, by index and rate:
Thousands AOA
ISIN
Description
AOTNOC215U09
AOTNIC224U09
AOTNIC209LA9
AOTNIC222L09
OT ANGOLA 3 PCT
OT ANGOLA 3 PCT
OT ANGOLA 3 PCT
OT ANGOLA 3 PCT
AOTNOL048A09
AOTNTX417U09
AOTNTX324D10
AOTNTX424D10
AOTNTX524D10
AOTNOIC40210
AOTNON0302A8
AOTNON0303A8
AOTNON030408
AOTNON030508
AOTNOTN04NV5
AOTNOTN04NV7
AOTNON04AC08
AOTNOTN04NV9
AOTNON04AC10
AOTNON0402A8
AOTNON0403A8
AOTNON040408
AOTNON040508
AOTNOTN05NV5
AOTNOTN05NV7
AOTNON05AC08
AOTNOTN05NV9
AOTNON05AC10
AOTNON0502A8
AOTNON0503A8
AOTNON050408
AOTNON050508
AOTNOTN06NV5
AOTNOTN06NV7
AOTNON06AC08
AOTNOTN06NV9
AOTNON06AC10
AOTNON0602A8
OT ANGOLA 08/08.04.2013
OTMN ANGOLA 09/17.06.2013
OTMN ANGOLA 10/24.12.2013
OTMN ANGOLA 10/24.12.2014
OTMN ANGOLA 10/24.12.2015
OTMN ANGOLA 10/15.02.2014 A
OTNOVA LIFE ANGOLA 08/15.02.2011
OTNOVA LIFE ANGOLA 07/15.03.2011
OTNOVA LIFE ANGOLA 08/15.04.2011
OTNOVA LIFE ANGOLA 07/15.05.2011
OTNOVA LIFE ANGOLA 07/15.06.2011
OTNOVA LIFE ANGOLA 07/15.08.2011
OTNOVA LIFE ANGOLA 07/15.09.2011
OTNOVA LIFE ANGOLA 07/15.10.2011
OTNOVA LIFE ANGOLA 07/15.11.2011
OTNOVA LIFE ANGOLA 08/15.02.2012
OTNOVA LIFE ANGOLA 07/15.03.2012
OTNOVA LIFE ANGOLA 08/15.04.2012
OTNOVA LIFE ANGOLA 07/15.05.2012
OTNOVA LIFE ANGOLA 07/15.06.2012
OTNOVA LIFE ANGOLA 07/15.08.2012
OTNOVA LIFE ANGOLA 07/15.09.2012
OTNOVA LIFE ANGOLA 07/15.10.2012
OTNOVA LIFE ANGOLA 07/15.11.2012
OTNOVA LIFE ANGOLA 08/15.02.2013
OTNOVA LIFE ANGOLA 07/15.03.2013
OTNOVA LIFE ANGOLA 08/15.04.2013
OTNOVA LIFE ANGOLA 07/15.05.2013
OTNOVA LIFE ANGOLA 07/15.06.2013
OTNOVA LIFE ANGOLA 07/15.08.2013
OTNOVA LIFE ANGOLA 07/15.09.2013
OTNOVA LIFE ANGOLA 07/15.10.2013
OTNOVA LIFE ANGOLA 07/15.11.2013
OTNOVA LIFE ANGOLA 08/15.02.2014
09/15.06.2011
09/15.06.2011
09/15.06.2011
09/15.07.2011
Index
Nominal amount
Rate
CPI
CPI
CPI
CPI
1,241,680.60
1,225,290.42
1,219,082.01
567,735.47
4,253,788.50
609,795.32
10,661.57
1,338,490.29
803,094.17
535,396.12
176,031.75
2,665.39
2,665.39
2,665.39
2,665.39
2,665.39
2,665.39
2,665.39
2.665.39
2,665.39
2,665.39
2,665.39
2,665.39
2,665.39
2,665.39
2,665.39
2,665.39
2,665.39
2,665.39
2,665.39
2,665.39
2,665.39
2,665.39
2,665.39
2,665.39
2,665.39
2,665.39
2,665.39
2,665.39
4.2819
4.2819
4.2819
18.4755
USD
USD
USD
USD
USD
USD
USD
USD
USD
USD
USD
USD
USD
USD
USD
USD
USD
USD
USD
USD
USD
USD
USD
USD
USD
USD
USD
USD
USD
USD
USD
USD
USD
USD
5.4631
6.4563
7.0000
7.0000
7.0000
4.0000
2.5941
2.4872
2.4550
2.4428
2.4563
2.5941
2.4872
2.4550
2.4428
2.5941
2.4872
2.4550
2.4428
2.4563
2.5941
2.4872
2.4550
2.4428
2.5941
2.4872
2.4550
2.4428
2.4563
2.5941
2.4872
2.4550
2.4428
2.5941
continues
93
2010
ANNUAL REPORT MILLENNIUM ANGOLA
NOTES TO THE FINANCIAL STATEMENTS
Thousands AOA
continuation
ISIN
Description
Index
Nominal amount
Rate
AOTNON0603A8
AOTNON060408
AOTNON060508
AOTNOTN07NV5
AOTNOTN07NV7
AOTNON07AC08
AOTNOTN07NV9
AOTNON07AC10
AOTNON0702A8
AOTNON0703A8
AOTNON070408
AOTNON070508
AOTNON04AC02
AOTNOTN04NV2
AOTNOTN04NV3
AOTNOTN04NV4
AOTNOTN04NV6
AOTNON05AC02
AOTNOTN05NV2
AOTNOTN05NV3
AOTNOTN05NV4
AOTNOTN05NV6
AOTNON06AC02
AOTNOTN06NV2
AOTNOTN06NV3
AOTNOTN06NV4
AOTNOTN06NV6
AOTNON07AC02
AOTNOTN07NV2
AOTNOTN07NV3
AOTNOTN07NV4
AOTNOTN07NV6
OTNOVA LIFE ANGOLA 07/15.03.2014
OTNOVA LIFE ANGOLA 08/15.04.2014
OTNOVA LIFE ANGOLA 07/15.05.2014
OTNOVA LIFE ANGOLA 07/15.06.2014
OTNOVA LIFE ANGOLA 07/15.08.2014
OTNOVA LIFE ANGOLA 07/15.09.2014
OTNOVA LIFE ANGOLA 07/15.10.2014
OTNOVA LIFE ANGOLA 07/15.11.2014
OTNOVA LIFE ANGOLA 08/15.02.2015
OTNOVA LIFE ANGOLA 07/15.03.2015
OTNOVA LIFE ANGOLA 08/15.04.2015
OTNOVA LIFE ANGOLA 07/15.05.2015
OTNOVA LIFE ANGOLA 07/15.02.2011
OTNOVA LIFE ANGOLA 08/15.03.2011
OTNOVA LIFE ANGOLA 07/15.04.2011
OTNOVA LIFE ANGOLA 08/15.05.2011
OTNV ANGOLA 07/15.07.2011
OTNOVA LIFE ANGOLA 07/15.02.2012
OTNOVA LIFE ANGOLA 08/15.03.2012
OTNOVA LIFE ANGOLA 07/15.04.2012
OTNOVA LIFE ANGOLA 08/15.05.2012
OTNV ANGOLA 07/15.07.2012
OTNOVA LIFE ANGOLA 07/15.02.2013
OTNOVA LIFE ANGOLA 08/15.03.2013
OTNOVA LIFE ANGOLA 07/15.04.2013
OTNOVA LIFE ANGOLA 08/15.05.2013
OTNV ANGOLA 07/15.07.2013
OTNOVA LIFE ANGOLA 07/15.02.2014
OTNOVA LIFE ANGOLA 08/15.03.2014
OTNOVA LIFE ANGOLA 07/15.04.2014
OTNOVA LIFE ANGOLA 08/15.05.2014
OTNV ANGOLA 07/15.07.2014
USD
USD
USD
USD
USD
USD
USD
USD
USD
USD
USD
USD
USD
USD
USD
USD
USD
USD
USD
USD
USD
USD
USD
USD
USD
USD
USD
USD
USD
USD
USD
USD
2.4872
2.4550
2.4428
2.4563
2.5941
2.4872
2.4550
2.4428
2.5941
2.4872
2.4550
2.4428
2.5941
2.4872
2.4550
2.4428
2.7331
2.5941
2.4872
2.4550
2.4428
2.7331
2.5941
2.4872
2.4550
2.4428
2.7331
2.5941
2.4872
2.4550
2.4428
2.7331
AOTNBT425N10
AOTNBT518N10
AOTNBT610N10
AOTNBT618N10
AOTNBT609D10
AOBCTB507L10
AOBCTB624F10
AOBCTB603M10
AOBCTB617M10
AOBCTB612I10
AOBCTB616U10
AOBCTB601S10
AOBCTB615S10
BT ANGOLA 10/24.02.2011
BT ANGOLA 10/19.05.2011
BT ANGOLA 10/09.11.2011
BT ANGOLA 10/17.11.2011
BT ANGOLA 10/08.12.2011
TBC ANGOLA 10/05.01.2011
TBC ANGOLA 10/23.02.2011
TBC ANGOLA 10/02.03.2011
TBC ANGOLA 10/16.03.2011
TBC ANGOLA 10/11.05.2011
TBC ANGOLA 10/15.06.2011
TBC ANGOLA 10/31.08.2011
TBC ANGOLA 10/14.09.2011
2,665.39
2,665.39
2,665.39
2,665.39
2,665.39
2,665.39
2,665.39
2,665.39
2,665.39
2,665.39
2,665.39
2,665.39
5,214.90
2,665.39
2,665.39
2,665.39
2,665.39
5,214.90
2,665.39
2,665.39
2,665.39
2,665.39
5,214.90
2,665.39
2,665.39
2,665.39
2,665.39
5,214.90
2,665.39
2,665.39
2,665.39
2,665.39
3,643,590.76
162,448.00
2,119,600.00
569,800.00
2,849,000.00
2,276,000.00
250.00
1,091,000.00
546,000.00
2,181,216.00
1,240,000.00
605,000.00
1,210,000.00
2,418,731.00
17,269,045.00
25,166,424.26
94
11.2286
11.8818
13.7964
13.7428
13.5344
15.7936
17.9197
17.9224
17.9224
23.6207
20.7012
20.7065
20.7065
2010
ANNUAL REPORT MILLENNIUM ANGOLA
NOTES TO THE FINANCIAL STATEMENTS
On 31 December 2010, the portfolio of securities in USD was detailed as follows, without index and with the
following rate:
Thousands USD
ISIN
Description
Index
AOTNOTR05RN0
AOTNOTR05RN1
AOTNOTT06OT7
AOTNOTT06OT6
AOTNOTC08OC1
AOTNOTC09OC1
AOTNOTC10OC1
AOTNOC110408
AOTNOTP09OP1
AOTNOTP09OP2
AOTNOTP10OP1
AOTNOTP10OP2
AOTNOTP11OP1
AOTNOTP11OP2
AOTNOTP12OP1
AOTNOTP12OP2
AOTNOTP08OP1
ANGOLA GOVT 07/15.11.2012
ANGOLA GOVT 07/15.11.2012
OT ANGOLA 05/15.05.2012
OT ANGOLA 05/15.11.2011
OT ANGOLA 07/15.07.2015
OT ANGOLA 07/15.10.2015
OT ANGOLA 08/15.01.2018
OT ANGOLA 08/15.04.2019
OT ANGOLA 07/15.05.2016
OT ANGOLA 07/15.06.2016
OT ANGOLA 07/15.07.2017
OT ANGOLA 07/15.08.2017
OT ANGOLA 07/15.09.2018
OT ANGOLA 07/15.10.2018
OT ANGOLA 07/15.11.2019
OT ANGOLA 07/15.12.2019
OT ANGOLA 07/15.04.2015
Nominal amount
Rate
40,000.00
10,000.00
400.00
600.00
1,320.00
1,320.00
1,310.00
1,310.00
300.00
300.00
300.00
300.00
300.00
300.00
300.00
300.00
600.00
59,260.00
3.6928
3.6928
4.9828
4.9428
3.4831
3.2050
3.4831
3.2050
3.6428
3.6563
3.9331
3.7941
3.6872
3.6550
3.6428
3.6563
3.6550
The policy for investment in securities adopted by BMA is adapted to the situation of the Angolan market,
focussing on public debt securities and Central Bank securities, using criteria geared towards profitability,
maintaining a close control of risks, namely the liquidity and market risks.
7. LOANS
On 31 December 2010 and 2009, this heading was broken down as follows:
Thousands AOA
‘10
OVERDRAFTS
Companies
Individuals
CREDIT
Companies
Individuals
CARD
Companies
Individuals
TOTAL
GROSS LOANS TO CUSTOMERS
(NATIONAL CURRENCY+
FOREIGN CURRENCY)
LOAN LOSS PROVISION
NET LOANS TO CUSTOMERS
(NATIONAL CURRENCY+
FOREIGN CURRENCY)
‘09
National Currency Foreign Currency
National Currency
Foreign Currency
2,814,586
152,100
2,966,686
334,385
27,475
361,860
1,620,896
108,882
1,729,778
1,669,385
14,723
1,684,108
3,220,146
2,508,838
5,728,984
39,818,177
7,348,923
47,167,100
631,982
89,713
721,695
29,937,499
6,503,005
36,440,504
108,886
237,454
346,340
9,042,010
0
47,528,960
32,512
122,853
155,365
2,606,838
0
38,124,612
95
56,570,970
-2,780,078
40,731,450
-1,253,917
53,790,892
39,477,533
2010
ANNUAL REPORT MILLENNIUM ANGOLA
NOTES TO THE FINANCIAL STATEMENTS
On 31 December 2010, the structure of outstanding loans and advances in the portfolio was as follows, by
maturity and sector of activity:
Thousands AOA
Sector of activity
Construction
Other Activities of Collective,
Social and Personal Services
Consumer Credit
Retail Trade
Manufacturing Industries
Wholesale Trade
Other
Up to 6 months
6 to 12 months
1 to 5 years
Over 5 years
Total
6,307,401
1,344,979
4,815,448
459,470
12,927,298
5,967,857
911,808
3,698,333
1,383,946
2,635,789
2,890,046
23,795,180
2,093,028
1,724,488
291,496
52,702
116,405
453,424
6,076,521
2,717,578
4,913,233
1,231,477
3,143,139
1,213,668
2,913,931
20,948,474
177,566
1,140,667
1,086,425
0
45,547
1,358,202
4,267,877
10,956,029
8,690,196
6,307,731
4,579,787
4,011,409
7,615,603
55,088,052
With regard to the credit risk, on 31 December 2010, the breakdown of the Bank’s portfolio is as follows:
Thousands AOA
Degree of risk
A
B
C
D
E
F
G
Performing
loans and advances
Past-due loans
Interest
Total
% provision
Provisions
180,454
26,768,284
25,462,163
375,884
1,140,035
578,919
582,314
55,088,052
0
3,084
136,122
58,090
397,552
89,434
418,887
1,103,169
107
36,883
75,537
8,579
42,179
18,892
75,745
257,922
180,561
26,859,079
25,718,822
452,553
1,579,766
687,245
1,092,945
56,570,970
0%
1%
3%
10%
20%
50%
100%
262,591
762,711
43,255
305,953
337,622
1,067,945
2,780,078
On 31 December 2010 the credit portfolio had the following weighted average rates:
Average rates
‘10
Overdraft
23%
Credit
11%
Card
35%
Throughout 2010 the total amount of 86,367 thousand AOA was written down from active loans, which were
fully hedged by loan provisions.
The value of the doubtful debtors provision set up and used during the year is in Note 14.
96
2010
ANNUAL REPORT MILLENNIUM ANGOLA
NOTES TO THE FINANCIAL STATEMENTS
On 31 December 2010, the credit portfolio was broken down as follows, by province:
CREDIT BY MUNICIPALITY
Thousands AOA
Code
Description
0500
1000
1500
2000
2525
3000
3500
4000
4500
5000
5500
6000
6500
7500
8000
8500
9000
Bengo
Benguela
Bié
Cabinda
Cuito
Cunene
Huambo
Huila
North Kwanza
South Kwanza
Luanda
Malanje
Namibe
North Luanda
South Luanda
Uíge
Zaire
Amount
379,382.47
4,960,068.29
497,927.80
237,859.46
1,386.65
9,366.43
748,157.72
192,037.03
2,339.33
65,359.92
49,256,388.83
5,578.88
29,631.85
1,354.19
6,645.76
4,783.91
172,701.96
56,570,970.47
8. FINANCIAL FIXED ASSETS
On 31 December 2010 and 2009, this heading was broken down as follows:
Thousands AOA
Banco Privado do Atlântico (BPA)
Angolan Stock Exchange
EMIS
Millennium Atlântico Academy
Other Financial Fixed Assets
‘10
‘09
1,977,206
27,793
50,070
13,695
10,064
2,078,828
1,907,950
26,820
38,662
0
8,943
1,982,375
A 10% stake in BPA was acquired during 2009 for a consideration of 21,342 thousand USD.
During 2010, BMA monitored the capital increase of EMIS, subscribing 108,000 USD in this increase.
Also during 2010, BMA was one of the founding partners of the Millennium Atlântico Academy, where it has a
33% holding, together with Sonangol, BPA and individualshareholders.The objective of the Academy is to provide
top quality training to the management staff of the shareholder companies, thereby contributing to the training
of highly qualified Angolan managers.This participation is kept at acquisition cost given its immateriality and due
to the fact that it still has not closed its accounts for 2010.
97
2010
ANNUAL REPORT MILLENNIUM ANGOLA
NOTES TO THE FINANCIAL STATEMENTS
9. INTANGIBLE AND TANGIBLE FIXED ASSETS,AND FIXED ASSETS IN
PROGRESS
Due to the coming into force of the new Financial Institutions Accounting Plan – CONTIF, there were some
alterations in terms of the classification of fixed assets.
The more relevant changes have to do with the transfer of works on leased premises, of tangible fixed assets
moving over to intangible fixed assets and the fact that there were now no intangible fixed assets in progress.
As a result of the changes introduced by the CONTIF, there was a need to reclassify the assets referring to works
on leased premises, which came to a net amount of 1,816,000 kwanzas in 2010, of tangible fixed assets moving
over to intangible fixed assets and transferring intangible fixed assets in progress to intangible fixed assets, which
amounted to 377 million kwanzas in 2010.
During 2010, the movement in tangible and intangible fixed assets and fixed assets in progress was as shown in
the table below:
Thousands AOA
TOTAL INTANGIBLE FIXED ASSETS
Key money
Deferred costs
Automatic data processing system
Works on leased premises
Advances on fixed assets
Other
TOTAL TANGIBLE FIXED ASSETS
Tangible fixed assets, buildings and land
Real estate major repairs
and improvements
Furniture and material
Machines and tools
Computer equipment
Transport material
Other
TOTAL FIXED ASSETS IN PROGRESS
Fixed assets in progress –
Intangible fixed assets
Fixed assets in progress –
Fixed assets for own use
Other
TOTAL TANGIBLE AND
INTANGIBLE FIXED ASSETS
‘09
Additions
Write-offs/
adjustments
Transfers
‘10
Accum.
depreciation
Net value
‘10
2,568,646
93,372
118,212
326,779
1,566,453
393,082
70,748
2,615,433
317,278
1,723,461
332,796
162,889
115,327
522,681
589,768
0
1,826,856
491,754
-366,612
0
0
0
-39,930
-326,682
0
-122,160
0
-1,994
0
0
13,813
263,382
-281,629
2,440
743,791
96,300
3,923,501
426,168
281,101
455,919
2,312,586
374,539
70,748
5,063,920
905,332
789,458
0
89,428
145,767
496,677
0
57,586
696,961
22,909
3,134,043
426,168
191,673
310,152
1,815,909
374,539
15,602
4,366,959
882,423
1,029,022
176,768
335,796
204,126
240,004
312,439
1,299,474
519,951
103,265
79,411
194,125
168,319
270,031
1,077,173
0
0
-98,536
0
-23,392
-232
-5,083
615,032
-4,277
0
28,699
0
8,037
-741,797
2,164,005
275,756
316,671
426,950
384,931
590,275
1,629,767
67,714
44,311
135,908
176,654
181,397
68,068
0
2,096,291
231,445
180,763
250,296
203,534
522,207
1,629,767
0
16,253
0
-16,253
0
0
0
1,108,101
191,373
533,396
527,524
-5,083
0
-344,432
-381,112
1,291,982
337,785
0
0
1,291,982
337,785
6,483,553
4,627,490
-493,855
0
10,617,188
1,486,419
9,130,769
98
2010
ANNUAL REPORT MILLENNIUM ANGOLA
NOTES TO THE FINANCIAL STATEMENTS
Thousands AOA
TOTAL INTANGIBLE FIXED ASSETS
Key money
Deferred costs
Automatic data processing system
Other
Works on leased premises
Advances on fixed assets
TOTAL TANGIBLE FIXED ASSETS
Tangible fixed assets, buildings
Real estate major repairs
and improvements
Machines and tools
Transport material
Other
TOTAL FIXED ASSETS IN PROGRESS
Fixed assets in progress –
Fixed assets for own use
Other
TOTAL FIXED ASSETS
‘08
Additions
Write-offs/
adjustments
Transfers
‘09
Accum.
depreciation
Net value
‘09
1,263,143
0
0
13,951
60,838
1,188,354
0
1,385,934
130,748
1,000,894
93,372
118,212
237,508
0
280,163
271,639
852,158
148,345
-1,144
0
0
-1,144
0
0
0
0
0
305,754
0
0
76,463
9,911
97,937
121,443
377,341
0
2,568,646
93,372
118,212
326,779
70,748
1,566,453
393,082
2,615,433
279,093
394,418
0
21,058
16,937
51,473
304,950
0
367,271
12,249
2,174,228
93,372
97,154
309,842
19,276
1,261,503
393,082
2,248,163
266,844
606,762
83,023
159,477
405,924
414,914
123,470
252,773
39,431
288,139
1,567,655
0
0
0
0
0
298,790
0
41,096
37,455
-683,095
1,029,022
335,796
240,004
731,518
1,299,474
27,556
62,680
128,141
136,645
0
1,001,467
273,115
111,863
594,874
1,299,474
1,108,101
142,583
1,295,938
0
-330,420
1,108,101
0
272,331
271,717
0
-352,675
191,373
0
191,373
3,063,991
3,420,706
-1,144
0
6,483,554
761,689
5,721,865
10. OTHER ASSETS
On 31 December 2010 and 2009, this heading was broken down as follows:
Thousands AOA
CREDITS IN THE PAYMENTS SYSTEM
EXCHANGE TRANSACTIONS
Purchase of currency
National currency
Foreign currency
Other
OTHER AMOUNTS
Expenses with deferred costs
Software licensing and maintenance
Insurance
Rentals and leases
Diverse
Cash differences
Other
Other debtors
OTHER ASSETS
‘10
‘09
11,849
1,457,091
277,679
389,414
504,518
938,252
14,321
383,444
5,970
0
10,555
58,224
238,820
11,529
319,128
59,696
86,252
683,192
1,148,268
2,617,208
5,385
18,917
179,500
8,130
211,932
76,690
59,021
680,798
1,028,440
1,695,533
It should be noted that the amount referring to Cash differences is covered by a provision of mAOA 8,327 and
Other debtors is covered by a provision of mAOA 289,266.
99
2010
ANNUAL REPORT MILLENNIUM ANGOLA
NOTES TO THE FINANCIAL STATEMENTS
11. DEPOSITS
On 31 December 2010 and 2009, the heading of sight deposits of customers was broken down as follows:
Thousands AOA
‘10
SIGHT DEPOSITS – RESIDENTS
Public sector
Private sector
SIGHT DEPOSITS – NON-RESIDENTS
SIGHT DEPOSITS
National Currency
Foreign Currency
59,529
18,596,681
18,656,210
54,728
18,710,938
92,714
19,681,398
19,774,112
158,580
19,932,692
38,643,630
‘09
National Currency Foreign Currency
88,196
10,096,068
10,184,264
20,006
10,204,271
119,810
18,088,486
18,208,296
179,917
18,388,213
28,592,484
On 31 December 2010 and 2009, the term deposits of customers was structured as follows, by currency and
type:
Thousands AOA
‘10
TERM DEPOSITS – RESIDENTS
Public sector
Private sector
TERM DEPOSITS – NON-RESIDENTS
TERM DEPOSITS
National Currency
Foreign Currency
13,437,724
13,437,724
229,227
13,666,951
33,360,565
19,316,478
19,316,478
377,135
19,693,613
‘09
National Currency Foreign Currency
285,732
15,554,422
15,840,154
252,085
16,092,240
10,130,358
10,130,358
21,290
10,151,648
26,243,888
On 31 December 2010 and 2009, the term deposits of customers in the portfolio was structured as follows, by
maturity:
Thousands AOA
Maturity period
Up to 3 months
3 to 6 months
6 months to 1 year
Over 1 year
100
‘10
‘09
21,531,674
8,146,438
3,682,453
0
33,360,565
21,645,632
3,206,789
1,390,820
646
26,243,888
2010
ANNUAL REPORT MILLENNIUM ANGOLA
NOTES TO THE FINANCIAL STATEMENTS
12. FUNDING FOR LIQUIDITY
On 31 December 2010 and 2009, these headings were broken down as follows:
Thousands AOA
‘10
National Currency
VERY SHORT-TERM
Funding in national credit institutions
Funding in credit institutions abroad
Sale operations with
repurchase agreement
TERM
Funding in credit national institutions
Funding in credit institutions abroad
Sale operations with
repurchase agreement
Foreign Currency
‘09
National Currency Foreign Currency
-
3,151,674
300,182
-
23,415
0
3,151,674
300,182
23,415
-
1,411,879
24,907,320
-
23,471,673
0
26,319,199
29,470,873
0
56,925
23,528,698
23,852,195
13.OTHER LIABILITIES
On 31 December 2010 and 2009, these headings were broken down as follows:
Thousands AOA
‘10
National Currency
BONDS IN THE PAYMENTS SYSTEM
Bankers cheques
Certified cheques
Payment orders payable
EXCHANGE TRANSACTIONS
Sale of currency
OTHER BONDS
Tax
Accrual of costs
Other
54,341
71,242
524,518
650,101
1,418,009
Foreign Currency
767,908
767,908
‘09
National Currency Foreign Currency
43,562
122,100
437,389
603,051
1,277,771
674,720
674,720
0
500,377
500,377
500,377
743
743
374,562
373,819
373,819
524,978
1,268,839
416,739
2,210,556
2,566,105
5,465
210,058
140,026
355,549
31,987
648,797
393,608
1,074,392
1,418,019
2,512
191,329
149,786
343,627
OTHER LIABILITIES
4,484,491
101
3,070,352
2010
ANNUAL REPORT MILLENNIUM ANGOLA
NOTES TO THE FINANCIAL STATEMENTS
The heading “Accrual of costs” which at the end of 2010 amounted to around mAOA 1,478,897 relates to:
Thousands AOA
Rent payable
542
Assistance contracts
247
Costs payable to staff
451
14. PROVISIONS
Thousands AOA
Credit – Risk levels (Note 7)
Guarantees, acceptances, overdrafts, etc.
Sundry risks
Retirement/surviving relative pensions
Balance on
31/12/2009
Increase
‘10
Written back/
Cancellation
Used
Balance on
31/12/2010
1,253,917
93,718
169,824
62,177
1,579,636
1,612,529
91,685
229,793
8,174
1,942,182
-45,606
-20,316
-65,922
-86,368
-81,708
-168,076
2,780,078
139,798
297,593
70,351
3,287,820
Balance on
31/12/2009
Increase
‘09
Written back/
Cancellation
Used
Balance on
31/12/2010
637,770
20,654
47,479
705,903
756,500
80,159
169,824
14,698
1,021,181
-140,353
-7,095
(147,448)
-
1,253,917
93,718
169,824
62,177
1,579,636
Thousands AOA
Risk levels (Note 8)
Guarantees, acceptances, overdrafts, etc.
Sundry risks
Retirement/surviving relative pensions
On 31 December 2010 and 2009, the balance of the heading “Provision for retirement/surviving relative pensions”
is to cover the Bank’s possible liabilities with the indemnity payable to Employees on their retirement date.
The increase in 2010 in “Retirement/surviving relative pensions” of mAOA 8,175 includes an amount of
mAOA 2,293, around 28%, resulting from revaluation exchange.
Provisions for risk levels are made in accordance with the accounting principles described in note 3 c).
The provision for sundry risks is intended to cover estimated charges and potential losses arising from the Bank’s
business.
102
2010
ANNUAL REPORT MILLENNIUM ANGOLA
NOTES TO THE FINANCIAL STATEMENTS
15. ISSUED CAPITAL AND CHANGES IN EQUITY
The movement in equity funds in the years ended on 31 December 2010 and 2009 was the following:
Thousands AOA
BALANCE ON 31/12/2009
Transfers of 2009 net income
Increases in capital in 2010
Net income for the year
BALANCE ON 31/12/2010
BALANCE ON 31/12/2008
Transfers of 2008 net income
Increases in capital in 2009
Net income for the year
BALANCE ON 31/12/2009
Capital
Legal
reserves
Other
reserves
Issue
premiums
Profit (loss)
for the year
Total
net
3,809,399
247,990
317,965
2,227,787
1,271,860
6,208,829
1,589,825
(1,589,825)
565,955
161,386
86,604
247,990
3,499,647
1,881,377
346,410
2,227,787
6,208,829
6,208,829
6,208,829
14,083,830
3,018,457
17,102,287
4,484,734
8,009,271
1,589,825
14,083,830
3,809,399
2,008,957
1,800,442
3,809,399
3,018,457
3,018,457
433,014
-433,014
1,589,825
1,589,825
By the unanimous decision of the General Meeting of 8 April 2010 it was decided to make the following
appropriation of profits:
mAOA 317,965 to the Legal Reserve;
mAOA 1,271,860 to Free Reserves.
CAPITAL
The amount recorded under equity capital corresponds to the amount of direct investment made by the
Shareholders. On 15 May 2008, the partnership agreement was concluded between Group Millennium bcp, the
Angolan state oil company Sonangol and Banco Privado Atlântico, S.A. (BPA), which called for the latter entities
to acquire holdings in Banco Millennium Angola (BMA), and for BMA to acquire a 10% holding in BPA.
On 31 December 2010, the Bank’s shareholder structure was as follows:
‘10
Millennium bcp
Sonangol
BPA
Nr. of shares
%
5,000,000
2,984,032
1,497,006
9,481,038
52.70
31.50
15.80
100.00
LEGAL RESERVE
Pursuant to current legislation, the Bank must set aside a legal reserve fund until it equals its equity capital.
For this purpose, a minimum of 20% is of the previous year’s net profit is transferred to this reserve each year.
This reserve may only be used to cover accumulated losses when all other reserves have been exhausted.
103
2010
ANNUAL REPORT MILLENNIUM ANGOLA
NOTES TO THE FINANCIAL STATEMENTS
16.TAX
The Bank is subject to Industrial Tax and, for tax purposes, it is considered as a Group A taxpayer.Taxation of its
income is determined under the terms 1 & 2 from the article 72 of Law nr. 18/92, of 3 July, for which the tax rate
applicable is 35%, as stipulated by Law nr. 5/99, of 6 August (Note 3 h)).
On 31 December 2010 and 2009, the determination of industrial tax can be broken down as follows:
Thousands AOA
PRE-TAX PROFITS
Tax benefits
Monetary instruments to be added
TAXABLE INCOME
Nominal tax rate
Tax losses reported
CURRENT TAX
NET INCOME FOR THE YEAR
‘10
‘09
3,495,868
-1,806,816
18,918
1,707,970
35,00%
597,789
-120,378
477,411
3,018,457
1.589.825
-1,814,633
24,779
-200,028
35.00%
1,589,825
The tax benefits identified above respect to interest on debt public securities (Treasury Bonds and Treasury Bills
issued by the State) which, since they are covered by Regulatory Decrees 51/03 and 52/03, of 8 July, are exempt
from Industrial Tax.
So, in determining the taxable profits for the years ended on 31 December 2010 and 2009, this income is
deducted from the pre-tax profit.
In January 2011, Banco Millennium Angola asked, under article 47 of the Industrial Tax Code, to be granted the
deduction of the taxable profits used in reserves and totally reinvested within the terms and for the reasons
provided for in the legislation.
17. BALANCES AND TRANSACTIONS WITH RELATED ENTITIES
On 31 December 2010 and 2009, the main balances and transactions with related entities were as follows:
Thousands AOA
CASH AND DEPOSITS (NOTE 4)
Millennium bcp
APPLICATIONS OF LIQUIDITY (NOTE 5)
Millennium bcp
BPA
FUNDING FOR LIQUIDITY (NOTE 12)
Millennium bcp
OTHER LIABILITIES (NOTE 13)
Staff costs
Provision of services
104
‘10
‘09
241,362
143,614
257,664
1,757,518
2,015,182
4,166,594
4,166,594
27,964,567
23,495,088
21,244
293,825
315,069
31,576
266,654
298,230
2010
ANNUAL REPORT MILLENNIUM ANGOLA
NOTES TO THE FINANCIAL STATEMENTS
The balances presented in the heading “Other liabilities” relate to transactions with the Millennium bcp Group.
18. BALANCE BY CURRENCY
On 31 December 2010 and 2009, the Bank’s balances by currency were broken down as follows:
110
12010
12040
13020
150
160
17010
17090
180
190
21010
21020
22010
250
260
280
290
410
430
440
Cash and deposits
Operations on the Interbank
Money Market
Applications in gold and
other precious metals
Available for sale
Credits in the payments system
Exchange transactions
Credits
(-) Provision for bad debts
Other amounts
Fixed assets
TOTAL ASSETS
Sight deposits
Term deposits
Operations on the Interbank
Money Market
Bonds in the payments system
Exchange transactions
Other bonds
Provisions for probable liabilities
TOTAL LIABILITIES
Share capital
Reserves and funds
Potential results
TOTAL EQUITY FUNDS
TOTAL LIABILITIES +
EQUITY FUNDS
AOA
USD
‘10
EUR
Other
Total
12,664,686
9,159,603
578,873
63,980
22,467,141
2,201,055
1,757,518
257,664
0
4,216,237
2,243
20,124,337
6,134
504,518
9,042,010
-2,780,078
376,545
9,144,465
51,285,915
18,710,938
13,666,951
0
9,141,932
4,133
938,252
47,465,231
0
753,309
2,065,041
71,285,019
17,971,351
18,480,512
0
0
1,582
14,320
63,729
0
18,414
92
934,674
1,959,547
1,213,102
0
0
0
0
0
0
0
0
63,980
1,795
0
2,243
29,266,269
11,849
1,457,091
56,570,970
-2,780,078
1,148,268
11,209,598
123,569,588
38,643,630
33,360,565
0
650,101
0
2,210,556
437,391
35,675,937
3,809,399
10,274,431
3,018,457
17,102,287
29,465,963
480,044
481,293
355,527
70,352
67,305,042
0
0
0
0
0
287,864
15,323
22
0
3,475,858
0
0
0
0
4,910
0
3,761
0
0
10,466
0
0
0
0
29,470,873
1,418,009
500,377
2,566,105
507,742
106,467,301
3,809,399
10,274,431
3,018,457
17,102,287
52,778,224
69,560,597
3,475,858
10,466
123,569,588
105
2010
ANNUAL REPORT MILLENNIUM ANGOLA
NOTES TO THE FINANCIAL STATEMENTS
110
12010
12040
13010
150
160
17010
17090
180
190
21010
21020
22010
250
260
27080
280
290
410
430
440
Cash and deposits
Operations on the Interbank
Money Market
Applications in gold and other
precious metals
Portfolio trading
Credits in the payments system
Exchange transactions
Credits
(-) Provision for bad debts
Other amounts
Fixed assets
TOTAL ASSETS
Sight deposits
Term deposits
Operations on the Interbank
Money Market
Sale operations of securities with
repurchase agreement
Bonds In the payments system
Exchange transactions
Other funding
Other bonds
Provisions for probable liabilities
TOTAL LIABILITIES
Share capital
Reserves and funds
Potential results
TOTAL EQUITY FUNDS
TOTAL LIABILITIES +
EQUITY FUNDS
AOA
USD
‘09
EUR
Other
Total
13,130,433
2,643,779
353,659
147,431
16,275,302
0
0
4,166,594
0
4,166,594
2,223
16,259,818
201,949
383,444
2,606,840
-1,253,917
354,046
5,721,865
37,406,703
10,204,271
10,151,648
0
10,587,224
58,037
4,528
38,105,265
0
662,251
1,982,279
54,043,363
14,539,875
15,164,646
0
0
17,693
128
19,345
0
12,143
96
4,569,658
3,846,784
927,593
0
0
0
1,314
0
0
0
0
148,745
1,553
0
2,223
26,847,042
277,679
389,414
40,731,450
-1,253,917
1,028,440
7,704,240
96,168,467
28,592,484
26,243,888
300,183
23,484,855
6,023
4,209
23,795,270
0
603,051
743
0
1,074,392
263,541
22,597,829
3,809,399
8,684,606
1,589,825
14,083,809
56,925
543,854
2,606
0
331,706
62,177
54,186,644
0
0
0
0
0
130,510
371,213
0
11,921
0
5,294,044
0
0
0
0
0
356
0
0
0
0
6,118
0
0
0
0
56,925
1,277,771
374,562
0
1,418,019
325,718
82,084,637
3,809,399
8,684,606
1,589,825
14,083,830
36,681,638
54,186,644
5,294,044
6,118
96,168,467
106
2010
ANNUAL REPORT MILLENNIUM ANGOLA
NOTES TO THE FINANCIAL STATEMENTS
19. NET INTEREST INCOME
ThousandsAOA
INCOME FROM APPLICATIONS OF LIQUIDITY
Of Interbank Money Market transactions
INCOME FROM SECURITIES
On securities available for sale
INCOME FROM CREDIT
INCOME FROM FINANCIAL INSTRUMENTS
COSTS OF DEPOSITS
Sight Deposits
Term Deposits
COSTS OF FUNDING FOR LIQUIDITY
Interbank Money Market transactions
Sale of own securities with repurchase agreement
COSTS OF FINANCIAL LIABILITY INSTRUMENTS
NET INTEREST INCOME
‘10
‘09
450,947
450,947
3,708,109
3,708,109
4,698,854
8,857,910
2,582,376
58,789
2,523,587
45,598
45,253
345
2,627,974
6,229,936
387,567
387,567
1,925,475
1,925,475
2,058,683
4,371,726
956,149
125,545
830,604
476,472
3,806
472,666
1,432,621
2,939,104
In the years ended on 31 December 2010 and 31 December 2009, the heading “Income from Financial
Instruments”, includes mAOA 1,806,816 and mAOA 1,814,633, respectively, in respect of interest on Treasury
Bonds and Bills issued by the Angolan State, which are exempt from industrial tax (Note 16).
20. RESULTS OF EXCHANGE TRANSACTIONS
ThousandsAOA
‘10
Losses
Profits
Results of:
Notes and coins
Currencies
Net
Profits
‘09
Losses
Net
476,191
2,944,692
137,634
338,557
2,944,692
688,491
1,680,095
30,570
21,721
657,921
1,658,374
RESULTS OF EXCHANGE TRANSACTIONS 3,420,883
137,634
3,283,249
2,368,586
52,291
2,316,295
21. RESULTS OF THE PROVISION OF FINANCIAL SERVICES
ThousandsAOA
‘10
INCOME FROM THE PROVISION OF SERVICES
Transfer commission
Commission on cash withdrawals
Other income from the provision of services
COSTS OF COMMISSIONS AND CUSTODY
Commission – VISA
Electronic compensation commission
Other commissions costs
2,028,471
748,850
188,967
1,090,654
83,997
43,584
13,383
27,030
RESULTS FROM THE PROVISION OF FINANCIAL SERVICES
107
1,944,474
‘09
1,340,943
583,156
17,228
740,559
24,541
11,572
4,203
8,767
1,316,402
2010
ANNUAL REPORT MILLENNIUM ANGOLA
NOTES TO THE FINANCIAL STATEMENTS
22. STAFF
ThousandsAOA
MEMBERS OF THE MANAGEMENT AND SUPERVISORY BODIES
Base salary
Representation expenses
Subsidies (Christmas + Holidays)
EMPLOYEES
Base salary
Subsidies (Christmas + Holidays)
Social Security
Other expenses
STAFF
‘10
‘09
169,918
122,652
21,225
26,041
2,143,908
1,184,170
340,983
213,173
405,582
2,313,826
99,084
77,931
12,812
8,340
1,333,832
723,961
226,424
114,501
268,947
1,432,916
23.THIRD PARTY SUPPLIES
ThousandsAOA
Audits, consultancy and other services
Leases and rents
Transport, travel and lodging
Safety, conservation and repairs
Communications
Publications and advertising
Water and electricity
Other
THIRD PARTY SUPPLIES
‘10
‘09
831,587
778,515
418,798
283,509
216,235
128,963
49,528
339,613
3,046,747
488,743
542,332
532,379
193,494
138,866
122,809
31,925
205,538
2,256,086
24. OTHER ADMINISTRATIVE AND COMMERCIAL COSTS
ThousandsAOA
TAX AND RATES NOT APPLIED TO PROFITS
Customs tax
Rates
Other tax
PENALTIES APPLIED BY REGULATORY AUTHORITIES
DEPRECIATION AND AMORTIZATION
Tangible fixed assets
Intangible fixed assets
OTHER ADMINISTRATIVE AND COMMERCIAL COSTS
108
‘10
‘09
23,231
15,305
5,104
2,822
1,732
748,144
353,031
395,113
773,107
44,780
33,008
9,402
2,370
881
380,920
47,589
333,331
426,581
2010
ANNUAL REPORT MILLENNIUM ANGOLA
NOTES TO THE FINANCIAL STATEMENTS
25. OTHER OPERATING INCOME AND COSTS AND PROVISIONS FOR
PROBABLE LIABILITIES
ThousandsAOA
SUNDRY COSTS AND LOSSES
SUNDRY INCOME
Income from the provision of sundry services
Repayment of communication and expedition expenses
Other income
PROVISIONS FOR PROBABLE LIABILITIES
INDEMNITY FOR CONTRACTUAL NON-FULFILMENT
OTHER OPERATING COSTS AND INCOME AND PROVISIONS
FOR PROBABLE LIABILITIES
‘10
‘09
-23,525
57,367
19,461
14,522
23,384
33,842
-5,882
1,797
-4,085
-21,410
40,664
8,485
27,174
5,005
19,254
-14,698
1,180
-13,518
29,757
5,736
26. NON-OPERATING PROFIT
ThousandsAOA
Losses relating to previous years
Capital gains on the disposal of tangible fixed assets
Gains relating to previous years
NON-OPERATING PROFIT
‘10
‘09
1,357
4,694
6,879
10,216
30,404
0
16,703
(13,702)
27. OFF-BALANCE SHEET HEADINGS
On 31 December 2010 and 2009, these headings were broken down as follows:
ThousandsAOA
THIRD PARTY LIABILITIES
Irrevocable credit lines
Guarantees received
LIABILITIES TO THIRD PARTIES
Guarantees provided
Revocable commitments to third parties
SERVICES RENDERED
Deposit and custody
Collection of monetary instruments
EXCHANGE TRANSACTIONS
Purchase of foreign currencies payable
Sale of foreign currencies payable
‘10
‘09
11,772,335
9,035,920
2,736,415
7,857,644
7,292,984
564,660
36,337,210
35,695,887
641,323
6,468,229
3,712,646
2,755,583
7,932,451
5,287,892
2,644,559
16,896,439
12,817,332
4,079,107
32,115,571
31,171,093
944,478
762,382
389,414
372,968
28. SUBSEQUENT EVENTS
We are not aware of any facts or events after 31 December 2010 that might justify any adjustment or disclosure
in the Notes to the Accounts relating to the years in question, that might significantly affect the situations and/or
information disclosed therein, or even those that, while they may not affect the statements presented, may have
significantly altered or are expected to significantly alter, favourably or unfavourably, the Bank’s financial situation,
its results and/or its activities.
109
2010
ANNUAL REPORT MILLENNIUM ANGOLA
PROPOSAL FOR THE APPROPRIATION OF PROFITS
PROPOSAL FOR THE
APPROPRIATION OF PROFITS
Considering the provisions of the law and of the articles of associations
applicable to the legal reserve and to special reserves;
Under the terms of the special regulations of the National Bank
of Angola, notably Article 76 (1) of the Financial Institutions Law,
of Instruction nr. 09/07 of the prudential rules issued by the
Supervisor and of article 35 of the Articles of Association of Banco
Millennium Angola, the proposal for the appropriation of profits for
the 2010 financial year, amounting to 3,018,456,971.82 AOA, is as
follows:
(a) AOA 603,691,394.36 for the Legal Reserve;
(b) AOA 2,414,765,577.46 for the reinforcement of the Free Reserves.
110
2010
ANNUAL REPORT MILLENNIUM ANGOLA
EXTERNAL AUDITORS’ REPORT
EXTERNAL AUDITORS’ REPORT
111
2010
ANNUAL REPORT MILLENNIUM ANGOLA
EXTERNAL AUDITORS’ REPORT
112
2010
ANNUAL REPORT MILLENNIUM ANGOLA
OPINION OF THE SUPERVISORY BOARD
OPINION OFTHE SUPERVISORY
BOARD
1. The Supervisory Board’s supervision of the Banco Millennium Angola, S.A. business was exercised pursuant to the legal
provisions and by-laws.In this regard,the Supervisory Board received the quarterly accounts and respective management
information in good time and, whenever it considered it necessary in order to perform its functions, it contacted the
members of the Executive Committee and Directors of the Bank and met with the External Auditor.
2. For the purpose of preparing its opinion on the 2010 financial year of Banco Millennium Angola,
the following documents were presented to the Supervisory Board:
a) By the Executive Committee:“Presentation of Results December – 2010”, which
includes the macroeconomic context, the results of December 2010 and
annexes, “Business Summary”, “Management Report” and “Notes to the
Financial Statements”.
b) By the External Auditor:“Clearance Meeting 2010 Audit – 31 December
2010” and the “Opinion”, which concludes in the following manner:
“In our opinion, the said Financial Statements present the financial
position of Banco Millennium Angola on 31 December 2010, the
result of its operations, its cash flow and alterations in its equity
in the year ended on that date, in a true and appropriate
manner, in all materially relevant aspects, in compliance with
the accounting principles generally accepted in the banking
sector in Angola.”.
3. The Supervisory Board carefully considered these documents
and from this reflection they reached the following conclusions:
a) That the Balance Sheet, as at 31 December 2010, adequately
reflects the financial situation of the BMA – Banco Millennium Angola,S.A.
b) That the Income Statement correctly reflects a profit of 3,018,456,971.82 kwanzas.
4. As a result of the verifications and of the analyses carried out, and taking into consideration the full audit of the
annual Financial Statements performed by the External Auditor, which revealed no situation worthy of concern,
as well as its favourable opinion, the Supervisory Board:
4.1. Is of the opinion that the Financial Statements of the Banco Millennium Angola, S.A:
a) Are in conformity with the law and satisfy the provisions of the by-laws, as well as the standards issued
by the National Bank of Angola;
b) Accurately reflect the financial situation of the Bank on 31 December 2010, as well as the result of the
operations carried out during the year;
4.2. It is of the opinion that the Board of Directors should:
a) Approve the Financial Statements of BMA – Banco Millennium Angola, S.A. for the year ended on
31 December 2010.
b) Express its praise for the performance of the Executive Committee and of all the Employees of BMA –
Banco Millennium Angola, S.A. for the excellence of the results achieved in 2010.
Luanda, 2 March 2011
António de Almeida – Chairman of the Supervisory Board
Luzia Rosária de Fátima Oliveira – Member of the Supervisory Board
Madalena Adriano Domingos de Lemos Neto – Voting Member of the Supervisory Board
113
Relatório e Contas 2010 – Annual Report 2010
Banco Millennium Angola, S.A.
www.millenniumangola.ao
Sede – Head Office:
Rua Rainha Ginga, 83
Luanda
Capital social – Share capital:
3.809.398.820,39535 AOA
Matriculado na Conservatória
do Registo Comercial de Luanda
sob o n.º 425/06 e com o número
de pessoa colectiva 5 410 000 560
Public deed registed in the Luanda
Comercial Registry, with the registry number
425/06 and the tax number 5 410 000 560
Edição: Maio de 2011
Edition: May 2011
Produção gráfica – Pre-press:
Choice – Comunicação Global, Lda.
Download