A thesis submitted to the Wiesbaden Business School in
fulfillment for the degree of
Master of Arts
in
International Business Administration
of University of Applied Sciences Wiesbaden
(Hochschule RheinMain)
Learning to grow –
Empirical analysis of dynamic
capabilities of SMEs in Brazil
Supervisor:
Co-supervisor:
Prof. Dr. Klaus North
Prof. Dr. Franz Giesel
Submitted by:
André Francisco Wolf
Auf der Unterheide 15
65549 Limburg
Wiesbaden, October 15, 2011
Executive Summary
I
Executive Summary
This thesis is part of a project called “Sustainable competitiveness of SMEs in
turbulent economic and social environments - a network approach” or “dynamic
SME” as short version. The project tries to combine European innovation and
organizational learning models with Latin American survival strategies in
turbulent economies.
Dynamic SME is a four year project which started in April this year with support
of Marie Curie International Research Staff Exchange Scheme Fellowship within
the seventh European Community Framework Programme. On the one hand the
project has the objective to strengthen research partnerships through staff
exchanges
and
networking
activities
between
two
European
research
organizations from Germany, Hochschule RheinMain, and Spain, Universidas
Autónoma de Madrid, and two Latin American research organizations from
Brazil, Universidade Federal de Santa Catarina, and Argentina, Universidad
Nacional de Rosario. On the other hand it has the scientific objective to create a
co-evolvement process towards a successful management model for SMEs that
combines the European innovation and organizational learning model with Latin
American survival strategies in turbulent economies.
European universities already have experience in cooperation with SMEs. One
example is the project “learning to grow” (“Wachstum lernen - lernend wachsen”)
initiated by Professor Klaus North from Hochschule RheinMain in cooperation
with RKW Deutschland. The method developed for “learning to grow” is the
basis for this thesis. European approaches have, however, not been tested in
turbulent economic environments.
In the course of “dynamic SME” the method of the project “learning to grow”,
which has already proved being successful in Germany, will be tested in turbulent
markets such as in Argentina and Brazil to find out to what extent it is applicable
and what can be learned with the turbulent conditions in Latin America.
Executive Summary
II
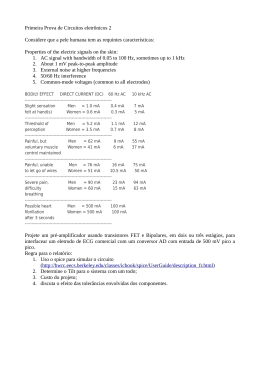
Actually the diagnosis done for fifteen companies in this thesis is the first of seven
steps for managing growth.
Seven steps for managing growth
Source: cf. Hardwig et al. 2011, p 139
The diagnoses of the fifteen companies interviewed for this thesis led to the
following conclusions: In general the companies had very interesting processes
and routines to move the levers of the growth-wheel. Many examples given in the
interviews with the executives disclosed highly developed innovation and
knowledge management capabilities. E.g. the many processes to identify
opportunities for growth with the help of external and internal parties described in
the analysis of questions one and two.
But there are problems too. The differentiation practiced by many of the fifteen
SMEs between white and blue-collar workers for instance. Furthermore, some
companies act very informal without any routines and structures.
The analysis of different classifications of the fifteen SMEs showed that a higher
level of innovativeness led to a higher mean value of the self-assessment. That
Executive Summary
III
proofed that, in the case of the fifteen companies in Brazil, the ones which
evaluated their performance in regard of the sixteen questions as high, do also
have a higher level of innovativeness. The companies having a lot of routines and
system to manage growth developed many innovations of products and processes
in the last years.
Another observation was that the Companies which invested more into R&D also
evaluated their performance higher in the self-assessment. Furthermore, it was
analyzed that the mean value of the self-assessment was rising with the number of
employees a company had. The group of companies with the highest number of
employees had a significantly higher mean value than the other ones. The
competitiveness index of MSEs in Santa Catarina developed by SEBRAE and
Deloitte‟s study, in which a list of Brazilian SMEs with the highest growth rates
was elaborated, proved that the results of the interviews with the fifteen SMEs
were akin to experiences other Brazilian companies had.
The fact that the fifteen Brazilian SMEs evaluated the relevance of the sixteen
questions for the competitive position very high in average shows that the
majority of the companies is aware of the importance of the subject.
Mean values of self-assessment and the relevance for competitive position of all
fifteen companies for the questions1-16
Table of Contents
IV
Table of Contents
Executive Summary ................................................................................................. I
Table of Contents .................................................................................................. IV
Abbreviations used ................................................................................................ VI
Figures .................................................................................................................. VII
1
2
3
4
Introduction ..................................................................................................... 1
1.1
Scope ............................................................................................................................... 1
1.2
Objectives ........................................................................................................................ 2
1.3
Mode of investigation ...................................................................................................... 3
Small and medium enterprises in Brazil ......................................................... 5
2.1
Characterization of SMEs in Brazil ................................................................................. 5
2.2
Challenges faced by Brazilian SMEs ............................................................................... 5
The project “Aprender a crescer” - “Learning to grow” ............................... 13
3.1
Dynamic capabilities ..................................................................................................... 13
3.2
Project learning .............................................................................................................. 16
3.3
“Aprender a crescer” - “Learning to grow” ................................................................... 18
Analysis of data ............................................................................................. 22
4.1
Applying “Learning to grow” in Brazil ......................................................................... 22
4.2
First challenge of the growth wheel: Identify opportunities for growth ........................ 25
4.2.1
Analysis of each question of the first challenge of the growth wheel ................... 25
4.2.2
General impression of the first challenge of the growth wheel ............................. 31
4.3
4.3.1
Analysis of each question of the second challenge of the growth wheel .............. 33
4.3.2
General impression of the second challenge of the growth wheel ........................ 38
4.4
Third challenge of the growth wheel: Realize opportunities for growth ....................... 39
4.4.1
Analysis of each question of the third challenge of the growth wheel .................. 39
4.4.2
General impression of the third challenge of the growth wheel ............................ 44
4.5
5
Second challenge of the growth wheel: Develop objectives for growth ........................ 33
Forth challenge of the growth wheel: Manage growth .................................................. 46
4.5.1
Analysis of each question of the fourth challenge of the growth wheel ................ 46
4.5.2
General impression of the fourth challenge of the growth wheel.......................... 51
4.6
Analysis of the different company-classifications ......................................................... 52
4.7
Final analysis ................................................................................................................. 57
Conclusion .................................................................................................... 61
Appendices ............................................................................................................ 65
Appendix A ................................................................................................................................ 65
Appendix B................................................................................................................................. 66
Table of Contents
V
Appendix C................................................................................................................................. 67
Appendix D ................................................................................................................................ 68
Appendix E ................................................................................................................................. 69
Appendix F ................................................................................................................................. 70
Appendix G ................................................................................................................................ 71
Appendix H ................................................................................................................................ 72
Appendix I .................................................................................................................................. 73
Appendix J .................................................................................................................................. 74
Appendix K ................................................................................................................................ 75
Appendix L ................................................................................................................................. 76
Appendix M ................................................................................................................................ 77
Appendix N ................................................................................................................................ 78
Appendix O ................................................................................................................................ 79
Appendix P ................................................................................................................................. 80
Appendix Q ................................................................................................................................ 81
Appendix R................................................................................................................................. 82
Appendix S ................................................................................................................................. 83
Appendix T ................................................................................................................................. 84
Appendix U ................................................................................................................................ 85
Appendix V ................................................................................................................................ 86
References ............................................................................................................. 99
Versicherung ....................................................................................................... 101
Abbreviations used
VI
Abbreviations used
ACATE
ACIF
ACIRS
BNDES
-
cf.
CI Brasil
CNPq
-
e.g.
FAPESC
-
FESC
FIESC
FINEP
MSE
NGS
R&D
SEBRAE
SIMMMERS
-
SME
UFSC
-
Associação Catarinense de Empresas de Tecnologia
Associação Comercial e Industrial de Florianópolis
Associação Comercial e Industrial de Rio do Sul
Brazilian Development Bank (Banco Nacional de
Desenvolvimento Economico e Social)
confer; compare
Programa do Circuito Integrado Brasil
Conselho Nacional de Desenvolvimento Científico e
Tecnológico
exempli gratiā
Fundação de Amparo à Pesquisa e Inovação do Estado de
Santa Catarina
Faculdade Evangélica de Santa Catarina
Federação das Indústrias do Estado de Santa Catarina
Financiadora de Estudos e Projetos
Micro and small enterprises
Núcleo de Gestão para a Sustentabilidade
Research and Development
Serviço Brasileiro de Apoio às Micro e Pequenas Empresas
Sindicato das Indústrias Metalúrgicas, Mecânicas e do
Material Elétrico
Small and medium enterprises
Universidade Federal de Santa Catarina
Figures
VII
Figures
Figure 2.1
Major challenges SMEs will be facing middle and long term ...................................... 6
Figure 2.2
Which parties influence strategic decisions made by SMEs ........................................ 6
Figure 2.3
Does your company have a documented strategic planning? .................................... 7
Figure 2.4
Why is innovation important for SMEs ....................................................................... 9
Figure 2.5
Innovation and growth - Initiatives undertaken by SMEs to upgrade the stage of
innovation.................................................................................................................... 9
Figure 2.6
Barriers to technological innovation ......................................................................... 10
Figure 2.7
Challenges regarding human resources and people management ........................... 11
Figure 2.8
Factors that hinder firms' access to credit ................................................................ 12
Figure 3.1
Sensing, seizing, transforming ................................................................................... 15
Figure 3.2
Correlation between project management and learning .......................................... 17
Figure 3.3
The growth-wheel ..................................................................................................... 19
Figure 3.4
Seven steps for managing growth ............................................................................. 21
Figure 4.1
Aprender a crescer - As alavancas do crescimento ................................................... 22
Figure 4.2
Self-assessment ......................................................................................................... 23
Figure 4.3
Evaluation of relevance ............................................................................................. 23
Figure 4.4
Identify opportunities for growth ............................................................................. 32
Figure 4.5
Mean values for questions 1 - 4 ................................................................................ 32
Figure 4.6
Develop objectives for growth .................................................................................. 38
Figure 4.7
Mean values for questions 5 - 8 ................................................................................ 38
Figure 4.8
Realize opportunities for growth opportunities ........................................................ 44
Figure 4.9
Mean values for questions 9 - 12 .............................................................................. 45
Figure 4.10
Manage growth ..................................................................................................... 51
Figure 4.11
Mean values for questions 13 - 16 ........................................................................ 52
Figure 4.12
Companies classified into best, medium and worst mean values ........................ 52
Figure 4.13
Companies classified by number of employees .................................................... 53
Figure 4.14
Companies classified by innovativeness ............................................................... 54
Figure 4.15
Companies classified by investments in R&D ....................................................... 55
Figure 4.16
Companies classified by annual growth ................................................................ 56
Figure 4.17
Mean values of self-assessment and the relevance for competitive position of all
fifteen companies for the questions1-16 .............................................................. 57
Figure 4.18
Linear regression (mean values of each question) ............................................... 58
Figure 4.19
Competitiveness index of MSEs in Santa Catarina (SEBRAE) ................................ 59
1. Introduction
1
1.1
1
Introduction
Scope
The world is growing together more and more but what can we learn from each
other? This thesis is part of a project called “Sustainable competitiveness of SMEs
in turbulent economic and social environments - a network approach” or
“dynamic SME” as short version. The project tries to combine European
innovation and organizational learning models with Latin American survival
strategies in turbulent economies.
Dynamic SME is a four year project which started in April this year with support
of Marie Curie International Research Staff Exchange Scheme Fellowship within
the seventh European Community Framework Programme. On the one hand the
project has the objective to strengthen research partnerships through staff
exchanges
and
networking
activities
between
two
European
research
organizations from Germany, Hochschule RheinMain, and Spain, Universidas
Autónoma de Madrid, and two Latin American research organizations from
Brazil, Universidade Federal de Santa Catarina, and Argentina, Universidad
Nacional de Rosario. On the other hand it has the scientific objective to create a
co-evolvement process towards a successful management model for SMEs that
combines the European innovation and organizational learning model with Latin
American survival strategies in turbulent economies.
European universities already have experience in cooperating with SMEs.
Researchers have developed appropriate action learning methodologies and
support mechanisms to enhance innovation and knowledge management
capabilities. One example is the project “learning to grow” (“Wachstum lernen lernend wachsen”) initiated by Professor Klaus North from Hochschule
RheinMain in cooperation with RKW Deutschland. The method developed for
“learning to grow” provides a basis for this thesis.
1. Introduction
2
European approaches have yet not been tested in turbulent economic
environments. The researchers in Argentina and Brazil support innovation in local
SMEs acting under those challenging circumstances. There is a rich experience
with social entrepreneurship, cooperative ownership and other flexible governance
models of SMEs in Latin America which might also provide answers to the
challenges of future SME development in Europe.
In the course of “dynamic SME” the method of the project “learning to grow”,
which has already proved being successful in Germany, will be tested in turbulent
markets, such as in Argentina and Brazil, to find out to what extent it is applicable
and what can be learned with the turbulent conditions in Latin America.
1.2
Objectives
In order to answer the key question of the project dynamic SME “What would be
a successful management model for SMEs that combines European innovation
and organizational learning models with Latin American survival strategies in
turbulent economies?” this thesis is a first step to introducing and testing the
method of “learning to grow” in Brazil.
The first component of the methodology is a diagnosis of innovation and
knowledge management capabilities of SMEs with the help of interviews with
executives of different companies.
For this dissertation executives of fifteen companies located in Santa Catarina,
federal state of Brazil, were interviewed.
The main objective of this thesis is to evaluate the answers given in the interviews
and giving a first impression of innovation and knowledge management
capabilities of Brazilian SMEs.
1. Introduction
1.3
3
Mode of investigation
During a two month stay in Florianopolis the questionnaire for interviews with
SMEs, developed for the project “learning to grow” in Germany, has been
customized to meet characteristics of Brazilian SMEs. Afterwards interviews with
executives of fifteen SMEs located in the cities Florianópolis, Jaraguá do Sul,
Joinville and Rio do Sul were made.
The Research-Center for Sustainability Management (NGS) ˗ a Research and
Development Laboratory linked to the Department of Knowledge Engineering
and Management of the Federal University of Santa Catarina (UFSC) ˗ helped to
customize the questionnaire and to get in contact with the companies interviewed
for the thesis.
The questionnaire is based on the method used in Germany. The questions were
developed and organized in the framework “Learning to grow – the levers of
growth” by Professor Klaus North (Figure 4.1, p. 22). The sixteen questions are
divided into four challenges and each of the challenges is divided into two levers.
For the Brazilian market some questions needed to be adapted and a short
explanation of the project was added to inform the companies in advance. At the
end of the questionnaire four questions were subjoined to classify the companies.
The final version of the questionnaire used in Brazil is attached to this thesis
(Appendix V, p. 86).
This thesis analyses the answers given in the interviews. Subsequent to this
introduction the chapters two, reconsidering challenges Brazilian SMEs are
facing, and three, explaining the project “learning to grow” based on dynamic
capabilities and project learning, are providing the theoretical basis of the thesis.
Chapter four analyzes the data collected in the fifteen interviews. Firstly, the
answers of the different companies to each question are compared to see which
1. Introduction
4
common practices are used and what are best and worst practices. Secondly, the
numerical results of the companies divided into different classifications are
compared.
Finally, chapter five provides the conclusion.
2. Small and medium enterprises in Brazil
2
5
Small and medium enterprises in Brazil
2.1
Characterization of SMEs in Brazil
In Brazil the definition of SMEs varies depending on the viewpoint of different
entities like SEBRAE or BNDES for instance (Häner 2011). These definitions and
detailed information about SMEs in Brazil can be found in Häner‟s thesis “SMEs
in turbulent times - A comparative analysis between Argentina, Brazil and
European Countries”. Häner‟s dissertation is also a part of the project dynamic
SME.
This dissertation is focusing on the difficulties SMEs have when they are growing
and therefor the following text will look at the challenges Brazilian SMEs are
facing.
2.2
Challenges faced by Brazilian SMEs
“Navegar com habilidade e eficiência em mares revoltos, fugindo da deriva
e aproveitando os bons ventos para imprimir velocidade, é tarefa difícil, que
exige planejamento, capacitação e constante aprimoramento. Esse tem sido
o desafio enfrentado pelos comandantes das pequenas e médias empresas
(PMEs) brasileiras nos turbulentos oceanos de um mercado em intensa
competição.” (Deloitte 2008, p 3)
The quote is from an annual study released by Deloitte in which a list of Brazilian
SMEs with the highest growth rates is elaborated each year since 2006.
The SMEs which participated in Deloitte‟s survey of 2010 named future
challenges (Figure 2.1). The figure shows that SMEs in Brazil having a high
growth rate are concerned with technology, human resources, their administration
and financial situation.
2. Small and medium enterprises in Brazil
6
SMEs have to handle these challenges in order to stay competitive. But the growth
of a company also affects all aspects of these challenges. Therefor SMEs have to
use and organize all their resources wisely when they are growing.
Figure 2.1
Major challenges SMEs will be facing middle and long term
85
Competitive costs
Stay up to date technologically
78
Attract and retain highly qualified professionals
77
68
Differentiate products from the competition
62
Create conditions for an agile and efficient administration
40
Get resources to finance operations
Compete with the informal market
20
Percentage of companies that indicated each item; question with multiple answers (%)
Source: cf. Deloitte 2010, p 9
In the following, four questions concerning the growth are examined.
Which parties involved can help SMEs to grow?
There are a lot of different parties involved in the success of a company. If SMEs
want to be competitive they have to use all sources to be successful. Figure 2.2
shows that clients have the highest influence on strategic decisions made by
SMEs, followed by employees and suppliers.
Figure 2.2
Which parties influence strategic decisions made by SMEs
Customers
Officials
Suppliers
Government
Investors
Distributors
89
45
32
31
30
10
Percentage of companies that indicated each item; question with multiple answers (%)
Source: cf. Deloitte 2010, p 9
2. Small and medium enterprises in Brazil
7
The purpose of a company is to gain profits by selling products, which can be
goods or services. Because of the fact that the products are sold to the clients it is
obvious that companies orientate their decisions towards the customers. The
products are developed and produced by the employees and the materials for
production are furnished by the suppliers.
These parties have a major influence on the growth of a company. SMEs have to
observe the consumers‟ needs and deliver the most innovative product to fulfill
them.
To be successful in developing the best product SMEs should use internal and
external knowledge. Following this patent clients, suppliers and employees can
help a company to detect opportunities for success.
How the fifteen companies of this survey are using internal and external
knowledge is shown in chapter 4.2.
How does the strategy influence the growth of SMEs?
When a company is growing it needs clearly structured strategic guidelines to
guarantee an organized growth and keep the objectives in mind. The survey of
Deloitte shows that most of the SMEs with the highest growth rates in Brazil are
having a strategic plan (Figure 2.3).
Figure 2.3
Does your company have a documented strategic planning?
7
3 1
Yes, it has a documented strategic planning
Yes, but the planning is not documented
No, but we plan to have it short-term
26
63
No, but we plan to have it the next 3 to 5 years
No and we do not wish to have one
Source: cf. Deloitte 2010, p 11
2. Small and medium enterprises in Brazil
8
Developing strategic planning is extremely important for a good setting out of
objectives and creating long term value (Deloitte 2010, p 11). These plans take
into account the internal and external conditions and the evolution of the company
estimated by their managers. In addition it considers the basic premises that the
company must follow to have a consistent and sustained process.
But it is not enough to develop a strategy (O'Reilly & Pfeffer 2000). If a company
wants to be successful it has to communicate its strategy to the employees. The
staff has to know the strategy to help achieving the objectives. If not they might
go to a wrong direction.
Employees can even help to build up a company‟s strategy. Often employees have
more detailed information about their department than the executives and are
thinking of other aspects which can help the company in being more efficient or
innovative. Furthermore, the employees do not only have to know the strategy. It
is important that they are motivated to pursue the objectives outlined in the
strategy.
In how far the companies of this survey are having and using strategy planning is
written in chapter 4.3.
How can the employees help SMEs to grow?
Entrepreneurs indicate that the release process and adoption of new products,
services, technology and role models has become a key factor for gaining
competitiveness of organizations, capable of generating value for customers and
other stakeholders (Deloitte 2008, p 25).
Figure 2.4 shows that innovation, in particular, is an important factor for
achieving faster growth rates than the competition, besides facilitating the entry
into untapped markets and attracting and retaining talents (Deloitte 2009, p 22).
2. Small and medium enterprises in Brazil
Figure 2.4
9
Why is innovation important for SMEs
To grow faster than the competition
82
In order to enter an untapped market
49
To attract and retain the best talents
42
To become attractive to an investment fund
22
Other reasons
8
Question with multiple answers (%)
Source: cf. Deloitte 2009, p 22
That‟s why companies of the survey of 2008 undertake many initiatives to
advance innovation (Figure 2.5).
Figure 2.5 shows that innovation has a lot to do with human resources. Sixty-four
percent of the companies of the survey prioritize the education of its professionals
in order to achieve a higher state of innovation. In addition fifty-seven percent
recognize and encourage employees to contribute innovative ideas.
Figure 2.5
Innovation and growth - Initiatives undertaken by SMEs to
upgrade the stage of innovation
85
Innovation is part of business strategy
66
Constantly investing in technology
64
Prioritize the training of professionals
Recognize and encourage employees contributing
innovative ideas
Develop partnerships with suppliers to develop new
products and / or services
Evaluate the acceptance of products and / or services on
the market regularly
Having an effective research and development
57
50
48
29
Extract of the 100 fastest growing companies between 2005 and 2007, multiple answers (%)
Source: cf. Deloitte 2008, p 25
2. Small and medium enterprises in Brazil
10
These facts underline the importance of the employees. If a company wants to be
innovative constantly it has to install processes and routines using all input
available. A whole staff will have more ideas than one entrepreneur or the
executives most probably.
But employees have to be qualified in order to help a company to grow. Figure
2.6 demonstrates that forty-seven percent of the SMEs of Deloitte‟s survey name
the lack of qualified staff as a barrier to technological innovation.
Figure 2.6
Barriers to technological innovation
High costs of innovation
74
Lack of qualified staff
47
Lack of specific financial resources
35
Lack of adequate external technical consulting
Lack of knowledge in information technology
Lack of appropriate technology for SMEs
17
10
8
Question with multiple answers (%)
Source: cf. Deloitte 2009, p 23
SMEs have to either contract qualified employees or train their staff to create
space for innovation.
In chapter 4.4 is written how companies in Santa Catarina which participated in
the survey of this thesis are using their employees to realize opportunities for
growth.
What has to be organized when SMEs are growing?
SMEs have to manage the growth intelligently. More and more aspects are
influencing the success of small business. Even SMEs are seeing importance for
internationalization (Deloitte 2008, p 21). Deloitte observed in its survey that
2. Small and medium enterprises in Brazil
11
twenty-nine percent of the fastest growing SMEs in Brazil expressed the intention
to create units or offices abroad.
Internationalization and other movements are leading to several challenges that
have to be mastered by growing SMEs. One of these challenges is human
resources. Human resources are seen as a decisive factor for the sustainability of
organizations by business leaders (Deloitte 2008, p 19). As mentioned before the
difficulty for SMEs are to maintain a qualified team.
To cope with the challenges regarding human resources, which can be seen in
Figure 2.7, Brazilian SMEs have to train their workforce, attract and retain
specialists.
Figure 2.7
Challenges regarding human resources and people management
Technical deficiencies of new professionals entering
the market
63
59
Labour legislation
58
Difficulty in attracting skilled labor
Track trends in relation to variable remuneration and
benefits
39
33
Difficulty to retain the best professionals
Meet employment quotas established by the
government
Follow the tracks of remuneration charged by the
market
Provide an adequate work-life-balance to the
employees
25
24
21
Extract of the 100 fastest growing companies between 2005 and 2007, multiple answers (%)
Source: cf. Deloitte 2008, p 19
Another detail which has to be managed is the financing of growth. Companies
which are growing need financial resources to invest them in new equipment,
workforce and development costs.
2. Small and medium enterprises in Brazil
12
But Deloitte‟s survey points out that the demand for financial resources is
currently not a major objective for the fastest growing SMEs in Brazil (Deloitte
2009, p 18). Only twenty-seven percent seek mechanisms to raise financial
resources, both internal and external. The new economic environment accentuates
the existing difficulties in raising funds for SMEs, because financial institutions
tend to become more cautious in lending to corporations.
The main source of funds used by SMEs is the reinvestment of profits, according
to statements of eighty percent of the fastest growing SMEs (Deloitte 2009, p 18).
Figure 2.8 shows some factors hindering the firms in taking a loan.
Figure 2.8
Factors that hinder firms' access to credit
Interest rates on loans
81
Paperwork for loans and financing
55
Guarantee-requirements
51
Availability of credit lines
37
Time required for loan repayment
Requirements of corporate governance
16
4
Question with multiple answers (%)
Source: cf. Deloitte 2009, p 18
What measures are used to manage growth by the fifteen companies, which
participated in this survey, is explained in chapter 4.5.
3. The project “Aprender a crescer” - “Learning to grow”
3
3.1
13
The project “Aprender a crescer” - “Learning to grow”
Dynamic capabilities
The project “learning to grow” is based on the concept of dynamic capabilities. In
1997 Teece was the first to define dynamic capabilities as:
“(…) the firm‟s ability to integrate, build, and reconfigure internal and
external competencies to address rapidly changing environments.” (Teece et
al. 1997, p 516)
In order to have a competitive advantage companies have to develop a unique
selling proposition (Reeves 1961, pp 46–48). With the “market-based-view” and
the “resource-based-view” there are two approaches claiming to be the best way
to create such a unique selling proposition.
The marked-based-view is characterized by porter`s five forces analysis, which
derives five forces that determine the competitive intensity and therefore
attractiveness of a market (Porter 1979). The five forces are the threat of substitute
products, the threat of established rivals, the threat of new entrants, the bargaining
power of suppliers and the bargaining power of customers.
Porter‟s framework is used by the majority of companies to determine the
attractiveness of a market and position them in the market. The widely-spread use
of the marked-based-view makes it more and more difficult for companies to
achieve a unique selling proposition by using it. That‟s why Teece observed that
the resource-based-approach is the better way to develop a unique selling
proposition (Teece et al. 1997, p 513). Teece propounded the view that firm‟s
competitive advantages are based on their specific and difficult-to copy resources.
Furthermore, Teece suggested a definition for a dynamic capabilities framework
(Teece et al. 1997, pp 515–516). This framework describes the process of
transforming factors of production into dynamic capabilities. Companies can buy
factors of production, like land, capital or unskilled labor in factor markets. These
3. The project “Aprender a crescer” - “Learning to grow”
14
factors have to be transformed into firm-specific resources which are difficult or
even impossible to copy. When different firm-specific resources are put together
in clusters these can become organizational routines or competencies. Some of
these competencies are fundamental for the business of a company and are
therefore called core competencies. Dynamic capabilities are the firm‟s ability to
integrate, build, and reconfigure internal and external competencies to react to
rapidly changing environments. Dynamic capabilities can help a company to
adapt its core competencies to new conditions.
But it is not enough for a company to fulfill its functions efficiently. To have
dynamic capabilities it also has to be economically successful (Helfat 2007, pp
13–16). The creation of dynamic capabilities is a difficult task (Hardwig et al.
2011, pp 35–36). They are a firm-specific combination of resources depending on
the competencies of the company. On that account it is not possible to give a
general solution for that problem.
Figure 3.1 shows model for dynamic capabilities developed by Teece. Teece
introduces readers to three classes of capabilities that he describes as sensing,
seizing and managing threats/transforming (Teece 2007, p 1319).
Sensing is a firm‟s ability to identify, filter and calibrate opportunities (Teece
2007, pp 1322–1326). Companies have to develop routines to advance the
sensibility for new technologies and trends on the market. Different foundations
can help to use all available internal and external resources to master this task.
Teece defines four foundations:
The direction of internal R&D processes and selection-processes of new
technologies.
The detection of new knowledge of suppliers and partners and the use of
this knowledge.
Identify opportunities by analyzing market potential and customer needs.
3. The project “Aprender a crescer” - “Learning to grow”
15
Collaborations with research institutions, universities, associations, or
cooperation in networks, to tap external knowledge or to gain new
perspectives.
Seizing is a company‟s ability to capture identified opportunities (Teece 2007, pp
1326–1334). Therefor these opportunities have to be transformed into products or
processes. The following foundations help seizing opportunities:
Developing a customer solution or business model.
Set the right enterprise boundaries to prevent activities to hinder one
another.
Define the decision-making process to guarantee investments into the best
opportunities.
Building loyalty and commitment among the staff.
Figure 3.1
Sensing, seizing, transforming
Source: cf. Teece 2007, p 1342
3. The project “Aprender a crescer” - “Learning to grow”
16
Managing threats/transforming is a firm‟s ability to enhance its internal resources
(Teece 2007, pp 1334–1341). Also for this dynamic capability Teece mentions
four foundations:
Decentralization and near decomposability to rearrange business models,
organizational structures and routines in order to ensure performance.
Cospecialization to adapt strategies, structures and processes.
Governance and incentive structures to enable learning and the generation
of new knowledge.
Knowledge management to guide learning, building of internal and using
external knowledge.
This model was basically developed for big corporations (Hardwig et al. 2011, p
39). That‟s why the model has to be adapted to fulfill the purposes of SMEs. How
the model was adapted is explained in the chapters 3.3 and 4.1.
3.2
Project learning
A project is a temporary mission with a defined time period and budget (Chatfield
& Johnson 2004). Projects are undertaken to meet unique goals and objectives,
typically to bring about beneficial change or added value (Nokes 2007, pp 8–9).
The temporary nature of projects stands in contrast with normal business
activities, which are repetitive permanent, or semi-permanent functional activities
to produce products or services (Dinsmore & Cooke-Davies 2006, pp 43–46).
Project learning combines the attributes of a project with organizational learning.
Project learning complements the classic project management, but requires an
additional space to develop learning and change potentials (Hardwig et al. 2011, p
99). A project gives a structured task, which is manageable and comprehensive.
Due to the limited time and the reduced complexity a project can be structured for
systematical learning of an organization.
3. The project “Aprender a crescer” - “Learning to grow”
17
Project learning is an activity of a group of employees and / or managers of a
company (Hardwig et al. 2011, p 100). On behalf of the management the group
develops and organizes a temporary and strategically important task in order to
develop the company‟s competencies. Challenges related to real business are first
identified and then the group plans and realizes the change needed to face the
challenge. At the same time the competencies of employees, teams and the
organization as a whole will be developed by creating new rules and routines.
These competencies help the company to respond quickly and successfully to
rapidly changing environments. Consequently individual and organizational
learning is linked by project learning.
To secure the aspect of organizational learning in a project additional learning
objectives have to be set up to support building competencies of a company.
Figure 3.2 shows the interrelations between project management and learning.
Figure 3.2
Correlation between project management and learning
Source: cf. Hardwig et al. 2011, p 102
3. The project “Aprender a crescer” - “Learning to grow”
18
Project learning is a conscious intervention in the routine of a business. With the
help of project learning even SMEs can develop and use strategic core
competencies that are required for the generation of sustainable profitable growth.
3.3
“Aprender a crescer” - “Learning to grow”
As mentioned in the introduction, in the course of the project “learning to grow”,
the method, which is the basis of this thesis, has been developed. It took place in
Germany guided by the University of Wiesbaden in cooperation with RKW
Deutschland GmbH, a company sponsored by the Center for Innovation and
rationalization of German industry. The project was successfully finished in 2010.
The project has been created to help SMEs to become more competitive, by
guiding them in building up innovation and knowledge management
competencies. In Germany, 124 SMEs participated in the diagnosis and 24 of
these were chosen to develop an individually tailored project, fulfilling the
fundamentals of project learning, with the help of “growth-consultants”.
The model of dynamic capabilities developed by Teece is very analytical and
directed to big corporations (Hardwig et al. 2011, pp 51–55). The experience
gained by the analysis of the 124 SMEs was used to adapt Teece‟s approach to the
needs of this category of companies and create a tool which is more related to
practice. The result was the growth-wheel shown in Figure 3.3.
The growth-wheel helps SMEs to develop core competencies needed for growth
(Hardwig et al. 2011, pp 53–54). These competencies are developed with the help
of project learning. The growth-wheel is divided into four types of challenges
which have to be handled in order to manage growth. These challenges are:
1. Identify opportunities for growth
Companies have to identify new growth opportunities and customer
needs. By identifying new opportunities and trends early companies can
make their growth sustainable.
3. The project “Aprender a crescer” - “Learning to grow”
19
2. Develop objectives for growth
Many SMEs have to adapt their corporate strategy to realize identified
opportunities for growth.
3. Realize opportunities for growth
In order to realize opportunities for growth managers of SMEs have to
pass on responsibilities to their employees. Only by developing
competencies of the staff and upgrading the collaboration SMEs can use
their potential to a higher extend.
4. Manage growth
Companies that have grown strongly over a long period have to handle
consequences of their growth: The organization has to be adjusted or by
implementing a new hierarchical level or new management principles.
Other problems might be the supply of key resources (e.g. skills
shortages, financial constraints).
Figure 3.3
The growth-wheel
Source: Hardwig et al. 2011, p 54
3. The project “Aprender a crescer” - “Learning to grow”
20
Each of the four challenges has two levers of growth assigned to it (Hardwig et al.
2011, p 55). Levers of growth are starting points for the development of
competencies in SMEs. They give a practical response to the four challenges of
growth. The levers of growth are „moved‟ by project learning.
The growth-wheel does not have to be followed step by step (Hardwig et al. 2011,
p 55). It is not necessary to begin with the first challenge, identify opportunities
for growth, or following the wheel clockwise. In fact the growth-wheel supports a
SME to find out which business-related growth challenge it is facing at a certain
moment and defining the lever which has to be moved to handle it. Because a
company facing such a growth challenge needs to develop exactly these
structures, processes or competencies which help to handle it. To identify the
levers of growth, a diagnostic procedure has been developed which allows the
analysis of the growth situation of the company to select the appropriate starting
point for an initiative to enhance competencies for growth.
One of the SMEs which were chosen to develop a project in Germany was the
machine factory Gustav Eirich GmbH & Co KG. This company designed a
structured process for managing growth divided into seven incremental steps
(Hardwig et al. 2011, pp 138–139).
The seven steps for managing growth demonstrated in Figure 3.4 on the next page
serve as a guideline for the development, implementation and accomplishment of
projects.
The seven steps are grouped into three major phases. The first two steps are part
of the preparation. Firstly, the growth-potential has to be analyzed. Secondly, a
project to realize growth-potential is initiated. The next phase, called
configuration, consists of the steps three to five. Subsequent to the projectinitiation the project-team and its leader have to assume responsibility. Afterwards
3. The project “Aprender a crescer” - “Learning to grow”
21
a change-process is planned and then the actual change and learning process
happens. The final phase serves for the documentation. The results are reflected
and evaluated and afterwards transferred.
Figure 3.4
Seven steps for managing growth
Source: cf. Hardwig et al. 2011, p 139
4. Analysis of data
4
4.1
22
Analysis of data
Applying “Learning to grow” in Brazil
As written in the introduction the questionnaire developed in Germany needed to
be modified in order to meet Brazilian characteristics. As a first step the
diagnostic procedure developed by the project “learning to grow” in Germany to
analyze the growth situation of the company was translated into Portuguese and
some of the questions were modified. The sixteen questions are arranged around
the growth-wheel, positioned next to the adequate lever of growth. The result was
a map of the method “learning to grow” for Brazil, named “Aprender a crescer As alavancas do crescimento” (Figure 4.1).
Figure 4.1
Aprender a crescer - As alavancas do crescimento
Source: compiled by Silke Bartsch based on Hardwig et al. 2011, pp 149–150
4. Analysis of data
23
The diagnostic procedure assigns two evaluations to each question. On the one
hand the executives of interviewed SMEs are asked to give a self-assessment of
the company‟s performance in regard to each question. On the other hand they are
asked to estimate the relevance of each question for the competitive position of
their company.
The self-assessment of a company‟s performance in regard to each question is
symbolized with a traffic light and divided into three grades shown in Figure 4.2.
Figure 4.2
Self-assessment
The relevance of each question for the competitive position of a company is
divided into four levels demonstrated in Figure 4.3. An important detail: The
relevance should be evaluated independently from the own performance.
Figure 4.3
Evaluation of relevance
4. Analysis of data
24
The numbers of both evaluation systems are used for the numerical analysis in
this chapter.
The sixteen questions were rearranged to make it easier for the executives to read
them. Furthermore, explanatory examples were added to each question. An
explanation of the project “learning to grow” was enclosed to inform the SMEs
about the project, its objectives and the benefits the company can achieve.
Moreover, four questions to classify the companies were attached to the end of the
questionnaire. All put together resulted in a map which was send to the
participating SMEs in advance. The questionnaire is annexed to the thesis and can
be found in Appendix V.
Each of the fifteen interviews was done with an executive at the location of the
company. All interviews were recorded and the answers written down.
Firstly, the executives answered the questions by explaining which processes,
routines and competencies the company actually has and gave a self-assessment
of their performance.
Secondly, the firm‟s executives evaluated the relevance of each question for the
competitive position of their company. Finally the four classifying questions were
answered.
The answers given by the fifteen SMEs in regard to the sixteen questions are
analyzed in the chapters 4.2 to 4.5. For each question the common, best and worst
practices are assembled. The sixteen questions are divided into the four challenges
of growth.
Chapter 4.6 compares the numerical results of the self-assessment and evaluation
of relevance. Therefor the companies are classified by different criteria. Both,
4. Analysis of data
25
self-assessment and evaluation of relevance are individual opinions of the
executives which led to very different perspectives of their own situations.
4.2
4.2.1
First challenge of the growth wheel: Identify opportunities for growth
Analysis of each question of the first challenge of the growth wheel
Question 1:
”Our Company recognizes opportunities and trends in the markets
of reference and captures external knowledge of suppliers, partners
and customers systematically.”
The most common activities to recognize opportunities and trends with the help of
suppliers, partners and customers are the following: Most of the 15 companies
visit national and some even international fairs to see what is newly developed in
their market segments. Also the cooperation with public organizations, like
ACATE, SEBRAE or FIESC, is practiced by several companies. The SEBRAE
(Serviço Brasileiro de Apoio às Micro e Pequenas Empresas) is mostly frequented
by start-ups and small companies to help with general information and trainings,
but also to access new markets, technologies and innovations, as well as find
contact to financial services more easily (SEBRAE 2011a). The ACATE
(Associação Catarinense de Empresas de Tecnologia) is a sub-organization of the
SEBRAE and is in charge of the development of the technological sector in the
federal state of Santa Catarina (ACATE 2011). The organization takes care of
three technological companies interviewed for this thesis and helps them to
organize their business and analyze the technological markets. The chamber of
industry and commerce is called FIESC (Federação das Indústrias do Estado de
Santa Catarina) and represents the whole industry of the federal state (FIESC
2011). Another form of organization which is used by the 15 companies to
observe tendencies in the market are industrial, business and trade associations of
their segments.
4. Analysis of data
26
Nearly all of the fifteen companies stated that they frequently talk to their clients
to get a feeling what future developments are. Furthermore suppliers and other
business partners were mentioned as source for this type of information.
Some companies had superior ways to recognize opportunities and trends in the
markets of reference with the help of their suppliers, partners and customers.
Company A, a car repair business, reported that suppliers come to their shop to
give information and training about new developments and trends of the car
industry (Appendix A, p. 65). This company also informed that they use their
aftersales to ask their customers what they expect in future.
Another good example is company I, an engineering company producing movable
car lifters, which, on the one hand, has a joint venture with a German company, to
produce new products, and, on the other hand, does benchmarking with the help
of a specialized institute (Appendix I, p. 73).
A very scientific way to observe the market is pursued by company J, a
technological company providing analog intellectual property design (Appendix J,
p. 74). To observe the US American market they pay a sales-consultant who gives
them general information about the market and helps them to get in contact with
potential customers. For the European market they get information from a Swiss
professor and a French Ph.D. student is writing his dissertation about the global
market for their products.
The worst example in regard to the first question was company E, a forwarding
agent for the tobacco industry, which denied the existence of any form of market
observation at all (Appendix E, p. 69). Other, especially younger and therefor
smaller, companies like company D declared to be working very informal and
bearing any routines and systematics for their market monitoring (Appendix D, p.
68).
4. Analysis of data
27
Question 2:
”Our company is able to capture the knowledge of our employees
systematically.”
All companies answered to use the ideas of their employees somehow and that
their staff feels free to propose ideas, but when it came to the question if this
happens systematically there were many differences. In the worst cases, as in
companies E and G, the answer was that ideas of the employees are used but
without any routine or system (Appendix E, p. 69; Appendix G, p. 71).
But some similarities where found in regard to this question. A majority has
periodic meetings of different departments and areas to talk about their ideas, their
opinions about new products and where the employees can bring in their ideas for
innovation. Also when it comes to decision-taking many of the fifteen companies
involve their employees. Especially for the solution of problems with products or
services and their quality decisions are taken together with the employees.
Suggestion boxes for new ideas and proposals were also mentioned by several
companies. Most of the companies also have schedules to collect the ideas given
in meetings or suggestion boxes. Later on these ideas are evaluated and often
discussed to see if they are feasible or not. Many companies stated to give a
feedback to everyone giving an idea and in some companies an employee who
gave an idea which was realized later on is awarded somehow.
Some companies had superior methods to provoke their staff to give ideas.
Company C, a cookie-factory, has a program called BIS – “Boas Ideias e
Soluções” - Good Ideas and Solutions - accumulating all the ideas of the
employees (Appendix C, p. 67). Company H, a producer of boilers generating
electrical and thermal energy, has a campaign for quality (“Ação da qualidade”) to
use the knowledge of their staff to improve the quality of the products (Appendix
H, p. 72). The campaign collects all the ideas given by the workers in regard to
the quality and a committee evaluates the feasibility of these ideas. The company
4. Analysis of data
28
buys a desired product for those whose idea is approved by the committee. The
intranet is used by company O, a producer of data transmission technology, to
give employees the chance to register ideas (Appendix O, p. 79). Company L,
which develops minimally invasive surgical devices, informs all employees about
the newest developments via e-mail in order to give them the opportunity to share
their thoughts about it (Appendix L, p. 76).
But there were also enterprises which focused mainly on white-collar employees
regarding this question. Companies J, M and N mentioned in different ways that
they only refered to their upper level employees for the solution of problems,
development of new ideas or decision-making (Appendix J, p. 74; Appendix M, p.
77; Appendix N, p. 78). Company J is resolving product-based problems,
concerning quality or production, together with all type of employees. But more
comprehensive problems of the business, like strategy or financial topics are only
brought to management level.
Question 3:
”Activities of our company are directed at our customers and we
create new opportunities based on the (future) needs of our
customers.”
The self-assessment as well as the Evaluation of relevance for the own
competitiveness regarding this question has the highest mean value of all 16
questions (Figure 4.17, p. 57). This means that, in average, the companies
evaluate their own performance in regard to this question relatively high as well
as the relevance of this question for them being competitive. All companies
attested to direct their activities at their customers. But there were differences in
how far the contact with the consumer has a systematic approach.
In the worst cases, namely companies E and G, the company just talks to their
clients and asks them for their opinions and expectations but without any
documentation or regularity (Appendix E, p. 69; Appendix G, p. 71).
4. Analysis of data
29
In general the enterprises, interviewed for this dissertation, mentioned to be very
attentive towards their consumer‟s needs. Many of these companies develop
products together with their clients especially if these are business clients.
Company L, producing minimally invasive surgical devices, said that their
customers, medical surgeons, created a need which the company tried to satisfy
(Appendix L, p. 76). They met with surgeons and these told them what they need
and afterwards both together developed the device.
Another common practice of the fifteen companies is the customer survey
(Appendix F, p. 70; Appendix N, p. 78). Many of these companies do customer
surveys after sales and some even do periodic surveys afterwards. These are used
to ask consumers how to improve products and what they would like to have in
future. Some of the 15 companies have established ISO standards which require
the company to do customer surveys.
Also in this question company H has a superb approach to satisfy their
consumer‟s needs (Appendix H, p. 72). Before each sale of one of their electric
and thermal energy generating boilers they have a process which has to be
completed. This process includes visiting the client as well as the client visiting
company H to see how the boiler will be produced. The customer will also be
brought to another client of the company to see a working boiler. All these steps
are undertaken to secure the best information for the customer before he orders the
expensive product. During this process company H gets a huge return by the
customer and his expectations regarding the product. After each sale the company
does a customer survey with the client and repeats this survey each year to ask if
the customer is satisfied with his machine. Together with the regular reports
delivered by company H‟s sales force this gives them the opportunity of
improving the quality of their existing products and develops new ones with the
help of their customers.
4. Analysis of data
30
Company C, a producer of sportswear for women, uses its sales people and store
managers to keep contact with the customers because the company has no direct
contact to them (Appendix C, p. 67).
Question 4:
” By the use of partnerships and networks with external partners
(research institutions, universities, associations, etc.) we create
opportunities for innovation and growth systematically.”
In opposite to question 3, which has the highest mean values, question 4 is the
question with the lowest mean values for the self-assessment and the relevance for
the own competitiveness (Figure 4.17, p. 57).
Many of the 15 companies told they would be afraid of losing their competitive
advantages if they collaborated with other institutions and therefor preferred
working on their own. There are mostly weak relations with governmental
institutions like the before mentioned FIESC, SEBRAE and ACATE, or others
like ACIF (Associação Comercial e Industrial de Florianópolis), ACIRS
(Associação Comercial e Industrial de Rio do Sul) and SIMMMERS (Sindicato
das Indústrias Metalúrgicas, Mecânicas e do Material Elétrico). These linkages are
basically used to get little information about current market situations. Only
ACATE plays a more important role for three of the fifteen companies, which are
technology start-ups having their place of business at the ACATE building and
getting a lot of help to get their business started. This help includes administrative
help as well as trainings in different areas. Others said they worked only together
with business partners to develop their products and materials.
Companies D, E and G instead do not have any alliances with other institutions at
all (Appendix D, p. 68; Appendix E, p. 69; Appendix G, p. 71). Company C even
mentioned it was closed for other participants (Appendix C, p. 67). Company F
said quite the contrary F. It would have liked to have a kind of collaboration with
4. Analysis of data
31
universities or other institutions, but was not able to do so until now (Appendix F,
p. 70).
Much more successful in creating collaborations with institutions are others of the
fifteen companies. Company J has various types of institutions they collaborate
with (Appendix J, p. 74). They are participating at conferences of the organization
CI Brasil, which informs about integrated circuits, and also another organization
related to semi-conductors. They also collaborate with universities to get
technological knowledge and develop new products, like the laboratory for
integrated circuits of the federal university of Santa Catarina (UFSC), the
university Santa Maria of Rio do Sul (Universidade Santa Maria do Rio do Sul)
and also the federal technical university of Lausanne (École polytechnique
fédérale de Lausanne). Company H worked together with the mechanical
engineering department of UFSC to develop new filters for their boilers for the
reduction of noxious emissions (Appendix H, p. 72). Company L works together
with different universities and foundations of the region, like UFSC, FINEP,
FESC or FAPESC, to develop minimally invasive surgical devices (Appendix L,
p. 76). They also get support of the CNPq (Conselho Nacional de
Desenvolvimento Científico e Tecnológico) in form of scientific subsidies.
4.2.2
General impression of the first challenge of the growth wheel
To capture external knowledge and thereby identify new tendencies and chances
in the market of reference is an important step for a company (Hardwig et al.
2011, p 56). Therefor it is important for SMEs to have routines and systems for
observing the market.
The first two questions refer to the first lever of this challenge “Identify
opportunities for growth”. The lever is about building up chances in the business
environment (Figure 4.4).
4. Analysis of data
Figure 4.4
32
Identify opportunities for growth
Source: Hardwig et al. 2011, p 56
The Brazilian companies interviewed for this thesis were on average quite
confident with their performance in regard to the first question. The mean value of
the self-assessment of the own performance for this question is 0.67 on a range
from zero to one (Figure 4.5).
The value goes with the answers given by the executives. Most of the companies
use their external parties to identify market opportunities. Also the mean value of
the evaluation of the relevance of this question for the competitive position of the
company is high. The value is 2.6 on a range between zero and three. That means
that the question is highly relevant for the majority of the fifteen companies.
Figure 4.5
Mean values for questions 1 - 4
Question 1
Question 2
Question 3
Question 4
Questions 1-4
SelfSelfSelfSelfSelfRelevance
Relevance
Relevance
Relevance
Relevance
Assessment
Assessment
Assessment
Assessment
Assessment
0.67
2.60
0.60
2.40
0.80
2.93
0.47
2.00
0.63
2.48
The second question has mean values quite similar to the first question. The
answers given approve the high mean values. Most of the companies do have
systems and routines to capture the knowledge of their employees.
4. Analysis of data
33
The answers and numerical results for the first two questions prove that the first
lever of the first challenge of the growth-wheel is used quite homogeneously by
the fifteen SMEs interviewed.
Quite the opposite is true for the second lever. Whereas the third question has the
highest mean values for both, evaluation of self-assessment and relevance, the
fourth question has the lowest ones in both cases.
The answers given by the SMEs are coherent to the mean values. There is no
company which does not direct its activities towards its customers. A company
has to do so in order to sell its products, which is purpose of a business. But many
of the fifteen companies are having a reserved attitude towards cooperation with
research institutes, universities or other organizations. The fear of losing a
competitive advantage is bigger than the expected positive effect such cooperation
could have.
In general the four questions of the first challenge of the growth-wheel were
evaluated as highly relevant for the competitive position.
4.3
4.3.1
Second challenge of the growth wheel: Develop objectives for growth
Analysis of each question of the second challenge of the growth wheel
Question 5:
” We have a convincing strategy and objectives for growth. We are
able to update our strategy and objectives quickly in order to
respond to new trends.”
Also for the majority of the fifteen Brazilian companies the planning of strategies
and objectives is important for the success of their businesses. Therefor a lot of
them do a more or less formal planning. Generally an annual planning is done for
the business activities. This planning includes new products, sales forecasts,
machines, budget or the financial situation. In normal case the enterprises do
4. Analysis of data
34
document their planning and at the end of the year a target-performance
comparison is done. The bigger ones of the fifteen companies expand their
planning to the different departments, e.g. companies H and I (Appendix H, p. 72;
Appendix I, p. 73). In addition some of the companies react to changes interfering
with their planning during the year. Company M registers these types of changes
and integrates them into their planning. If necessary an alignment of the strategy
is done (Appendix M, p. 77). Company I observes its planning each month in a
meeting and modulates it if needed (Appendix I, p. 73).
The planning of the long term strategy is done much more informal by many of
the interviewed enterprises (Appendix L, p. 76). Company M represents quite the
contrary. It realizes meetings with all the investors to set up the strategy for the
long run (Appendix M, p. 77).
Only company A revealed not to have done any planning and the strategy of
company D exists only in the mind of the two entrepreneurs (Appendix A, p. 65;
Appendix D, p. 68). Company J is a start-up and began to formalize a strategic
planning for this year, but they did not finish. Moreover they think that the
strategy should be formalized differently (Appendix J, p. 74). Company N instead
has a well elaborated strategy, but is not contend with the participation of the
employees (Appendix N, p. 78). They would like them to help developing the
strategy and be more anxious to help reaching the objectives proclaimed in the
strategy.
Question 6:
” We are able to develop new business models that create long term
value.”
The ways to achieve creation of long term value are varying a lot between the
enterprises polled for this thesis. While company A declared not to have planned
any new business models or products at that moment, company F does not have a
formalized way to guarantee long term value (Appendix A, p. 65; Appendix F, p.
4. Analysis of data
35
70). The company is searching for new products and business models but without
a plan.
A more promising procedure is done by companies I and J, which integrate the
development of new business models into their annual planning (Appendix I, p.
73; Appendix J, p. 74). Thereby they assure to provide the necessary financial and
human resources for these objectives. Company M analyses its product portfolio
periodically in order to detect where to force the development of new ones
(Appendix M, p. 77). Furthermore the board conceives of a long term strategy for
5 to 10 years. This long term strategy helped the company to amplify their product
range. The company had focused on the production of plastic panels for white
goods before. Now they produce plastic parts for the automotive industry in
addition to that. This kind of amplification is also done by others of the fifteen
companies. Company B, producing women sportswear, created own conceptstores to have a direct contact with their clients and develop a stronger brand
(Appendix B, p. 66). But they had to broaden the spectrum of products to make
the concept-stores worthwhile. Thus a beachwear line was introduced beside the
sportswear.
Both, companies H and O, want to transform from a producing to a service
company (Appendix H, p. 72; Appendix O, p. 79). To achieve this goal company
H has outlined a strategy to strengthen their service quality and become the best
attendance company of Brazil by 2013. Company O formalized a five year
process to guide this transformation.
The development of new business models is a characteristic of Company N
(Appendix N, p. 78). It was always a pioneer and the first company, which tried to
get the public permission for a toll road in Brazil. The company has a department
for the development of new services and business models. The company tries to
fight the fluctuation of their earnings by focusing on new business models with
long term cash flows.
4. Analysis of data
36
Question 7:
” The corporate strategy does not only exist in the mind of the
entrepreneur. It is communicated intensely and the employees are
involved in the development to understand how they can contribute
to the success of the business.”
Several of the fifteen enterprises of the survey communicate the corporate strategy
to their employees. Company H stated that all employees were informed about the
strategy. The enterprise used the bulletin board to spread the information
(Appendix H, p. 72). A staff meeting at the beginning of the year is used by
company M to inform their employees about objectives and corporate strategy
(Appendix M, p. 77). Also company N uses an annual meeting for the same
purpose (Appendix N, p. 78).
All the employees of company L are informed about the corporate strategy, but
the enterprise regretted that the procedure is very informal and is actually
developing more systematic information (Appendix L, p. 76). Due to being a
small company the whole personnel of company J knows the strategy and how
they can contribute to the success of the business (Appendix J, p. 74).
Company B mentioned an internal journal they wanted to initiate to inform the
staff about actual news of the company and strengthen the corporate identity
(Appendix B, p. 66).
Only few enterprises failed regarding this question. Company D does not have
any information exchange concerning the strategy with the employees (Appendix
D, p. 68). Companies F and O do only inform the employees on management
level about the strategy, but the other part of the staff does not get this information
(Appendix F, p. 70; Appendix O, p. 79).
4. Analysis of data
37
Question 8:
” Our company knows how to inspire our employees regarding the
goals of the company.”
Even the inspiration of employees in regard to the company objectives is not
formalized by company D (Appendix D, p. 68). But the other interviewed
companies have different ways of doing so.
A common model in the fifteen companies is a monetary approach. The
production area of company B has production targets for each weak and the
workers receive a salary bonus if the target is achieved (Appendix B, p. 66).
Company F works with sales quotas for their vendors (Appendix F, p. 70). The
rest of the business has to contribute in order to achieve the goal. But now the
company also wants to implement a system to give all employees a share in the
profits at the end of a business year. The enterprise wants the share to depend on
productivity, sick days, further trainings and other parameters. Company I already
has such a system, which allows the staff to participate in the profit (Appendix I,
p. 73). Their system is not linked to the salary of the employees. Each one gets the
same share of the profit which means a big deal and huge motivation for the ones
earning low wages.
Another enterprise with profit participation is company H (Appendix H, p. 72).
All employees receive a part of the profit as a bonus at the end of the year.
Because of the time-consuming production of huge boilers the company
introduced another bonus to assure the punctual delivery to the customer. Each
time a boiler is handed over on the agreed date the employees receive two percent
of the receipts. The enterprise has a very low fluctuation of the staff, which shows
satisfaction and a high motivation of the employees.
Company C attributes the high motivation of the employees to the low hierarchy
and company J is sure that all their employees are stimulated to contribute to the
success of the business because it is a small upcoming enterprise and all the staff
4. Analysis of data
38
know the objectives and feel how they are being a part of the success (Appendix
C, p. 67; Appendix J, p. 74).
4.3.2
General impression of the second challenge of the growth wheel
The second challenge and its two levers are shown in Figure 4.6. The questions
five and six are assigned to the first lever called “Formulation of a growthstrategy”.
Figure 4.6
Develop objectives for growth
Source: Hardwig et al. 2011, p 62
Performance and relevance were evaluated quite equally for both questions
(Figure 4.7). The values of either of the questions are relatively high, which
combines with the answers analyzed in the chapter before. Most of the companies
have documented strategic planning and business models creating long term
value.
Figure 4.7
Mean values for questions 5 - 8
Question 5
Question 6
Question 7
Question 8
Questions 5-8
SelfSelfSelfSelfSelfRelevance
Relevance
Relevance
Relevance
Relevance
Assessment
Assessment
Assessment
Assessment
Assessment
0.63
2.53
0.67
2.53
0.50
2.53
0.53
2.73
0.58
2.58
The two questions assigned to the second lever of the challenge, “enthusing the
employees for the growth-targets”, are different to the ones of the first lever. The
4. Analysis of data
39
relevance for the competitive position was evaluated high in case of the seventh
(2.53) and very high in case of the eighth question (2.73). But the self-assessment
of the performance in regard to both questions is close to 0.5, which means the
companies think they are doing it more or less good in average. Nonetheless the
answers given by the executives showed that there are some routines applied in
regard to these questions.
The second challenge has the highest mean value for the relevance of all four
challenges of the growth-wheel (2.58). But the performance, evaluated in the selfassessment, has the lowest mean compared to the other three challenges. One
could assume that, in case of the fifteen SMEs in Santa Catarina, the challenge of
developing objectives for growth offers the biggest potential for improvement
combined with a high relevance for the competitive position.
4.4
4.4.1
Third challenge of the growth wheel: Realize opportunities for growth
Analysis of each question of the third challenge of the growth wheel
Question 9:
” Our employees think and act with the spirit of an entrepreneur
and act with a high degree of responsibility.”
A good participation of the staff in the technical development of the products was
reported by company J. The employees take decisions and feel responsible for
them (Appendix J, p. 74). Company I said that the delegation of responsibility was
common practice and the climate was positive towards ideas and proposals made
by the employees (Appendix I, p. 73). Another example is company H that has a
standard form for suggestions and will give incentives if these are applied
(Appendix H, p. 72). Furthermore the engineers have the technical responsibility
of the products. The heads of the different areas have responsibility and space to
act on their own.
Company H already shows a picture which is affirmed by other companies of the
survey: In many cases only the management level and lead workers have
4. Analysis of data
40
responsibility. Company N only mentioned that responsibility was only delegated
down to a certain level (Appendix N, p. 78). Just the employees of the
administration participated in important decisions reported company B (Appendix
B, p. 66). They argued that the knowledge of the rest of the staff was very basic.
In the case of company O the employees are more reactive than proactive
(Appendix O, p. 79). They have the liberty to take decisions in their areas, but are
often insecure and take these decisions to the upper level. Only on management
level the employees act with the spirit of an entrepreneur. Even though having
weekly meetings where everyone can participate and give proposals, company A
misses the initiative of its workers (Appendix A, p. 65). They are thinking of a
way to stimulate the participation of the employees with tombola or something
like this, but did not realize anything until now. Company M only realized that
there was a need for advancement regarding the entrepreneurial spirit of the
employees, because the staff‟s own initiative was too low (Appendix M, p. 77).
Others of the companies are more successful. The before mentioned BIS program,
“Boas Ideias e Soluções” - Good Ideas and Solutions, of company C helps the
employees in giving ideas and proposals (Appendix C, p. 67). Company F
declared that each employee had a certain field where he was responsible
(Appendix F, p. 70). It expects that an employee is an expert in his area and
knows more than the entrepreneur. Therefor they should take certain decisions. A
company policy which guaranteed responsibility of each employee was mentioned
by company L (Appendix L, p. 76). The staff can act on their own authority.
Problems are informed to everyone in order to find a solution altogether. A lot of
communication and exchange of ideas is happening too.
4. Analysis of data
41
Question 10:
” Our executives know how to delegate and create spaces of
empowerment for our employees.”
The impression given by question nine is quite similar to this one. On the one
hand some of the companies know how to delegate tasks and on the other hand
there is a fear of losing control.
Many of the polled enterprises said to have delegated responsibility, like company
F. in addition to that many decisions are taken in groups (Appendix F, p. 70). The
same is practiced in company A (Appendix A, p. 65). Problems are resolved in
groups of employees out of the affected areas. Company B defines the free space
of each employee (Appendix B, p. 66). Also company J explained that the
delegation of responsibility was common practice (Appendix J, p. 74). It tries to
centralize as little as necessary and decentralize as much as possible. Nevertheless
decisions of a larger scope are taken by the executives and only decisions in
relation to the products are made together with the other employees.
The same happens in other of the fifteen enterprises. In company C the
entrepreneurs observe and control all processes, because they fear that it will not
be done the way they want it (Appendix C, p. 67). The delegation of responsibility
happens fractional. Often duties are delegated but the responsibility stays with the
management. Company H delegates responsibility, but when the executives see
that things are going wrong they take it away and decide what to do themselves
(Appendix H, p. 72). The same happens in company O, where the lower staff only
receives assignments (Appendix O, p. 79). Problems are discussed in groups, but
decisions are taken by the directors. Another example is company N, which has
more centralization than delegation, due to being a family-owned enterprise
(Appendix N, p. 78). There is the will to change that situation and they start to
give the employees more responsibility, but often the workers ask their superior
when having a problem instead of resolving it. Company M mentioned that
employees on management level, technicians and lead workers were having the
4. Analysis of data
42
power to take decisions, but the participation of the ordinary workers had to be
upgraded (Appendix M, p. 77).
A good example is given by company L which has an organization in which
everyone has his own area where he can act freely (Appendix L, p. 76). Many
decisions are taken together and at the beginning of the development of a new
product they do a brainstorming with all the staff for a maximum response.
Question 11:
”We develop the skills of our employees systematically to ensure
growth.”
The majority of the fifteen companies are aware of the importance of developing
the skills of their employees.
Firstly, many of the interviewed enterprises have competence matrices. The
companies F, H, I, L and M mentioned they had a competence mapping
(Appendix F, p. 70; Appendix H, p. 72; Appendix I, p. 73; Appendix L, p. 76;
Appendix M, p. 77). In the cases of H and M the ISO standards introduced in the
enterprises presuppose a competence matrix.
Secondly, different types of training courses are common for them. Company B
stated that many of the employees were trained (Appendix B, p. 66). Company M
offers internal and external training courses in technical and other skills
(Appendix M, p. 77). For each job Company C, a cookie factory, has regulations
which skills are necessary (Appendix C, p. 67). The company looks if an
employee has the needful skills and if not he will be trained. Moreover, the
company provides short time trainings about quality, productivity, motivation and
best practices of fabrication. In addition relevant literature about hygiene is shared
with all employees. Company L offers technical courses for their staff and
activates its employees to visit trainings of ACATE (Appendix L, p. 76).
Company F also runs several training courses and even trains employees for other
4. Analysis of data
43
areas than their actual working environment to have them as a reserve (Appendix
F, p. 70). Finally, Company H has obligatory trainings and offers special courses
in addition to that, e.g. IT or language courses (Appendix H, p. 72). Unfortunately
the employees often do not attend the courses, even though the company asks
them to, saying they do not have time for it, and prefer to go on with their
workload.
On top of that a few companies help their staff to study and get a better education.
Company I supports employees if they want to go to university. Furthermore
company F inspires its workforce to study. All courses are financed entirely, e.g.
master courses (Appendix F, p. 70; Appendix I, p. 73).
In contrast to this is the behavior of others. The companies A and E do not have
any framework at all to develop skills of their employees (Appendix A, p. 65;
Appendix E, p. 69). In case of company D the development of capacities is
happening very informal (Appendix D, p. 68). The staff is trained during the
everyday business. Another example without a system is company N (Appendix
N, p. 78). If an employee shows dedication and talent the enterprise pushes his
development, but there is no systematic approach to detect talented staff members.
Question 12:
” We share knowledge actively among departments, roles and across
several hierarchies of the company.”
Most of the polled companies share knowledge across all areas. The companies A,
F, L and M have periodic cross-departmental meetings with the participation of
various hierarchies where new products, tendencies and everything else of note is
discussed (Appendix A, p. 65; Appendix F, p. 70; Appendix L, p. 76; Appendix
M, p. 77).
Daily meetings with the head of each department are used by company H to adjust
the workflow (Appendix H, p. 72). Furthermore, periodic meetings across
4. Analysis of data
44
hierarchies, management with staff and management with directors, help to share
information.
Another tool, which is quite common among the fifteen enterprises, to share
information and resolve problems are groups of improvement (Appendix A, p. 65;
Appendix H, p. 72; Appendix L, p. 76; Appendix M, p. 77). These groups consist
of employees of different areas who can help to resolve a problem coming up.
Only company E denied having any means to help the knowledge flow (Appendix
E, p. 69). Company D does not see any need for it, because the enterprise is so
small that there is not really a hierarchy or departments (Appendix D, p. 68).
Everyone speaks to each other during a day and the knowledge is passed on that
way. In contrast to this company B detected that there is no interaction across
departments and is thinking of an internal journal to improve the situation
(Appendix B, p. 66).
Company N had the same problem as company B, but already started to do
something against (Appendix N, p. 78). A consultant was hired to help bettering
the personal interrelations between the employees in order to have more contact
across departments.
4.4.2
General impression of the third challenge of the growth wheel
The two questions assigned to the first lever of the third challenge of the growthwheel are questions number nine and ten. The lever is called “Guiding employees
to entrepreneurial thinking” (Figure 4.8).
Figure 4.8
Realize opportunities for growth opportunities
Source: Hardwig et al. 2011, p 67
4. Analysis of data
45
The ninth question has a very high mean value for the self-assessment (0.7) and
also the tenth question was evaluated quite high regarding the performance (0.63).
Even though the answers showed that many companies are only incorporating
their white-collar workers when it comes to entrepreneurial thinking and
empowerment.
Figure 4.9
Mean values for questions 9 - 12
Question 9
Question 10
Question 11
Question 12
Questions 9-12
SelfSelfSelfSelfSelfRelevance
Relevance
Relevance
Relevance
Relevance
Assessment
Assessment
Assessment
Assessment
Assessment
0.70
2.60
0.63
2.53
0.53
2.47
0.63
2.33
0.63
2.48
The second lever, called “building up knowledge and competencies”, was
analyzed by questions eleven and twelve. The eleventh question has a lower
mean value close to 0.5. The companies interviewed for this dissertation are aware
of the importance of developing skills and knowledge of their employees, but
many of them would like to do more. Often the financial resources SMEs can
assign to trainings are not that much. The self-assessment of the performance
regarding question twelve is high. Most of the companies share knowledge across
departments. Many of the fifteen companies are quite small so that everyone
knows each other. This might also be the cause for the low mean relevance (2.33)
this question has for the competitive position. There are not many hierarchies or
departments which have to share knowledge.
4. Analysis of data
4.5
4.5.1
46
Forth challenge of the growth wheel: Manage growth
Analysis of each question of the fourth challenge of the growth wheel
Question 13:
” We are able to adapt our processes and organization (company) to
the challenges of growth.”
Formalized processes are needed, when a company is growing so much that it
cannot be supervised by the entrepreneur on its own anymore. Also the Brazilian
companies of the survey face these problems.
Company I has formalized all its processes, the functions and job specifications of
each employee (Appendix I, p. 73). Company H has the same kind of
documentation, which is supervised by its quality-department (Appendix H, p.
72). Another example is company O, which has all processes documented in an
electronic system (Appendix O, p. 79). The whole staff has access to the system to
check up.
Furthermore, company C has a documentation of all the processes in form of
technical norms and divides them into three classes, operational, measurement and
administrative norms (Appendix C, p. 67).
Also company A creates documents to define their processes and services
(Appendix A, p. 65). The aftersales department gives advices how to improve
both and afterwards the enterprise has guidance for process reengineering. The
processes of Company F are formalized (Appendix F, p. 70). But it sees a need for
improvement in terms of amplitude and actualization of the documents.
Other enterprises have more difficulties to adapt to growth. The companies E and
J said that the adaption happens via a very informal way (Appendix E, p. 69;
Appendix J, p. 74). The quality of the documentation of processes is very bad in
company J for instance. If the enterprise would lose an important employee they
would have poor information for his replacement. The processes of company N
4. Analysis of data
47
are only outlined in the minds of the executives (Appendix N, p. 78). But the
company plans a documentation system. Company G has no documentation of
processes at all (Appendix G, p. 71).
Company B adapts very good to the growth it faces (Appendix B, p. 66). After the
foundation eight years ago the enterprise already moved twice. New software was
introduced, the staff trained and employees with experience in the market were
contracted.
Question 14:
” Executives and employees know how to cope with the growth.”
The growth can also be a big motivation for both, executives and employees.
Companies A, C and F that growth is a huge motivation for their employees,
because they feel being a part of a success story (Appendix A, p. 65; Appendix C,
p. 67; Appendix F, p. 70).
But if a company is growing very fast other problems arise. Company I is coping
with an excessive growth around forty percent a year (Appendix I, p. 73). On
account of this the company needs new employees all the time. These have to be
introduced and trained. Supplier and business partners become more and have to
be managed. All together the growth asks for dynamic adaption of the enterprise
to new circumstances.
Moreover, company O is growing fifty percent a year and finds it difficult to
revise processes (Appendix O, p. 79).
The technical attendance of company H suffered seriously (Appendix H, p. 72).
The enterprise had a period of huge growth which led to a lot of new customers.
Due to the complexity of the maintenance of their products the quality of the
service reduced. The company was not able to contract and train new personnel
fast enough. But the mistake was recognized and now the company is focusing
4. Analysis of data
48
more on the service and less on selling new equipment to have a sustainable
growth.
The companies D, G and L do not have any measures to cope with growth
(Appendix D, p. 68; Appendix G, p. 71; Appendix L, p. 76). They grow and react
to the new circumstances.
Question 15:
” We ensure the availability of staff needed for growth.”
When an enterprise is growing it needs to manage having a growing staff with
high skills. The answers of the companies stated below are divided in approaches
to anticipate the number of workers needed tor growth, finding new employees
and keeping skilled workers in the organization.
Due to being start-ups which began few years ago the companies K and L have
valid business plans where they forecasted the necessary work force for the next
years (Appendix K, p. 75; Appendix L, p. 76). Company N uses its annual
planning to dimension the staff needed to operate normally and company I
analyzes each month if new employees are needed, because the growth is so high
(Appendix N, p. 78; Appendix I, p. 73). The forecast for the staff needed is based
on the projects planned for the future in case of company J. The company knows
that next year the number of projects will be higher than this year and therefor the
search for two or three new staff members started already (Appendix J, p. 74).
The Brazilian companies of this survey use several ways to find the right workers.
Head-hunter, job fairs at universities, advertisements in newspapers, radio or the
internet, indications and internal employments were mentioned.
A common pattern is the differentiation between administrative or technical jobs
and basic production (Appendix C, p. 67; Appendix D, p. 68; Appendix E, p. 69;
Appendix I, p. 73). Mostly indications, internal tips and sometimes advertisements
4. Analysis of data
49
in radio or newspapers are used to find new workers for the production. But when
companies are searching for a new employee for administrative or technical jobs
head-hunter and job fairs at universities are used more often.
A problem concerning the polled enterprises is the absence of skilled labor. For
company F, producing different products out of metal, it is a big challenge to find
adequate workers (Appendix F, p. 70). The employees hired for production come
without skills and have to be trained internally. On top of that the rotation of the
workforce is quite high and the company has to look for new staff members very
often. Furthermore, company M develops its personnel internally, due to lack of
skills of the contracted workers (Appendix M, p. 77). Also company O has the
problem that the workers enter the company with twenty percent of the skills
needed to fulfill the job expectations and the rest has to be built up by the
enterprise itself (Appendix O, p. 79). In addition the trained personnel with high
technical skills are offered lucrative jobs by the competition. For company B,
producing women sportswear, the operatives with good sewing skills are very
important, but also very scarce in the region, because the textile industry is strong
there (Appendix B, p. 66). Therefor the company pays sixty Brazilian Reals for
each one who indicates a sewer, who is contracted later on. Company H would
like to start a trainee program to build up professionals itself and (Appendix H, p.
72).
In order not to lose the skilled staff the companies have different incentives. On
the one hand company H pays salary above market average (Appendix H, p. 72).
On the other hand it also uses nonmonetary ways to create a link between itself
and the employees. Each year all the employees of the organization do a bicycle
excursion on the company‟s birthday and a Christmas party is organized for the
staff‟s children.
The fluctuation among the workforce of company I is very low (Appendix I, p.
73). This fact is regarded to a mix of rational salaries, profit sharing, health plans,
4. Analysis of data
50
provided training courses and offering employments in a company which is
growing a lot and where everyone is treated with respect. Above all an employee
satisfaction survey is done each year. The results of the survey are analyzed and
guide to an improvement process.
The companies J and L are young start-ups which momentarily are not able to pay
high salaries or expensive health plans (Appendix J, p. 74; Appendix L, p. 76).
For this reason they named other attempts to keep their employees. The
employees feel being a part of the team and are motivated by participating in the
success of a growing business from the beginning. Company J invites the whole
staff to a dinner after a successful project and the employees of company L
appreciate the respect and responsibility they are receiving.
Question 16:
”We ensure the financing of growth proactively.”
Many of the participating companies are very precautious regarding their financial
situation. The companies B, C, D, F and G do only look for external financing if
the amount is very high (Appendix B, p. 66; Appendix C, p. 67; Appendix D, p.
68; Appendix F, p. 70; Appendix G, p. 71). Company C took a loan only one time
when it built a new plant. But in general it is preferred if the amount can be
funded with own financial resources. Moreover, company N mentioned to be
looking for attractive funding constantly (Appendix N, p. 78). But it tries to keep
the debt low.
Most of the fifteen companies said that decisions about financial issues are taken
by the executives. The different departments of company N analyze their need for
financial resources and based on that the directors decide how much money is
assigned to each department (Appendix N, p. 78).
The financial issues are part of the annual planning of companies L, M and O
(Appendix L, p. 76; Appendix M, p. 77; Appendix O, p. 79). The financial
4. Analysis of data
51
situation is analyzed and a forecast of the amount needed to finance future
operations is done. Thereby these companies ensure a proactive financing of
growth.
The Brazilian Development Bank (BNDES) was mentioned as a source for
advantageous financing by some of the fifteen companies (Appendix J, p. 74;
Appendix M, p. 77). Company E, a freight forwarding business, finances its
trucks with BNDES loans (Appendix E, p. 69). Company O receives cheap
BNDES loans for their research and development activities (Appendix O, p. 79).
Two companies showing a bit more readiness to assume risk are companies J and
K (Appendix J, p. 74; Appendix K, p. 75). They are thinking about venture
capital. Both are start-ups of the technology industry.
4.5.2
General impression of the fourth challenge of the growth wheel
The first lever of the forth challenge of the growth-wheel is called “Expanding
organization” and the second one “guaranteeing resources proactively” (Figure
4.10).
Figure 4.10
Manage growth
Source: Hardwig et al. 2011, p 82
All the questions assigned to the two levers of the last challenge have relatively
high mean values for the self-assessment around 0.6. The answers given by the
executives do correspond to the values. Most of the fifteen SMEs do have defined
4. Analysis of data
52
processes, know how to cope with growth and ensure financial and human
resources.
Figure 4.11
Question 13
Mean values for questions 13 - 16
Question 14
Question 15
Question 16
Questions 13-16
SelfSelfSelfSelfSelfRelevance
Relevance
Relevance
Relevance
Relevance
Assessment
Assessment
Assessment
Assessment
Assessment
0.60
2.53
0.63
2.40
0.60
2.53
0.63
2.33
0.62
2.45
The mean value for the relevance of question sixteen for the competitive position
is comparatively low (2.33). Most of the companies are using own
4.6
Analysis of the different company-classifications
Figure 4.12 divides the fifteen companies into three groups depending on the
mean value of the self-assessment. The companies L, I, M, H and J belong to the
group with the best mean values. This goes along with the examples given in the
analysis of each question in chapters 4.2 to 4.5. These companies provided many
good examples of successful methods to guarantee a sustainable growth.
Figure 4.12
Companies classified into best, medium and worst mean values
Relevance
Relevance
Best
Selffor
Selffor
medium Company
assessment competitive assessment competitiv
worst
postion
e postion
Company L
0.88
2.94
Company I
0.84
2.88
Best Company M
0.78
2.88
0.44
2.31
Company H
0.75
2.75
Company J
0.72
2.63
Company B
0.66
2.56
Company C
0.63
1.81
Medium Company K
0.63
2.69
0.61
2.38
Company N
0.56
2.19
Company F
0.56
2.63
Company O
0.53
2.25
Company D
0.50
2.38
Worst Company A
0.50
2.38
0.79
2.81
Company G
0.41
2.38
Company E
0.28
2.19
4. Analysis of data
53
The companies B, C, K, N and F belong to the medium group and with mean
values of the self-assessment between 0.56 and 0.66.
The companies O, D, A, G and E belong to the group with the lowest mean values
in regard to the self-assessment. Especially the companies E and G were
mentioned quite often as negative example in the chapters 4.2 to 4.5, proving the
low score.
A chart with further information on this classification is attached to the thesis in
Appendix P (p. 80 of this thesis).
Figure 4.13 shows the fifteen companies classified into four groups depending on
the number of employees each of them has. The mean value of the self-assessment
is rising with the number of employees a company has. The group of companies
with 150 to 499 employees has a significantly higher mean value than the other
three groups.
Figure 4.13
Companies classified by number of employees
Number of
employees
Relevance
Relevance
Selffor
Selffor
Company
assessment competitive assessment competitiv
postion
e postion
company D
company E
company G
0-20 employees
company J
company K
company L
company A
21-49 employees company C
company F
company B
50-149 employees company O
company H
company I
150-499 employees
company M
company N
0.50
0.28
0.41
0.72
0.63
0.88
0.50
0.63
0.56
0.66
0.53
0.75
0.84
0.78
0.56
2.38
2.19
2.38
2.63
2.69
2.94
2.38
1.81
2.63
2.56
2.25
2.75
2.88
2.88
2.19
0.57
2.53
0.56
2.27
0.59
2.41
0.73
2.67
4. Analysis of data
54
One reason might be the need for structuring and organization of a company of
that size. These companies already introduced routines and systems to guarantee a
sustainable growth. Smaller companies tend to do things informal without
structuring and are not constrained to force the communication and knowledge
flow because there are not as many hierarchies and departments to overcome as in
bigger companies.
A chart with further information on this classification is attached to the thesis in
Appendix Q (p. 81 of this thesis).
The table shown in Figure 4.14 divides the fifteen Brazilian SMEs into four
groups depending on the level of innovativeness of each company. In order to
classify them the companies were asked the following question: “Did your
company develop new products (goods and services) or processes during the last
years?”
Figure 4.14
Companies classified by innovativeness
Level of innovativeness
Company
Neither innovations of products nor of processes Company D
Company E
Either innovations of products or of processes
Company M
Company N
Company A
Company G
Company H
Innovations of products and of processes
Company K
Company L
Company O
Company B
Company C
Many innovations of products and of processes
Company F
Company I
Company J
Relevance
Relevance
Selffor
Selffor
assessment competitive assessment competitiv
postion
e postion
0.50
0.28
0.78
0.56
0.50
0.41
0.75
0.63
0.88
0.53
0.66
0.63
0.56
0.84
0.72
2.38
2.19
2.88
2.19
2.38
2.38
2.75
2.69
2.94
2.25
2.56
1.81
2.63
2.88
2.63
0.50
2.38
0.54
2.42
0.61
2.56
0.68
2.50
The higher the level of innovativeness the higher the mean value of the selfassessment is. This proofs that, in the case of the fifteen companies in Brazil, the
4. Analysis of data
55
ones which evaluate their performance in regard of the sixteen questions high do
also have a higher level of innovation. The companies having more routines and
system to manage growth developed many innovations of products and processes
in the last years.
A chart with further information on this classification is attached to the thesis in
Appendix R (p. 82 of this thesis).
Figure 4.15 groups the fifteen SMEs depending on their investments in R&D. The
results correspond to the ones of the chart above. Companies which evaluated
their performance higher in the self-assessment also invested more into R&D. The
companies L and K had the highest investments in R&D with more than ten
percent of income. They are very concerned with developing new products and
are willing to invest in it. These companies are interested in developing processes
and structures in order to systemize innovation.
A chart with further information on this classification is attached to the thesis in
Appendix S (p. 83 of this thesis).
Figure 4.15
Companies classified by investments in R&D
Investments in R&D
Company
Company E
Company M
Company N
Company D
Company G
Company J
Sometimes investments into R&D
Company A
Company F
Company H
Company C
Company B
5-10% of income into R&D
Company O
Company I
Company K
More than 10% of income into R&D
Company L
No investments into R&D
Relevance
Relevance
Selffor
Selffor
assessment competitive assessment competitiv
postion
e postion
0.28
0.78
0.56
0.50
0.41
0.72
0.50
0.56
0.75
0.63
0.66
0.53
0.84
0.63
0.88
2.19
2.88
2.19
2.38
2.38
2.63
2.38
2.63
2.75
1.81
2.56
2.25
2.88
2.69
2.94
0.54
2.42
0.57
2.52
0.66
2.38
0.75
2.81
4. Analysis of data
56
Figure 4.16 shows the fifteen Brazilian SMEs divided into four groups depending
on the annual growth of each company. The chart is irritating due to the fact that
the group with the highest mean value of the self-assessment had the lowest
annual growth during the last years. But company L, which has the highest mean
value of the performance (0.88) of all companies, is a young start-up. They are
working very professionally in a high-tech business, but they are still developing
their products and did not sell any of them until now. Therefor there income is
zero and cannot grow. Therefor the chart attached to the thesis in Appendix U (p.
85 of this thesis) shows the same classification, but the three companies being
member of ACATE are excluded. These companies are young start-ups, having
no growth in case of company L or extremely high growth in case of the other
two, companies J and K. The companies G and E are having high annual growth
rates combined with the lowest mean values of performance. Both have few
growth-competencies, but grow a lot.
A chart with further information on this classification is attached to the thesis in
Appendix T (p. 84 of this thesis).
Figure 4.16
Companies classified by annual growth
Annual growth
< 3,9%
4% - 9,9%
10% - 19,9%
> 20%
Company
Company A
Company L
Company F
Company M
Company N
Company C
Company D
Company E
Company G
Company H
Company B
Company I
Company J
Company K
Company O
Relevance
Relevance
Selffor
Selffor
assessment competitive assessment competitiv
postion
e postion
0.50
0.88
0.56
0.78
0.56
0.63
0.50
0.28
0.41
0.75
0.66
0.84
0.72
0.63
0.53
2.38
2.94
2.63
2.88
2.19
1.81
2.38
2.19
2.38
2.75
2.56
2.88
2.63
2.69
2.25
0.69
2.66
0.64
2.56
0.51
2.30
0.68
2.60
4. Analysis of data
4.7
57
Final analysis
The fifteen Brazilian SMEs evaluated the relevance of the sixteen questions for
the competitive position very high in average. The mean value of all sixteen
questions is 2.5, which is in the middle of the possibilities “relevant” and “highly
relevant”. That figure leads one to assume that the majority of the companies is
aware of the importance the subject of the method “learning to grow” has.
Figure 4.17 shows the mean value of each of the sixteen questions. As mentioned
previously question three (”Activities of our company are directed at our
customers and we create new opportunities based on the (future) needs of our
customers.”) has the highest mean values of self-assessment and the relevance for
competitive position. Question four (” By the use of partnerships and networks
with external partners (research institutions, universities, associations, etc.) we
create opportunities for innovation and growth systematically.”) has the lowest
values of both evaluations.
Figure 4.17
Mean values of self-assessment and the relevance for competitive
position of all fifteen companies for the questions1-16
4. Analysis of data
58
Question eight (” Our company knows how to inspire our employees regarding
the goals of the company.”) has the highest difference between relevance and
performance in average (2.73-0.53=2.2). In case of the fifteen SMEs this question
shows the highest potential for improving the performance in combination with a
high relevance for the competitive position.
The trend line shown in Figure 4.18 demonstrates that the performance evaluated
via the self-assessment and the relevance for the competitive position are
correlating. The higher the performance in regard to a question the higher the
relevance is.
One could assume that the fifteen executives answering and evaluating the
questions tended to relate the relevance to the performance of their company.
Even though they were asked not to do so and treat them independently.
Figure 4.18
Linear regression (mean values of each question)
4. Analysis of data
59
Some of the results are comparable to an actual study of SEBRAE Santa Catarina
(SEBRAE 2011b). The organization asked 500 MSEs (micro and small
enterprises) to answer questions in order to evaluate their competitiveness. Some
of the questions are very close to the sixteen questions of the diagnosis of
“learning to grow”.
Figure 4.19 shows the results for the main blocks of SEBRAE‟s study. The
competitive index has a range between zero and 100. The higher the number the
higher the level of competitiveness is. The numbers are the mean competitiveness
of all 500 MSEs of the study.
Figure 4.19
Competitiveness index of MSEs in Santa Catarina (SEBRAE)
Dimension
Leadership
Strategy and planning
Customers
Society
Information and knowledge management
People management
Processes
Control of Results
Performance in the period
Competitiveness index of MSEs in Santa Catarina
Competitiv Standard
Major index
eness index deviation
53.74
43.44
50.97
57.26
45.23
43.32
55.42
26.66
57.28
49.55
21.69
14.37
13.78
9.28
10.1
16.49
11.51
21.9
17.37
14.55
0
0
0
0
0
0
0
0
10
11.32
Minor
index
100
100
100
100
100
100
100
100
100
91.18
Source: cf. SEBRAE 2011b
The block strategy and planning has an index lower than average. That means that
the 500 companies are not performing very good in regard of this block and
therefore not very competitive. The SEBRAE asked four questions in regard of
this block and the one with the lowest index (39.95) was the following one: “The
Company‟s vision is defined and known by employees?”
The low index corresponds to the findings in this thesis. Question seven (“The
corporate strategy does not only exist in the mind of the entrepreneur. It is
communicated intensely and the employees are involved in the development to
4. Analysis of data
60
understand how they can contribute to the success of the business.”) has one of
the lowest mean values of self-assessment of the performance (0.5). In both cases
the companies show difficulties in communicating their strategies to the
employees.
A very high competitiveness index (64.24) was calculated by the SEBRAE based
on the answers of the 500 companies to the following question: “Customer
complaints are registered and processed?”
Also the fifteen SMEs interviewed for this thesis evaluated their performance in
regard to question number three (“Activities of our company are directed at our
customers and we create new opportunities based on the (future) needs of our
customers.”) very high (0.8).
The annual study released by Deloitte in which a list of Brazilian SMEs with the
highest growth rates is elaborated is also very similar to the answers and
evaluations given by the fifteen Brazilian companies of this thesis.
The study, mentioned in Chapter 2.2, reported that the majority of the fastest
growing Brazilian SMEs were having a documented strategic planning (Figure
2.3, p. 7). The same is true for the fifteen SMEs of this thesis. Most of the
companies explained having a documented strategic planning (p. 33 of this
thesis).
Another correlation between Deloitte‟s study and the results of the interviews for
this thesis is the evaluation of the relevance of financial resources. Deloitte
observed that the demand for financial resources is currently not a major objective
for the fastest growing SMEs in Brazil (Deloitte 2009, p 18). The same was stated
by the fifteen SMEs of this dissertation. Question sixteen has a comparatively low
mean relevance and many companies answered not looking for external financing,
5. Conclusion
61
because the majority of investments was financed with own resources (p. 50 of
this thesis).
5
Conclusion
Data
Due to the fact that there were interviewed only fifteen companies for this thesis
the data is not empirical. As mentioned in the introduction: This thesis serves as a
test of the method “learning to grow” in Brazil. The objective was to do a first
diagnosis of innovation and knowledge management capabilities of Brazilian
SMEs.
The numerical analysis in chapter four is based on the evaluations done by the
executives of the companies. That led to very different measurements. Some of
the executives were very critical in regard of their competencies, others tried to
give the evaluation of their company a positive spin.
Nevertheless the author of this thesis thinks that the results are useful, because
they are showing tendencies of the companies. The critical companies see a high
potential for improvement of their competencies and are more interesting for
further investigations of the project on that account.
Findings
In general the companies had many very interesting processes and routines to
move the levers of the growth-wheel. Many examples given in the interviews with
the executives disclosed highly developed innovation and knowledge management
capabilities. E.g. the many processes to identify opportunities for growth with the
help of external and internal parties described in the analysis of questions one and
two.
But there are problems too. The differentiation practiced by many of the fifteen
SMEs between white and blue-collar workers for instance. Furthermore, some
companies act very informal without any routines and structures.
5. Conclusion
62
The analysis of different classifications of the fifteen SMEs showed that a higher
level of innovativeness led to a higher mean value of the self-assessment. That
proofed that, in the case of the fifteen companies in Brazil, the ones which
evaluated their performance in regard of the sixteen questions as high did also
have a higher level of innovativeness. The companies having a lot of routines and
system to manage growth developed many innovations of products and processes
in the last years.
Another observation was that the Companies which invested more into R&D also
evaluated their performance higher in the self-assessment. Furthermore, it was
analyzed that the mean value of the self-assessment was rising with the number of
employees a company had. The group of companies with the highest number of
employees had a significantly higher mean value than the other ones.
The competitiveness index of MSEs in Santa Catarina developed by SEBRAE and
Deloitte‟s study, in which a list of Brazilian SMEs with the highest growth rates
was elaborated, proved that the results of the interviews with the fifteen SMEs
were akin to experiences other Brazilian companies had.
The fact that the fifteen Brazilian SMEs evaluated the relevance of the sixteen
questions for the competitive position very high in average showed that the
majority of the companies was aware of the importance of the subject.
Further investigation
The project “dynamic SME” will go on for four years. This thesis is one first step
in order to develop a successful management model for SMEs that combines
European innovation and organizational learning models with Latin American
survival strategies in turbulent economies.
5. Conclusion
63
Actually the diagnosis done for fifteen companies in this thesis is the first of the
seven steps for managing growth outlined in Figure 3.4 (p. 21 of this thesis).In
order to go on to the next step, the initiation of projects with selected SMEs to
build up their growth-competencies, it would help to diagnose more SMEs in the
course of the project, to see if the interest in “learning to grow” shown by the
SMEs of this thesis is shared by others.
Some of the fifteen companies already asked if it would be possible for them to
participate in such a project and were very interested in improving their
competencies with the help of project learning.
It would be a good idea to use some of the best practices as case examples. For
future dissertations the best practices could be analyzed and arranged as cases.
These cases could be used as examples and tools for individual projects with
SMEs in Brazil. In general tools to help SMEs to enhance their innovation and
knowledge management capabilities need to be summarized.
Another important aspect, that would be interesting for a dissertation, is to analyze
the German and Brazilian diagnoses in order to find out the differences and
similarities among the companies of both countries. That could help to further
customize the method “learning to grow” to the characteristics of Brazilian SMEs
and to find out what is helping Brazilian companies to cope with a turbulent
environment.
Finally the training of “growth-consultants” would be important. They would be
needed to finally go into selected SMEs and start projects. Especially SMEs need
the help of consultants for project learning. Consequently the second of the seven
steps for managing growth would have been reached: Initiate a project. Hence the
project would move on from diagnosing the growth of SMEs to helping them to
grow.
5. Conclusion
64
If these steps would be concluded successfully they could help the project
“dynamic SME” to find a successful management model for SMEs that combines
European innovation and organizational learning models with Latin American
survival strategies in turbulent economies. Thus one would have learned from
each other.
Appendices
65
Appendices
Appendix A
Company A
Company A
3
2.5
2
1.5
1
0.5
0
Self-assessment (0-1)
Question 1
Question 2
Question 3
Question 4
Question 5
Question 6
Question 7
Question 8
Question 9
Question 10
Question 11
Question 12
Question 13
Question 14
Question 15
Question 16
Mean
Company A is a car repair.
Questions (in Portuguese)
Relevance (0-3)
Answers (in Portuguese)
Self-assessment (0-1) Relevance (0-3)
Reconhecer oportunidades para o crescimento
Reconhecer oportunidades no ambiente de negócios
• Grupo de empresários que falem sobre mecânica (grupo de expertos) uma vez por mês
• Fornecedores dão aulas para os funcionários
1
• Pós-venda de 70% dos serviços
Nossa empresa reconhece sistematicamente oportunidades e
tendências nos mercados de referência e capta
1
sistematicamente os conhecimentos externos de
fornecedores, parceiros, clientes.
2
Nossa empresa é capaz de captar de forma sistemática as
ideias dos funcionários
Nossa empresa orienta suas atividades voltadas ao cliente e
3 cria novas oportunidades com base em necessidades
(futuras) dos clientes
Através de parcerias e de redes com parceiros externos
(instituições de pesquisa, universidades, associações, etc.)
4
sistematicamente criamos oportunidades para inovação e
crescimento.
1
2
0.5
2
1
0.5
• Reuniões semanais para troca de ideias (não obrigatório/ só 30% dos funcionários participam)
2 • Antes de tomar uma decisão é perguntado aos funcionários o que eles pensam do assunto
• Iniciativa dos funcionários (compra de peças)
Criação de novas oportunidades
• Pós-venda bem aproveitada. Depois de cada serviço o cliente avalia o serviço.
3 • Serviços são direcionados ao cliente
3
• Cria um vinculo com o cliente. Melhora o serviço.
• Suporte da ACIF (Associação Comercial e Industrial de Florianópolis)
• Apojo para funcionários estudarem
4
3
Desenvolver e comunicar estratégias e os objetivos de crescimento
Desenvolver estratégia / objetivos de crescimento
• Não tem
Temos uma estratégia e objetivos de crescimento
5 convincentes. Nós somos capazes de atualizar a estratégia e
os objetivos para responder rapidamente a novas tendências.
6
5
0
Estamos aptos a desenvolver novos modelos de negócios que
criam valor a longo prazo.
8
• Comparação de orçamentos feitos com o valor percebido pelo cliente (quantidade de serviços/quanto é
faturada)
• Como o preço é percebido pelo cliente durante o pagamento de conta
1
• Quantos clientes voltam, depois do primeiro serviço.
Motivar os funcionários para o crescimento
• Reuniões periódicas para observar os processos
6
0.5
7
2
A estratégia corporativa não existe apenas na mente do
empresário, mas se comunica intensamente e os funcionários
estão envolvidos em seu desenvolvimento para entender
como eles podem contribuir para o sucesso do negócio.
7
Nossa empresa sabe como entusiasmar seus empregados
para os objetivos da empresa.
0.5
2
0
3
• Avaliação do desempenho. Melhoria da tarefa. (O processo de avaliação do desempenho esta sendo
8 reorganizado no momento).
• A equipe percebe o que está fazendo ao produto final
Realizar as oportunidades de crescimento
Desenvolver o espírito empreendedor dos funcionários
• Reuniões semanalmente (mas faz falta a iniciativa e responsabilidade dos funcionários). Têm tentativas para
9 estimular a participação dos funcionários (tombola...), mas ainda está no começo.
Nossos funcionários pensam e agem com o espírito
9 empresarial e assumem um elevado grau de
responsabilidade.
Nossos executivos sabem delegar e criar espaços de
10
desempenho ("empowerment") para os funcionários.
Sistematicamente desenvolvemos as competências dos
nossos funcionários para garantir crescimento.
Compartilhamos ativamente os conhecimentos entre os
12 departamentos, funções e através de várias hierarquias na
empresa.
11
0.5
2
0.5
3
0
3
0.5
3
• Decisões estão tomadas conjunto. Decisões em áreas de especialidade dos funcionários. Pergunta-se ao
10
grupo o que eles pensam e depois se toma uma decisão.
Desenvolver conhecimentos e competências
• Não tem (bem no começo, pensando o que tem de conhecimento na empresa e como desenvolvera-lo).
11
• Reuniões semanalmente (mencionado antes)
12 • Projetos de melhoria
Gerenciar o crescimento
13
Somos capazes de adaptar os nossos processos e a
organização (empresa) para os desafios do crescimento.
1
Executivos e funcionários aprendam a viver com o
14
crescimento.
1
Asseguramos a disponibilidade de funcionários necessários
15
para o crescimento.
16
0
Asseguramos o financiamento do crescimento de forma
proativa
0.5
8
0.5
Soma
Media
Perguntas sobre a empresa em geral
1 Quantos funcionários sua empresa possui?
2 Qual foi o aumento nas vendas no período entre 2008 e 2010?
Perguntas sobre a empresa em geral
21-49
< 3,9%
Nos últimos anos sua empresa criou novos produtos e
Inovações de processo e produto
processos?
A empresa possui um processo de pesquisa e
4 desenvolvimento (P&D) contínuo? Tem um financiamento para
De vez em quanto
P&D?
3
Organizar o crescimento
• Processos e serviços são formalizados
13 • Pós-venda da sugestões para melhoria dos processos e serviços
2
• Tem um processo de redesenho
• A empresa mudou para um lugar major no ultimo ano para garantir o crescimento
• Novas parcerias
14
• Isso resulta em motivação pelos funcionários. Eles percebem o crescimento da empresa e percebem que
2
eles fazem parte disso.
Assegurar recursos
• Não tem (a empresa somente começou se preocupar com isso).
15
3
• É feito, mas sem plano.
16 • Levantamentos em reuniões e depois aplica o dinheiro.
2
• O empresário decide.
38
2.375
1 • Tem 22 funcionários
2
3
4
• Manutenção automática (a empresa lembra os clientes a fazer a manutenção periódica).
• Acompanhamento dos clientes (lembrar quando a carteira de habilitação vence).
Appendices
66
Appendix B
Company B
Company B
3
2.5
2
1.5
1
0.5
0
Self-assessment (0-1)
Question 1
Question 2
Question 3
Question 4
Question 5
Question 6
Question 7
Question 8
Question 9
Question 10
Question 11
Question 12
Question 13
Question 14
Question 15
Question 16
Mean
Company B is a producer of sportswear for women.
Questions (in Portuguese)
Relevance (0-3)
Answers (in Portuguese)
Self-assessment (0-1) Relevance (0-3)
Reconhecer oportunidades para o crescimento
1
Reconhecer oportunidades no ambiente de negócios
• Reuniões semestrais com todos os vendedores para ver o que acontece no mercado (2 dias de discussão).
• Cliente de sites que observam o mercado de moda e dão indicações para novas tendências.
• Viagens para observar o mercado de moda do Brasil.
1 • Visita de feiras.
• Analise das vendas do ultimo ano.
• Apresentações dos fornecedores mostrando novos tecidos e tendências no mercado.
Nossa empresa reconhece sistematicamente oportunidades e
tendências nos mercados de referência e capta
sistematicamente os conhecimentos externos de
fornecedores, parceiros, clientes.
0.5
2
Nossa empresa é capaz de captar de forma sistemática as
ideias dos funcionários
1
Nossa empresa orienta suas atividades voltadas ao cliente e
3 cria novas oportunidades com base em necessidades
(futuras) dos clientes
Através de parcerias e de redes com parceiros externos
(instituições de pesquisa, universidades, associações, etc.)
4
sistematicamente criamos oportunidades para inovação e
crescimento.
1
0
3
• Reuniões diárias da área da produção.
• Contratação de funcionários com muita experiência no mercado (porque a empresa é jovem).
2 • Liberdade de acessar os empresários.
• Reuniões semanais da área financeira.
2
• Reuniões diárias da área da produção.
Criação de novas oportunidades
• Os lojistas e os vendedores dão retorno diariamente do que eles observam no mercado.
3 • Analise ABC das vendas.
3
• Estampas exclusivas produzidas pelos fornecedores para diferenciar.
• Fala com outras empresas.
• Sindicatos (mas com pouca participação).
4
1
Desenvolver e comunicar estratégias e os objetivos de crescimento
Temos uma estratégia e objetivos de crescimento
5 convincentes. Nós somos capazes de atualizar a estratégia e
os objetivos para responder rapidamente a novas tendências.
6
Estamos aptos a desenvolver novos modelos de negócios que
criam valor a longo prazo.
7
A estratégia corporativa não existe apenas na mente do
empresário, mas se comunica intensamente e os funcionários
estão envolvidos em seu desenvolvimento para entender
como eles podem contribuir para o sucesso do negócio.
8
Nossa empresa sabe como entusiasmar seus empregados
para os objetivos da empresa.
1
1
Desenvolver estratégia / objetivos de crescimento
• Reunião de planejamento anual.
• Novas linhas são planejadas antes.
5
• As metas são conhecidas pelos funcionários.
2
• Meta diária de produção de peças.
• A empresa criou uma nova linha ao lado da principal.
6
3
• Criação de Concept-Stores.
Motivar os funcionários para o crescimento
• A empresa está pensando de iniciar um jornal para informa os funcionários.
• As metas da empresa são comunicados aos funcionários.
7
0.5
3
0.5
3
• Os funcionários estão estimulados para dar ideias.
8 • A área da produção tem metas de produção por cada semana e os funcionários recebem um salario adicional
se as metas são atingidas.
Realizar as oportunidades de crescimento
Nossos funcionários pensam e agem com o espírito
9 empresarial e assumem um elevado grau de
responsabilidade.
10
11
0.5
Nossos executivos sabem delegar e criar espaços de
desempenho ("empowerment") para os funcionários.
0.5
Sistematicamente desenvolvemos as competências dos
nossos funcionários para garantir crescimento.
0.5
Compartilhamos ativamente os conhecimentos entre os
12 departamentos, funções e através de várias hierarquias na
empresa.
0
Desenvolver o espírito empreendedor dos funcionários
• Os funcionários da administração participem das decisões importantes e são dentro das estratégias da
9 empresa.
3
• O conhecimento dos trabalhadores é muito básico e por causa de isso eles não participem de decisões.
• As ideias dos funcionários são avaliadas em grupos.
10 • A empresa determina quais são os espaços que cada funcionário tem e garante que dentro desses espaços
2
eles podem agir livres.
Desenvolver conhecimentos e competências
• Muitos treinamentos.
11 o De contabilidade, desenvolvimento dos funcionários.
2
• A falta de competências é detectada de modo informal.
• A empresa detectou que falta a interação dos departamentos.
12 o Pensando de introduzir um jornal para mais informação.
3
Gerenciar o crescimento
13
Somos capazes de adaptar os nossos processos e a
organização (empresa) para os desafios do crescimento.
14
Executivos e funcionários aprendam a viver com o
crescimento.
15
1
1
Asseguramos a disponibilidade de funcionários necessários
para o crescimento.
1
16
Asseguramos o financiamento do crescimento de forma
proativa
Soma
Media
0.5
10.5
0.65625
Perguntas sobre a empresa em geral
1 Quantos funcionários sua empresa possui?
2 Qual foi o aumento nas vendas no período entre 2008 e 2010?
Organizar o crescimento
• A empresa criou uma nova linha (moda de praia).
13 • A empresa introduziu novo software, fez treinamentos e contratou funcionários com muita experiência no
3
mercado.
• O crescimento da empresa e uma motivação muito grande para os funcionários. Eles percebem que eles são
14 parte do sucesso da empresa.
3
• A empresa cria novas relações com fornecedores e parceiros constantemente.
Assegurar recursos
• A empresa recruta mão de obra por meio de: Head-Hunter, feiras em universidades, anúncios em jornais,
indicação, contratação interna.
15
o A empresa paga um incentivo (60 reais) se uma costureira indica outra que esta trabalhando bom (falta de
3
costureiras).
• O financiamento é feito com recursos próprios e de bancos.
16
2
• Projetos são financiados dependendo da analise da gerencia.
41
2.5625
Perguntas sobre a empresa em geral
50-149
> 20%
1 • São mais ou menos 140 funcionários.
• Entre 30-40% por ano.
2
Nos últimos anos sua empresa criou novos produtos e
3
Várias inovações de produtos e processo
processos?
A empresa possui um processo de pesquisa e
4 desenvolvimento (P&D) contínuo? Tem um financiamento para
4
5-10% das vendas
P&D?
3
Appendices
67
Appendix C
Company C
Company C
3
2.5
2
1.5
1
0.5
0
Self-assessment (0-1)
Question 1
Question 2
Question 3
Question 4
Question 5
Question 6
Question 7
Question 8
Question 9
Question 10
Question 11
Question 12
Question 13
Question 14
Question 15
Question 16
Mean
Company C is a producer of cookies.
Questions (in Portuguese)
Relevance (0-3)
Answers (in Portuguese)
Self-assessment (0-1) Relevance (0-3)
Reconhecer oportunidades para o crescimento
Nossa empresa reconhece sistematicamente oportunidades e
tendências nos mercados de referência e capta
1
sistematicamente os conhecimentos externos de
fornecedores, parceiros, clientes.
Nossa empresa é capaz de captar de forma sistemática as
2
ideias dos funcionários
1
1
Nossa empresa orienta suas atividades voltadas ao cliente e
3 cria novas oportunidades com base em necessidades
(futuras) dos clientes
Através de parcerias e de redes com parceiros externos
(instituições de pesquisa, universidades, associações, etc.)
4
sistematicamente criamos oportunidades para inovação e
crescimento.
Reconhecer oportunidades no ambiente de negócios
• Leituras/ boletins de varias organizações SIMABESP/ ANIB.
• Revista sobre o mercado (Doce).
1
• Revista sobre embalagens.
2
• Visita de supermercados.
• Programa BIS – Boas Ideais e soluções.
2
2
• Reunião semanal de diretoria.
Criação de novas oportunidades
3
1
3
4
0
• Empresa é muito fechada para outros participantes do mercado.
• Trabalha junto com uma empresa de sabores da mesma cidade.
1
Desenvolver e comunicar estratégias e os objetivos de crescimento
Desenvolver estratégia / objetivos de crescimento
• A estratégia é concebida anualmente e controlada no fim do ano.
• A empresa tem uma velocidade alta para mudar a estratégia.
5
Temos uma estratégia e objetivos de crescimento
5 convincentes. Nós somos capazes de atualizar a estratégia e
os objetivos para responder rapidamente a novas tendências.
6
7
8
Estamos aptos a desenvolver novos modelos de negócios que
criam valor a longo prazo.
A estratégia corporativa não existe apenas na mente do
empresário, mas se comunica intensamente e os funcionários
estão envolvidos em seu desenvolvimento para entender
como eles podem contribuir para o sucesso do negócio.
1
3
0.5
1
0.5
2
0.5
2
• A empresa tem vários planos para mudar a empresa, mas a realização é feito com calma.
6 • A empresa quer ter uma programação eletrônica para as compras, a produção e o stock.
• A empresa reconheceu que não esta mais vendendo uma linha de produtos e vai acabar com a produção.
Motivar os funcionários para o crescimento
• As metas da empresa são comunicadas para os funcionários.
7
Nossa empresa sabe como entusiasmar seus empregados
para os objetivos da empresa.
• Salarial extra, se atingir as metas de produção.
8 • O salario para trabalho no sábado é pago na segunda.
• A empresa tem uma hierarquia baixa e sabe entusiasmar os funcionários aos objetivos da empresa.
Realizar as oportunidades de crescimento
Nossos funcionários pensam e agem com o espírito
9 empresarial e assumem um elevado grau de
responsabilidade.
1
Nossos executivos sabem delegar e criar espaços de
10
desempenho ("empowerment") para os funcionários.
0.5
11
Sistematicamente desenvolvemos as competências dos
nossos funcionários para garantir crescimento.
1
Compartilhamos ativamente os conhecimentos entre os
12 departamentos, funções e através de várias hierarquias na
empresa.
1
Desenvolver o espírito empreendedor dos funcionários
• BIS Boas ideias e Soluções.
9 o As ideias são levantadas e discutidas em grupo e depois avaliadas pela gerencia.
2
• As ideias aplicadas são divulgadas no mural.
• Uma grande parte das decisões está tomada em conjunto.
• Os gerentes fazem revisões e observações dos processos porque eles têm medo de que não da certo.
10
• Delegação de responsabilidade só acontece parcial.
2
o Delegação de tarefas, mas a responsabilidade fica com a gerencia.
Desenvolver conhecimentos e competências
• Cada carga tem competências que são pré-requisitos (formalizado).
• A empresa oferece cursos de curta duração sobre qualidade, produtividade, motivação e boas praticas de
fabricação (BPF).
11
• Circulação de textos relevantes (higiene, produção).
• Matriz de competências.
2
• Boletim semanal (“Arcontato”) para a equipe gestores e gerentes.
• Reuniões de diretoria semanais.
• Reuniões sistemáticas (rodas relâmpagos).
o Roda em pé no chão de fabrica para falar sobre problemas atuais.
12 • Grupos de melhoria.
• Reuniões com todos os funcionários mensais.
o Apresentação das metas de produção e problemas com resultados no mercado.
2
o Planejamento de novos produtos.
Gerenciar o crescimento
13
Somos capazes de adaptar os nossos processos e a
organização (empresa) para os desafios do crescimento.
14
Executivos e funcionários aprendam a viver com o
crescimento.
1
15
16
0
Asseguramos a disponibilidade de funcionários necessários
para o crescimento.
0
Asseguramos o financiamento do crescimento de forma
proativa
Soma
Media
0
10
0.625
Perguntas sobre a empresa em geral
1 Quantos funcionários sua empresa possui?
2 Qual foi o aumento nas vendas no período entre 2008 e 2010?
Organizar o crescimento
• Todos os processos da empresa são documentados em normas técnicas.
o Norma-TOP técnicas operacionais – sobre produtos.
13
o Norma-TIM técnicas de intenção e ensaio – analise de produtos.
2
o Norma-ADM normas técnicas de administração.
• A empresa não esta preparado pelo o crescimento.
14 o O crescimento da empresa é mais baixo do que esperava.
1
o A rentabilidade do produto é muito baixa.
Assegurar recursos
• A empresa recruta mão de obra por meio de indicação (gerencial) e contratação interna (produção).
15 • A empresa tem uma alta sazonalidade do negocio (entre 8 e 50 pessoas trabalham dependendo da
1
temporada).
• A empresa finança todo com recursos próprios.
16
1
o Um financiamento do banco só quando monto uma nova fabrica.
29
1.8125
Perguntas sobre a empresa em geral
21-49
1 • 25 funcionários.
• 13% por ano.
2
10% - 19,9%
Nos últimos anos sua empresa criou novos produtos e
3
Várias inovações de produtos e processo
processos?
A empresa possui um processo de pesquisa e
4 desenvolvimento (P&D) contínuo? Tem um financiamento para
4
5-10% das vendas
P&D?
3
Appendices
68
Appendix D
Company D
Company D
3
2.5
2
1.5
1
0.5
0
Self-assessment (0-1)
Question 1
Question 2
Question 3
Question 4
Question 5
Question 6
Question 7
Question 8
Question 9
Question 10
Question 11
Question 12
Question 13
Question 14
Question 15
Question 16
Mean
Company D develops and produces automatic machines for the manufacture of thin and long screws
with hex head and CNC - 3D machines for wire bending.
Questions (in Portuguese)
Relevance (0-3)
Answers (in Portuguese)
Self-assessment (0-1) Relevance (0-3)
Reconhecer oportunidades para o crescimento
Reconhecer oportunidades no ambiente de negócios
• Tudo muito informal.
• Feiras de maquinas nacionais e internacionais.
1
• Observar outras maquina da concorrência.
Nossa empresa reconhece sistematicamente oportunidades e
tendências nos mercados de referência e capta
1
sistematicamente os conhecimentos externos de
fornecedores, parceiros, clientes.
2
Nossa empresa é capaz de captar de forma sistemática as
ideias dos funcionários
Nossa empresa orienta suas atividades voltadas ao cliente e
3 cria novas oportunidades com base em necessidades
(futuras) dos clientes
Através de parcerias e de redes com parceiros externos
(instituições de pesquisa, universidades, associações, etc.)
4
sistematicamente criamos oportunidades para inovação e
crescimento.
0.5
3
0.5
2
1
• Só informal, perguntando os funcionários.
2 • Os funcionários são consultados para resolver problemas.
• Os funcionários tem liberdade de propor ideias.
Criação de novas oportunidades
• Cada maquina é montada ao desejo do cliente.
3 • Antes do pedido tem uma visita no sitio aos dois lados.
3
• Assistência por cada produto. A esse jeito também se detecta novas demandas dos clientes.
• Não tem.
4
0
1
Desenvolver e comunicar estratégias e os objetivos de crescimento
Desenvolver estratégia / objetivos de crescimento
• Não tem um planejamento formalizado. O planejamento é feito pelos empreendedores na mente deles.
Temos uma estratégia e objetivos de crescimento
5 convincentes. Nós somos capazes de atualizar a estratégia e
os objetivos para responder rapidamente a novas tendências.
6
Estamos aptos a desenvolver novos modelos de negócios que
criam valor a longo prazo.
7
A estratégia corporativa não existe apenas na mente do
empresário, mas se comunica intensamente e os funcionários
estão envolvidos em seu desenvolvimento para entender
como eles podem contribuir para o sucesso do negócio.
8
5
0
2
0.5
3
0
2
0
3
• No momento a empresa não tem um planejamento para desenvolver novos produtos. A empresa está
6
melhorando os produtos atuais.
Motivar os funcionários para o crescimento
• Não tem interação com os funcionários nessa questão.
7
Nossa empresa sabe como entusiasmar seus empregados
para os objetivos da empresa.
8
• Não tem nada formalizado.
Realizar as oportunidades de crescimento
Nossos funcionários pensam e agem com o espírito
9 empresarial e assumem um elevado grau de
responsabilidade.
10
Nossos executivos sabem delegar e criar espaços de
desempenho ("empowerment") para os funcionários.
11
Sistematicamente desenvolvemos as competências dos
nossos funcionários para garantir crescimento.
1
1
0
Compartilhamos ativamente os conhecimentos entre os
12 departamentos, funções e através de várias hierarquias na
empresa.
0.5
Desenvolver o espírito empreendedor dos funcionários
• Responsabilidades são passadas aos funcionários.
• A empresa percebe muito bem se o trabalho é feito com alta qualidade e valoriza isso com um cargo mais
9
alto.
2
• A empresa tem muitos funcionários que já trabalham muito tempo com a empresa (25 anos).
• Só os cargos mais altos são perguntados.
10
3
Os cargos, mas altos também tomam responsabilidade e mandam em outros.
Desenvolver conhecimentos e competências
• O desenvolvimento de competências acontece muito informal.
11 • Ensina no dia-dia.
2
• Têm-se manuais para as maquinas.
• A empresa é pequena por causa disso não tem uma hierarquia. Fala-se um com o outro no dia-dia.
12
3
Gerenciar o crescimento
13
14
15
Somos capazes de adaptar os nossos processos e a
organização (empresa) para os desafios do crescimento.
Executivos e funcionários aprendam a viver com o
crescimento.
0.5
2
0.5
1
Asseguramos a disponibilidade de funcionários necessários
para o crescimento.
1
16
Asseguramos o financiamento do crescimento de forma
proativa
Soma
Media
1
8
0.5
Perguntas sobre a empresa em geral
1 Quantos funcionários sua empresa possui?
2 Qual foi o aumento nas vendas no período entre 2008 e 2010?
14
• Acontece informal pelos gerentes.
Assegurar recursos
• A empresa recruta mão de obra por meio de indicação.
• O ambiente de trabalho é muito agradável.
15
• Se paga um bônus de fim de ano dependendo da produção.
3
• Os salários na empresa são em cima da média.
• Financiamento próprio.
16
3
• Decisão dos gerentes.
38
2.375
Perguntas sobre a empresa em geral
0-20
10% - 19,9%
Nos últimos anos sua empresa criou novos produtos e
Nenhum destes
processos?
A empresa possui um processo de pesquisa e
4 desenvolvimento (P&D) contínuo? Tem um financiamento para
De vez em quanto
P&D?
3
Organizar o crescimento
• A empresa começa a organizar e escrever os processos.
13
1 • 12 Funcionários.
• 10% por ano.
2
3
4
Appendices
69
Appendix E
Company E
Company E
3
2.5
2
1.5
1
0.5
0
Self-assessment (0-1)
Question 1
Question 2
Question 3
Question 4
Question 5
Question 6
Question 7
Question 8
Question 9
Question 10
Question 11
Question 12
Question 13
Question 14
Question 15
Question 16
Mean
Company E is a forwarding agent for the tobacco industry.
Questions (in Portuguese)
Relevance (0-3)
Answers (in Portuguese)
Self-assessment (0-1) Relevance (0-3)
Reconhecer oportunidades para o crescimento
Reconhecer oportunidades no ambiente de negócios
Não tem.
Nossa empresa reconhece sistematicamente oportunidades e
tendências nos mercados de referência e capta
1
sistematicamente os conhecimentos externos de
fornecedores, parceiros, clientes.
Nossa empresa é capaz de captar de forma sistemática as
2
ideias dos funcionários
1
0
2
0
3
2
• Não tem um sistema (Acontece no dia-dia).
Criação de novas oportunidades
• Não tem um sistema (Acontece no dia-dia).
3
Nossa empresa orienta suas atividades voltadas ao cliente e
3 cria novas oportunidades com base em necessidades
(futuras) dos clientes
Através de parcerias e de redes com parceiros externos
(instituições de pesquisa, universidades, associações, etc.)
4
sistematicamente criamos oportunidades para inovação e
crescimento.
0.5
3
• Não tem.
4
0
0
Desenvolver e comunicar estratégias e os objetivos de crescimento
Desenvolver estratégia / objetivos de crescimento
• A empresa faz um planejamento anual.
• Investimentos feitos à base do desenvolvimento do mercado.
5
Temos uma estratégia e objetivos de crescimento
5 convincentes. Nós somos capazes de atualizar a estratégia e
os objetivos para responder rapidamente a novas tendências.
6
Estamos aptos a desenvolver novos modelos de negócios que
criam valor a longo prazo.
7
A estratégia corporativa não existe apenas na mente do
empresário, mas se comunica intensamente e os funcionários
estão envolvidos em seu desenvolvimento para entender
como eles podem contribuir para o sucesso do negócio.
8
Nossa empresa sabe como entusiasmar seus empregados
para os objetivos da empresa.
0.5
3
0
1
6
• A empresa iniciou um controle dos motoristas (qualidade, quilometragem) para reduzir os custos.
Motivar os funcionários para o crescimento
• Avaliação dos empregados.
o A planilha se entregado para cada um.
7
0.5
3
0.5
3
8
• Os motoristas com o melhor desempenho são os primeiros a escolher um novo caminhão.
Realizar as oportunidades de crescimento
Desenvolver o espírito empreendedor dos funcionários
• Os motoristas tem a liberdade de procurar uma carga na volta (frete de retorno).
9
Nossos funcionários pensam e agem com o espírito
9 empresarial e assumem um elevado grau de
responsabilidade.
Nossos executivos sabem delegar e criar espaços de
10
desempenho ("empowerment") para os funcionários.
Sistematicamente desenvolvemos as competências dos
nossos funcionários para garantir crescimento.
Compartilhamos ativamente os conhecimentos entre os
12 departamentos, funções e através de várias hierarquias na
empresa.
11
0.5
3
0.5
2
0
3
0
1
10
• Funcionários podem tomar certas decisões com liberdade.
Desenvolver conhecimentos e competências
• Não tem.
11
• Não tem.
12
Gerenciar o crescimento
Somos capazes de adaptar os nossos processos e a
13
organização (empresa) para os desafios do crescimento.
Executivos e funcionários aprendam a viver com o
14
crescimento.
0
0.5
Asseguramos a disponibilidade de funcionários necessários
para o crescimento.
Asseguramos o financiamento do crescimento de forma
16
proativa
Soma
Media
15
0.5
0.5
4.5
0.28125
Perguntas sobre a empresa em geral
1 Quantos funcionários sua empresa possui?
2 Qual foi o aumento nas vendas no período entre 2008 e 2010?
1
Organizar o crescimento
• Acontece informal.
13
• A empresa faz um planejamento e faz os investimentos e a contratação dos funcionários necessários para o
14
crescimento.
Assegurar recursos
• A empresa recruta mão de obra por meio de indicação.
15
2
• Contratação de funcionários depende da necessidade.
• A empresa recruta mão de obra por meio de indicação.
16
3
• Contratação de funcionários depende da necessidade.
35
2.1875
2
Perguntas sobre a empresa em geral
0-20
10% - 19,9%
1 • 10 funcionários.
• 15% por ano.
2
Nos últimos anos sua empresa criou novos produtos e
3
Ou inovações de produto ou inovações de processo
processos?
A empresa possui um processo de pesquisa e
4 desenvolvimento (P&D) contínuo? Tem um financiamento para
4
Não tem
P&D?
3
Appendices
70
Appendix F
Company F
Company F
3
2.5
2
1.5
1
0.5
0
Self-assessment (0-1)
Question 1
Question 2
Question 3
Question 4
Question 5
Question 6
Question 7
Question 8
Question 9
Question 10
Question 11
Question 12
Question 13
Question 14
Question 15
Question 16
Mean
Company F develops and produces metal enclosures made of carbon, aluminum and stainless steel.
Questions (in Portuguese)
Relevance (0-3)
Answers (in Portuguese)
Self-assessment (0-1) Relevance (0-3)
Reconhecer oportunidades para o crescimento
Reconhecer oportunidades no ambiente de negócios
• Indo em muitas feiras nacionais e internacionais.
• Procurar melhorar os produtos com os clientes.
1
Nossa empresa reconhece sistematicamente oportunidades e
tendências nos mercados de referência e capta
1
sistematicamente os conhecimentos externos de
fornecedores, parceiros, clientes.
2
Nossa empresa é capaz de captar de forma sistemática as
ideias dos funcionários
Nossa empresa orienta suas atividades voltadas ao cliente e
3 cria novas oportunidades com base em necessidades
(futuras) dos clientes
Através de parcerias e de redes com parceiros externos
(instituições de pesquisa, universidades, associações, etc.)
4
sistematicamente criamos oportunidades para inovação e
crescimento.
0.5
3
0.5
2
0.5
0
• Decisões tomadas em conjunto com os professionais da área.
2 • Resolução de problemas com os funcionários.
• Caixa de sugestões, mas pouco usada (caixa tem resposta direta com avaliação da ideia).
Criação de novas oportunidades
• Entre em contato com os clientes em feiras
3 • Os produtos são customizados para ser conforme aos desejos do cliente.
3
• Tem uma pesquisa da satisfação do cliente (ISO).
• A empresa gostaria de ter colaborações com universidades e outras entidades, mas ainda não consegue.
• Contato com a associação SIMMERS (Sindicato das Indústrias Metalúrgicas, Mecânicas e do Material Elétrico
4
de Rio do Sul), mas de pouca relevância.
2
Desenvolver e comunicar estratégias e os objetivos de crescimento
Temos uma estratégia e objetivos de crescimento
5 convincentes. Nós somos capazes de atualizar a estratégia e
os objetivos para responder rapidamente a novas tendências.
6
Estamos aptos a desenvolver novos modelos de negócios que
criam valor a longo prazo.
7
A estratégia corporativa não existe apenas na mente do
empresário, mas se comunica intensamente e os funcionários
estão envolvidos em seu desenvolvimento para entender
como eles podem contribuir para o sucesso do negócio.
8
1
0.5
0
Nossa empresa sabe como entusiasmar seus empregados
para os objetivos da empresa.
0.5
Desenvolver estratégia / objetivos de crescimento
• Planejamento das metas é feito anualmente e formalizado (o planejamento inclui as vendas, maquinas,
finanças, etc.).
5
• Avaliação do planejamento no fim do ano.
3
• Reavaliação se o planejamento for irreal no segundo semestre.
• Não tem nada formalizado para garantir valor a longo prazo, isso é feito empírico.
6
3
• A empresa procura desenvolver novos produtos, mas sem plano.
Motivar os funcionários para o crescimento
• A estratégia não é comunicada para todos os funcionários se não só para a administração, que desenvolve a
estratégia.
7
2
• Através do planejamento a empresa consegue os objetivos.
• Os comerciantes têm metas de venda e o resto da empresa tem que acompanhar.
8 • Tem-se um incentivo se as metas são atingidas.
• A empresa quer implantar um sistema de participação no lucro (PBR; dependendo da produtividade/ dias de
2
folga7 cursos feitos) no próximo ano.
Realizar as oportunidades de crescimento
Nossos funcionários pensam e agem com o espírito
9 empresarial e assumem um elevado grau de
responsabilidade.
1
10
Nossos executivos sabem delegar e criar espaços de
desempenho ("empowerment") para os funcionários.
11
Sistematicamente desenvolvemos as competências dos
nossos funcionários para garantir crescimento.
1
1
Compartilhamos ativamente os conhecimentos entre os
12 departamentos, funções e através de várias hierarquias na
empresa.
0.5
Desenvolver o espírito empreendedor dos funcionários
• A empresa estimula os funcionários a estudar.
o Todos os cursos são financiados 100% (p.ex. pós-graduação).
9 • Os funcionários tem a liberdade de agir na área deles.
o A empresa espera que os funcionários tenham mais conhecimento na área deles do que os empreendedores
3
mesmo e por causa disso devem tomar certas decisões.
• A empresa delega responsabilidade.
10
3
• Muitas decisões são tomadas em grupo.
Desenvolver conhecimentos e competências
• Norma ISO exige uma matriz de competência.
o Certas competências são exigidas para as cargas.
• A empresa oferece cursos e treinamentos.
11 o A empresa ate treina pessoal de outras áreas para ter essas como reserva.
• A empresa estimula os funcionários a estudar.
o Todos os cursos são financiados 100% (p.ex. pós-graduação).
2
• A empresa cria listas com ocorrências de retrabalho por cada área.
• Encontros periódicos (mensais).
12 o A área de administração e os lideres dos setores.
3
• Melhoria é feito, mas não é formalizado.
Gerenciar o crescimento
13
Somos capazes de adaptar os nossos processos e a
organização (empresa) para os desafios do crescimento.
14
Executivos e funcionários aprendam a viver com o
crescimento.
15
0.5
0.5
Asseguramos a disponibilidade de funcionários necessários
para o crescimento.
0.5
16
Asseguramos o financiamento do crescimento de forma
proativa
Soma
Media
0.5
9
0.5625
Perguntas sobre a empresa em geral
1 Quantos funcionários sua empresa possui?
2 Qual foi o aumento nas vendas no período entre 2008 e 2010?
3
Organizar o crescimento
• A empresa tem processos formalizados, mas é preciso melhorar a formalização.
13
• Os funcionários são motivados por causa o crescimento da empresa. Eles sentem que eles fazem parte do
14 sucesso.
• Os fornecedores da empresa reconhecem o crescimento da empresa e recomendem para outros.
Assegurar recursos
• A empresa recruta mão de obra por meio de: Anúncios em no radio, SINE e indicação, head-hunter para
administração.
15 • Essa pergunta é um grande desafio para a empresa. É muito difícil achar mão de obra adequada.
• Funcionários contratados para a produção vêm sem conhecimentos e precisam de treinamento.
3
• A empresa tem problemas com a rotatividade (70% fica a longo prazo, mas 30% rotatividade).
• Investimentos conforme a necessidade.
16
2
• Financiamento próprio. Se o valor é muito grande a empresa procura um financiamento com um banco.
42
2.625
3
Perguntas sobre a empresa em geral
21-49
4% - 9,9%
1 • 42 funcionários.
2
Nos últimos anos sua empresa criou novos produtos e
3
Várias inovações de produtos e processo
processos?
A empresa possui um processo de pesquisa e
4 desenvolvimento (P&D) contínuo? Tem um financiamento para
4
De vez em quanto
P&D?
3
Appendices
71
Appendix G
Company G
Company G
3
2.5
2
1.5
1
0.5
0
Self-assessment (0-1)
Question 1
Question 2
Question 3
Question 4
Question 5
Question 6
Question 7
Question 8
Question 9
Question 10
Question 11
Question 12
Question 13
Question 14
Question 15
Question 16
Mean
Company G sells car tires and offers mecanical service.
Questions (in Portuguese)
Relevance (0-3)
Answers (in Portuguese)
Self-assessment (0-1) Relevance (0-3)
Reconhecer oportunidades para o crescimento
Reconhecer oportunidades no ambiente de negócios
• Seguindo o padrão de um grande parceiro.
Nossa empresa reconhece sistematicamente oportunidades e
tendências nos mercados de referência e capta
1
sistematicamente os conhecimentos externos de
fornecedores, parceiros, clientes.
2
1
Nossa empresa é capaz de captar de forma sistemática as
ideias dos funcionários
Nossa empresa orienta suas atividades voltadas ao cliente e
3 cria novas oportunidades com base em necessidades
(futuras) dos clientes
Através de parcerias e de redes com parceiros externos
(instituições de pesquisa, universidades, associações, etc.)
4
sistematicamente criamos oportunidades para inovação e
crescimento.
0.5
2
0.5
2
0.5
2 o Depois se debate se e possível aplicar uma ideia.
• As ideias dos funcionários são aprovadas, mas sem sistemática.
Criação de novas oportunidades
• Pesquisa na internet para observar as tendências dos clientes.
3 • Visitando feiras para ver as novidades.
3
• Fala com os clientes para ter a opinião deles, mas sem sistemática.
• Não tem.
4
0
1
Desenvolver e comunicar estratégias e os objetivos de crescimento
Desenvolver estratégia / objetivos de crescimento
• A empresa tem a meta de crescer 15% das vendas por ano e faz uma comparação com o ano anterior cada
mês.
5
Temos uma estratégia e objetivos de crescimento
5 convincentes. Nós somos capazes de atualizar a estratégia e
os objetivos para responder rapidamente a novas tendências.
6
Estamos aptos a desenvolver novos modelos de negócios que
criam valor a longo prazo.
7
A estratégia corporativa não existe apenas na mente do
empresário, mas se comunica intensamente e os funcionários
estão envolvidos em seu desenvolvimento para entender
como eles podem contribuir para o sucesso do negócio.
8
Nossa empresa sabe como entusiasmar seus empregados
para os objetivos da empresa.
0.5
2
0.5
3
0
3
0.5
3
• A empresa tenta criar novos serviços.
6
• A empresa tenta vender novos produtos cada 2 a 3 meses.
Motivar os funcionários para o crescimento
• A meta de 15% de aumento de vendas cada ano é comunicado para todos os funcionários.
• A empresa realiza cursos de motivação para os funcionários.
7
8
• Se a empresa cresce 15% por mês os funcionários recebem um aumento do salario.
Realizar as oportunidades de crescimento
Desenvolver o espírito empreendedor dos funcionários
• A empresa delega responsabilidades.
9 • As decisões são tomadas pelos funcionários da administração.
Nossos funcionários pensam e agem com o espírito
9 empresarial e assumem um elevado grau de
responsabilidade.
Nossos executivos sabem delegar e criar espaços de
10
desempenho ("empowerment") para os funcionários.
Sistematicamente desenvolvemos as competências dos
nossos funcionários para garantir crescimento.
Compartilhamos ativamente os conhecimentos entre os
12 departamentos, funções e através de várias hierarquias na
empresa.
11
0.5
3
0.5
2
0.5
3
0.5
2
• As compras de novos produtos são feitos conjunto.
10
• Delegação de responsabilidades (e não de tarefas).
Desenvolver conhecimentos e competências
• Treinamentos para a mão de obra.
11
• Reuniões mensais.
12 • Problemas resolvidos pelo chefe.
Gerenciar o crescimento
Somos capazes de adaptar os nossos processos e a
13
organização (empresa) para os desafios do crescimento.
Executivos e funcionários aprendam a viver com o
14
crescimento.
0
0.5
Asseguramos a disponibilidade de funcionários necessários
para o crescimento.
Asseguramos o financiamento do crescimento de forma
16
proativa
Soma
Media
15
0.5
0.5
6.5
0.40625
Perguntas sobre a empresa em geral
1 Quantos funcionários sua empresa possui?
2 Qual foi o aumento nas vendas no período entre 2008 e 2010?
• A empresa comprou um edifício ao lado está ocupando mais espaço.
14
• Crescendo de forma informal.
Assegurar recursos
• A empresa recruta mão de obra por meio de: Anúncios no radio e indicação.
15
3
• Tem rotatividade na empresa.
• Parcelamento de pagamentos.
16
1
• Investimentos maiores financiados pelo banco o resto com recursos próprios.
38
2.375
2
Perguntas sobre a empresa em geral
0-20
10% - 19,9%
Nos últimos anos sua empresa criou novos produtos e
Inovações de processo e produto
processos?
A empresa possui um processo de pesquisa e
4 desenvolvimento (P&D) contínuo? Tem um financiamento para
De vez em quanto
P&D?
3
3
Organizar o crescimento
• Não tem nada formalizado.
13
1 • 12 funcionários.
• Mas ou menos 15% por ano.
2
3
4
Appendices
72
Appendix H
Company H
Company H
3
2.5
2
1.5
1
0.5
0
Self-assessment (0-1)
Question 1
Question 2
Question 3
Question 4
Question 5
Question 6
Question 7
Question 8
Question 9
Question 10
Question 11
Question 12
Question 13
Question 14
Question 15
Question 16
Mean
Company H is producer of boilers generating electrical and thermal energy.
Questions (in Portuguese)
Relevance (0-3)
Answers (in Portuguese)
Self-assessment (0-1) Relevance (0-3)
Reconhecer oportunidades para o crescimento
Reconhecer oportunidades no ambiente de negócios
• Ligação grande com os parceiros para melhorar e desenvolver novos produtos.
• Falando com os clientes para ver o que eles desejam do produto.
1
• Melhorias em cima das necessidades dos clientes.
Nossa empresa reconhece sistematicamente oportunidades e
tendências nos mercados de referência e capta
1
sistematicamente os conhecimentos externos de
fornecedores, parceiros, clientes.
1
3
1
3
Nossa empresa é capaz de captar de forma sistemática as
2
ideias dos funcionários
• Tem-se um formulário de mão conformidade, nesse formulário o funcionário já pode propor a solução.
• Cada 6 meses tem uma pesquisa de satisfação dos colaboradores (trabalho/ politica da empresa/ salario),
que lidera a mudanças na empresa em seguinte.
Criação de novas oportunidades
• Questionário com cada cliente depois da entrega do produto e depois repetido anualmente.
• Os vendedores dão uma previsão dos desejos dos clientes formalizada.
• Antes de cada pedido tem um processo de venda formalizado que inclua vários passos para garantir a melhor
3 informação e satisfação do cliente.
o Inclua uma visita em outra empresa que já compro uma maquina para ver lã em função.
• Se uma nova maquina instalada não funciona conforme o contrato (salvando 10% dos custos de energia), não
3
é pago ate funcionar direito.
• Teve uma parceria com uma empresa alemã ate 10 anos atrás.
• Parceria com a UFSC (laboratório da mecânica) para desenvolver filtros para a redução da emissão de
4
substancias poluentes.
3
• Sócio da câmara Brasil Alemanha, SIMMERS/ CREA/ ACIRS).
2
Nossa empresa orienta suas atividades voltadas ao cliente e
3 cria novas oportunidades com base em necessidades
(futuras) dos clientes
1
Através de parcerias e de redes com parceiros externos
(instituições de pesquisa, universidades, associações, etc.)
4
sistematicamente criamos oportunidades para inovação e
crescimento.
1
Desenvolver e comunicar estratégias e os objetivos de crescimento
Temos uma estratégia e objetivos de crescimento
5 convincentes. Nós somos capazes de atualizar a estratégia e
os objetivos para responder rapidamente a novas tendências.
0.5
Estamos aptos a desenvolver novos modelos de negócios que
6
criam valor a longo prazo.
0.5
7
A estratégia corporativa não existe apenas na mente do
empresário, mas se comunica intensamente e os funcionários
estão envolvidos em seu desenvolvimento para entender
como eles podem contribuir para o sucesso do negócio.
0.5
Nossa empresa sabe como entusiasmar seus empregados
8
para os objetivos da empresa.
1
Desenvolver estratégia / objetivos de crescimento
• A empresa faz um planejamento anual, mas percebeu que tem problemas com a continuidade.
• Realiza-se um planejamento por cada área da empresa.
5 • A empresa tem vários indicadores para observar se as metas do planejamento são atingidas.
• A empresa tem a meta de ter a melhor assistência técnica do Brasil até o ano 2013 e fez um planejamento
2
para atingir esse objetivo.
• A empresa quer mudar de produção mais pra prestação de serviço e tem um processo formalizado para isso.
• A empresa mudou o processo de vendas e criou um novo sistema com 18 etapas até a venda para criar um
6
vinculo mais forte com o cliente.
3
Motivar os funcionários para o crescimento
• Os gestores e a gerencia desenvolvem a estratégia junto.
• Todos os funcionários são informados sobre o planejamento.
o A norma ISO propõe a divulgação dessa informação.
7 o Informação pelo mural.
o Informação divulgada pelo departamento de qualidade.
• Têm-se metas e objetivos por cada funcionário.
3
• A atualização das metas e objetivos podia ser melhor.
• As metas são divulgadas para cada funcionário.
• A rotatividade da empresa é muito baixa (0,01%).
8
• Os funcionários participem no lucro.
3
• Se entregar um novo equipamento no tempo certo os funcionários recebem 2% da venda.
Realizar as oportunidades de crescimento
Nossos funcionários pensam e agem com o espírito
9 empresarial e assumem um elevado grau de
responsabilidade.
1
Nossos executivos sabem delegar e criar espaços de
10
desempenho ("empowerment") para os funcionários.
1
11
Sistematicamente desenvolvemos as competências dos
nossos funcionários para garantir crescimento.
0.5
Compartilhamos ativamente os conhecimentos entre os
12 departamentos, funções e através de várias hierarquias na
empresa.
0.5
Desenvolver o espírito empreendedor dos funcionários
• Os gestores de cada área tomam a responsabilidade e agem com liberdade.
o As responsabilidades são escritas.
9
• A empresa tem um formulário para sugestões, e dar incentivos se as sugestões são aplicadas.
3
• Os engenheiros tem a responsabilidade técnica.
• Delegação de responsabilidade.
o Mas se a gerencia está vendo que a coisa não dar certo eles tiram a responsabilidade e mandam o que fazer.
10
• Problemas são solucionados juntos com os participantes das áreas afetadas.
3
Desenvolver conhecimentos e competências
• Norma ISO exige uma matriz de competência.
o Gestor faz avaliação dos subordinados cada semestre.
11 • Treinamentos obrigatórios e treinamentos especiais são oferecidos pela empresa.
o A empresa pede os funcionários muito a fazer os treinamentos, mas muitas vezes eles acabam não fazendo
2
por que falta tempo.
• Reunião diária da gerencia de todos os setores (formalizada e comunicada interna).
• Grupos de melhoria (má conformidade).
12 • Reuniões periódicas entre as hierarquias.
o Gerentes com subordinados.
2
o Gerentes com os empresários.
Gerenciar o crescimento
13
Somos capazes de adaptar os nossos processos e a
organização (empresa) para os desafios do crescimento.
1
Executivos e funcionários aprendam a viver com o
14
crescimento.
0.5
15
Asseguramos a disponibilidade de funcionários necessários
para o crescimento.
16
Asseguramos o financiamento do crescimento de forma
proativa
0.5
0.5
12
0.75
Soma
Media
Perguntas sobre a empresa em geral
1 Quantos funcionários sua empresa possui?
2 Qual foi o aumento nas vendas no período entre 2008 e 2010?
Perguntas sobre a empresa em geral
150-499
10% - 19,9%
Nos últimos anos sua empresa criou novos produtos e
Inovações de processo e produto
processos?
A empresa possui um processo de pesquisa e
4 desenvolvimento (P&D) contínuo? Tem um financiamento para
De vez em quanto
P&D?
3
Organizar o crescimento
• As responsabilidades dos funcionários são formalizadas.
13 • Têm-se documentos de procedimentos e descrições de trabalho (todos esses documentos são cadastrados
3
no departamento de qualidade).
• A empresa teve um salto aonde cresceu muito rápido.
o Por causo disso o atendimento de todos os clientes virou difícil.
14 o Surgiram problemas com a qualidade do serviço por causa do crescimento grande.
o O processo de integração de novos funcionários virou difícil.
3
o A empresa reconheceu esse problema e esta mudando de forma de trabalhar e focando mais no serviço.
Assegurar recursos
• A empresa recruta mão de obra por meio de: Anúncios em jornais, indicação, contratação interna.
• Contratação de funcionários depende da demanda.
• A empresa gostaria de ter trainees, mas ainda vai demorar.
15
• Salario igual ou melhor do que o mercado.
• Homenagens no dia das mães/dos pães. Passeio ciclístico com todos os funcionários no aniversario da
3
empresa. Festa de natal pelos filhos dos funcionários.
• Decisões sobre financiamento são na mão dos gerentes.
16 • Se alguém precisa um investimento (p.ex. para um notebook; viagens para feiras) os gerentes decidem e
2
depois o dinheiro é aplicado.
44
2.75
1 • 205 funcionários
• Mais ou menos 15% por ano
2
3
4
Appendices
73
Appendix I
Company I
Company I
3
2.5
2
1.5
1
0.5
0
Self-assessment (0-1)
Question 1
Question 2
Question 3
Question 4
Question 5
Question 6
Question 7
Question 8
Question 9
Question 10
Question 11
Question 12
Question 13
Question 14
Question 15
Question 16
Mean
Company I is an engineering company producing movable car lifters.
Questions (in Portuguese)
Relevance (0-3)
Answers (in Portuguese)
Self-assessment (0-1) Relevance (0-3)
Reconhecer oportunidades para o crescimento
Nossa empresa reconhece sistematicamente oportunidades e
tendências nos mercados de referência e capta
1
sistematicamente os conhecimentos externos de
fornecedores, parceiros, clientes.
1
2
Nossa empresa é capaz de captar de forma sistemática as
ideias dos funcionários
0.5
Reconhecer oportunidades no ambiente de negócios
Trabalhando junto com os clientes para melhorar os produtos.
• Benchmarking com suporto de um instituto.
• Falando com os clientes para produzir conforme os desejos deles.
1
• Joint venture com uma empresa alemão.
• Visitando feiras nacionais e internacionais.
3
• Controle periódico (mensal) para observar e discutir as novas tendências no mercado.
• Prêmios para ideias.
2
2
• Caixa de sugestões (Se conversa sobre as ideias e depois muitas são aplicadas).
Criação de novas oportunidades
• Produtos desenvolvidos junto com os clientes (engenharia simultânea).
Nossa empresa orienta suas atividades voltadas ao cliente e
3 cria novas oportunidades com base em necessidades
(futuras) dos clientes
4
Através de parcerias e de redes com parceiros externos
(instituições de pesquisa, universidades, associações, etc.)
sistematicamente criamos oportunidades para inovação e
crescimento.
1
3
0.5
3
3 o Os representantes são planejados de fazer uma entrevista sobre a satisfação dos clientes.
o Dessas entrevistas também surge a construção de novos produtos ou o melhoramento de produtos
correntes.
• Só parcerias com parceiros sócios.
• Sócio de varias associações, mas com pouca relevância (SIMMMERS/ FIESC).
4
Desenvolver e comunicar estratégias e os objetivos de crescimento
Temos uma estratégia e objetivos de crescimento
5 convincentes. Nós somos capazes de atualizar a estratégia e
os objetivos para responder rapidamente a novas tendências.
1
6
Estamos aptos a desenvolver novos modelos de negócios que
criam valor a longo prazo.
1
A estratégia corporativa não existe apenas na mente do
empresário, mas se comunica intensamente e os funcionários
7
estão envolvidos em seu desenvolvimento para entender
como eles podem contribuir para o sucesso do negócio.
8
Desenvolver estratégia / objetivos de crescimento
• Planejamento anual (o planejamento inclui novos produtos, funcionários, finanças, etc.).
• O planejamento é feito para todas as áreas da empresa.
5 • Tudo o planejamento é documentado.
• Reuniões mensais para observar o planejamento, se o planejamento não está dando certo é mudado nessa
3
reunião.
• Lançamentos de novos produtos são metas do planejamento anual.
6 • Remodelação dos processos e produtos é feito periodicamente.
3
• Tem-se um roteiro de desenvolvimento.
Motivar os funcionários para o crescimento
• O planejamento é divulgado para todos os funcionários.
7
1
2
0.5
3
• Cada empregado tem metas individuais.
8 • Os funcionários participem no lucro (sem porcentagem, o lucro é divulgado igualmente para cada funcionário).
Nossa empresa sabe como entusiasmar seus empregados
para os objetivos da empresa.
Realizar as oportunidades de crescimento
Nossos funcionários pensam e agem com o espírito
9 empresarial e assumem um elevado grau de
responsabilidade.
Nossos executivos sabem delegar e criar espaços de
10
desempenho ("empowerment") para os funcionários.
11
1
0.5
Sistematicamente desenvolvemos as competências dos
nossos funcionários para garantir crescimento.
1
Compartilhamos ativamente os conhecimentos entre os
12 departamentos, funções e através de várias hierarquias na
empresa.
1
Desenvolver o espírito empreendedor dos funcionários
• Delegação de reponsabilidade.
9 • A empresa é aberta para propostas dos funcionários.
3
• Podia orientar os lideres mais para abrir a mão e dar mais responsabilidade para os subordinados deles.
• A delegação de responsabilidade é pratica comum na empresa.
10
3
• A empresa tinha que ajustar a liderança.
Desenvolver conhecimentos e competências
• Matriz de competências.
11 • Treinamentos anualmente.
3
• A empresa ajuda funcionários a ir à universidade.
• Grupos de melhoria encontram semanalmente.
12 • Lideres das áreas encontram cada semana.
3
• Reuniões entre hierarquias com discussões abertas.
Gerenciar o crescimento
Somos capazes de adaptar os nossos processos e a
13
organização (empresa) para os desafios do crescimento.
Executivos e funcionários aprendam a viver com o
14
crescimento.
15
1
1
Asseguramos a disponibilidade de funcionários necessários
para o crescimento.
0.5
16
Asseguramos o financiamento do crescimento de forma
proativa
Soma
Media
1
13.5
0.84375
Perguntas sobre a empresa em geral
1 Quantos funcionários sua empresa possui?
2 Qual foi o aumento nas vendas no período entre 2008 e 2010?
3
Organizar o crescimento
• A empresa tem formalização de processos, tarefas e descrições de trabalho.
13
• A empresa está convivendo com um crescimento excessivo.
14
• A adaptação de novos funcionários, fornecedores e parceiros tem que ser muito dinâmico.
Assegurar recursos
• A empresa recruta mão de obra por meio de: Head-Hunter (para cargas especificas e na administração),
feiras em universidades (pouco), anúncios em jornais (pouco), indicação, contratação interna.
• A necessidade de mão de obra é analisada nas reuniões mensais.
15 • A rotatividade na empresa é muito baixa.
• A empresa oferece um salario racionável, participação no lucro, plano de saúde, ajuda para educação,
ambiente de respeito, crescimento.
3
• Pesquisa da satisfação dos funcionários (analisado e melhoria em anexo).
• O financiamento faz parte do planejamento estratégico.
16
3
• A maioria do financiamento é feito com recursos próprios.
46
2.875
3
Perguntas sobre a empresa em geral
150-499
> 20%
1 • 185 funcionários
• 40%
2
Nos últimos anos sua empresa criou novos produtos e
3
Várias inovações de produtos e processo
processos?
A empresa possui um processo de pesquisa e
4 desenvolvimento (P&D) contínuo? Tem um financiamento para
4
5-10% das vendas
P&D?
3
Appendices
74
Appendix J
Company J
Company J
3
2.5
2
1.5
1
0.5
0
Self-assessment (0-1)
Question 1
Question 2
Question 3
Question 4
Question 5
Question 6
Question 7
Question 8
Question 9
Question 10
Question 11
Question 12
Question 13
Question 14
Question 15
Question 16
Mean
Company J is a technological company providing analog intellectual property design.
Questions (in Portuguese)
Relevance (0-3)
Answers (in Portuguese)
Self-assessment (0-1) Relevance (0-3)
Reconhecer oportunidades para o crescimento
Nossa empresa reconhece sistematicamente oportunidades e
tendências nos mercados de referência e capta
1
sistematicamente os conhecimentos externos de
fornecedores, parceiros, clientes.
2
0.5
Nossa empresa é capaz de captar de forma sistemática as
ideias dos funcionários
0.5
Nossa empresa orienta suas atividades voltadas ao cliente e
3 cria novas oportunidades com base em necessidades
(futuras) dos clientes
1
Reconhecer oportunidades no ambiente de negócios
• Empresa pequena que esta no começo de elaborar uma prática para observar o mercado.
• Consultor de vendas e marketing para o mercado nos EUA e ajuda com perguntas sobre o mercado.
1
• Professor Da Europa que ajuda observar o mercado do continente.
3
• Doutorado na franca que escreve um trabalho sobre a avaliação do mercado global para os produtos.
• Pequena empresa com 7 pessoas. Troca de ideias acontece direto sem sistema.
2 • Problemas com produtos são levado aos funcionários, mas outros (financeiros, estratégia) são resolvidos
2
pelos gerentes.
Criação de novas oportunidades
• Desenvolvimento de produtos voltado aos desejos dos clientes.
• A empresa tem um portfolio de produtos quais são oferecidos aos clientes e customizados se o cliente
3
deseja.
3
• Desenvolvendo produtos junto com os clientes (mundiais: Brasil, EUA, Suíça).
• ACATE.
Através de parcerias e de redes com parceiros externos
(instituições de pesquisa, universidades, associações, etc.)
4
sistematicamente criamos oportunidades para inovação e
crescimento.
4
1
2
• Organização de produtores de semicondutores.
• Laboratório de CI da UFSC; Universidade Santa Maria do Rio do Sul; École polytechnique fédérale de
Lausanne (EPFL).
• Desenvolvimento junto com parceiros sócios.
Desenvolver e comunicar estratégias e os objetivos de crescimento
Desenvolver estratégia / objetivos de crescimento
• A empresa é jovem e começou a fazer um planejamento estratégico, mas ainda não acabo o planejamento do
ano e o planejamento tinha que ser feito de outro jeito.
5
Temos uma estratégia e objetivos de crescimento
5 convincentes. Nós somos capazes de atualizar a estratégia e
os objetivos para responder rapidamente a novas tendências.
6
Estamos aptos a desenvolver novos modelos de negócios que
criam valor a longo prazo.
7
A estratégia corporativa não existe apenas na mente do
empresário, mas se comunica intensamente e os funcionários
estão envolvidos em seu desenvolvimento para entender
como eles podem contribuir para o sucesso do negócio.
8
Nossa empresa sabe como entusiasmar seus empregados
para os objetivos da empresa.
0
3
1
3
0.5
3
• Faz parte do planejamento.
6
• A empresa está criando vários novos produtos e serviços.
Motivar os funcionários para o crescimento
• A empresa ainda é pequena, assim que todos os funcionários são informados sobre a estratégia e contribuem
para o sucesso do negocio.
7
8
1
3
• Todos os funcionários são estimulados a contribuir e conhecem os objetivos (empresa pequena com
hierarquia baixa).
• Depois de um projeto tem dias de folga.
• Almoço depois de um projeto.
Realizar as oportunidades de crescimento
Nossos funcionários pensam e agem com o espírito
9 empresarial e assumem um elevado grau de
responsabilidade.
10
1
Nossos executivos sabem delegar e criar espaços de
desempenho ("empowerment") para os funcionários.
0.5
Sistematicamente desenvolvemos as competências dos
11
nossos funcionários para garantir crescimento.
Compartilhamos ativamente os conhecimentos entre os
12 departamentos, funções e através de várias hierarquias na
empresa.
0.5
1
Desenvolver o espírito empreendedor dos funcionários
• Os funcionários participem muito bem no desenvolvimento técnico dos produtos.
9 • Os funcionários percebem a participação deles no sucesso da empresa.
2
• Os funcionários tomam decisões e se sentem responsáveis.
• Decisões gerais sobre o negocio são tomadas pela gerencia.
10 • Decisões em relação aos produtos são tomadas em conjunto.
2
• A empresa tenta a centralizar pouco e decentralizar a maioria das decisões e responsabilidades.
Desenvolver conhecimentos e competências
• Treinamentos aleatórios por causa de falta de dinheiro.
11
2
• Problemas técnicos são compartilhados e resolvidos com todos.
12 • Questões financeiras são resolvidas pelos chefes.
2
Gerenciar o crescimento
Somos capazes de adaptar os nossos processos e a
13
organização (empresa) para os desafios do crescimento.
14
0.5
Executivos e funcionários aprendam a viver com o
crescimento.
15
Asseguramos a disponibilidade de funcionários necessários
para o crescimento.
16
Asseguramos o financiamento do crescimento de forma
proativa
1
0.5
1
11.5
0.71875
Soma
Media
Perguntas sobre a empresa em geral
1 Quantos funcionários sua empresa possui?
2 Qual foi o aumento nas vendas no período entre 2008 e 2010?
Perguntas sobre a empresa em geral
0-20
> 20%
Nos últimos anos sua empresa criou novos produtos e
Inovações de processo e produto
processos?
A empresa possui um processo de pesquisa e
4 desenvolvimento (P&D) contínuo? Tem um financiamento para
De vez em quanto
P&D?
3
Organizar o crescimento
• A adaptação acontece de modo informal.
13
3
• A documentação técnica é mal feita (se uma pessoa chave ia sai da empresa isso ia dar problemas).
• A empresa criou um vinculo forte com os funcionários.
14 • O desenvolvimento e crescimento da empresa são motivação para os funcionários.
3
• A empresa criou vínculos com novos parceiros.
Assegurar recursos
• A empresa recruta mão de obra por meio de: Feiras em universidades, anúncios em jornais, indicação.
• A empresa mostra para os funcionários que eles fazem parte dos projetos.
15 o P.ex. Almoço no final de um projeto.
• A empresa determina a mão de obra necessária no planejamento dos projetos.
3
o Por causa de mais projetos no próximo ano a empresa está procurando 2-3 funcionários a mais.
• O diretor sempre está buscando financiamentos lucrativos.
16 • BNDES e outros bancos.
3
• A empresa está pensando em venture capital.
42
2.625
1 • 7 funcionários.
2
3
4
Appendices
75
Appendix K
Company K
Company K
3
2.5
2
1.5
1
0.5
0
Self-assessment (0-1)
Question 1
Question 2
Question 3
Question 4
Question 5
Question 6
Question 7
Question 8
Question 9
Question 10
Question 11
Question 12
Question 13
Question 14
Question 15
Question 16
Mean
Company K is a technology based business of the recycling sector.
Questions (in Portuguese)
Relevance (0-3)
Answers (in Portuguese)
Self-assessment (0-1) Relevance (0-3)
Reconhecer oportunidades para o crescimento
Reconhecer oportunidades no ambiente de negócios
• Informações do SEBRAE/ ACATE.
• Bolsas de resides.
1
• Grupos de conflitos ambientais .
Nossa empresa reconhece sistematicamente oportunidades e
tendências nos mercados de referência e capta
1
sistematicamente os conhecimentos externos de
fornecedores, parceiros, clientes.
Nossa empresa é capaz de captar de forma sistemática as
2
ideias dos funcionários
Nossa empresa orienta suas atividades voltadas ao cliente e
3 cria novas oportunidades com base em necessidades
(futuras) dos clientes
Através de parcerias e de redes com parceiros externos
(instituições de pesquisa, universidades, associações, etc.)
4
sistematicamente criamos oportunidades para inovação e
crescimento.
0.5
2
0.5
3
0.5
3
• Muito informal porque é uma empresa pequena.
2
• Dissertação de um estagiário.
Criação de novas oportunidades
• Desenvolve produtos junto com o cliente.
3 • A empresa faz uma entrevista com feedback via e-mail depois da venda.
4
1
• RIGCA
• Laboratório de Materiais / LMCC / GDA todos da UFSC.
• SENAI
3
Desenvolver e comunicar estratégias e os objetivos de crescimento
Desenvolver estratégia / objetivos de crescimento
• A empresa tinha-que realizar vários planos de negocio, por exemplo, para o SEBRAE.
• Faz-se um planejamento dos projetos da empresa.
5
• O planejamento é observado cada semestre de jeito informal.
Temos uma estratégia e objetivos de crescimento
5 convincentes. Nós somos capazes de atualizar a estratégia e
os objetivos para responder rapidamente a novas tendências.
6
Estamos aptos a desenvolver novos modelos de negócios que
criam valor a longo prazo.
7
A estratégia corporativa não existe apenas na mente do
empresário, mas se comunica intensamente e os funcionários
estão envolvidos em seu desenvolvimento para entender
como eles podem contribuir para o sucesso do negócio.
8
Nossa empresa sabe como entusiasmar seus empregados
para os objetivos da empresa.
1
2
0.5
3
6
• A empresa tem uma plataforma de produtos quais podem ser diferenciados aos desejos dos clientes.
Motivar os funcionários para o crescimento
• Desenvolvido junto com todos os funcionários (empresa pequena).
• Os funcionários são informados sobre todo.
7
0.5
2
1
3
8
• TCC dos funcionários.
• Os funcionários dizem que trabalhariam ate de graça (motivação alta).
Realizar as oportunidades de crescimento
Nossos funcionários pensam e agem com o espírito
9 empresarial e assumem um elevado grau de
responsabilidade.
Nossos executivos sabem delegar e criar espaços de
10
desempenho ("empowerment") para os funcionários.
11
Desenvolver o espírito empreendedor dos funcionários
• Os funcionários estão motivados a ajudar.
9 o Eles mantenham a empresa.
3
• Em algumas questões os funcionários ainda não são envolvidos tão bem.
• Os funcionários (estudantes) escolhem o TCC deles.
10
3
• A delegação de responsabilidades é prática comum na empresa.
Desenvolver conhecimentos e competências
• A empresa participe em treinamentos oferecidos pelo ACATE.
11 • A empresa trabalha com consultores do ACATE.
3
• O desenvolvimento acontece de modo informal por que a empresa ainda é pequena.
• Como a empresa ainda é pequena não tem hierarquias e departamentos.
12
2
0.5
0.5
Sistematicamente desenvolvemos as competências dos
nossos funcionários para garantir crescimento.
0.5
Compartilhamos ativamente os conhecimentos entre os
12 departamentos, funções e através de várias hierarquias na
empresa.
1
Gerenciar o crescimento
13
14
Somos capazes de adaptar os nossos processos e a
organização (empresa) para os desafios do crescimento.
Executivos e funcionários aprendam a viver com o
crescimento.
1
0.5
Asseguramos a disponibilidade de funcionários necessários
para o crescimento.
Asseguramos o financiamento do crescimento de forma
16
proativa
Soma
Media
15
0.5
0
10
0.625
Organizar o crescimento
• A empresa tem um planejamento para os próximos anos em termos de financiamento, funcionários e
13
3
objetivos (plano de negocio ACATE).
• Os funcionários são muito motivados por causa do crescimento da empresa.
14
3
Assegurar recursos
• A empresa recruta mão de obra por meio de: Feiras em universidades, indicação, contratação interna.
15
2
• A empresa planejou quantos funcionários vai precisar nos próximos anos (plano de negocio ACATE).
• Até agora a empresa foi financiada com dinheiro próprio dos empreendedores.
16
3
• A empresa está pensando em venture capital.
43
2.6875
Perguntas sobre a empresa em geral
1 Quantos funcionários sua empresa possui?
2 Qual foi o aumento nas vendas no período entre 2008 e 2010?
Perguntas sobre a empresa em geral
0-20
> 20%
Nos últimos anos sua empresa criou novos produtos e
Inovações de processo e produto
processos?
A empresa possui um processo de pesquisa e
4 desenvolvimento (P&D) contínuo? Tem um financiamento para
Mais que 10% das vendas
P&D?
3
1 • 4 funcionários.
2
3
4
Appendices
76
Appendix L
Company L
Company L
3
2.5
2
1.5
1
0.5
0
Self-assessment (0-1)
Question 1
Question 2
Question 3
Question 4
Question 5
Question 6
Question 7
Question 8
Question 9
Question 10
Question 11
Question 12
Question 13
Question 14
Question 15
Question 16
Mean
Company L is R&D business developing minimally invasive surgical devices.
Questions (in Portuguese)
Relevance (0-3)
Answers (in Portuguese)
Self-assessment (0-1) Relevance (0-3)
Reconhecer oportunidades para o crescimento
Reconhecer oportunidades no ambiente de negócios
• Rotinas de busca de informação.
• Observando os concorrentes mundiais.
1
• Sistematizando P&D.
Nossa empresa reconhece sistematicamente oportunidades e
tendências nos mercados de referência e capta
1
sistematicamente os conhecimentos externos de
fornecedores, parceiros, clientes.
1
3
• E-Mail com novidades para todos os funcionários e eles dão resposta com os pensamentos deles.
• Cada 15 dias reunião com troca de ideias sobre os projetos (com formulário).
• Em projetos se faz um brainstorming com todos os funcionários.
3
• Ideias dos funcionários são registradas e aproveitadas.
Criação de novas oportunidades
• Os clientes da empresa criam uma necessidade que a empresa tenta a dar satisfação.
o Depois os produtos são desenvolvidos junto com o cliente.
3
• A empresa encontra com os clientes depois da venda para saber se o cliente esta contente com o produto
3
(todas as indicações dos clientes são anotadas e formalizadas).
• Desenvolve junto com varias universidades (UFSC (LabSed)/ FINEP/ FESC/ FAPESC).
• Trabalha com bolsas do CNPq.
4
• SEBRAE/ ACATE dão consultoria e treinamentos.
3
Nossa empresa é capaz de captar de forma sistemática as
2
ideias dos funcionários
2
1
Nossa empresa orienta suas atividades voltadas ao cliente e
3 cria novas oportunidades com base em necessidades
(futuras) dos clientes
1
Através de parcerias e de redes com parceiros externos
(instituições de pesquisa, universidades, associações, etc.)
4
sistematicamente criamos oportunidades para inovação e
crescimento.
1
Desenvolver e comunicar estratégias e os objetivos de crescimento
Desenvolver estratégia / objetivos de crescimento
• Planejamento anual que inclui metas e finanças.
• Quando acontecem mudanças essas são integradas no planejamento.
5
• A empresa realiza rodadas com os investidores para criar uma estratégia a longo prazo.
Temos uma estratégia e objetivos de crescimento
5 convincentes. Nós somos capazes de atualizar a estratégia e
os objetivos para responder rapidamente a novas tendências.
6
Estamos aptos a desenvolver novos modelos de negócios que
criam valor a longo prazo.
7
A estratégia corporativa não existe apenas na mente do
empresário, mas se comunica intensamente e os funcionários
estão envolvidos em seu desenvolvimento para entender
como eles podem contribuir para o sucesso do negócio.
8
Nossa empresa sabe como entusiasmar seus empregados
para os objetivos da empresa.
1
3
1
3
0.5
3
1
3
• A empresa tem um modelo de negocio qual é analisado criticamente.
6
• A empresa recebe consultoria para a avaliação do negocio.
Motivar os funcionários para o crescimento
• Calendário periódico.
• As expectativas e a estratégia são compartilhadas com os funcionários.
7 • A informação é divulgada para todos os funcionários.
o A empresa esta desenvolvendo uma informação sistemática.
• Informação sobre as metas da empresa desde a fundação.
8 • Os funcionários são entusiasmados por causa da participação alta (brainstorming/ ideias aproveitadas/
participação em eventos da ACATE).
Realizar as oportunidades de crescimento
Nossos funcionários pensam e agem com o espírito
9 empresarial e assumem um elevado grau de
responsabilidade.
10
Desenvolver o espírito empreendedor dos funcionários
• A empresa tem uma politica de gestão que garante que cada funcionário tem próprias responsabilidades.
• Os funcionários tem a liberdade de agir com liberdade na área deles.
9
• Na empresa tem muita troca de informações entre todos e uma biblioteca que esta a disposição de todos.
3
• Problemas com produtos são compartilhados com todos para procurar a solução junto.
• Decisões são tomadas em conjunto.
• A empresa é organizada de um jeito que dentro de certa metodologia cada funcionário tem a liberdade de agir
10 na área dele.
• No iniciou do desenvolvimento de um novo produto todos junto fazem um brainstorming para captar todas as
3
ideias dentro da empresa.
Desenvolver conhecimentos e competências
• A empresa participe em treinamentos do ACATE.
• A empresa oferece treinamentos técnicos aos funcionários.
11
• Cada semana tem cursos internos.
3
• Tem-se uma matriz de competência.
• Cursos semanais.
12 • Reuniões com todos os funcionários cada duas semanas.
3
• Grupos de melhoria.
1
Nossos executivos sabem delegar e criar espaços de
desempenho ("empowerment") para os funcionários.
1
11
Sistematicamente desenvolvemos as competências dos
nossos funcionários para garantir crescimento.
1
Compartilhamos ativamente os conhecimentos entre os
12 departamentos, funções e através de várias hierarquias na
empresa.
1
Gerenciar o crescimento
Somos capazes de adaptar os nossos processos e a
13
organização (empresa) para os desafios do crescimento.
Executivos e funcionários aprendam a viver com o
14
crescimento.
15
Asseguramos a disponibilidade de funcionários necessários
para o crescimento.
16
Asseguramos o financiamento do crescimento de forma
proativa
Organizar o crescimento
• A empresa esta no processo de formalizar os processos.
13
3
• A empresa tem um sistema de qualidade formalizado.
• A empresa esta crescendo de forma informal e vai sentindo o que é preciso fazer diante o crescimento.
14
3
0.5
0.5
1
0.5
14
0.875
Soma
Media
Assegurar recursos
• A empresa recruta mão de obra por meio de: Feiras em universidades, indicação, contratação interna.
• A empresa faz um planejamento anual aonde os recursos humanos necessários são previstos.
15 • Os funcionários da empresa são motivados por causa da dinâmica da empresa, o respeito e eles sentem que
fazem parte da empresa.
2
• Valorização do trabalho constante.
• Fontes atrativas de financiamento são buscadas constantemente.
16 • O financiamento da empresa e das áreas e projetos faz parte do planejamento anual.
3
• A empresa tem um plano de negocio com o planejamento das finanças feito para o ACATE.
47
2.9375
Perguntas sobre a empresa em geral
1 Quantos funcionários sua empresa possui?
Perguntas sobre a empresa em geral
0-20
2 Qual foi o aumento nas vendas no período entre 2008 e 2010?
Nos últimos anos sua empresa criou novos produtos e
Inovações de processo e produto
processos?
A empresa possui um processo de pesquisa e
4 desenvolvimento (P&D) contínuo? Tem um financiamento para
Mais que 10% das vendas
P&D?
3
1 • 7 funcionários.
• A empresa está em uma situação de desenvolvimento de produtos e ainda não tem vendas efectivadas.
2
3
4
Appendices
77
Appendix M
Company M
Company M
3
2.5
2
1.5
1
0.5
0
Self-assessment (0-1)
Question 1
Question 2
Question 3
Question 4
Question 5
Question 6
Question 7
Question 8
Question 9
Question 10
Question 11
Question 12
Question 13
Question 14
Question 15
Question 16
Mean
Company M is a producer of plastic parts for the white goods and automotive industry.
Questions (in Portuguese)
Relevance (0-3)
Answers (in Portuguese)
Self-assessment (0-1) Relevance (0-3)
Reconhecer oportunidades para o crescimento
1
Nossa empresa reconhece sistematicamente oportunidades e
tendências nos mercados de referência e capta
sistematicamente os conhecimentos externos de
fornecedores, parceiros, clientes.
2
Nossa empresa é capaz de captar de forma sistemática as
ideias dos funcionários
1
0.5
Nossa empresa orienta suas atividades voltadas ao cliente e
3 cria novas oportunidades com base em necessidades
(futuras) dos clientes
Através de parcerias e de redes com parceiros externos
(instituições de pesquisa, universidades, associações, etc.)
4
sistematicamente criamos oportunidades para inovação e
crescimento.
1
Reconhecer oportunidades no ambiente de negócios
• Reunião de diretores e acionistas anuais (reunião do conselho).
o Elaboração de objetivos, metas e da visão geral.
o O que tem de feito melhor no mercado (Analise SWOT).
1 o Quem esta entrado no mercado / novos competidores.
• Revisão das metas e dos objetivos mensalmente.
• Visita de feiras e eventos.
3
• Informações de organizações (Biplast / SIGE).
• Gestão participativa, mas só no nível dos gestores.
2
3
• “Ideias de melhoria” Caixa de sugestões.
Criação de novas oportunidades
• Cada 2 anos a empresa faz uma pesquisa da satisfação do cliente.
3 • Os clientes desenvolvem os produtos que depois são produzidos pela empresa.
2
• A empresa trabalha com fornecedores que participem do desenvolvimento dos produtos.
4
0.5
2
Desenvolver e comunicar estratégias e os objetivos de crescimento
Desenvolver estratégia / objetivos de crescimento
• Planejamento anual que inclui: Budget, metas, estratégia, por cada área, a diretoria e os gestores da empresa.
• As mudanças do planejamento que acontecem durante o ano são registradas e integradas no planejamento.
5 • A empresa faz um alinhamento da estratégia se necessário.
Temos uma estratégia e objetivos de crescimento
5 convincentes. Nós somos capazes de atualizar a estratégia e
os objetivos para responder rapidamente a novas tendências.
1
6
Estamos aptos a desenvolver novos modelos de negócios que
criam valor a longo prazo.
A estratégia corporativa não existe apenas na mente do
empresário, mas se comunica intensamente e os funcionários
estão envolvidos em seu desenvolvimento para entender
como eles podem contribuir para o sucesso do negócio.
8
Nossa empresa sabe como entusiasmar seus empregados
para os objetivos da empresa.
• A empresa realiza uma analise periódica do portfolio de produtos.
• O conselho da formaliza um planejamento estratégico ao longo prazo cada 5-10 anos.
o Esse planejamento estratégico ajudou a empresa a ampliar o foco da produção para outra linha de produtos
3
(antes só linha branca, agora também automotiva).
Motivar os funcionários para o crescimento
• A empresa informa os funcionários sobre as metas e a estratégia na reunião de inicio do ano.
• Ao lado disso tem reuniões mensais com os colaboradores.
7
6
1
7
3
1
3
0.5
3
• Objetivos de qualidade, quantidade e desejos dos clientes são comunicados em reuniões mensais.
8 • A empresa esta planejando a participação do lucro dos funcionários dependendo da produtividade.
• A empresa tenta de melhorar o feedback dos funcionários.
Realizar as oportunidades de crescimento
Desenvolver o espírito empreendedor dos funcionários
• Ideias de melhoria tinham que ser desenvolvidas por que no momento esse aspecto esta faltando.
9 o Ainda não tem nada formalizado.
Nossos funcionários pensam e agem com o espírito
9 empresarial e assumem um elevado grau de
responsabilidade.
10
11
Nossos executivos sabem delegar e criar espaços de
desempenho ("empowerment") para os funcionários.
Sistematicamente desenvolvemos as competências dos
nossos funcionários para garantir crescimento.
0.5
3
0.5
3
0.5
Compartilhamos ativamente os conhecimentos entre os
12 departamentos, funções e através de várias hierarquias na
empresa.
1
• No nível de gestores todos são envolvidos e tem liberdade de agir na área deles.
10 • Também os técnicos e os chefes do chão da produção participem muito e tomam responsabilidade.
• Mas a participação dos trabalhadores no chão de fabrica tinha que ser melhorado.
Desenvolver conhecimentos e competências
• Matriz de competência em mapeamento.
11 • Competências faltantes são detectadas dentro do mapeamento.
3
• A empresa oferece treinamentos internos e externos. Cursos técnicos e de outras qualificações.
• Têm-se reuniões periódicas entre as varias áreas e hierarquias.
o Reuniões especiais com todas as áreas relevantes.
12
• Têm-se grupos de melhoria.
3
• Integração forte entre os departamentos.
Gerenciar o crescimento
13
Somos capazes de adaptar os nossos processos e a
organização (empresa) para os desafios do crescimento.
14
Executivos e funcionários aprendam a viver com o
crescimento.
0.5
15
Asseguramos a disponibilidade de funcionários necessários
para o crescimento.
16
Asseguramos o financiamento do crescimento de forma
proativa
1
1
1
12.5
0.78125
Soma
Media
Perguntas sobre a empresa em geral
1 Quantos funcionários sua empresa possui?
2 Qual foi o aumento nas vendas no período entre 2008 e 2010?
Organizar o crescimento
• A empresa é capaz de adaptar os processos, mas pode melhorar.
• As responsabilidades são definidas.
13
• Têm-se definições de trabalho.
3
• O detalhamento podia ser melhor. Adaptação a novas mudanças.
• Planejamento anual cuida do crescimento
14 • A introdução da nova linha (automóveis) foi planejada para ter a quantidade necessário de funcionários,
3
fornecedores, budget.
Assegurar recursos
• A empresa recruta mão de obra por meio de: Head-Hunter, anúncios em jornais, indicação, contratação
interna.
• A empresa desenvolve pessoal internamente.
15 • Profissionais procurados no mercado.
• Os funcionários se sentem bem na empresa.
• O salario é no nível do mercado.
3
• Confraternização por meio de eventos.
• O financiamento depende do planejamento estratégico com previsão de vendas.
16 • Muitos projetos são financiados com próprios recursos.
3
• BNDES
46
2.875
Perguntas sobre a empresa em geral
150-499
4% - 9,9%
1 • 200 funcionários.
• 7-8% por ano.
2
Nos últimos anos sua empresa criou novos produtos e
• Só desenvolvimento de processos por que os produtos são desenvolvidos pelos clientes.
3
Ou inovações de produto ou inovações de processo
processos?
A empresa possui um processo de pesquisa e
4 desenvolvimento (P&D) contínuo? Tem um financiamento para
4
Não tem
P&D?
3
Appendices
78
Appendix N
Company N
Company N
3
2.5
2
1.5
1
0.5
0
Self-assessment (0-1)
Question 1
Question 2
Question 3
Question 4
Question 5
Question 6
Question 7
Question 8
Question 9
Question 10
Question 11
Question 12
Question 13
Question 14
Question 15
Question 16
Mean
Company N is creating solutions for infrastructure, secialized in urbanization, paving, airport and other
special constructions.
Questions (in Portuguese)
Relevance (0-3)
Answers (in Portuguese)
Self-assessment (0-1) Relevance (0-3)
Reconhecer oportunidades para o crescimento
Reconhecer oportunidades no ambiente de negócios
• Pesquisa individual em jornais, arquivos, para observar o mercado.
• Reuniões semanais para discutir as tendências.
1
• Trabalhando com associações para ter informações sobre o mercado.
Nossa empresa reconhece sistematicamente oportunidades e
tendências nos mercados de referência e capta
1
sistematicamente os conhecimentos externos de
fornecedores, parceiros, clientes.
0.5
Nossa empresa é capaz de captar de forma sistemática as
2
ideias dos funcionários
• Reuniões para buscar as ideias dos funcionários (só com os funcionários do nível de chefia).
• Instalando reuniões com todos os funcionários.
• Caixa de sugestões.
3
• Ideias são debatidas e avaliadas antes de talvez aplicar (feedback para os funcionários).
Criação de novas oportunidades
• Sempre buscando as necessidades do cliente.
• Pesquisa da satisfação do cliente (ISO).
3
• A empresa está em comunicação intensa com os clientes e percebe um retorno deles (cliente parece
3
satisfeito).
• Estudos com a UDESC.
• Parceria com a UFSC.
4
• Rede de infraestrutura.
3
2
0.5
Nossa empresa orienta suas atividades voltadas ao cliente e
3 cria novas oportunidades com base em necessidades
(futuras) dos clientes
4
2
0.5
Através de parcerias e de redes com parceiros externos
(instituições de pesquisa, universidades, associações, etc.)
sistematicamente criamos oportunidades para inovação e
crescimento.
1
Desenvolver e comunicar estratégias e os objetivos de crescimento
Temos uma estratégia e objetivos de crescimento
5 convincentes. Nós somos capazes de atualizar a estratégia e
os objetivos para responder rapidamente a novas tendências.
0.5
6
Estamos aptos a desenvolver novos modelos de negócios que
criam valor a longo prazo.
1
7
8
A estratégia corporativa não existe apenas na mente do
empresário, mas se comunica intensamente e os funcionários
estão envolvidos em seu desenvolvimento para entender
como eles podem contribuir para o sucesso do negócio.
Desenvolver estratégia / objetivos de crescimento
• Planejamento estratégico incluindo metas, qualidade, funcionários, etc.
o O planejamento é formalizado.
• Monitoria do planejamento é feito mensalmente.
5
o As revisões do planejamento são registradas, formalizados e apresentados.
• A empresa procura melhorar a participação dos funcionários na concepção do planejamento e para conseguir
2
as metas.
• O desenvolvimento de novos modelos de negócios é uma característica da empresa (pioneira, a primeira
empresa brasileira que tento a ter uma conceição).
6 • A empresa procura novos modelos que tem um lucro com mais longevidade (projetos em aeroportos/
pedágios).
3
• A empresa tem um setor para o desenvolvimento de novos negócios/ projetos.
Motivar os funcionários para o crescimento
• A estratégia é comunicada para todos os funcionários em uma reunião anual.
7
Nossa empresa sabe como entusiasmar seus empregados
para os objetivos da empresa.
1
3
0
2
8
• Fase de aperfeiçoamento.
• Não tem participação no lucro.
Realizar as oportunidades de crescimento
Desenvolver o espírito empreendedor dos funcionários
• A empresa delega responsabilidades ate certo nível.
9 • Só o nível da liderança participe muito .
Nossos funcionários pensam e agem com o espírito
9 empresarial e assumem um elevado grau de
responsabilidade.
10
11
Nossos executivos sabem delegar e criar espaços de
desempenho ("empowerment") para os funcionários.
0
2
0.5
2
Sistematicamente desenvolvemos as competências dos
nossos funcionários para garantir crescimento.
0.5
Compartilhamos ativamente os conhecimentos entre os
12 departamentos, funções e através de várias hierarquias na
empresa.
0.5
• Mais centralização do que delegação.
10 • A empresa ainda é centralizada (familiar), mas está começando a delegar mais responsabilidades.
o As pessoas ainda levam muitos problemas pra cima em vez de resolver o assunto mesmo.
Desenvolver conhecimentos e competências
• O desenvolvimento de competências não acontece sistemático.
• Se a empresa detecta um funcionário talentoso ou dedicado ela esforça as competências desse funcionário
11
(mas sem sistemática).
2
• Treinamentos internos (técnicos, de comunicação,...).
• Cada mês tem reuniões entre as varias hierarquias e áreas.
12 • Têm-se grupos de qualidade.
1
• Cursos para melhorar as relações entre as pessoas para ter mais contato entre as áreas.
Gerenciar o crescimento
13
Somos capazes de adaptar os nossos processos e a
organização (empresa) para os desafios do crescimento.
14
Executivos e funcionários aprendam a viver com o
crescimento.
15
Asseguramos a disponibilidade de funcionários necessários
para o crescimento.
16
Asseguramos o financiamento do crescimento de forma
proativa
0
0.5
1
1
9
0.5625
Soma
Media
Perguntas sobre a empresa em geral
1 Quantos funcionários sua empresa possui?
2 Qual foi o aumento nas vendas no período entre 2008 e 2010?
Organizar o crescimento
• Os processos são dentro da mente do gerente.
13 o A empresa tem planejado de criar uma ferramenta.
2
• Não tem nada formalizado, muito informal.
• Mapeamento do crescimento feito no planejamento anual.
14
2
• Os funcionários são informados sobre o crescimento e novos produtos.
Assegurar recursos
• A empresa recruta mão de obra por meio de: Anúncios em jornais, indicação, contratação interna.
• A necessidade de mão de obra é dimensionada no planejamento anual.
• A politica da empresa incentiva a aprendizagem dos funcionários.
15
o Cursos de especialização
• Pouca rotatividade.
2
• Os funcionários participem em congressos e sentem responsabilidade.
• A empresa está em busca constante de financiamentos atrativos.
16 • Mas em geral tenta de ter uma divida baixa.
1
• Cada área da empresa analisa a necessidade de recursos financeiros e depois os gerentes decidem.
35
2.1875
Perguntas sobre a empresa em geral
150-499
4% - 9,9%
1 • 380 funcionários.
• 5% por ano.
2
Nos últimos anos sua empresa criou novos produtos e
3
Ou inovações de produto ou inovações de processo
processos?
A empresa possui um processo de pesquisa e
4 desenvolvimento (P&D) contínuo? Tem um financiamento para
4
Não tem
P&D?
3
Appendices
79
Appendix O
Company O
Company O
3
2.5
2
1.5
1
0.5
0
Self-assessment (0-1)
Question 1
Question 2
Question 3
Question 4
Question 5
Question 6
Question 7
Question 8
Question 9
Question 10
Question 11
Question 12
Question 13
Question 14
Question 15
Question 16
Mean
Company O is a producer of data transmission technology.
Questions (in Portuguese)
Relevance (0-3)
Answers (in Portuguese)
Self-assessment (0-1) Relevance (0-3)
Reconhecer oportunidades para o crescimento
Nossa empresa reconhece sistematicamente oportunidades e
tendências nos mercados de referência e capta
1
sistematicamente os conhecimentos externos de
fornecedores, parceiros, clientes.
0.5
Nossa empresa é capaz de captar de forma sistemática as
2
ideias dos funcionários
0.5
Nossa empresa orienta suas atividades voltadas ao cliente e
3 cria novas oportunidades com base em necessidades
(futuras) dos clientes
3
0.5
4
Reconhecer oportunidades no ambiente de negócios
Trabalhando junto com os clientes para observar o mercado.
• Fornecedores.
1
• Parceiros de outros países.
3
• Organizações estaduais (FIESC).
• Participação dos funcionários na resolução dos problemas, mas não sistemático.
• Os funcionários podem cadastrar ideias na intranet da empresa.
2
• Campeonato da qualidade (estimular a criatividade e inovação).
2
• Sistema de qualidade (reuniões para a resolução de problemas em relação à qualidade).
Criação de novas oportunidades
• Os desejos dos clientes são observados pelo departamento de marketing, que observa a demanda e faz um
questionário eletrônico com os clientes.
Através de parcerias e de redes com parceiros externos
(instituições de pesquisa, universidades, associações, etc.)
sistematicamente criamos oportunidades para inovação e
crescimento.
0.5
tenta produzir o desejo.
• Se a empresa tem uma tecnologia melhor do que a desejada do cliente ela faz uma proposta pra conhecer a
nova tecnologia.
• A empresa é entidade de classe da ACATE e recebe informações.
• Projetos com universidades para o desenvolvimento de novos produtos.
• Trabalha com centros de pesquisa da área.
4
• Trabalhando com parceiros para desenvolver novos produtos.
• Antigamente todas essas praticas foram mais comum, quando a empresa era menor. Depois do crescimento
2
essas atividades com outras entidades diminuíram.
3
Desenvolver e comunicar estratégias e os objetivos de crescimento
Desenvolver estratégia / objetivos de crescimento
• A empresa faz um planejamento anualmente, concebida na reunião dos diretores.
• A empresa faz ajustes no planejamento no meio do ano.
5
• A empresa tem reuniões semanais e trimestrais para acompanhar o planejamento.
Temos uma estratégia e objetivos de crescimento
5 convincentes. Nós somos capazes de atualizar a estratégia e
os objetivos para responder rapidamente a novas tendências.
0.5
Estamos aptos a desenvolver novos modelos de negócios que
6
criam valor a longo prazo.
A estratégia corporativa não existe apenas na mente do
empresário, mas se comunica intensamente e os funcionários
estão envolvidos em seu desenvolvimento para entender
como eles podem contribuir para o sucesso do negócio.
8
Nossa empresa sabe como entusiasmar seus empregados
para os objetivos da empresa.
• A empresa quer se tornar em um provedor de serviços, em vez de produtor de produtos.
o A empresa formalizo um processo de transformação para atingir essa meta em 5 anos.
• Quando a empresa percebe que o valor percebido pelo cliente esta diminuindo, ela elabora novos serviços
2
(instalação etc.).
Motivar os funcionários para o crescimento
• O planejamento é feito pelos gerentes e diretores.
• As metas (de qualidade) são desdobradas para todos os funcionários.
7 • Reunião de final do ano para informar sobre a estratégia da empresa.
• A informação é boa ate o nível de gerencia, depois tem menos informação.
2
• Informação sobre a estratégia só para os gerentes.
8 • Os funcionários da produção só conhecem as metas de qualidade.
2
• Participação no resultado para os funcionários.
6
0.5
7
3
0.5
0.5
Realizar as oportunidades de crescimento
Nossos funcionários pensam e agem com o espírito
9 empresarial e assumem um elevado grau de
responsabilidade.
0.5
10
Nossos executivos sabem delegar e criar espaços de
desempenho ("empowerment") para os funcionários.
11
Sistematicamente desenvolvemos as competências dos
nossos funcionários para garantir crescimento.
0.5
Desenvolver o espírito empreendedor dos funcionários
• Os funcionários tem a liberdade de agir na área deles, mas muitas vezes tem inseguridade e levam os
problemas para cima.
9 • Só no nível de gerencia e diretoria os funcionários agem com espirito de empreendedor.
• Os outros funcionários são mais reativo do que proativo.
2
• A empresa tenta a mostrar para os funcionários que cada projeto tem que ser direcionado ao cliente.
• Os executivos delegam responsabilidades para os gerentes e tarefas para os outros funcionários.
10
2
• Problemas são discutidos em grupos, mas as decisões são tomadas pelos diretores.
Desenvolver conhecimentos e competências
• A empresa não tem uma matriz de competência. Isso é feito pelos gerentes dependendo do feeling.
• Treinamentos básicos de qualidade e produtividade. Treinamentos mais específicos são oferecidos
dependendo demanda.
• Acontecem reuniões entre as hierarquias e áreas. Mas não periódico.
12 • Têm-se grupos de processo.
11
Compartilhamos ativamente os conhecimentos entre os
12 departamentos, funções e através de várias hierarquias na
empresa.
0.5
2
0.5
2
Gerenciar o crescimento
13
Somos capazes de adaptar os nossos processos e a
organização (empresa) para os desafios do crescimento.
14
Executivos e funcionários aprendam a viver com o
crescimento.
0.5
15
0.5
Asseguramos a disponibilidade de funcionários necessários
para o crescimento.
0.5
16
Asseguramos o financiamento do crescimento de forma
proativa
Soma
Media
1
8.5
0.53125
Perguntas sobre a empresa em geral
1 Quantos funcionários sua empresa possui?
2 Qual foi o aumento nas vendas no período entre 2008 e 2010?
Perguntas sobre a empresa em geral
50-149
> 20%
Nos últimos anos sua empresa criou novos produtos e
Inovações de processo e produto
processos?
A empresa possui um processo de pesquisa e
4 desenvolvimento (P&D) contínuo? Tem um financiamento para
5-10% das vendas
P&D?
3
Organizar o crescimento
• Os processos são formalizados no sistema eletrônico. Todos os funcionários tem acesso a essas
informações.
13
• O redesenho de processos depende da demanda interna.
2
o Falta a participação dos funcionários – Muita demanda, mas poucos que agem.
• Crescimento bem acelerado.
14 o Por causa disso tem muita mudança.
2
o É difícil redimensionar os processos.
Assegurar recursos
• A empresa recruta mão de obra por meio de: Head-Hunter (novo presidente), indicação, contratação interna.
• A diretoria e os gerentes dimensionam a necessidade de mão de obra.
• Programas de motivação para os funcionários.
• O salario é na media do mercado.
15
• A empresa encontra dificuldades em manter os funcionários da área técnica (alta rotatividade).
• Dificuldade de contratar funcionários com conhecimento necessário (Novos funcionários só têm 20% da
capacidade necessário. O resto a empresa dar treinamento).
2
• A empresa capta recursos do governo para P&D (BNDES)
16
3
• A empresa faz um planejamento financeiro.
36
2.25
1 75 funcionarios
• 50% por ano.
2
3
4
Worst
Medium
Best
Mean
Worst
Medium
Best
Best/Worst
E
G
D
A
O
N
F
C
K
B
J
H
M
I
L
Mean
Question 2
Question 2
Questions 5-8
0.45
0.60
0.85
0.63
2.25
2.45
2.75
2.48
0.33
0.65
0.78
0.58
2.40
2.45
2.90
2.58
3.00
3.00
2.80
Rel.
0.45
0.63
0.80
0.63
2.40
2.35
2.70
2.48
Rel.
Questions 9-12
0.70
0.70
1.00
S.-As. Rel. S.-As. Rel. S.-As.
Questions 1-4
0.50 2.40 0.40 2.20
0.60 2.40 0.70 2.40
0.90 3.00 0.70 2.60
2.93
3
3
3
3
3
3
3
3
3
3
3
3
2
3
3
Question 3
0.80
0.5
0.5
1
1
0.5
0.5
0.5
1
0.5
1
1
1
1
1
1
S.-As. Rel. S.-As. Rel. S.-As.
Question 1
0.67 2.60 0.60 2.40
0
2
0
3
0.5
2 0.5
2
0.5
3 0.5
2
1
2 0.5
2
0.5
3 0.5
2
0.5
2 0.5
3
0.5
3 0.5
2
1
2
1
2
0.5
2 0.5
3
0.5
3
1
2
0.5
3 0.5
2
1
3
1
3
1
3 0.5
3
1
3 0.5
2
1
3
1
3
Rel.
Question 3
S.-As. Rel. S.-As. Rel. S.-As.
Question 1
2.00
0
1
1
3
2
3
2
1
3
1
2
3
2
3
3
Rel.
0.55
0.55
0.75
0.62
S.-As.
Question 5
Question 6
Question 7
Question 8
Question 9 Question 10 Question 11 Question 12 Question 13 Question 14 Question 15 Question 16
Question 6
Question 7
Question 8
Question 9 Question 10 Question 11 Question 12 Question 13 Question 14 Question 15 Question 16
2.20
2.25
2.90
2.45
Rel.
2.50 Best/Worst
2.19 Worst
2.38 Worst
2.38 Worst
2.38 Worst
2.25 Worst
2.19 Medium
2.63 Medium
1.81 Medium
2.69 Medium
2.56 Medium
2.63 Best
2.75 Best
2.88 Best
2.88 Best
2.94 Best
0.44
0.61
0.79
2.31
2.38
2.81
Rel.
Mean Mean
0.61
0.28
0.41
0.50
0.50
0.53
0.56
0.56
0.63
0.63
0.66
0.72
0.75
0.78
0.84
0.88
S.-As. Rel. S.-As. Rel. S.-As. Rel. S.-As. Rel. S.-As. Rel. S.-As. Rel. S.-As. Rel. S.-As. Rel. S.-As. Rel. S.-As. Rel. S.-As. Rel. S.-As. Rel. S.-As.
Question 5
0.63 2.53 0.67 2.53 0.50 2.53 0.53 2.73 0.70 2.60 0.63 2.53 0.53 2.47 0.63 2.33 0.60 2.53 0.63 2.40 0.60 2.53 0.63 2.33
0.5
3
0
1 0.5
3 0.5
3 0.5
3 0.5
2
0
3
0
1
0
1 0.5
2 0.5
2 0.5
3
0.5
2 0.5
3
0
3 0.5
3 0.5
3 0.5
2 0.5
3 0.5
2
0
3 0.5
2 0.5
3 0.5
1
0
2 0.5
3
0
2
0
3
1
2
1
3
0
2 0.5
3 0.5
2 0.5
1
1
3
1
3
0
2 0.5
1 0.5
2
0
3 0.5
2 0.5
3
0
3 0.5
3
1
2
1
2
0
3 0.5
2
0.5
3 0.5
2 0.5
2 0.5
2 0.5
2 0.5
2 0.5
2 0.5
2 0.5
2 0.5
2 0.5
2
1
3
0.5
2
1
3
1
3
0
2
0
2 0.5
2 0.5
2 0.5
1
0
2 0.5
2
1
2
1
1
1
3 0.5
3
0
2 0.5
2
1
3
1
3
1
2 0.5
3 0.5
3 0.5
3 0.5
3 0.5
2
1
3 0.5
1 0.5
2 0.5
2
1
2 0.5
2
1
2
1
2
1
2
0
1
0
1
0
1
1
2 0.5
3 0.5
2
1
3 0.5
3 0.5
3 0.5
3
1
2
1
3 0.5
3 0.5
2
0
3
1
2
1
3 0.5
3 0.5
3 0.5
3 0.5
2 0.5
2
0
3
1
3
1
3
1
3 0.5
2
0
3
1
3 0.5
3
1
3
1
2 0.5
2 0.5
2
1
2 0.5
3
1
3 0.5
3
1
3
0.5
2 0.5
3 0.5
3
1
3
1
3
1
3 0.5
2 0.5
2
1
3 0.5
3 0.5
3 0.5
2
1
3
1
3
1
3 0.5
3 0.5
3 0.5
3 0.5
3
1
3 0.5
3
1
3
1
3
1
3
1
3
1
3
1
2 0.5
3
1
3 0.5
3
1
3
1
3
1
3
1
3 0.5
3
1
3
1
1
1
1
3
1
3 0.5
3
1
3
3
1
3
3
1
3 0.5
3 0.5
3
2 0.5
3
Rel.
Mean Mean
S.-As. Rel. S.-As. Rel. S.-As. Rel. S.-As. Rel. S.-As. Rel. S.-As. Rel. S.-As. Rel. S.-As. Rel. S.-As. Rel. S.-As. Rel. S.-As. Rel. S.-As. Rel. S.-As.
1.40 0.30 2.40 0.40 2.00 0.30 2.40 0.30 2.80 0.60 2.40 0.60 2.40 0.20 2.60 0.40 2.20 0.40 2.00 0.60 1.80 0.50 2.60 0.70 2.40
2.00 0.90 2.40 0.70 2.60 0.50 2.40 0.50 2.40 0.60 2.60 0.60 2.40 0.70 2.20 0.60 2.20 0.70 2.60 0.50 2.40 0.60 2.20 0.40 1.80
2.60 0.70 2.80 0.90 3.00 0.70 2.80 0.80 3.00 0.90 2.80 0.70 2.80 0.70 2.60 0.90 2.60 0.70 3.00 0.80 3.00 0.70 2.80 0.80 2.80
Rel.
Questions 13-16
0.20
0.40
0.80
S.-As.
Question 4
0.47
0
0
0
0.5
0.5
1
0
0
1
0
1
1
0.5
0.5
1
S.-As.
Question 4
Classification of the fifteen companies by best, medium and worst mean values
Appendices
80
Appendix P
A (0-20)
B (21-49)
C (50-149)
D (150-499)
Mean
A (0-20)
B (21-49)
C (50-149)
D (150-499)
Employees
D
E
G
J
K
L
A
C
F
B
O
H
I
M
N
Mean
Question 2
Question 2
2.50
2.33
3.00
2.75
2.50
2.00
2.00
2.75
Questions 5-8
0.50
0.67
0.75
0.63
0.56
0.63
0.56
0.78
0.63
2.42
2.33
2.38
2.75
2.47
0.52
0.46
0.63
0.75
0.59
2.71
2.17
2.50
2.75
2.53
3.00
3.00
3.00
2.75
Rel.
0.63
0.71
0.44
0.66
0.61
2.50
2.50
2.25
2.56
2.45
Rel.
Questions 9-12
0.75
0.83
0.75
0.88
S.-As. Rel. S.-As. Rel. S.-As.
Questions 1-4
0.50
0.83
0.50
0.88
2.93
3
3
3
3
3
3
3
3
3
3
3
3
3
2
3
Question 3
0.80
1
0.5
0.5
1
0.5
1
1
1
0.5
1
0.5
1
1
1
0.5
S.-As. Rel. S.-As. Rel. S.-As.
Question 1
0.67 2.60 0.60 2.40
0.5
3 0.5
2
0
2
0
3
0.5
2 0.5
2
0.5
3 0.5
2
0.5
2 0.5
3
1
3
1
3
1
2 0.5
2
1
2
1
2
0.5
3 0.5
2
0.5
3
1
2
0.5
3 0.5
2
1
3
1
3
1
3 0.5
2
1
3 0.5
3
0.5
2 0.5
3
Rel.
Question 3
S.-As. Rel. S.-As. Rel. S.-As.
Question 1
2.00
1
0
1
2
3
3
3
1
2
1
2
3
3
2
3
Rel.
1.67
2.00
1.50
2.75
Rel.
0.56
0.46
0.75
0.75
0.63
S.-As.
2.50
2.08
2.50
2.63
2.43
Rel.
Questions 13-16
0.50
0.17
0.25
0.75
S.-As.
Question 4
0.47
0
0
0
1
1
1
0.5
0
0
0
0.5
1
0.5
0.5
1
S.-As.
Question 4
Question 6
Question 7
Question 8
Question 9 Question 10 Question 11 Question 12 Question 13 Question 14 Question 15 Question 16
Question 6
Question 7
Question 8
Question 9 Question 10 Question 11 Question 12 Question 13 Question 14 Question 15 Question 16
0.50
0.67
0.75
0.75
2.50
2.67
2.50
2.50
0.58
0.50
0.75
0.88
2.67
1.67
2.50
3.00
0.33
0.33
0.50
0.88
2.67
2.00
2.50
2.75
0.67
0.33
0.50
0.50
3.00
2.33
2.50
2.75
0.75
0.83
0.50
0.63
2.67
2.33
2.50
2.75
0.67
0.67
0.50
0.63
2.50
2.67
2.00
2.75
0.42
0.67
0.50
0.63
2.67
2.33
2.00
2.50
0.67
0.67
0.25
0.75
2.17
2.67
2.50
2.25
0.42
0.83
0.75
0.63
2.50
2.33
2.50
2.75
0.58
0.50
0.75
0.75
2.33
2.00
2.50
2.75
0.67
0.17
0.75
0.75
2.50
2.33
2.50
2.75
0.58
0.33
0.75
0.88
2.67
1.67
2.50
2.25
2.50 Employees
2.38 A (0-20)
2.19 A (0-20)
2.38 A (0-20)
2.63 A (0-20)
2.69 A (0-20)
2.94 A (0-20)
2.38 B (21-49)
1.81 B (21-49)
2.63 B (21-49)
2.56 C (50-149)
2.25 C (50-149)
2.75 D (150-499)
2.88 D (150-499)
2.88 D (150-499)
2.19 D (150-499)
0.57
0.56
0.59
0.73
2.53
2.27
2.41
2.67
Rel.
Mean Mean
0.61
0.50
0.28
0.41
0.72
0.63
0.88
0.50
0.63
0.56
0.66
0.53
0.75
0.84
0.78
0.56
S.-As. Rel. S.-As. Rel. S.-As. Rel. S.-As. Rel. S.-As. Rel. S.-As. Rel. S.-As. Rel. S.-As. Rel. S.-As. Rel. S.-As. Rel. S.-As. Rel. S.-As. Rel. S.-As.
Question 5
0.63 2.53 0.67 2.53 0.50 2.53 0.53 2.73 0.70 2.60 0.63 2.53 0.53 2.47 0.63 2.33 0.60 2.53 0.63 2.40 0.60 2.53 0.63 2.33
0
2 0.5
3
0
2
0
3
1
2
1
3
0
2 0.5
3 0.5
2 0.5
1
1
3
1
3
0.5
3
0
1 0.5
3 0.5
3 0.5
3 0.5
2
0
3
0
1
0
1 0.5
2 0.5
2 0.5
3
0.5
2 0.5
3
0
3 0.5
3 0.5
3 0.5
2 0.5
3 0.5
2
0
3 0.5
2 0.5
3 0.5
1
0
3
1
3 0.5
3
1
3
1
2 0.5
2 0.5
2
1
2 0.5
3
1
3 0.5
3
1
3
1
2 0.5
3 0.5
2
1
3 0.5
3 0.5
3 0.5
3
1
2
1
3 0.5
3 0.5
2
0
3
1
3
1
3 0.5
3
1
3
1
3
1
3
1
3
1
3 0.5
3 0.5
3
1
2 0.5
3
0
2 0.5
1 0.5
2
0
3 0.5
2 0.5
3
0
3 0.5
3
1
2
1
2
0
3 0.5
2
1
3 0.5
1 0.5
2 0.5
2
1
2 0.5
2
1
2
1
2
1
2
0
1
0
1
0
1
1
3 0.5
3
0
2 0.5
2
1
3
1
3
1
2 0.5
3 0.5
3 0.5
3 0.5
3 0.5
2
1
2
1
3 0.5
3 0.5
3 0.5
3 0.5
2 0.5
2
0
3
1
3
1
3
1
3 0.5
2
0.5
3 0.5
2 0.5
2 0.5
2 0.5
2 0.5
2 0.5
2 0.5
2 0.5
2 0.5
2 0.5
2
1
3
0.5
2 0.5
3 0.5
3
1
3
1
3
1
3 0.5
2 0.5
2
1
3 0.5
3 0.5
3 0.5
2
1
3
1
3
1
2 0.5
3
1
3 0.5
3
1
3
1
3
1
3
1
3 0.5
3
1
3
1
3
1
3
1
3 0.5
3 0.5
3 0.5
3 0.5
3
1
3 0.5
3
1
3
1
3
1
3
0.5
1
0
0
1
2
1
3
3
0
2
2 0.5
2 0.5
2 0.5
1
2 0.5
2
2
1
1
Rel.
Mean Mean
S.-As. Rel. S.-As. Rel. S.-As. Rel. S.-As. Rel. S.-As. Rel. S.-As. Rel. S.-As. Rel. S.-As. Rel. S.-As. Rel. S.-As. Rel. S.-As. Rel. S.-As. Rel. S.-As.
Question 5
Classification of the fifteen companies by number of employees
Appendices
81
Appendix Q
Question 2
2.93
3
3
2
3
3
3
3
3
3
3
3
3
3
3
3
Rel.
Question 3
0.80
1
0.5
1
0.5
1
0.5
1
0.5
1
0.5
1
1
0.5
1
1
S.-As. Rel. S.-As. Rel. S.-As.
Question 1
0.67 2.60 0.60 2.40
0.5
3 0.5
2
0
2
0
3
1
3 0.5
3
0.5
2 0.5
3
1
2 0.5
2
0.5
2 0.5
2
1
3
1
3
0.5
2 0.5
3
1
3
1
3
0.5
3 0.5
2
0.5
3
1
2
1
2
1
2
0.5
3 0.5
2
1
3 0.5
2
0.5
3 0.5
2
Rel.
Question 3
Questions 5-8
A (Neither innovations
0.50 of
2.25
products
0.13 nor
2.50
of processes)
0.63 2.50
B (Either innovations
0.50of 2.42
products
0.63or of
2.67
processes)
0.42 2.33
C (Innovations of 0.71
products
2.63and0.56
of processes)
2.54 0.63 2.58
D (Many innovations
0.65of 2.40
products
0.68and2.60
of processes)
0.75 2.45
Mean
0.59 2.42 0.50 2.58 0.60 2.47
Rel.
Questions 9-12
S.-As. Rel. S.-As. Rel. S.-As.
Questions 1-4
A (Neither innovations
0.50 of
3.00
products
0.50 nor
2.00
of processes)
1.00 3.00
B (Either innovations
0.50of 2.33
products
0.33or of
3.00
processes)
0.67 2.67
C (Innovations of 0.75
products
2.50and0.67
of processes)
2.50 0.75 3.00
D (Many innovations
0.70of 2.80
products
0.70and2.00
of processes)
0.90 3.00
Innovation
D
E
M
N
A
G
H
K
L
O
B
C
F
I
J
Mean
Question 2
S.-As. Rel. S.-As. Rel. S.-As.
Question 1
2.00
1
0
2
3
3
1
3
3
3
2
1
1
2
3
2
Rel.
1.00
1.67
2.50
1.80
Rel.
0.75
0.63
0.56
0.65
0.65
S.-As.
2.25
2.25
2.50
2.55
2.39
Rel.
Questions 13-16
0.00
0.50
0.67
0.30
S.-As.
Question 4
0.47
0
0
0.5
1
0.5
0
1
1
1
0.5
0
0
0
0.5
1
S.-As.
Question 4
Question 6
Question 7
Question 8
Question 9 Question 10 Question 11 Question 12 Question 13 Question 14 Question 15 Question 16
Question 6
Question 7
Question 8
Question 9 Question 10 Question 11 Question 12 Question 13 Question 14 Question 15 Question 16
0.00
0.67
0.58
0.80
2.00
2.67
2.33
2.80
0.50
0.67
0.58
0.80
0.00
0.83
0.42
0.50
2.00
3.00
2.50
2.40
0.00
0.33
0.67
0.60
3.00
2.67
2.83
2.60
1.00
0.33
0.67
0.90
2.00
2.67
2.67
2.60
1.00
0.50
0.67
0.60
3.00
2.33
2.67
2.40
0.00
0.33
0.50
0.80
A (Neither innovations of products nor of processes)
B (Either innovations of products or of processes)
C (Innovations of products and of processes)
D (Many innovations of products and of processes)
3.00
2.33
2.50
2.60
2.00
2.67
2.67
2.20
0.50
0.50
0.67
0.70
3.00
1.67
2.33
2.60
0.50
0.17
0.67
0.80
2.00
2.00
2.67
2.80
0.50
0.67
0.58
0.70
1.00
2.33
2.50
2.60
1.00
0.83
0.50
0.50
3.00
2.33
2.50
2.60
1.00
0.83
0.50
0.60
3.00
2.33
2.33
2.20
2.50 Innovation
2.38 A (Neither
2.19 B (Either
2.88 B (Either
2.19 B (Either
2.38 C (Innovations
2.38 C (Innovations
2.75 C (Innovations
2.69 C (Innovations
2.94 C (Innovations
2.25 C (Innovations
2.56 D (Many
1.81 D (Many
2.63 D (Many
2.88 D (Many
2.63 D (Many
0.50
0.54
0.61
0.68
2.38
2.42
2.56
2.50
Rel.
Mean Mean
0.61
0.50
0.28
0.78
0.56
0.50
0.41
0.75
0.63
0.88
0.53
0.66
0.63
0.56
0.84
0.72
S.-As. Rel. S.-As. Rel. S.-As. Rel. S.-As. Rel. S.-As. Rel. S.-As. Rel. S.-As. Rel. S.-As. Rel. S.-As. Rel. S.-As. Rel. S.-As. Rel. S.-As. Rel. S.-As.
Question 5
0.63 2.53 0.67 2.53 0.50 2.53 0.53 2.73 0.70 2.60 0.63 2.53 0.53 2.47 0.63 2.33 0.60 2.53 0.63 2.40 0.60 2.53 0.63 2.33
0
2 0.5
3
0
2
0
3
1
2
1
3
0
2 0.5
3 0.5
2 0.5
1
1
3
1
3
0.5
3
0
1 0.5
3 0.5
3 0.5
3 0.5
2
0
3
0
1
0
1 0.5
2 0.5
2 0.5
3
1
3
1
3
1
3 0.5
3 0.5
3 0.5
3 0.5
3
1
3 0.5
3
1
3
1
3
1
3
0.5
2
1
3
1
3
0
2
0
2 0.5
2 0.5
2 0.5
1
0
2 0.5
2
1
2
1
1
0
2 0.5
1 0.5
2
0
3 0.5
2 0.5
3
0
3 0.5
3
1
2
1
2
0
3 0.5
2
0.5
2 0.5
3
0
3 0.5
3 0.5
3 0.5
2 0.5
3 0.5
2
0
3 0.5
2 0.5
3 0.5
1
0.5
2 0.5
3 0.5
3
1
3
1
3
1
3 0.5
2 0.5
2
1
3 0.5
3 0.5
3 0.5
2
1
2 0.5
3 0.5
2
1
3 0.5
3 0.5
3 0.5
3
1
2
1
3 0.5
3 0.5
2
0
3
1
3
1
3 0.5
3
1
3
1
3
1
3
1
3
1
3 0.5
3 0.5
3
1
2 0.5
3
0.5
3 0.5
2 0.5
2 0.5
2 0.5
2 0.5
2 0.5
2 0.5
2 0.5
2 0.5
2 0.5
2
1
3
1
2
1
3 0.5
3 0.5
3 0.5
3 0.5
2 0.5
2
0
3
1
3
1
3
1
3 0.5
2
1
3 0.5
1 0.5
2 0.5
2
1
2 0.5
2
1
2
1
2
1
2
0
1
0
1
0
1
1
3 0.5
3
0
2 0.5
2
1
3
1
3
1
2 0.5
3 0.5
3 0.5
3 0.5
3 0.5
2
1
3
1
3
1
2 0.5
3
1
3 0.5
3
1
3
1
3
1
3
1
3 0.5
3
1
3
0
1
3
1
3 0.5
3
1
3
2 0.5
2 0.5
2
1
2 0.5
3
1
3 0.5
3
1
3
Rel.
Mean Mean
S.-As. Rel. S.-As. Rel. S.-As. Rel. S.-As. Rel. S.-As. Rel. S.-As. Rel. S.-As. Rel. S.-As. Rel. S.-As. Rel. S.-As. Rel. S.-As. Rel. S.-As. Rel. S.-As.
Question 5
Classification of the fifteen companies by innovativeness
Appendices
82
Appendix R
Question 2
Questions 5-8
A (No investments
0.50
into 2.42
P&D) 0.63 2.67
B (Sometimes investments
0.63 2.46into
0.42
P&D)2.58
D (5-10% of income
0.66
into2.38
P&D) 0.69 2.44
E (More than 10%0.81
of income
2.88 into
0.81P&D)
2.75
Mean
0.65 2.53 0.64 2.61
2.67
3.00
3.00
3.00
Rel.
0.42
0.65
0.66
0.81
0.63
2.33
2.50
2.38
2.88
2.52
Rel.
Questions 9-12
0.67
0.83
0.88
0.75
S.-As. Rel. S.-As. Rel. S.-As.
Questions 1-4
2.93
3
2
3
3
3
3
3
3
3
3
3
3
3
3
3
Question 3
0.80
0.5
1
0.5
1
0.5
1
1
0.5
1
1
1
0.5
1
0.5
1
Rel.
Question 3
S.-As. Rel. S.-As. Rel. S.-As.
Question 1
0.67 2.60 0.60 2.40
0
2
0
3
1
3 0.5
3
0.5
2 0.5
3
0.5
3 0.5
2
0.5
2 0.5
2
0.5
3 0.5
2
1
2 0.5
2
0.5
3 0.5
2
1
3
1
3
1
2
1
2
0.5
3
1
2
0.5
3 0.5
2
1
3 0.5
2
0.5
2 0.5
3
1
3
1
3
A (No investments
0.50
into 2.33
P&D) 0.33 3.00
B (Sometimes investments
0.67 2.67into
0.58
P&D)2.17
D (5-10% of income
0.75
into2.75
P&D) 0.75 2.00
E (More than 10%0.75
of income
2.50 into
0.75P&D)
3.00
P&D
E
M
N
D
G
J
A
F
H
C
B
O
I
K
L
Mean
Question 2
S.-As. Rel. S.-As. Rel. S.-As.
Question 1
2.00
0
2
3
1
1
2
3
2
3
1
1
2
3
3
3
Rel.
1.67
2.00
1.75
3.00
Rel.
0.63
0.60
0.66
0.56
0.61
S.-As.
2.25
2.54
2.31
2.75
2.46
Rel.
Questions 13-16
0.50
0.42
0.25
1.00
S.-As.
Question 4
0.47
0
0.5
1
0
0
1
0.5
0
1
0
0
0.5
0.5
1
1
S.-As.
Question 4
Question 6
Question 7
Question 8
Question 9 Question 10 Question 11 Question 12 Question 13 Question 14 Question 15 Question 16
Question 6
Question 7
Question 8
Question 9 Question 10 Question 11 Question 12 Question 13 Question 14 Question 15 Question 16
0.67
0.33
0.88
1.00
2.67
2.33
2.75
2.50
0.67
0.58
0.75
0.75
0.83
0.25
0.63
0.50
3.00
2.50
2.25
2.50
0.33
0.50
0.50
1.00
2.67
2.83
2.50
3.00
0.33
0.83
0.75
0.75
2.67
2.50
2.50
3.00
0.50
0.75
0.50
0.75
A (No investments into P&D)
B (Sometimes investments into P&D)
D (5-10% of income into P&D)
E (More than 10% of income into P&D)
2.33
2.67
2.25
3.00
2.33
2.67
2.25
3.00
0.33
0.42
0.75
0.75
2.67
2.33
2.25
3.00
0.50
0.58
0.63
1.00
1.67
2.50
2.50
2.50
0.17
0.58
0.88
0.75
2.00
2.67
2.50
3.00
0.67
0.67
0.63
0.50
2.33
2.33
2.25
3.00
0.83
0.50
0.50
0.75
2.33
3.00
2.25
2.00
0.83
0.67
0.63
0.25
2.33
2.17
2.25
3.00
2.50 P&D
2.19 A (No
2.88 A (No
2.19 A (No
2.38 B (Sometimes
2.38 B (Sometimes
2.63 B (Sometimes
2.38 B (Sometimes
2.63 B (Sometimes
2.75 B (Sometimes
1.81 D (5-10% of
2.56 D (5-10% of
2.25 D (5-10% of
2.88 D (5-10% of
2.69 E (More than
2.94 E (More than
0.54
0.57
0.66
0.75
2.42
2.52
2.38
2.81
Rel.
Mean Mean
0.61
0.28
0.78
0.56
0.50
0.41
0.72
0.50
0.56
0.75
0.63
0.66
0.53
0.84
0.63
0.88
S.-As. Rel. S.-As. Rel. S.-As. Rel. S.-As. Rel. S.-As. Rel. S.-As. Rel. S.-As. Rel. S.-As. Rel. S.-As. Rel. S.-As. Rel. S.-As. Rel. S.-As. Rel. S.-As.
Question 5
0.63 2.53 0.67 2.53 0.50 2.53 0.53 2.73 0.70 2.60 0.63 2.53 0.53 2.47 0.63 2.33 0.60 2.53 0.63 2.40 0.60 2.53 0.63 2.33
0.5
3
0
1 0.5
3 0.5
3 0.5
3 0.5
2
0
3
0
1
0
1 0.5
2 0.5
2 0.5
3
1
3
1
3
1
3 0.5
3 0.5
3 0.5
3 0.5
3
1
3 0.5
3
1
3
1
3
1
3
0.5
2
1
3
1
3
0
2
0
2 0.5
2 0.5
2 0.5
1
0
2 0.5
2
1
2
1
1
0
2 0.5
3
0
2
0
3
1
2
1
3
0
2 0.5
3 0.5
2 0.5
1
1
3
1
3
0.5
2 0.5
3
0
3 0.5
3 0.5
3 0.5
2 0.5
3 0.5
2
0
3 0.5
2 0.5
3 0.5
1
0
3
1
3 0.5
3
1
3
1
2 0.5
2 0.5
2
1
2 0.5
3
1
3 0.5
3
1
3
0
2 0.5
1 0.5
2
0
3 0.5
2 0.5
3
0
3 0.5
3
1
2
1
2
0
3 0.5
2
1
3 0.5
3
0
2 0.5
2
1
3
1
3
1
2 0.5
3 0.5
3 0.5
3 0.5
3 0.5
2
0.5
2 0.5
3 0.5
3
1
3
1
3
1
3 0.5
2 0.5
2
1
3 0.5
3 0.5
3 0.5
2
1
3 0.5
1 0.5
2 0.5
2
1
2 0.5
2
1
2
1
2
1
2
0
1
0
1
0
1
1
2
1
3 0.5
3 0.5
3 0.5
3 0.5
2 0.5
2
0
3
1
3
1
3
1
3 0.5
2
0.5
3 0.5
2 0.5
2 0.5
2 0.5
2 0.5
2 0.5
2 0.5
2 0.5
2 0.5
2 0.5
2
1
3
1
3
1
3
1
2 0.5
3
1
3 0.5
3
1
3
1
3
1
3
1
3 0.5
3
1
3
1
2 0.5
3 0.5
2
1
3 0.5
3 0.5
3 0.5
3
1
2
1
3 0.5
3 0.5
2
0
3
1
1
1
1
3
1
3 0.5
3
1
3
3
1
3
3
1
3 0.5
3 0.5
3
2 0.5
3
Rel.
Mean Mean
S.-As. Rel. S.-As. Rel. S.-As. Rel. S.-As. Rel. S.-As. Rel. S.-As. Rel. S.-As. Rel. S.-As. Rel. S.-As. Rel. S.-As. Rel. S.-As. Rel. S.-As. Rel. S.-As.
Question 5
Classification of the fifteen companies by investments in P&D
Appendices
83
Appendix S
A (< 3,9%)
B (4% - 9,9%)
C (10% - 19,9%)
D (> 20%)
Mean
A (< 3,9%)
B (4% - 9,9%)
C (10% - 19,9%)
D (> 20%)
Annual growth
A
L
F
M
N
C
D
E
G
H
B
I
J
K
O
Mean
Question 2
Question 2
2.50
2.67
2.40
2.80
2.50
2.67
2.40
2.20
Questions 5-8
0.75
0.50
0.60
0.60
0.88
0.58
0.55
0.65
0.66
2.75
2.58
2.25
2.55
2.53
0.56
0.67
0.43
0.70
0.59
2.50
2.67
2.50
2.65
2.58
3.00
2.67
3.00
3.00
Rel.
0.69
0.63
0.60
0.63
0.63
2.88
2.50
2.35
2.45
2.54
Rel.
Questions 9-12
1.00
0.67
0.80
0.80
S.-As. Rel. S.-As. Rel. S.-As.
Questions 1-4
1.00
0.67
0.60
0.60
2.93
3
3
3
2
3
3
3
3
3
3
3
3
3
3
3
Question 3
0.80
1
1
0.5
1
0.5
1
1
0.5
0.5
1
1
1
1
0.5
0.5
S.-As. Rel. S.-As. Rel. S.-As.
Question 1
0.67 2.60 0.60 2.40
1
2 0.5
2
1
3
1
3
0.5
3 0.5
2
1
3 0.5
3
0.5
2 0.5
3
1
2
1
2
0.5
3 0.5
2
0
2
0
3
0.5
2 0.5
2
1
3
1
3
0.5
3
1
2
1
3 0.5
2
0.5
3 0.5
2
0.5
2 0.5
3
0.5
3 0.5
2
Rel.
Question 3
S.-As. Rel. S.-As. Rel. S.-As.
Question 1
2.00
3
3
2
2
3
1
1
0
1
3
1
3
2
3
2
Rel.
3.00
2.33
1.20
2.20
Rel.
0.63
0.67
0.48
0.73
0.62
S.-As.
2.50
2.50
2.10
2.75
2.46
Rel.
Questions 13-16
0.75
0.50
0.20
0.60
S.-As.
Question 4
0.47
0.5
1
0
0.5
1
0
0
0
0
1
0
0.5
1
1
0.5
S.-As.
Question 4
Question 6
Question 7
Question 8
Question 9 Question 10 Question 11 Question 12 Question 13 Question 14 Question 15 Question 16
Question 6
Question 7
Question 8
Question 9 Question 10 Question 11 Question 12 Question 13 Question 14 Question 15 Question 16
0.50
0.83
0.50
0.70
2.50
2.67
2.40
2.60
0.75
0.83
0.40
0.80
2.00
3.00
2.20
2.80
0.50
0.67
0.30
0.60
2.50
2.67
2.60
2.40
0.50
0.33
0.50
0.70
3.00
2.33
2.80
2.80
0.75
0.50
0.80
0.70
2.50
2.67
2.60
2.60
0.75
0.67
0.70
0.50
3.00
2.67
2.40
2.40
0.50
0.67
0.40
0.60
3.00
2.33
2.40
2.40
0.75
0.67
0.50
0.70
3.00
2.33
2.00
2.40
0.75
0.33
0.50
0.80
2.50
2.67
2.20
2.80
0.75
0.67
0.40
0.80
2.50
2.67
1.80
2.80
0.50
0.83
0.50
0.60
2.50
2.67
2.40
2.60
0.50
0.83
0.50
0.70
2.50
2.00
2.00
2.80
2.50 Annual growth
2.38 A (< 3,9%)
2.94 A (< 3,9%)
2.63 B (4% - 9,9%)
2.88 B (4% - 9,9%)
2.19 B (4% - 9,9%)
1.81 C (10% - 19,9%)
2.38 C (10% - 19,9%)
2.19 C (10% - 19,9%)
2.38 C (10% - 19,9%)
2.75 C (10% - 19,9%)
2.56 D (> 20%)
2.88 D (> 20%)
2.63 D (> 20%)
2.69 D (> 20%)
2.25 D (> 20%)
0.69
0.64
0.51
0.68
2.66
2.56
2.30
2.60
Rel.
Mean Mean
0.61
0.50
0.88
0.56
0.78
0.56
0.63
0.50
0.28
0.41
0.75
0.66
0.84
0.72
0.63
0.53
S.-As. Rel. S.-As. Rel. S.-As. Rel. S.-As. Rel. S.-As. Rel. S.-As. Rel. S.-As. Rel. S.-As. Rel. S.-As. Rel. S.-As. Rel. S.-As. Rel. S.-As. Rel. S.-As.
Question 5
0.63 2.53 0.67 2.53 0.50 2.53 0.53 2.73 0.70 2.60 0.63 2.53 0.53 2.47 0.63 2.33 0.60 2.53 0.63 2.40 0.60 2.53 0.63 2.33
0
2 0.5
1 0.5
2
0
3 0.5
2 0.5
3
0
3 0.5
3
1
2
1
2
0
3 0.5
2
1
3
1
3 0.5
3
1
3
1
3
1
3
1
3
1
3 0.5
3 0.5
3
1
2 0.5
3
1
3 0.5
3
0
2 0.5
2
1
3
1
3
1
2 0.5
3 0.5
3 0.5
3 0.5
3 0.5
2
1
3
1
3
1
3 0.5
3 0.5
3 0.5
3 0.5
3
1
3 0.5
3
1
3
1
3
1
3
0.5
2
1
3
1
3
0
2
0
2 0.5
2 0.5
2 0.5
1
0
2 0.5
2
1
2
1
1
1
3 0.5
1 0.5
2 0.5
2
1
2 0.5
2
1
2
1
2
1
2
0
1
0
1
0
1
0
2 0.5
3
0
2
0
3
1
2
1
3
0
2 0.5
3 0.5
2 0.5
1
1
3
1
3
0.5
3
0
1 0.5
3 0.5
3 0.5
3 0.5
2
0
3
0
1
0
1 0.5
2 0.5
2 0.5
3
0.5
2 0.5
3
0
3 0.5
3 0.5
3 0.5
2 0.5
3 0.5
2
0
3 0.5
2 0.5
3 0.5
1
0.5
2 0.5
3 0.5
3
1
3
1
3
1
3 0.5
2 0.5
2
1
3 0.5
3 0.5
3 0.5
2
1
2
1
3 0.5
3 0.5
3 0.5
3 0.5
2 0.5
2
0
3
1
3
1
3
1
3 0.5
2
1
3
1
3
1
2 0.5
3
1
3 0.5
3
1
3
1
3
1
3
1
3 0.5
3
1
3
0
3
1
3 0.5
3
1
3
1
2 0.5
2 0.5
2
1
2 0.5
3
1
3 0.5
3
1
3
1
2 0.5
3 0.5
2
1
3 0.5
3 0.5
3 0.5
3
1
2
1
3 0.5
3 0.5
2
0
3
0.5
3 0.5
2 0.5
2 0.5
2 0.5
2 0.5
2 0.5
2 0.5
2 0.5
2 0.5
2 0.5
2
1
3
Rel.
Mean Mean
S.-As. Rel. S.-As. Rel. S.-As. Rel. S.-As. Rel. S.-As. Rel. S.-As. Rel. S.-As. Rel. S.-As. Rel. S.-As. Rel. S.-As. Rel. S.-As. Rel. S.-As. Rel. S.-As.
Question 5
Classification of the fifteen companies by annual growth
Appendices
84
Appendix T
A (< 3,9%)
B (4% - 9,9%)
C (10% - 19,9%)
D (> 20%)
Mean
A (< 3,9%)
B (4% - 9,9%)
C (10% - 19,9%)
D (> 20%)
Annual growth
A
F
M
N
C
D
E
G
H
B
I
O
Mean
Question 2
Question 2
2.00
2.67
2.40
3.00
2.00
2.67
2.40
2.00
Questions 5-8
0.50
0.50
0.60
0.67
0.75
0.58
0.55
0.63
0.63
2.50
2.58
2.25
2.50
2.46
0.25
0.67
0.43
0.71
0.51
2.00
2.67
2.50
2.58
2.44
3.00
2.67
3.00
3.00
Rel.
0.38
0.63
0.60
0.58
0.55
2.75
2.50
2.35
2.50
2.53
Rel.
Questions 9-12
1.00
0.67
0.80
0.83
S.-As. Rel. S.-As. Rel. S.-As.
Questions 1-4
1.00
0.67
0.60
0.67
2.92
3
3
2
3
3
3
3
3
3
3
3
3
Question 3
0.79
1
0.5
1
0.5
1
1
0.5
0.5
1
1
1
0.5
S.-As. Rel. S.-As. Rel. S.-As.
Question 1
0.67 2.58 0.58 2.33
1
2 0.5
2
0.5
3 0.5
2
1
3 0.5
3
0.5
2 0.5
3
1
2
1
2
0.5
3 0.5
2
0
2
0
3
0.5
2 0.5
2
1
3
1
3
0.5
3
1
2
1
3 0.5
2
0.5
3 0.5
2
Rel.
Question 3
S.-As. Rel. S.-As. Rel. S.-As.
Question 1
1.83
3
2
2
3
1
1
0
1
3
1
3
2
Rel.
3.00
2.33
1.20
2.00
Rel.
0.63
0.67
0.48
0.79
0.64
S.-As.
2.25
2.50
2.10
2.67
2.38
Rel.
Questions 13-16
0.50
0.50
0.20
0.33
S.-As.
Question 4
0.33
0.5
0
0.5
1
0
0
0
0
1
0
0.5
0.5
S.-As.
Question 4
Question 6
Question 7
Question 8
Question 9 Question 10 Question 11 Question 12 Question 13 Question 14 Question 15 Question 16
Question 6
Question 7
Question 8
Question 9 Question 10 Question 11 Question 12 Question 13 Question 14 Question 15 Question 16
0.00
0.83
0.50
0.83
2.00
2.67
2.40
2.67
0.50
0.83
0.40
0.83
1.00
3.00
2.20
2.67
0.50
0.67
0.30
0.67
2.00
2.67
2.60
2.33
0.00
0.33
0.50
0.50
3.00
2.33
2.80
2.67
0.50
0.50
0.80
0.67
2.00
2.67
2.60
2.67
0.50
0.67
0.70
0.50
3.00
2.67
2.40
2.33
0.00
0.67
0.40
0.67
3.00
2.33
2.40
2.33
0.50
0.67
0.50
0.50
3.00
2.33
2.00
2.67
1.00
0.33
0.50
0.83
2.00
2.67
2.20
2.67
1.00
0.67
0.40
0.83
2.00
2.67
1.80
2.67
0.00
0.83
0.50
0.67
3.00
2.67
2.40
2.67
0.50
0.83
0.50
0.83
2.00
2.00
2.00
2.67
2.44 Annual growth
2.38 A (< 3,9%)
2.63 B (4% - 9,9%)
2.88 B (4% - 9,9%)
2.19 B (4% - 9,9%)
1.81 C (10% - 19,9%)
2.38 C (10% - 19,9%)
2.19 C (10% - 19,9%)
2.38 C (10% - 19,9%)
2.75 C (10% - 19,9%)
2.56 D (> 20%)
2.88 D (> 20%)
2.25 D (> 20%)
0.50
0.64
0.51
0.68
2.38
2.56
2.30
2.56
Rel.
Mean Mean
0.58
0.50
0.56
0.78
0.56
0.63
0.50
0.28
0.41
0.75
0.66
0.84
0.53
S.-As. Rel. S.-As. Rel. S.-As. Rel. S.-As. Rel. S.-As. Rel. S.-As. Rel. S.-As. Rel. S.-As. Rel. S.-As. Rel. S.-As. Rel. S.-As. Rel. S.-As. Rel. S.-As.
Question 5
0.63 2.50 0.63 2.42 0.50 2.50 0.42 2.67 0.67 2.58 0.63 2.50 0.50 2.42 0.54 2.33 0.58 2.42 0.63 2.25 0.58 2.58 0.67 2.17
0
2 0.5
1 0.5
2
0
3 0.5
2 0.5
3
0
3 0.5
3
1
2
1
2
0
3 0.5
2
1
3 0.5
3
0
2 0.5
2
1
3
1
3
1
2 0.5
3 0.5
3 0.5
3 0.5
3 0.5
2
1
3
1
3
1
3 0.5
3 0.5
3 0.5
3 0.5
3
1
3 0.5
3
1
3
1
3
1
3
0.5
2
1
3
1
3
0
2
0
2 0.5
2 0.5
2 0.5
1
0
2 0.5
2
1
2
1
1
1
3 0.5
1 0.5
2 0.5
2
1
2 0.5
2
1
2
1
2
1
2
0
1
0
1
0
1
0
2 0.5
3
0
2
0
3
1
2
1
3
0
2 0.5
3 0.5
2 0.5
1
1
3
1
3
0.5
3
0
1 0.5
3 0.5
3 0.5
3 0.5
2
0
3
0
1
0
1 0.5
2 0.5
2 0.5
3
0.5
2 0.5
3
0
3 0.5
3 0.5
3 0.5
2 0.5
3 0.5
2
0
3 0.5
2 0.5
3 0.5
1
0.5
2 0.5
3 0.5
3
1
3
1
3
1
3 0.5
2 0.5
2
1
3 0.5
3 0.5
3 0.5
2
1
2
1
3 0.5
3 0.5
3 0.5
3 0.5
2 0.5
2
0
3
1
3
1
3
1
3 0.5
2
1
3
1
3
1
2 0.5
3
1
3 0.5
3
1
3
1
3
1
3
1
3 0.5
3
1
3
0.5
3 0.5
2 0.5
2 0.5
2 0.5
2 0.5
2 0.5
2 0.5
2 0.5
2 0.5
2 0.5
2
1
3
Rel.
Mean Mean
S.-As. Rel. S.-As. Rel. S.-As. Rel. S.-As. Rel. S.-As. Rel. S.-As. Rel. S.-As. Rel. S.-As. Rel. S.-As. Rel. S.-As. Rel. S.-As. Rel. S.-As. Rel. S.-As.
Question 5
Classification of the fifteen companies by annual growth (w/o the three companies of ACATE)
Appendices
85
Appendix U
Appendices
Appendix V
86
Appendices
87
Appendices
88
Appendices
89
Appendices
90
Appendices
91
Appendices
92
Appendices
93
Appendices
94
Appendices
95
Appendices
96
Appendices
97
Appendices
98
References
99
References
ACATE (2011): A ACATE. Available from:
http://www.acate.com.br/index.asp?dep=15 [10 October 2011].
Chatfield, CS & Johnson, TD (2004): Microsoft Office Project 2003, Microsoft
Press, Redmond, WA.
Deloitte, TT (2008): As Pequenas e Médias Empresas que Mais Crescem no
Brasil. Uma pesquisa sobre as rotas e estratégias que levam à expansão dos
negócios, São Paulo.
Deloitte, TT (2009): Eficiência nos novos tempos da economia. Um estudo sobre
as pequenas e médias empresas que mais crescem no Brasil e médias empresa
crescem no Brasil, São Paulo.
Deloitte, TT (2010): As PMEs que mais crescem no Brasil. Um estudo sobre as
empresas que cultivam as bases da sua expansão, São Paulo.
Dinsmore, PC & Cooke-Davies, T (2006): Right projects done right! From
business strategy to successful project implementation, Jossey-Bass, San
Francisco.
FIESC (2011): Conheça o Sistema FIESC. Available from:
http://www.fiescnet.com.br/ [10 October 2010].
Häner, C (2011): SMEs in turbulent times. A comparative analysis between
Argentina, Brazil and European Countries. Master-Thesis, Wiesbaden.
Hardwig, T, Bergstermann, M & North, K (2011): Wachstum lernen. Eine
praxiserprobte Handlungsanleitung zur Entwicklung dynamischer Fähigkeiten in
KMU ; mit vielen Fallbeispielen, Gabler, Wiesbaden.
Helfat, CE (2007): Dynamic capabilities. Understanding strategic change in
organizations, Blackwell Pub., Malden, MA.
Nokes, S (2007): The definitive guide to project management, Financial Times.
O'Reilly, CA & Pfeffer, J (2000): Hidden value. How great companies achieve
extraordinary results with ordinary people, Harvard Business School Press,
Boston, Mass.
Porter, ME (1979): How competitive forces shape strategy, Harvard Business
School Press, Boston, Mass.
Reeves, R (1961): Reality in advertising, Knopf, New York.
SEBRAE (2011a): Como Trabalhamos. Available from:
http://www.sebrae.com.br/customizado/sebrae/institucional/comotrabalhamos/como-trabalhamos [10 October 2011].
SEBRAE (2011b): Sensor MPE. Índice de competitvidade das Micro e pequenas
empresas CATARINENSES, Florianópolis.
References
100
Teece, DJ (2007): 'Explicating dynamic capabilities: the nature and
microfoundations of (sustainable) enterprise performance', Strategic Management
Journal, vol. 28, no. 13, pp. 1319–1350.
Teece, DJ, Pisano, G & Shuen, A (1997): 'Dynamic capabilities and strategic
management', Strategic Management Journal, 18:7, pp. 509–533.
101
Versicherung
Versicherung
Hiermit versichere ich, dass ich die vorliegende Arbeit selbständig und ohne Benutzung
anderer als der angegebenen Hilfsmittel angefertigt habe. Alle Stellen, die wörtlich oder
sinngemäß aus veröffentlichten und nicht veröffentlichten Quellen entnommen sind oder
auf Mitteilungen beruhen, sind als solche kenntlich gemacht.
Die Arbeit hat in gleicher oder ähnlicher Form noch keiner anderen Prüfungsbehörde
vorgelegen.
Wiesbaden, den 15. Oktober 2011
_________________________________
André Francisco Wolf
Download